Smartwatches for Sport Applications
Overview
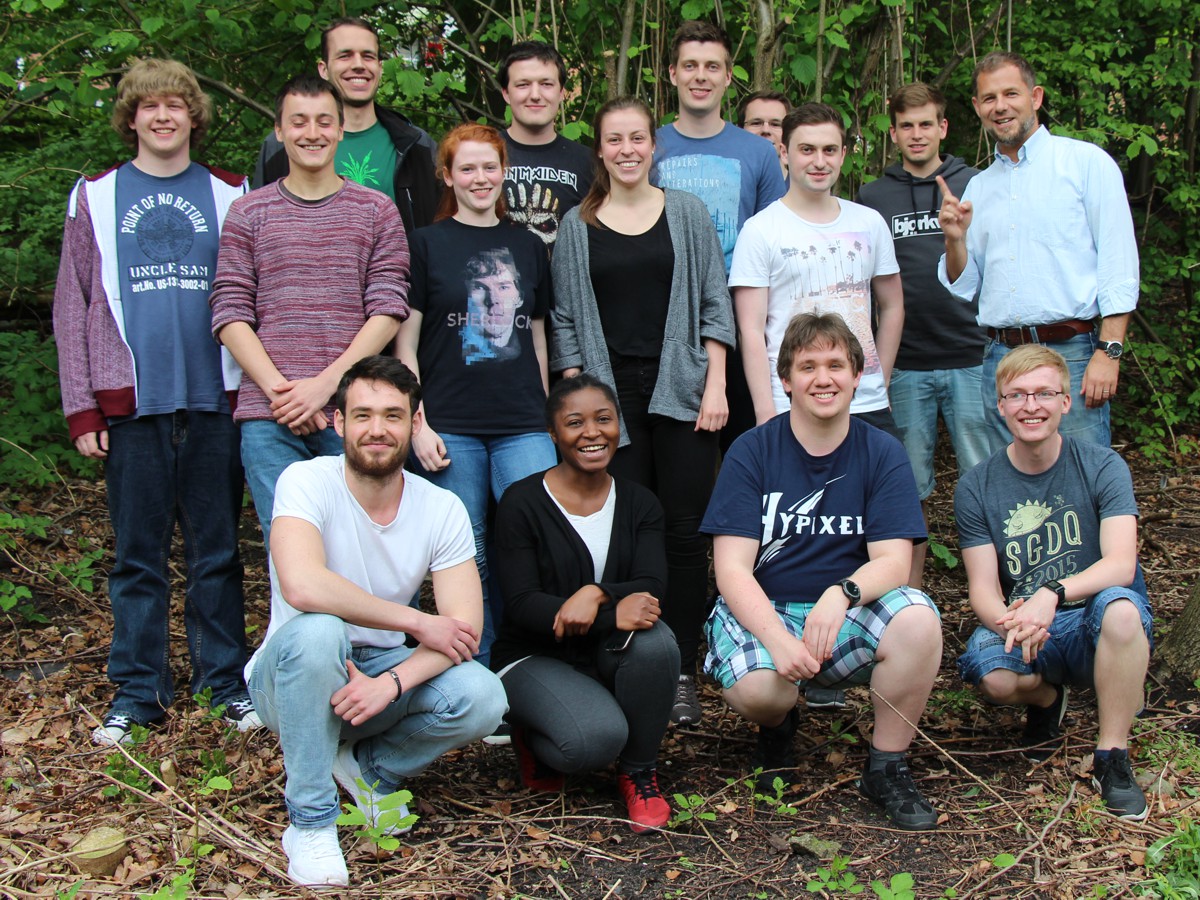
In this project we - a group of 13 students (electrical engineering) - investigate the usage of so-called smartwatches for sport applications. Our general goal is to get accurate motion information out of the data we can collect through smartwatches. Most smartwatches these days have all kinds of sensors, but especially interesting for our motion analysis are the gyroscopes and accelerometers. With this data we hope to capture how you move and then for example recall what you did or how well you’ve been doing. Every sport needs a different approach, so we’ve split up in teams to optimise what we know best and bring all of our knowledge into the analysis.
Participating Students
- Alexander Weber
- Dawyd Klimaschewski
- Ruben Fiedler
- Julian Jebe
- Johannes Hoffmann
- Daniel Beus
- Fabian Bauer
- Jannek Winter
- Tim Rocholl
- Michelle Djomo Njamen
- Solveig Baschin
- Kristina Apelt
- Michel Boldt
Supervisors
- Marco Gimm
- Bastian Kaulen
- Gerhard Schmidt
{tab-main Signal Analysis}
Signal Analysis
 In this group, the aim is the visualization and signal analysis of recorded data with the help of MATLAB. A graphical user interface (GUI) is created in which the user can select various settings to quickly analyze measured values as flexible as possible.
Due to the fact that the sensors do not provide a constant sample rate, but irregularly measure with exact timestamps, the data has to be interpolated in order to enable sensible processing. With help of the GUI, different types of interpolation are compared.
The recorded data of each sensor is displayed as preview. Then the user may choose which sensors he requires. These are shown in detail in a new window. To evaluate the quality of the measurement the deviation from the mean sample rate is displayed over time. For another point of view, a spectrogram is provided. This might help to recognize characteristics for the pattern detection or other useful insights.
Team members
- Daniel Beus
- Ruben Fiedler
{tab-main title="Swimming" open="true"}
Swimming
 In this part of the project we examined swimming sport by using the sensors of the smartwatch. In the framework of this project the goal was to find a method to discriminate between the four official swimming styles defined by FINA (abbreviates Fédération Internationale de Natation):
- breaststroke,
- front crawl,
- backstroke, and
- butterfly.
At first we collected data to create a database for the four types of swimming styles. Therefore, we recorded data of different swimmers as well as different distances using the smartwatch to get a detailed background of information. By analysing the video of the vector movement of the acceleration we noticed some characteristic pattern. Based on these pattern we chose the acceleration for the comparison.
To have more information we additionally used the information about the rotation because it also differed much in the style and has repetitive values compared to the remaining sensor records. To use the records in the following steps the files were cut to get the relevant data without the running idle at start and end. Afterwards the variances of the three dimensional vectors of the acceleration and rotation were calculated to have the possibility of comparing them with other records. 60 percent of the record sets were used to serve as a reference in the program by determine the averages of the variances.
Using MATLAB we created a program according to the principle of codebook which uses the vector consisting of the averaged variances of rotation and acceleration as a reference for every swimming style. With these references we tried to analyse the swimming stroke of another recording by comparing its values of acceleration and rotation. By calculating the norm of each reference with the vector of data which should be examined we got comparative values. The program selected that swimming style, which norm had the smallest value and, thus, the highest accordance.
Testing the program with the remaining 40% of the records showed that it selects always the right swimming style, except for backstroke. Because of the similarity in the variances to front crawl the algorithm is not capable to determine the right decision, which was expected due to the alikeness of the two swimming styles. To solve this issue, other features had to be considered in future research.
Team members
- Solveig Baschin
- Kristina Apelt
- Michelle Djomo Njamen
- Michel Boldt
Example Measurements
{tab-swimming Rotation and Acceleration}
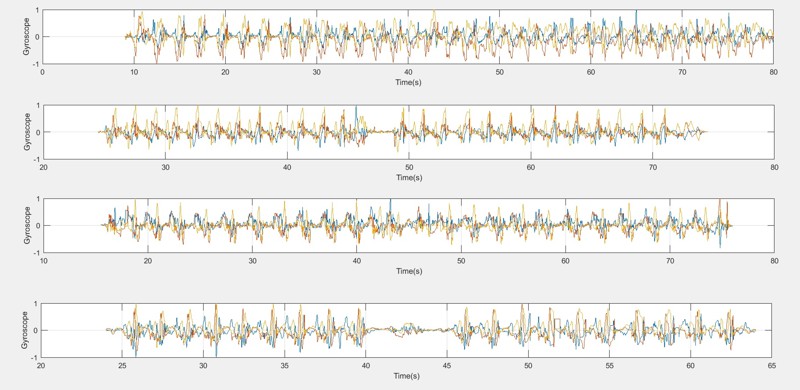 |
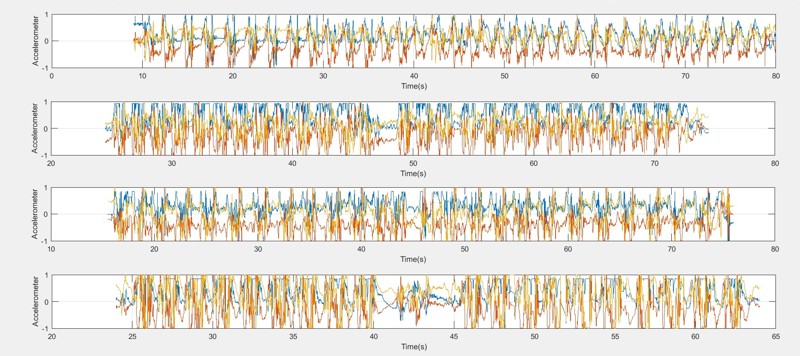
The run of the rotation (gyroscope) and acceleration for a 50 meter distance:
|
|
|---|---|---|
 |
{tab-swimming title="Comparison" open="true"}
Animation of the specific movement pattern of the swimming styles over time.
{tab-swimming Analysis of the Variance}
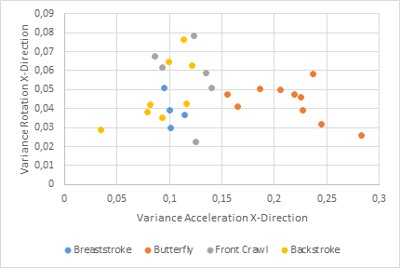 |
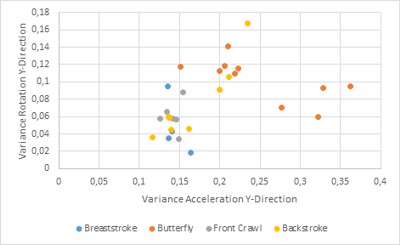
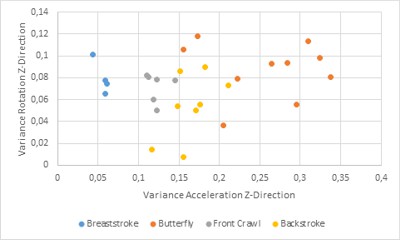
The distribution of the variances subject to the rotation and acceleration for the x-,y-, and z- direction. | |
|---|---|---|
 |
||
 |
{/tabs-swimming}
{tab-main Nine-pin Bowling}
Nine-pin Bowling
|
|
|---|
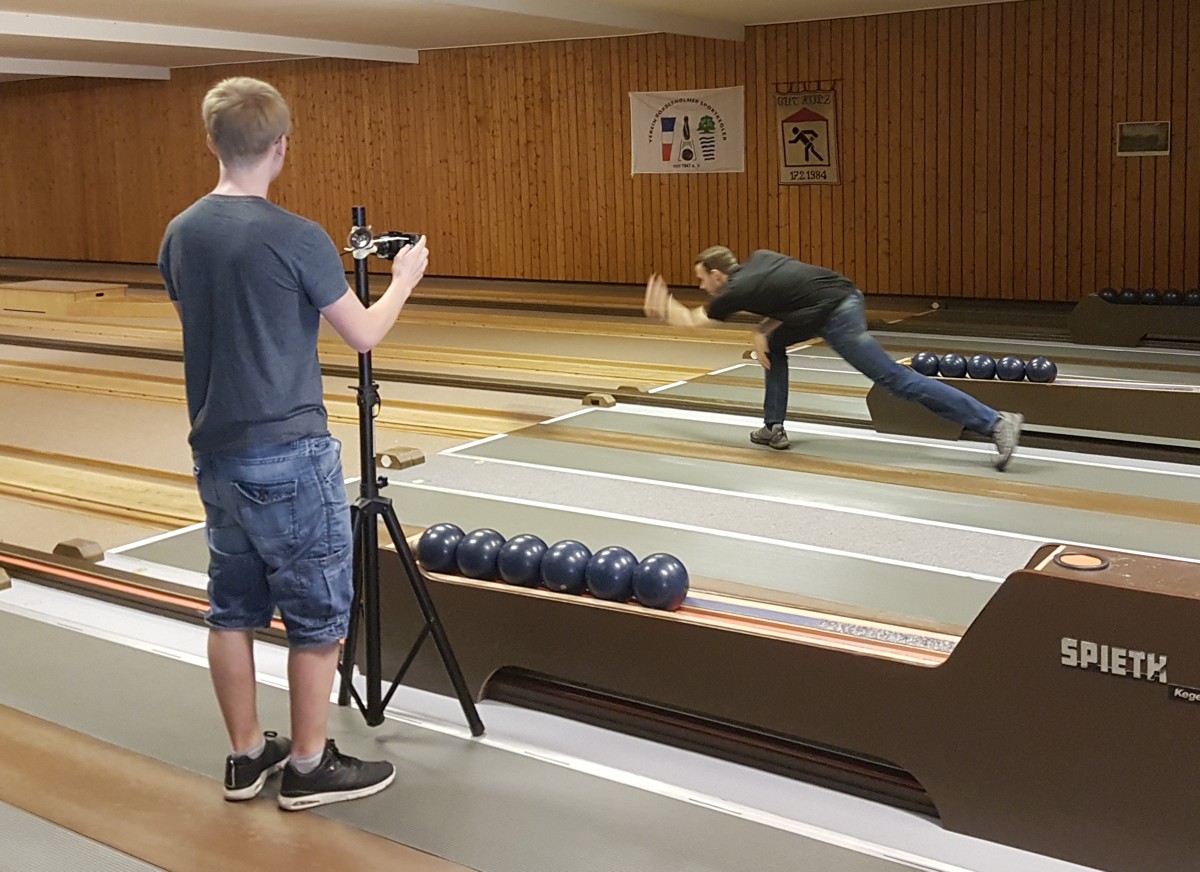 |
Nine-pin bowling is a high-precision sport. The player tries to roll a ball with a controlled throw down a concave allay to hopefully hit the nine pins at the end.
The biggest difficulty at Nine-pin bowling is to get each throw straight and accurately down the alley. Positioning and force applied to the ball have a big impact on the result. It is a huge problem for most players to throw with a "straight hand". A throw with a "straight hand" results in the ball beeing neither pushed to the side nor twisted around its vertical axis, therefore going down the allay in a desired fashion.
The idea:
The smartwatch will be used as a measurement unit to get movement data of the tossing hand. The watch should be used as training support and display hints to the wearer in order to get better at tossing.
Who is going to need it?
Our target group are professional players and members of sports clubs to enhance their training. The casual player, however, wouldn’t benefit much of this device.
Planning:
The first step is to aqire and document some data to process. After that Matlab is used to inspect and evaluate the measurements. In the end Matlab should be able to give feedback on the hand movement in six axis (three translations and three rotations).
Evaluating data:
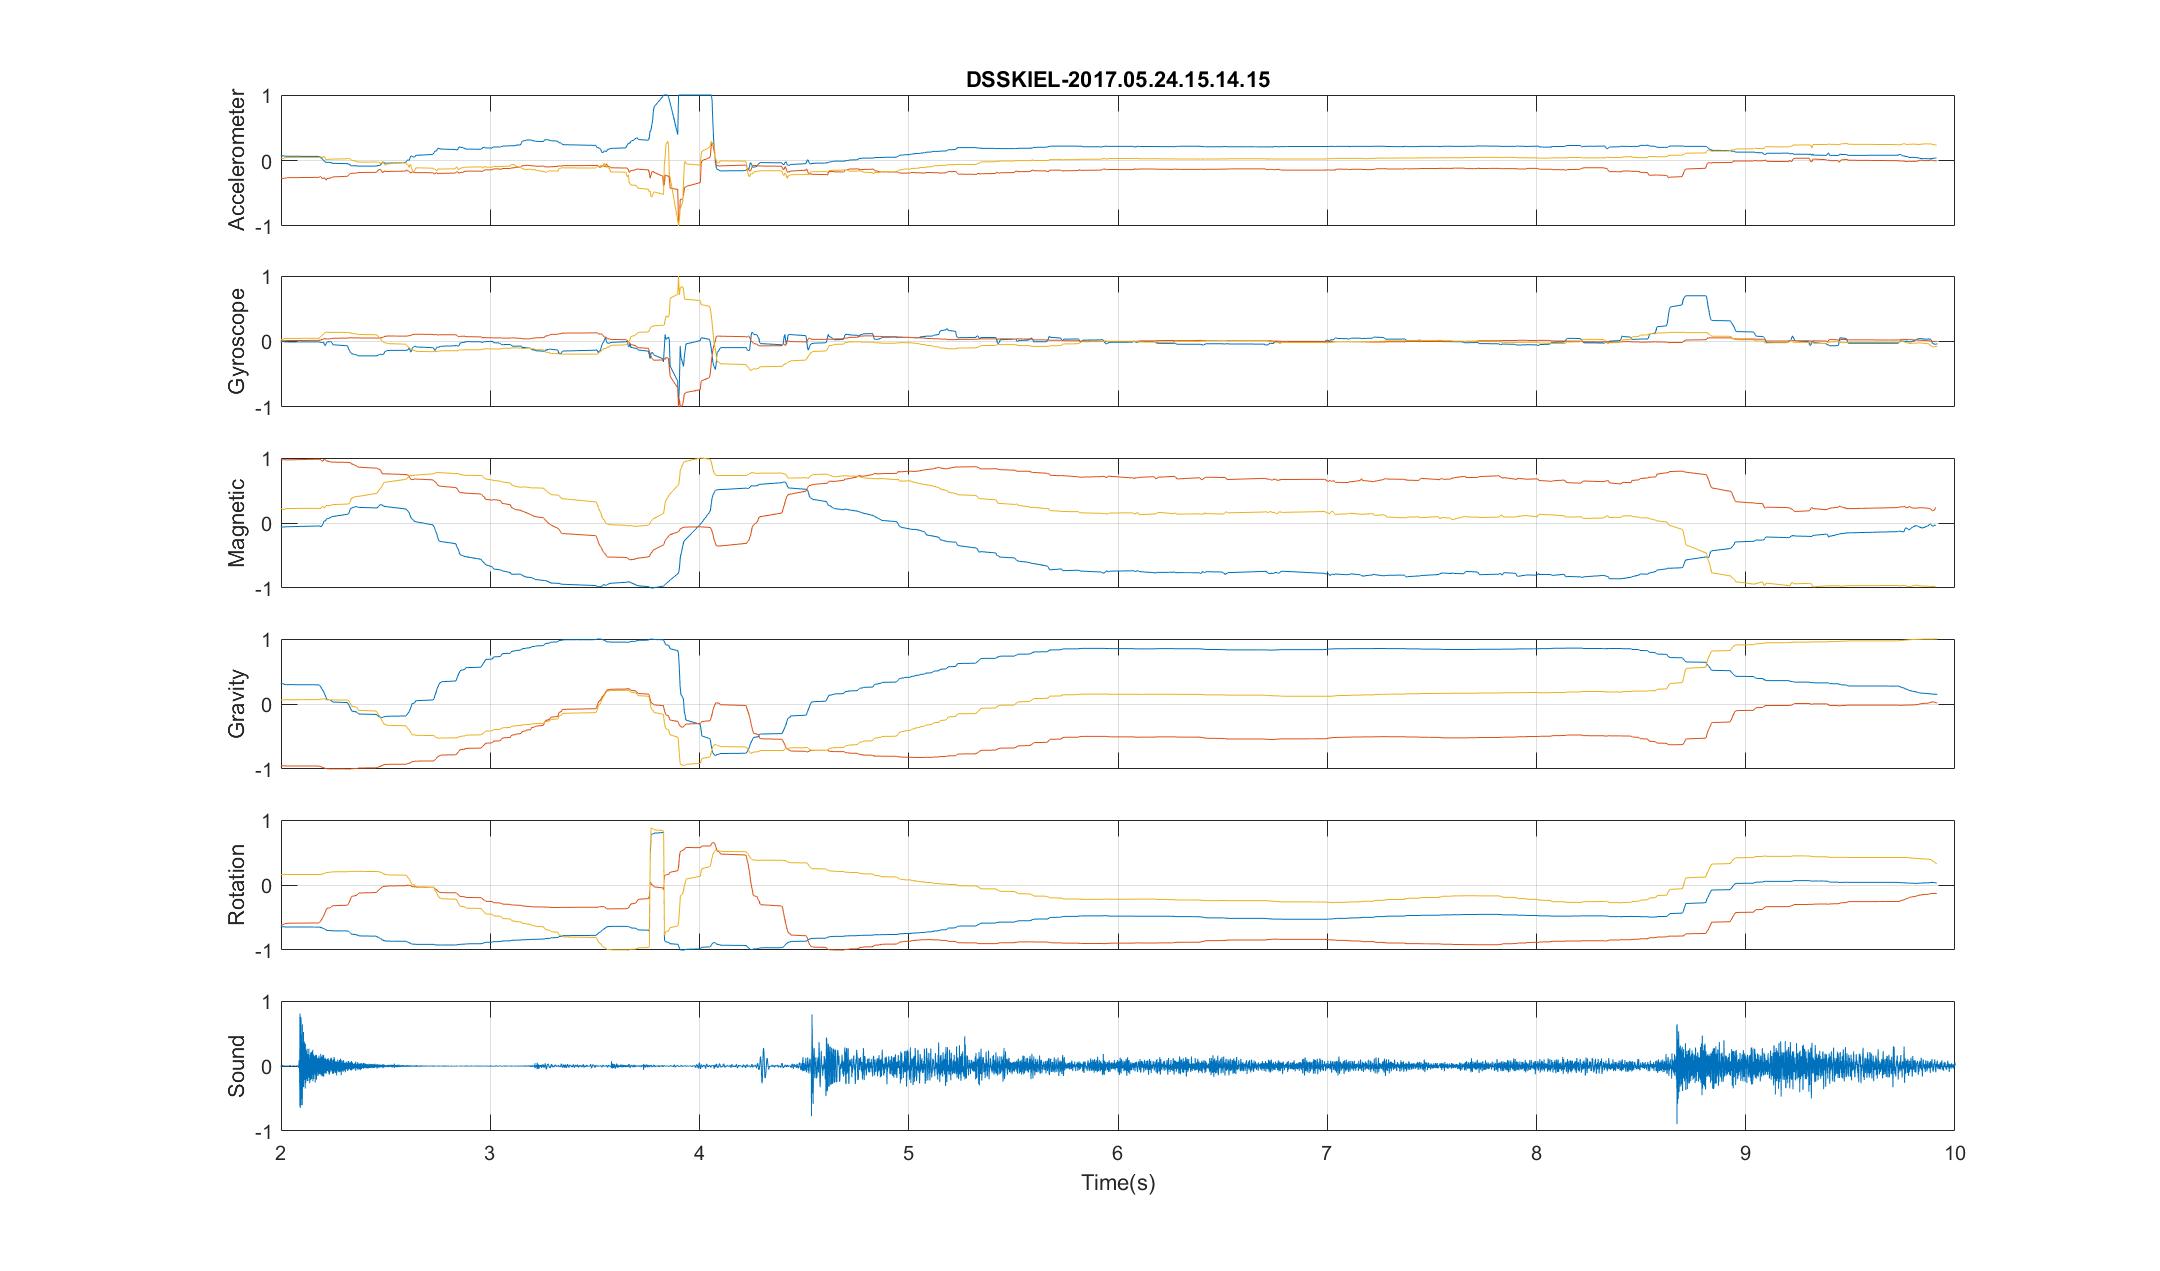
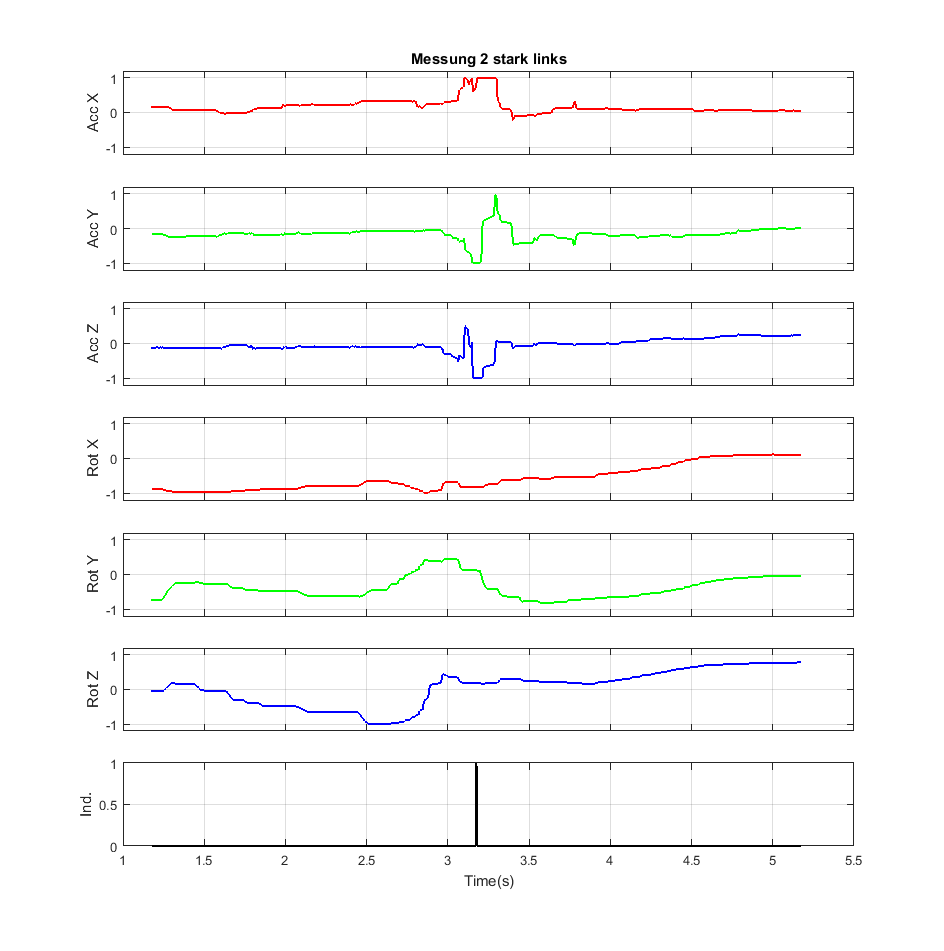
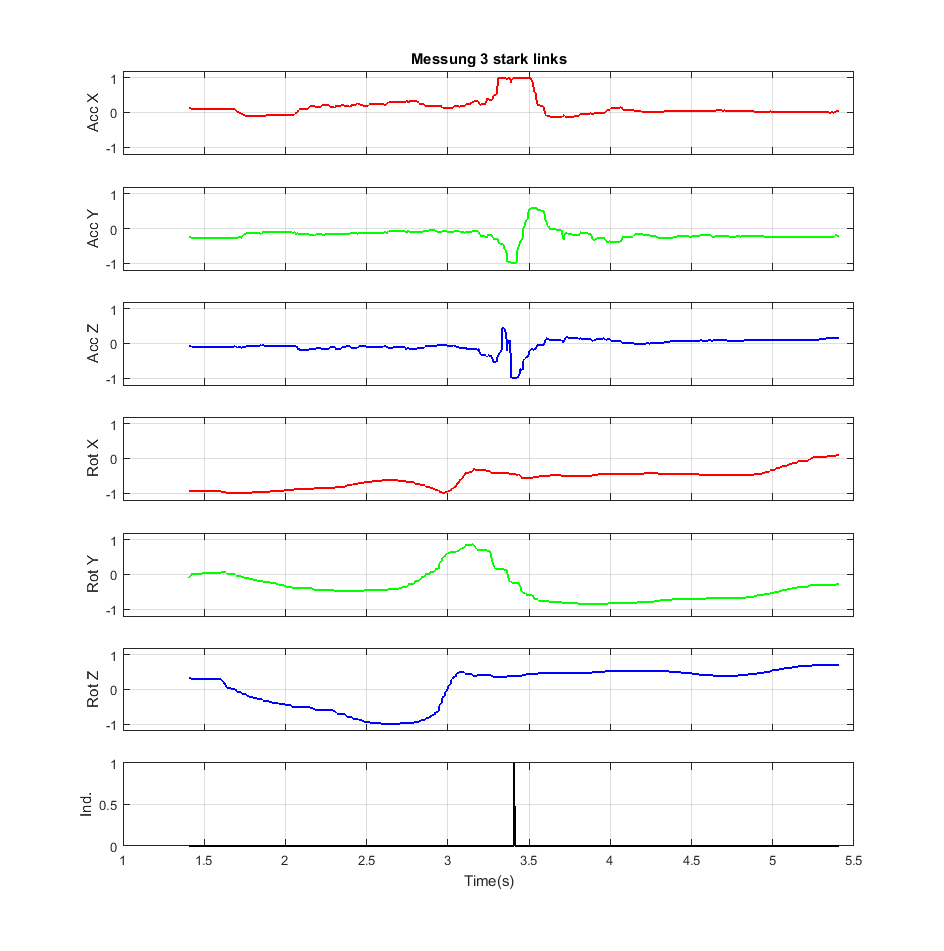
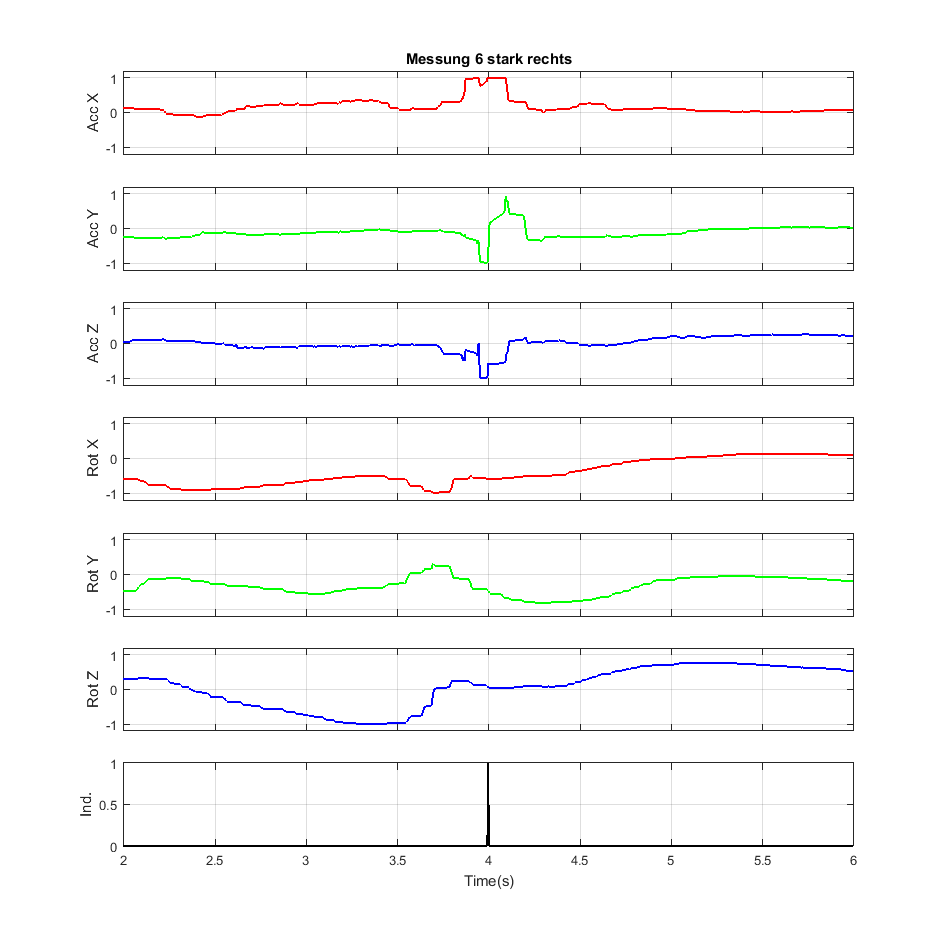
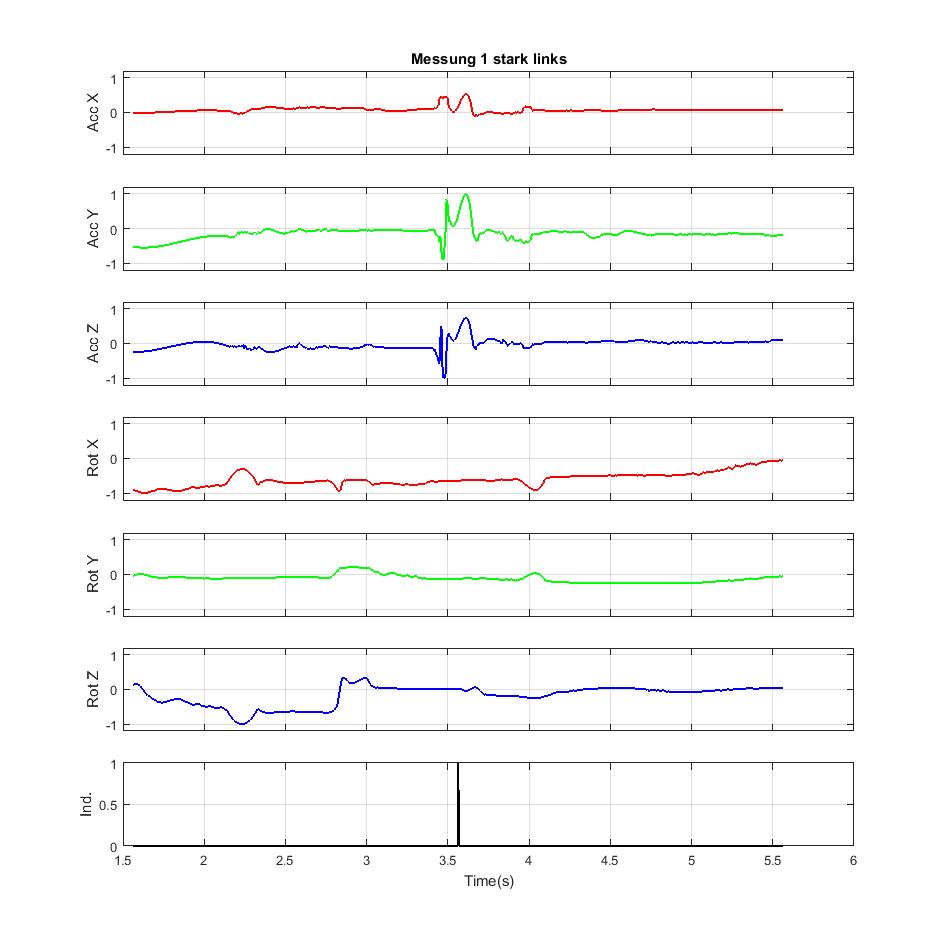
After first inspecting the measured data, we figured starting with a recognition system for the moment a “throw” happened could give us a more automated way to analyse the data. After successfully implementing this through looking at maximum absolute acceleration and getting 0% failure rate with detection, we started to look further into the critical time interval of our data.
Problems with measurements:
But looking closer at our data, we observed that the variance of our measurements seems way higher than the impact of a player throwing the ball to the right or to the left. Further inspection of the data without interpolation lead to the conclusion, that our data is heavily distorted by “measurement leaks” of the watch. Not only is the sensor probably not accurate enough for what we wanted to achieve, it also at times only gives a tenth of the measurement points we need and isn’t even consistent at delivering those.
Final verdict:
We are sure it is possible to get to our goal with more accurate hardware, but a smartwatch, at least one off the shelf, cannot perform on the level we need it to. Basic things like judging when a “throw” happens is no problem thanks to the high contrast to other near data points, but anything more delicate gets way harder to measure with our encountered sensor flaws.
Team members
- Tim Rocholl
- Jannek Winter
- Fabian Bauer
- Julian Jebe
Example Measurements
{tab-bowling First measurments}
{tab-bowling Comparison left versus right}
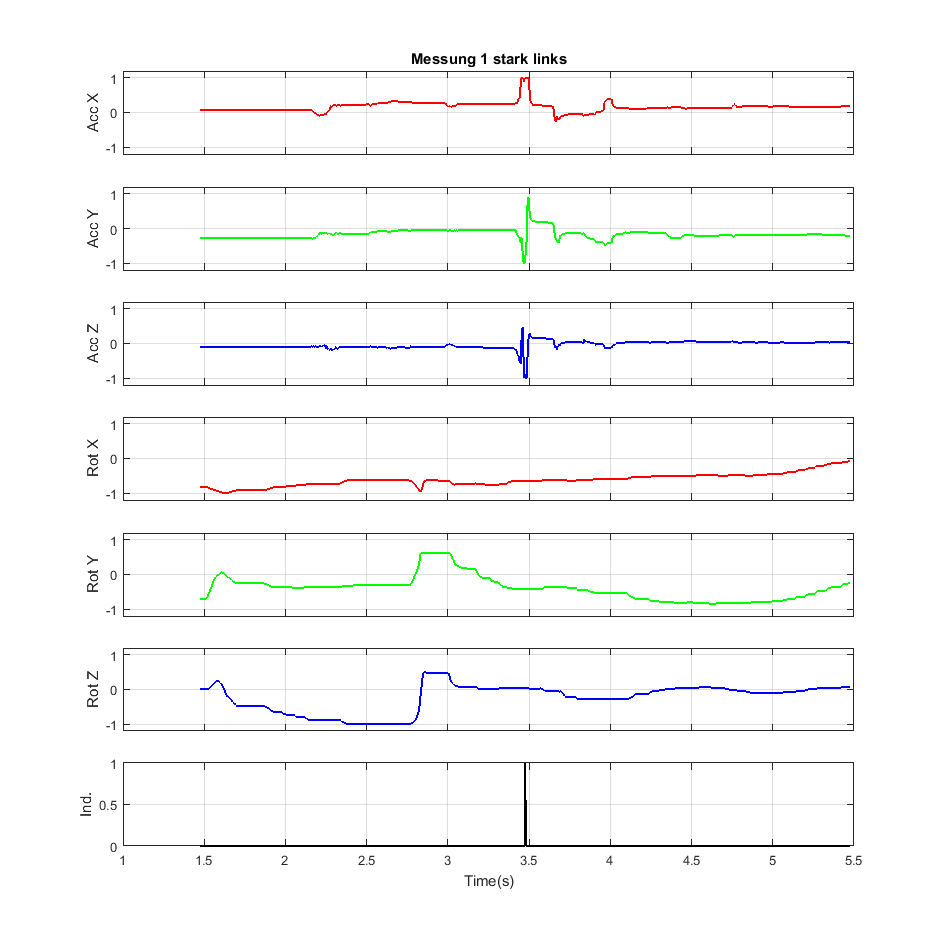 |
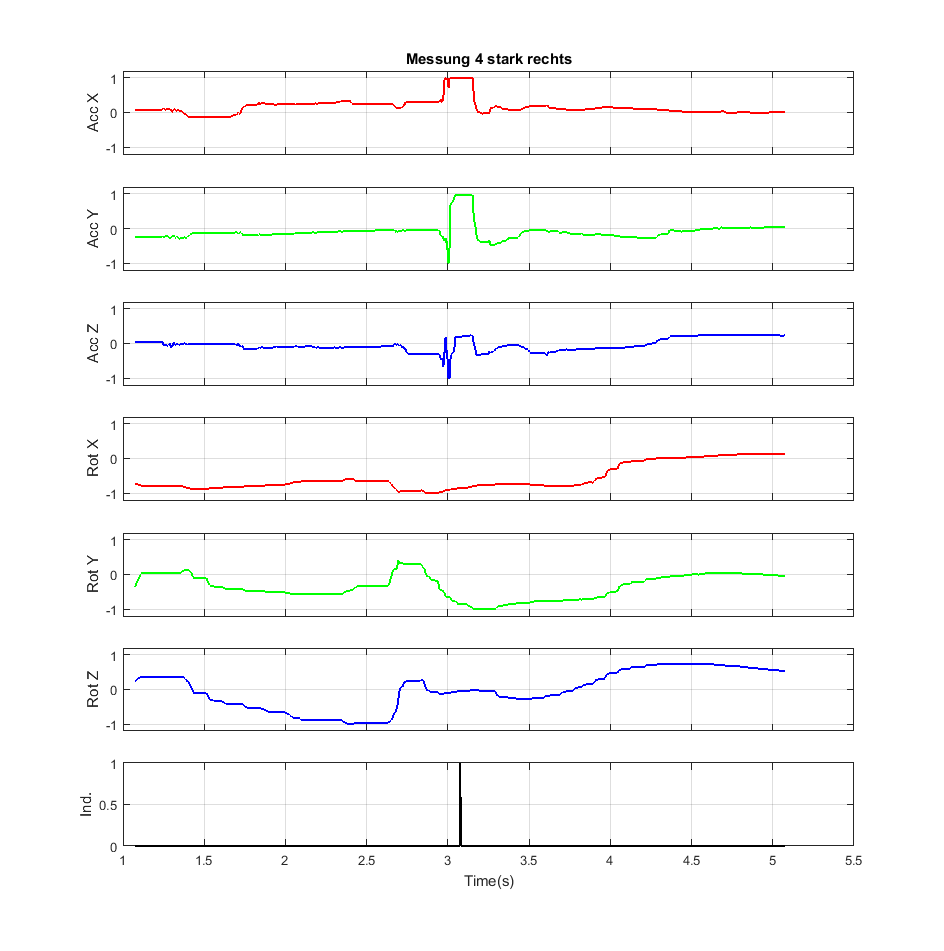 |
|---|---|
 |
 |
|
 |
{tab-bowling Interpolation linear versus spline}
|
 |
|---|
{/tabs-bowling}
{tab-main Bike Adjustment}
Bike Adjustment
 We live in a meritocracy – a society in which it is important to improve yourself. The well-known saying „Who stops getting better has stopped being good!“ has become increasingly important in the last decades. For everyone who is interested in becoming better, whether on professional, on social or on athletic level almost no mean is beyond imagination.
The goal is to find a solution suitable for anyone, who is interested in improving and analyzing his sitting position on a bicycle. So it is possible to modify your driving style and to avoid rough mistakes: A way of motion analysis developed for everyone, whether for the ambitious amateur sportsman or just for someone who puts emphasis on his health.
And that is where we step in. Professional systems for motion analysis are available but far beyond the average cyclist’s budget. The aim of our project was to find a quite simple solution based on affordable hardware by simultaneously gaining significant data about the posture on the bicycle.
Correct cycling depends a lot on correct presettings: These include seat height, wide of the handlebar and the relative position between saddle and handlebar. The position between saddle and handlebar shall be chosen, such that the back can maintain its natural S-form to achieve correct load.
When cycling it is advisable to lean forward for fifteen to twenty degrees to strain the muscles, which are responsible for stabilization of the upper body and train them optimally. Due to inclining the centre of gravity is directed over the pedals, so an optimal load of muscles is ensured. While pedaling one should try to achieve a crank effect. The pedals should be treaded and pulled at the same time in alternating order. The cadence should be around 80 to 100 per minute. A smaller frequency leads to overload and a bigger to faster exhaustion.
Enthusiasts might not exactly determine which position is optimal, while professionals might want to finetune their behaviour. So we tried to find a sufficient solution by selecting suitable metrics and technology. Commercial systems work with tracking points, magnetometers or acceleration sensors to detect positions and angles of body parts. A quite intuitive approach was to use standard 3-axis accelerometers like in smartphones (e.g. ADXL345) to measure the linear acceleration applied to for example the upper leg. The sensor values can be readout via I2C bus and a connected micro controller like Arduino As long as we use an ergometer and go without too rapid pedal movement other forces except for the gravity are insignificant according to our tests. So we can use coordinate transformation from cartesian to spherical coordinates to get the theta angle between upper knee and ground. More sensors would allow us to calculate angles between those sensors like the knee angle.
So the next step was to prepare a more complex setup. This included hardware like four sensors with reliable cables and 3d printed attachments, research for suitable sensor positions on the body and a performant Arduino-Matlab-Interface. Especially the last topic was quite time- and work-intensive but finally made it possibly to visualize four sensor values in real time with close to 100 Hz sampling rate. This is sufficient for a large number of muscle activities.
Used positions for the sensors are upper knee, lower knee, upper back and lower back. Based on this, the Matlab GUI offers calculated values like backbone posture, minimal and maximal knee angle and backbone angle to give you an idea of how to optimize your activity. This can be a solid base for further research on the topic especially under sports medical points of view.
Special thanks to Stefan Kratzenstein for his outstanding subject-specific support and the opportunity to use the CAU Hochschulsportlabor.
Team members
- Johannes Hoffmann
- Dawyd Klimaschewski
- Alexander Weber
- Daniel Beus
{/tabs-main}
 In the first week of September, we were delighted to host Dr.