Marker Evaluation of characteristic quantitative Variables in Electroneurography
Overview
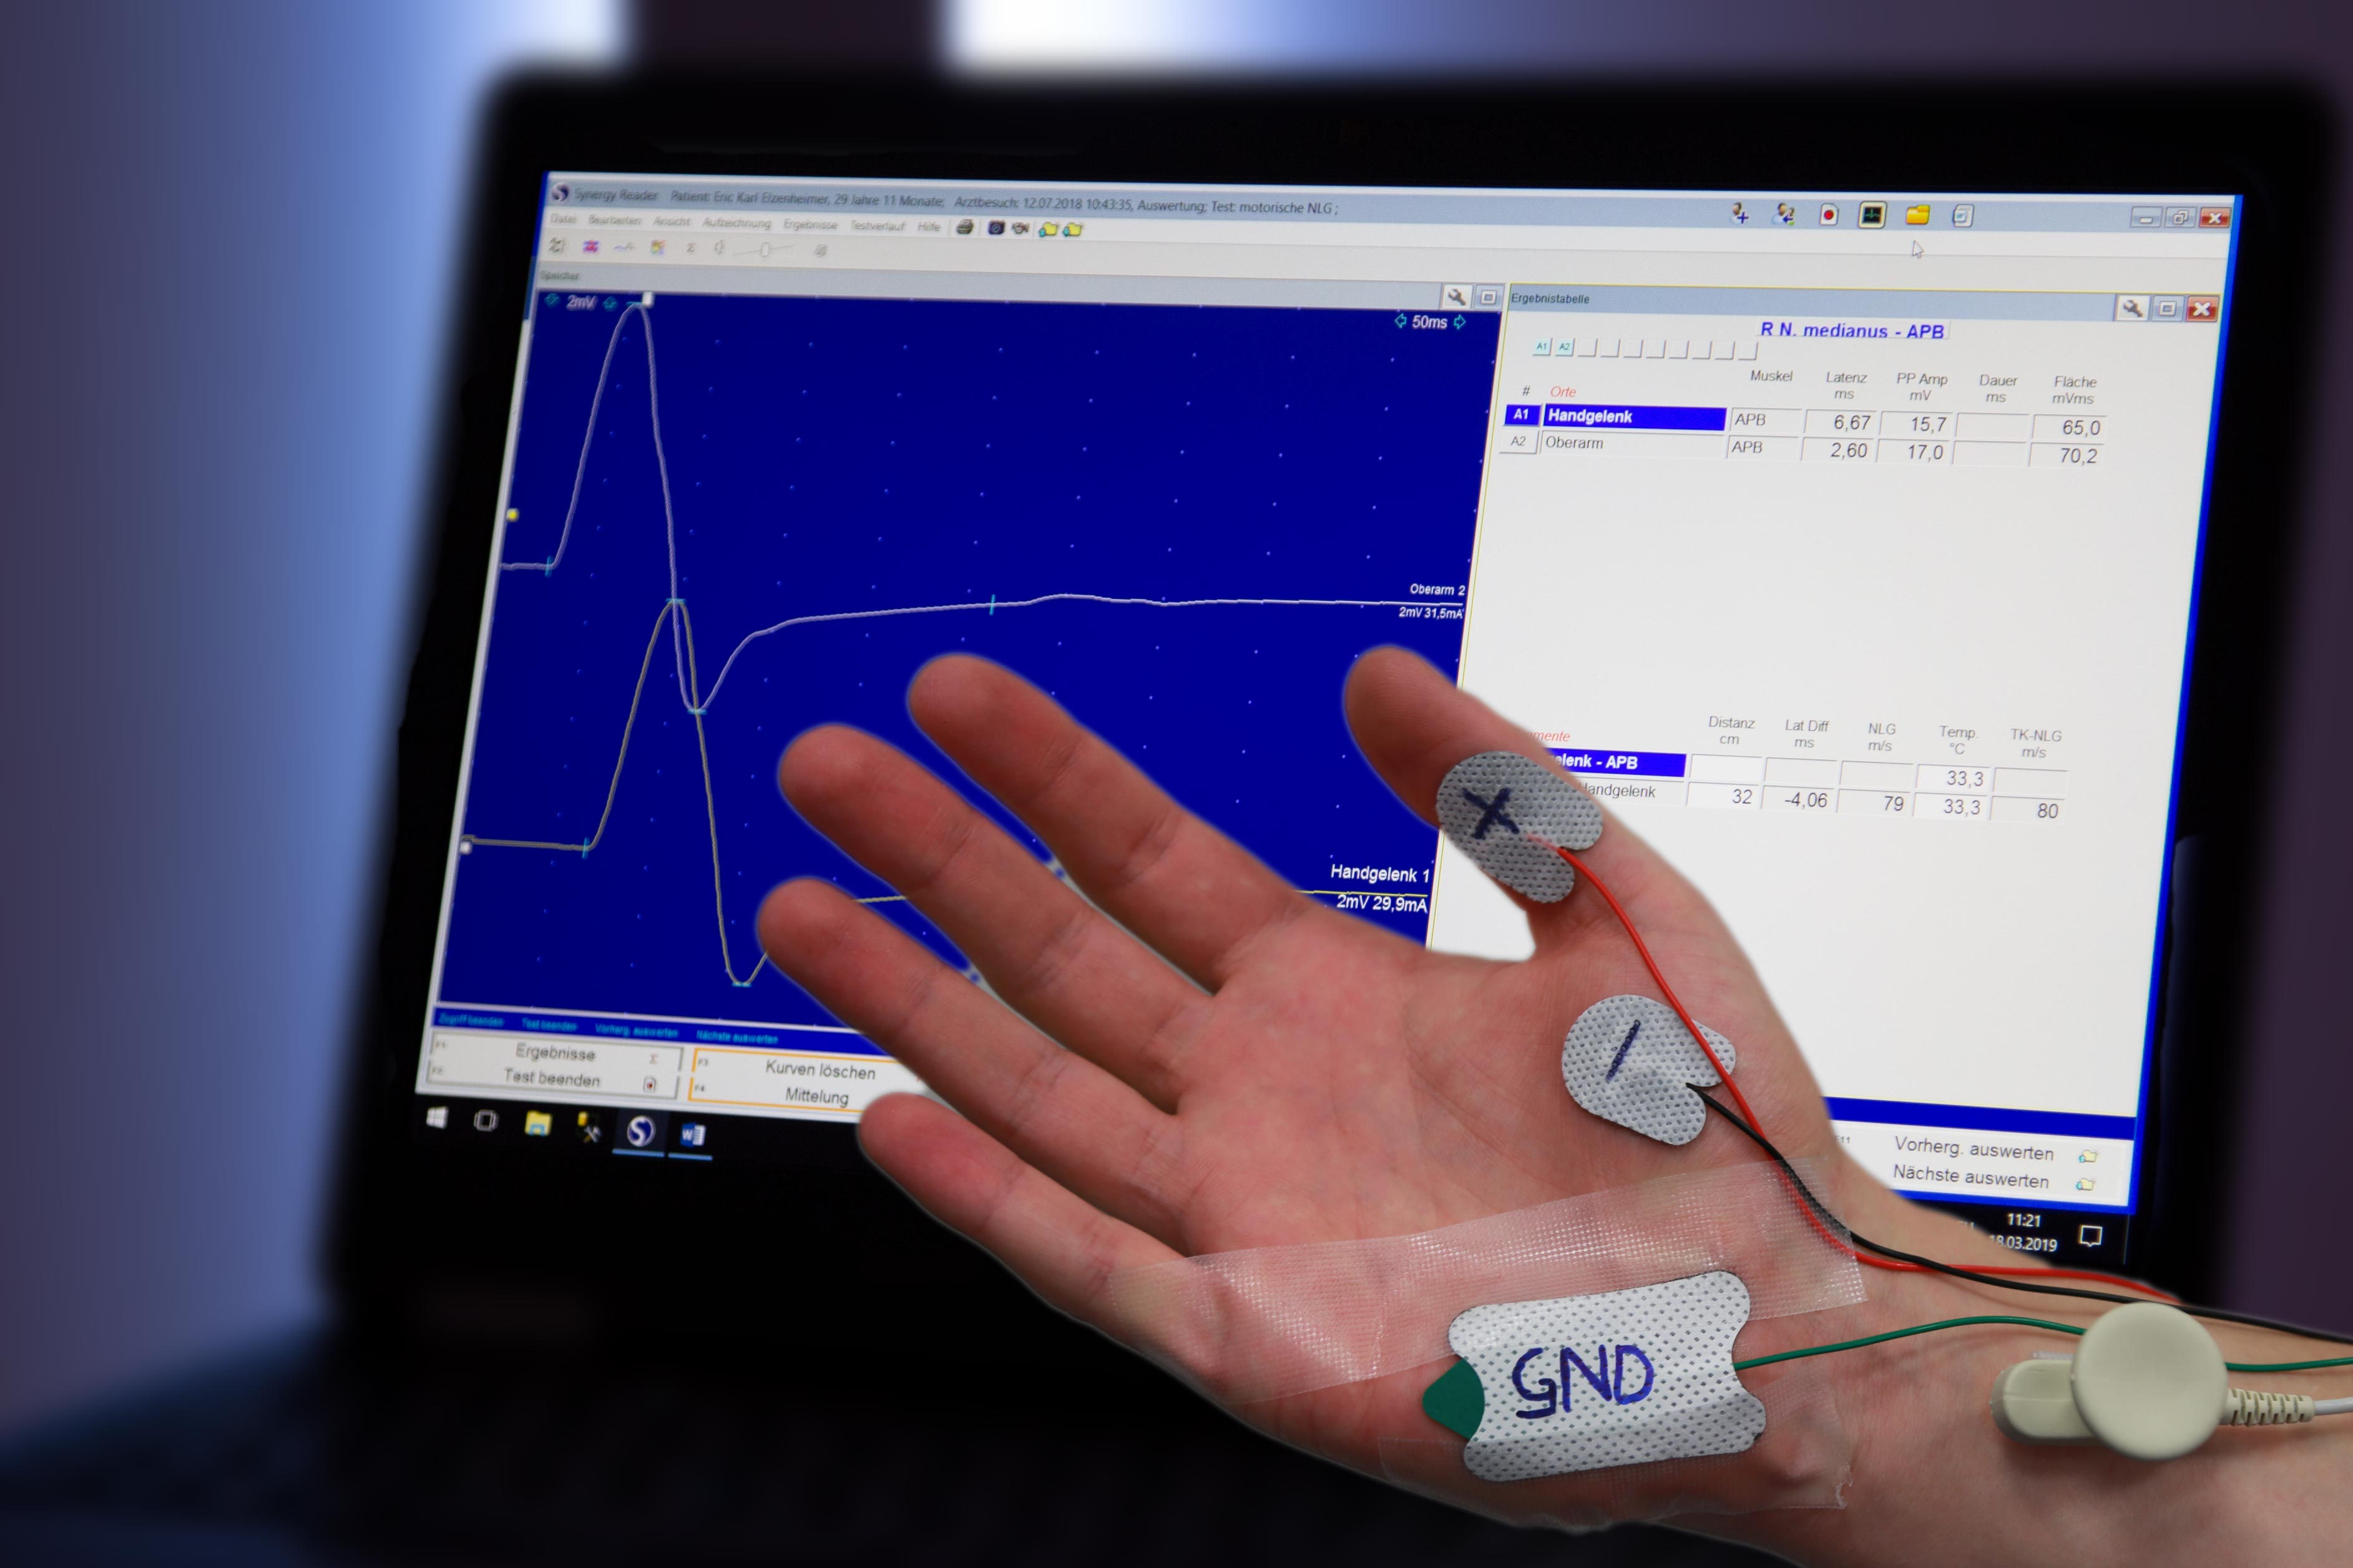 In this project – a group of three students – are analyzing how precise quantitative variables could be manually or automatically extracted in Electroneurography, which is an essential measurement method for the assessment of peripheral nerve disorders. For electrophysiological diagnostics, muscle signals are recorded with surface electrodes. The signals are triggered by electrical stimulation of efferent nerve fibers at different sites along the nerve. The recorded waveforms are analyzed by measuring quantities such as nerve conduction velocity, signal amplitude, distal motor latency. These are compared with age-matched reference values. These objective data are a relevant contribution to the diagnosis of nerve pathologies in addition to the clinical examination.
Compared to algorithms from digital signal processing, these measurements are either imprecise setting characteristic signal variables by hand in the recorded signals, or they result in non-uniform results if electroneurography equipment of different manufacturers is used for the measurement. Additionally, no standardized algorithms are currently available for the calculation of quantitative variables, which makes a comparison of clinical studies quite challenging and prohibits the usage of big data and artificial intelligence.
The project task is to develop a web-based survey, which enables medical persons to participate from their clinical computer and to set time- and amplitude markers by hand. This survey allows to collect statistics characteristic markers. Afterwards, the results of the different markers are compared in terms of accuracy to a standard electroneurography system and advanced digital signal processing algorithms. The motivation of this project is to enable the use of modern signal analysis methods in the neurologic application by showing the impact of optimal calculated quantitative variables in electroneurography. This could pave the way for machine learning for electrophysiological diagnostics in the near future.
Both the web based survey and our ideas for processing algorithms had to go through multiple revisions. For the survey, we first had to implement the core functionality like server-communication, data parsing and data visualization. The application must be able to parse nerve-signal data from a set of patient data, calculate the required markers and display the curve data in a web-browser. After setting the markers and completing the survey, the application stores the recorded markers on a server. This survey-data is collected and will then be statistically evaluated.
The focus of the application design has to lie in allowing for extensive functionality while still maintaining an user-friendly experience. After setting up a basic design of the survey, medical staff from the University Hospital Schleswig-Holstein (UKSH) was invited to test the survey. We changed our design based on the feedback we have gotten on user-friendliness and implemented new features like easier zooming and automatic marker completion.
Our survey-website was tested with multiple medical staff participants and the results could then be successfully transferred for further comparison and analysis.
Participating Students
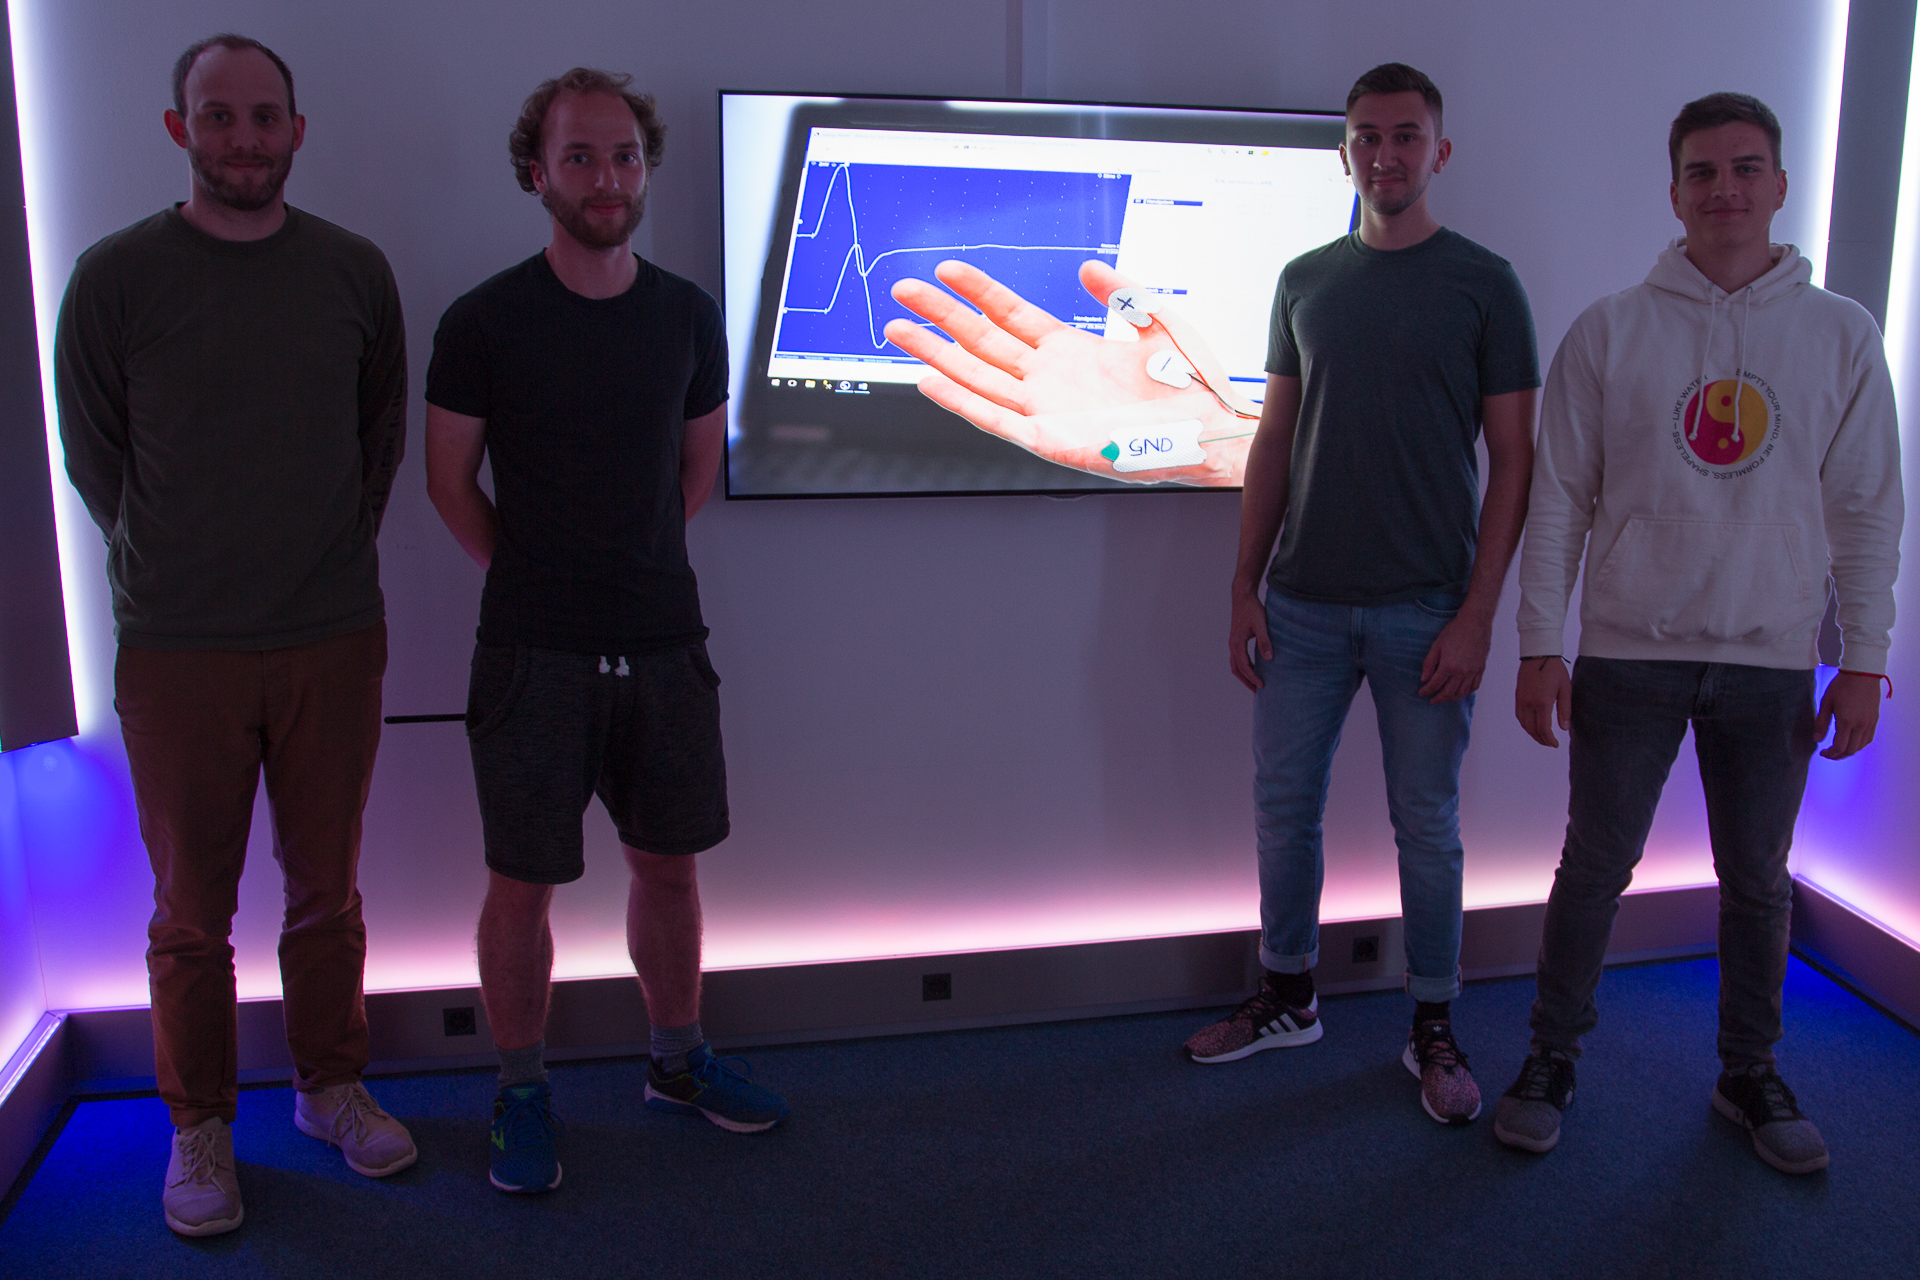
- Tobias Philipp
- Lukas Fonk
- Christian Kanarski
Supervisors
- Eric Elzenheimer
- Gerhard Schmidt
- Kevin Prehn
 We were happy to welcome Sören Lange as a new member of our team at the beginning of the year. In his master’s thesis, he focused on signal processing for innovative underwater opto-acoustic sensor systems and has since then taken on new challenges in the field of magnetic sensors. His research interests span a wide range of topics, including signal processing and control engineering. With his friendly attitude, technical curiosity and expertise, Sören is a great addition to our team. We look forward to working with him!