The ANIR Corpus - Impulse Responses
 |
||
| Contents: | ||
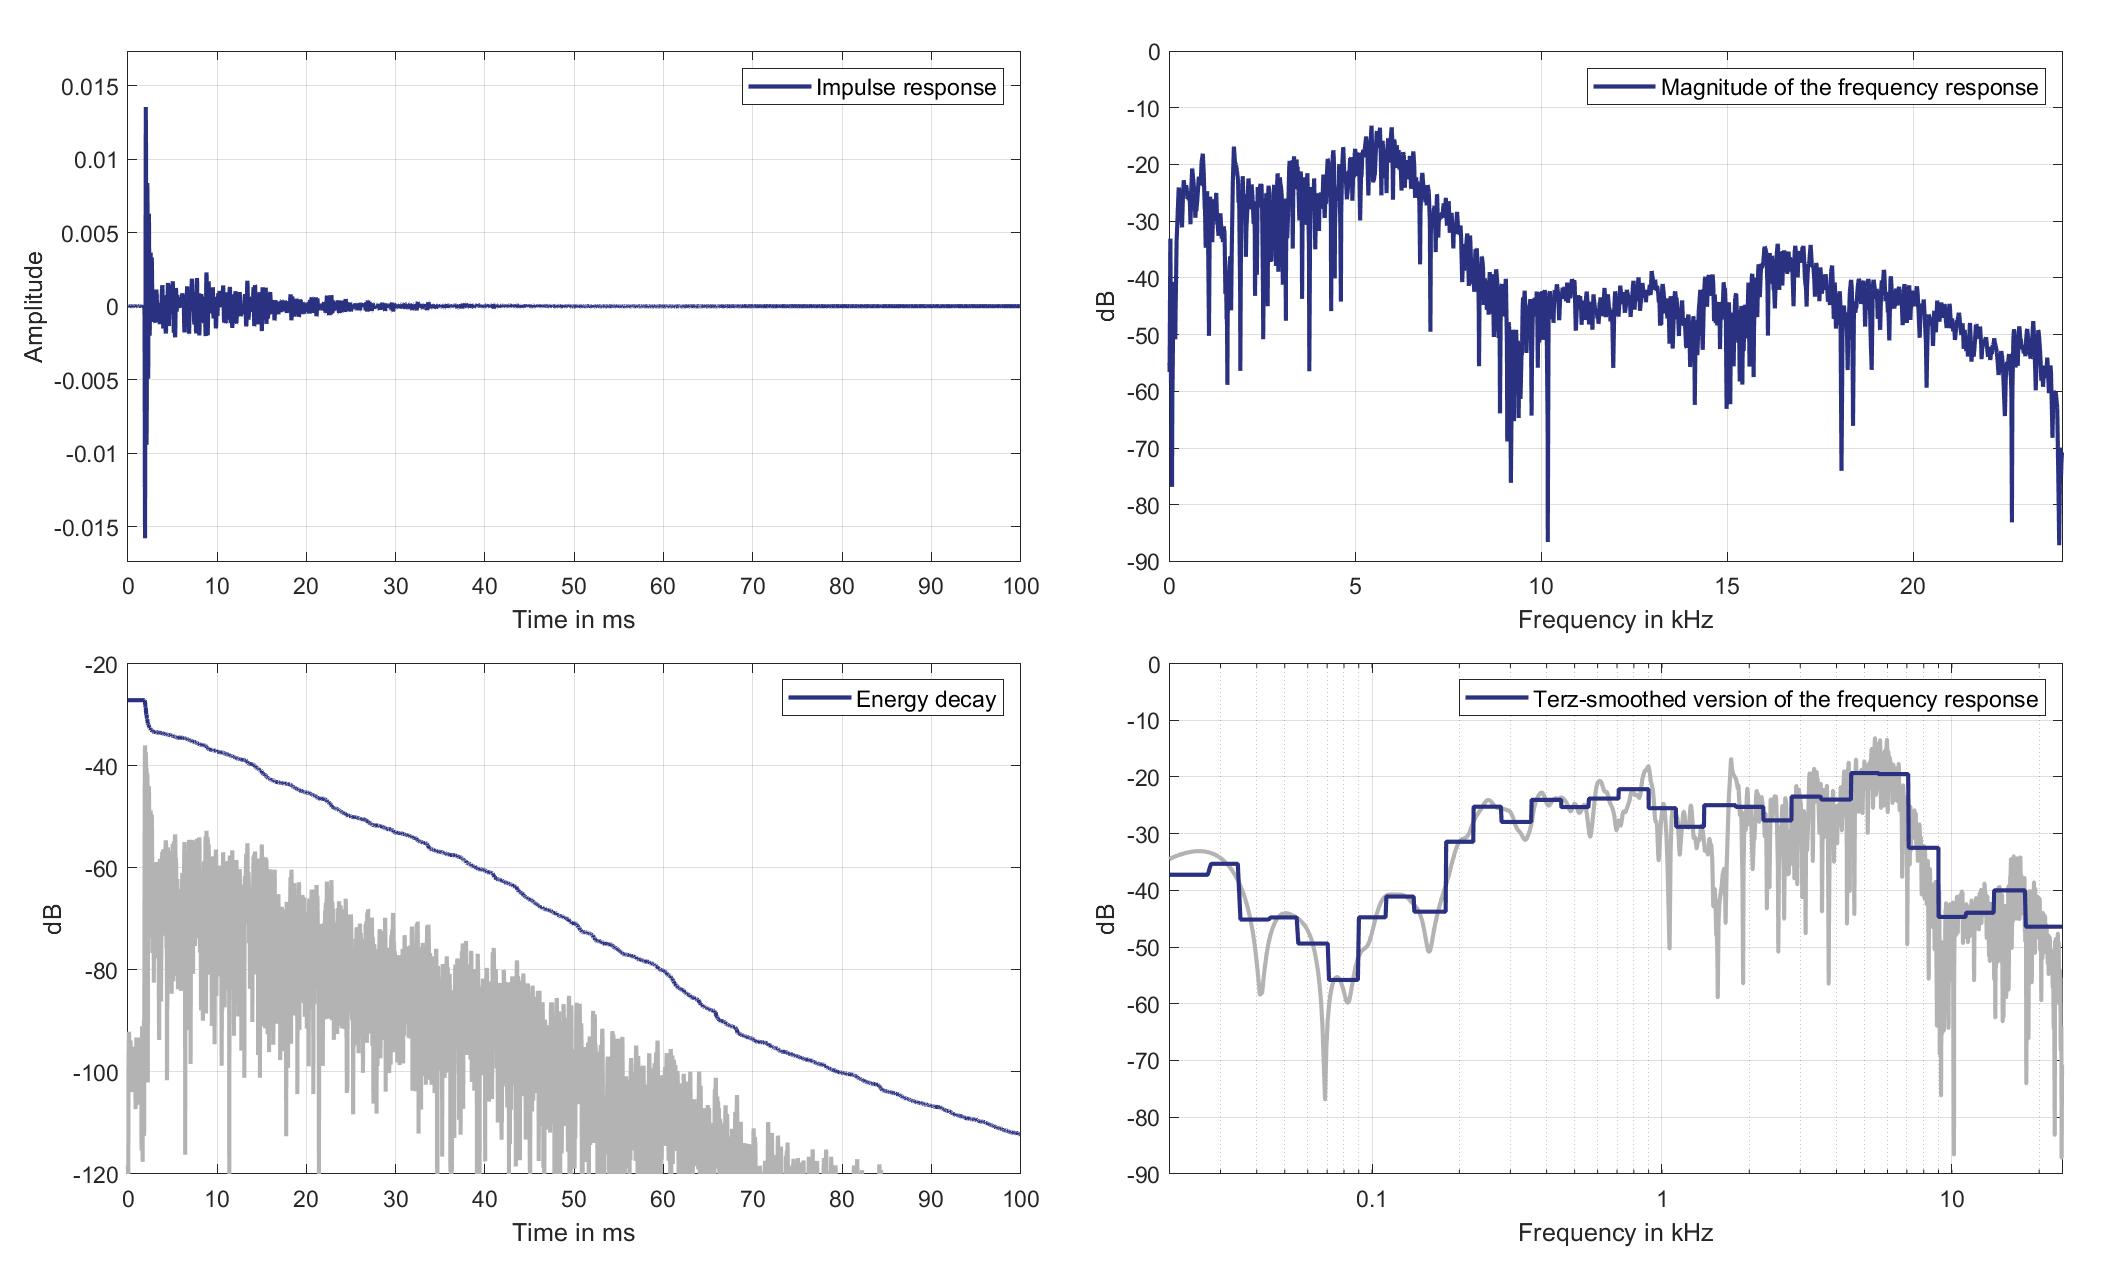
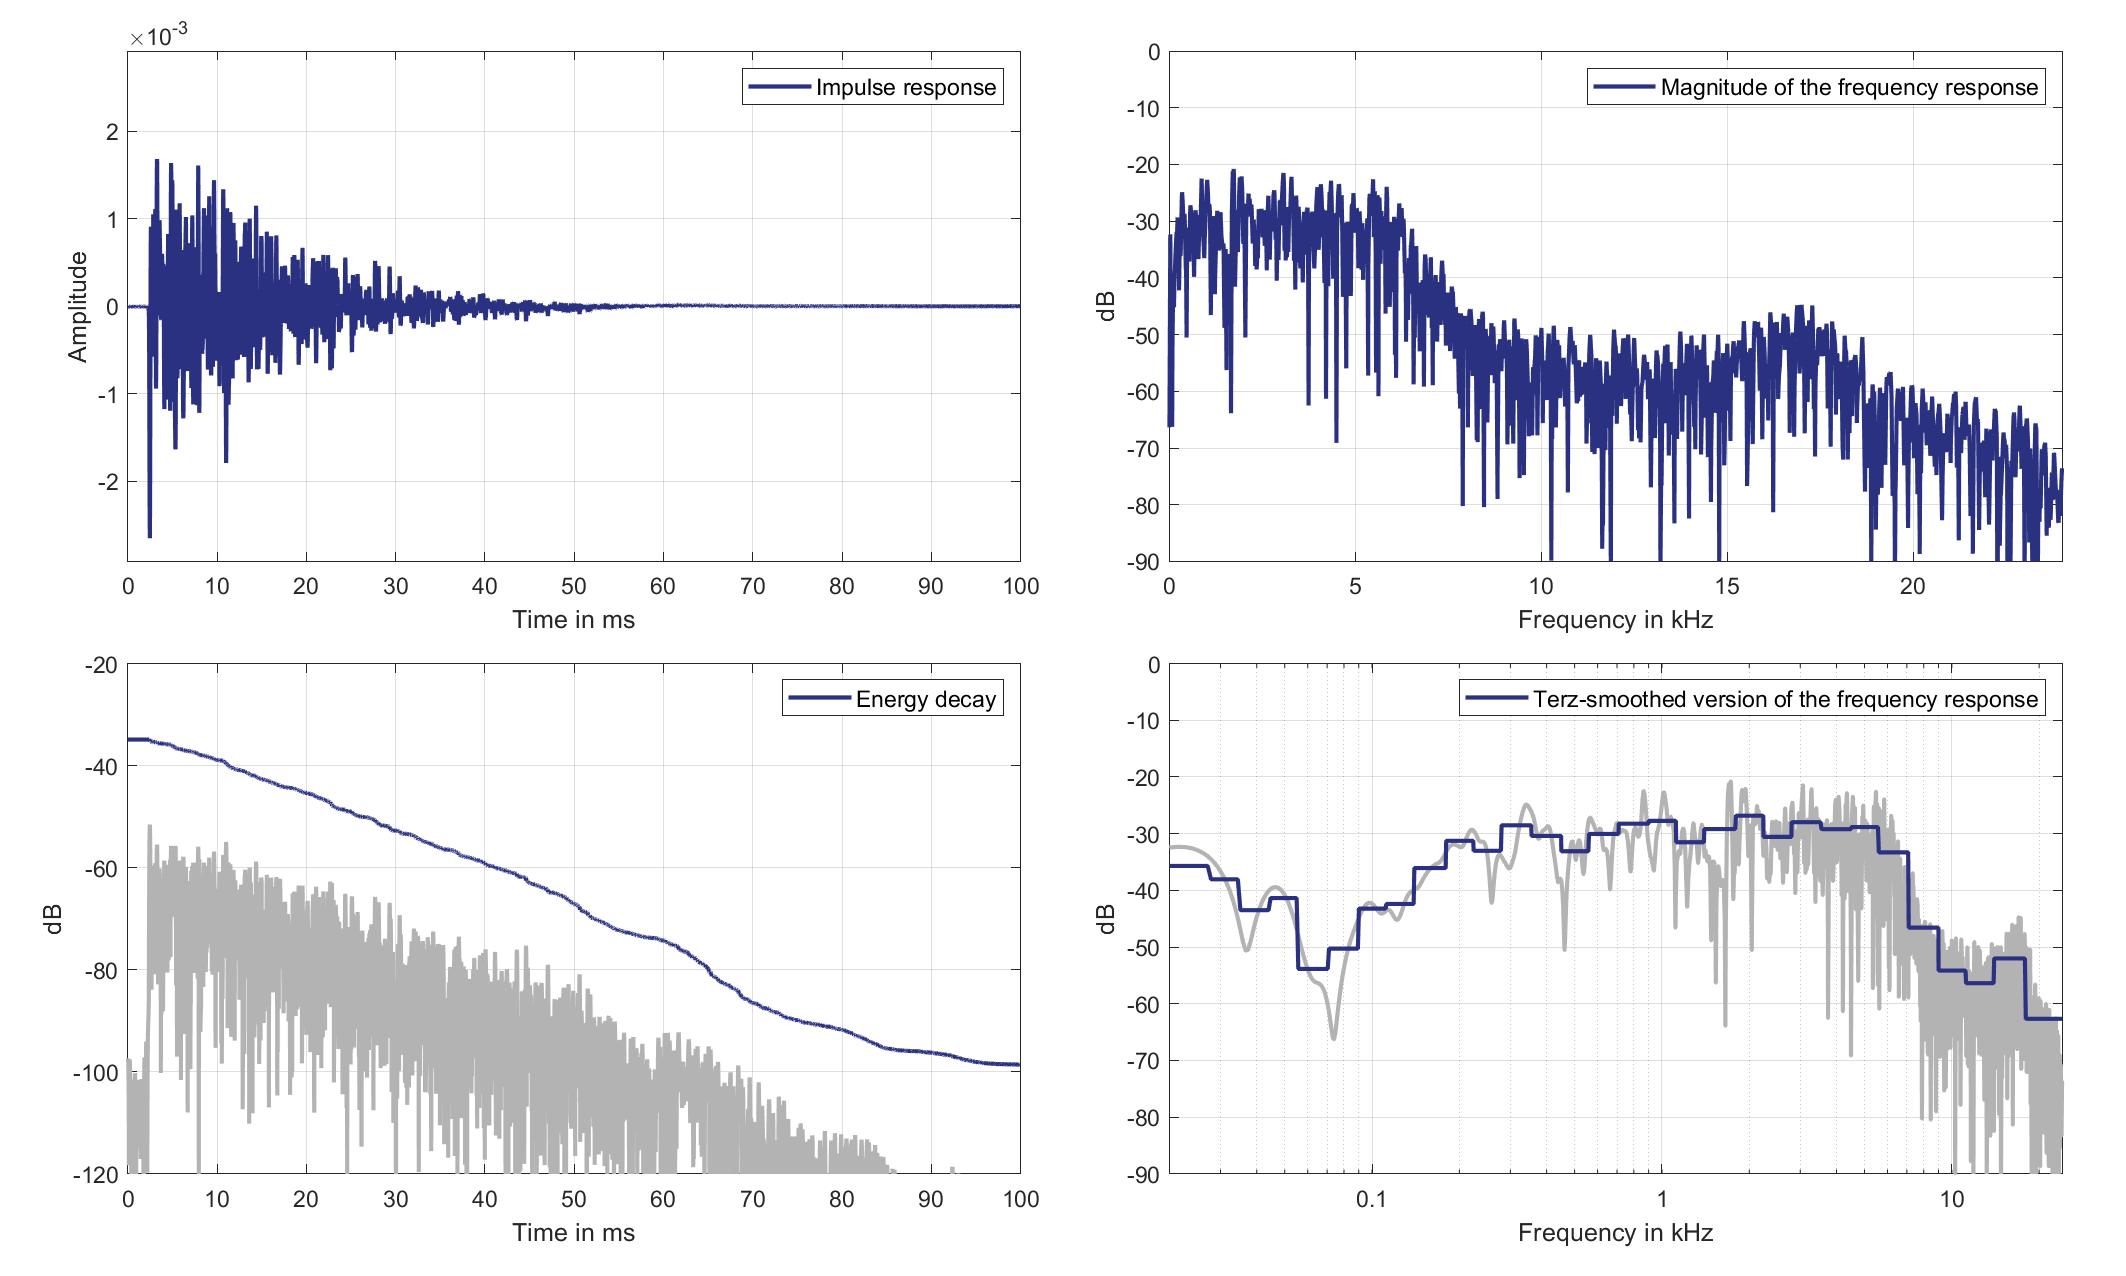
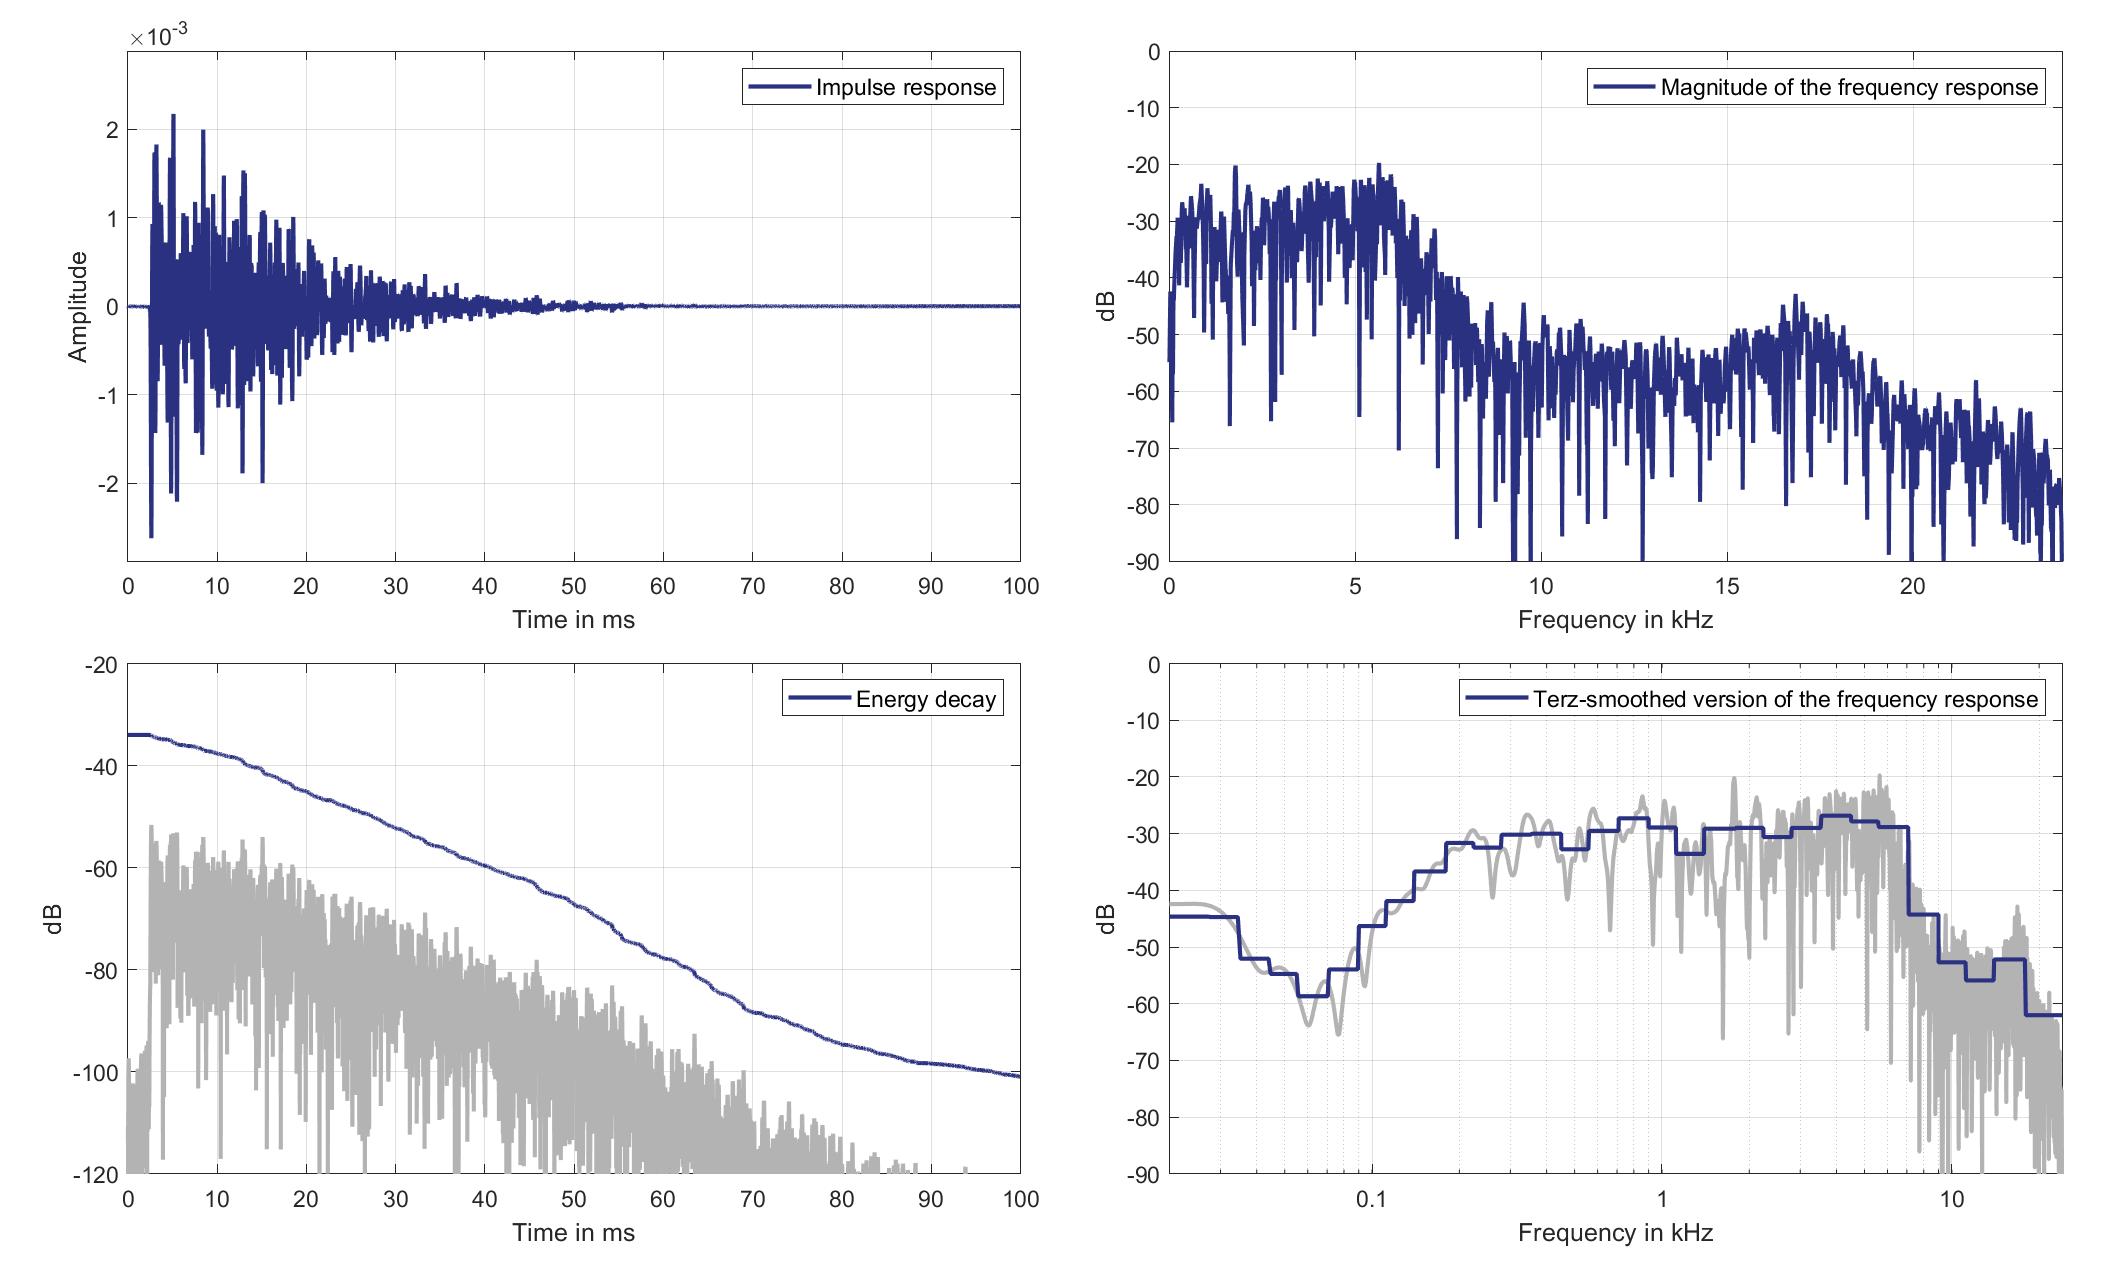
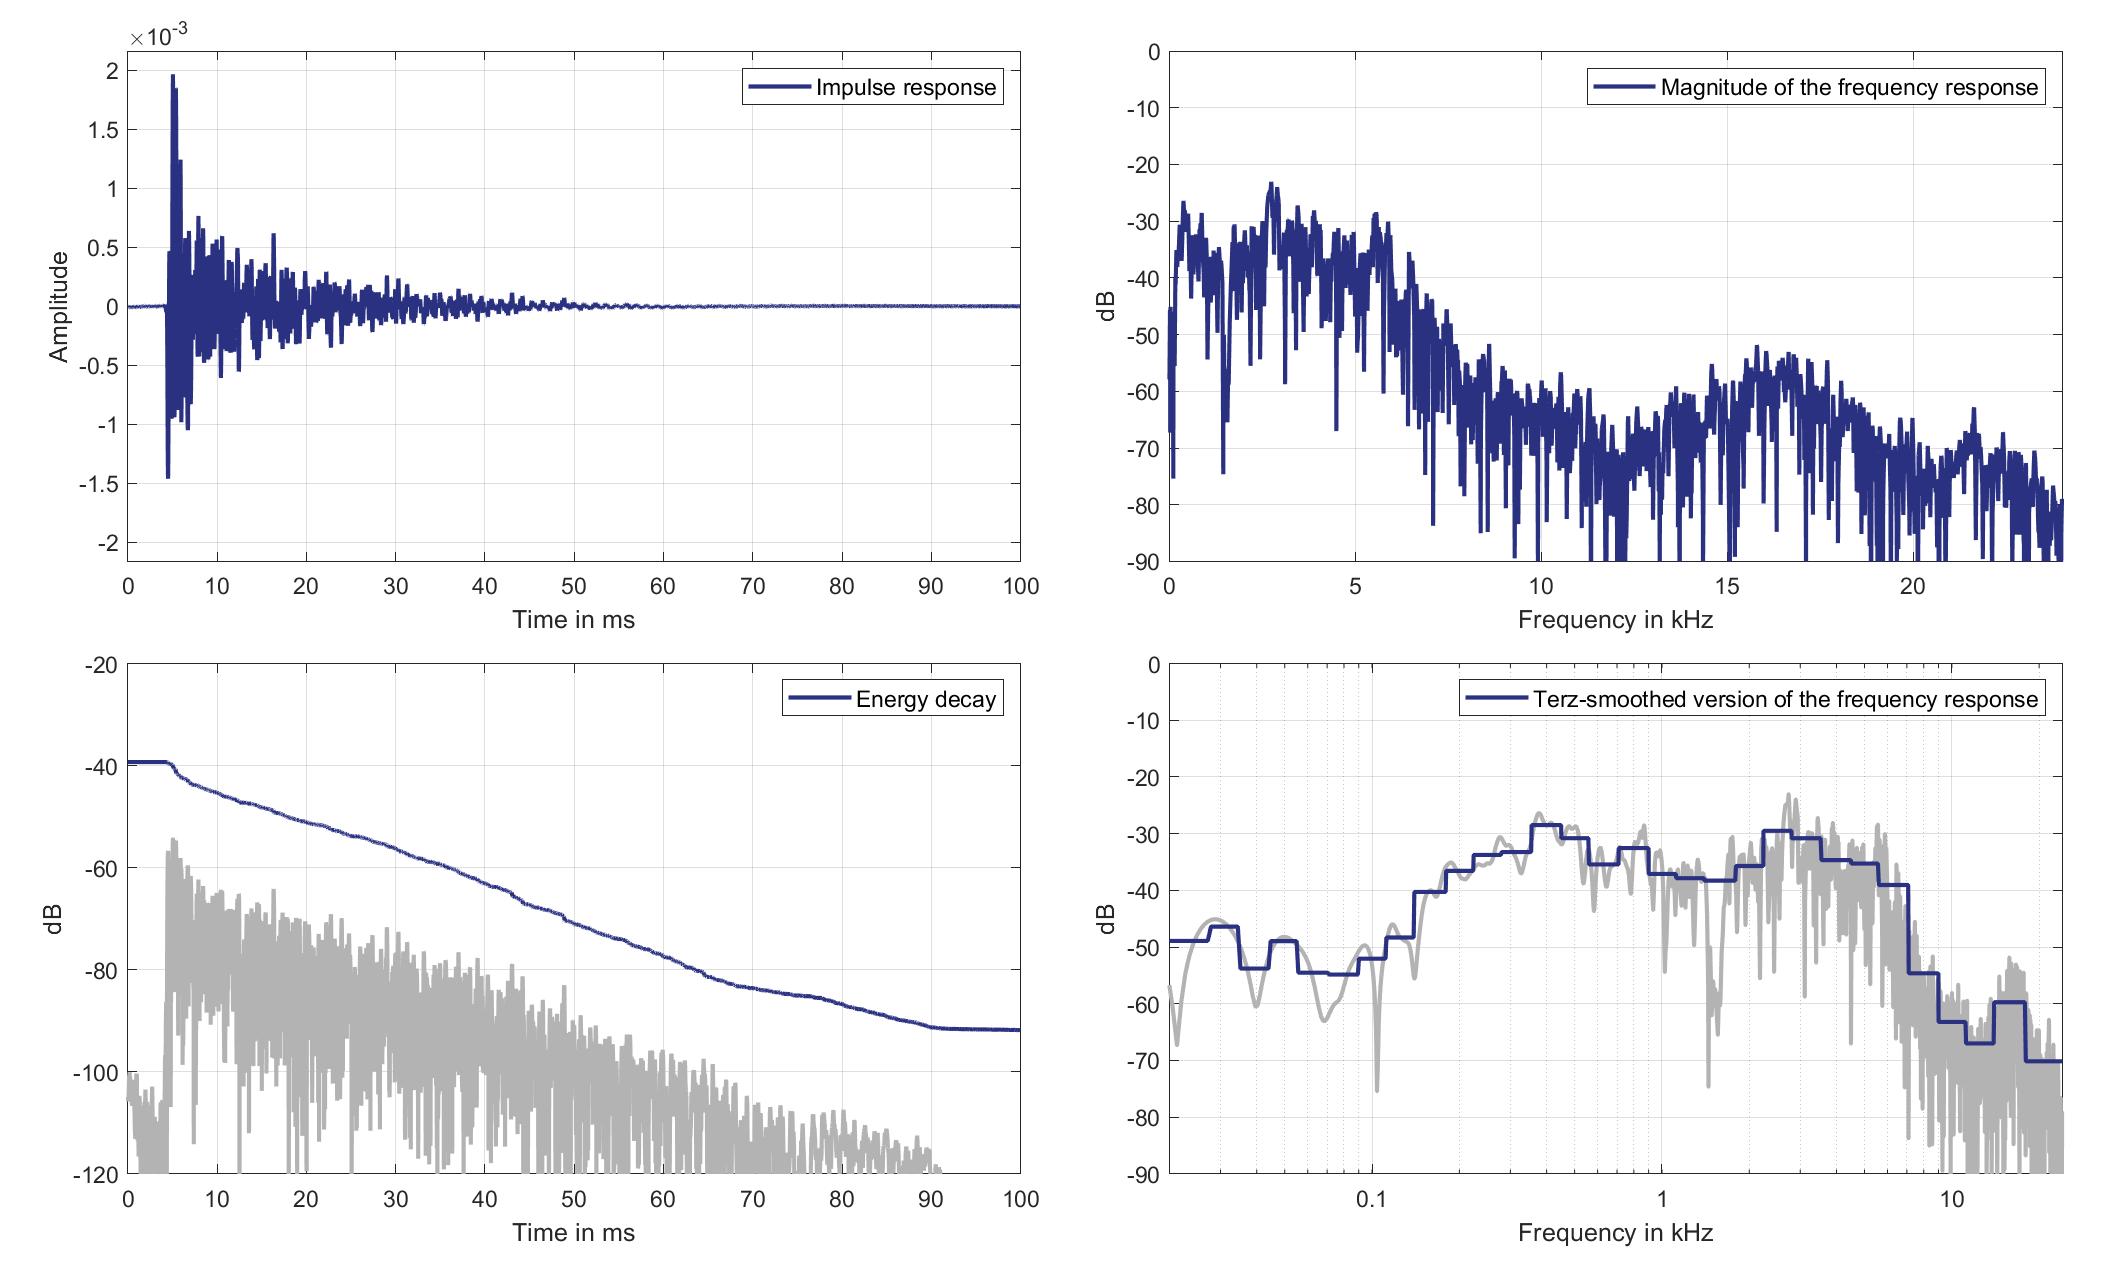
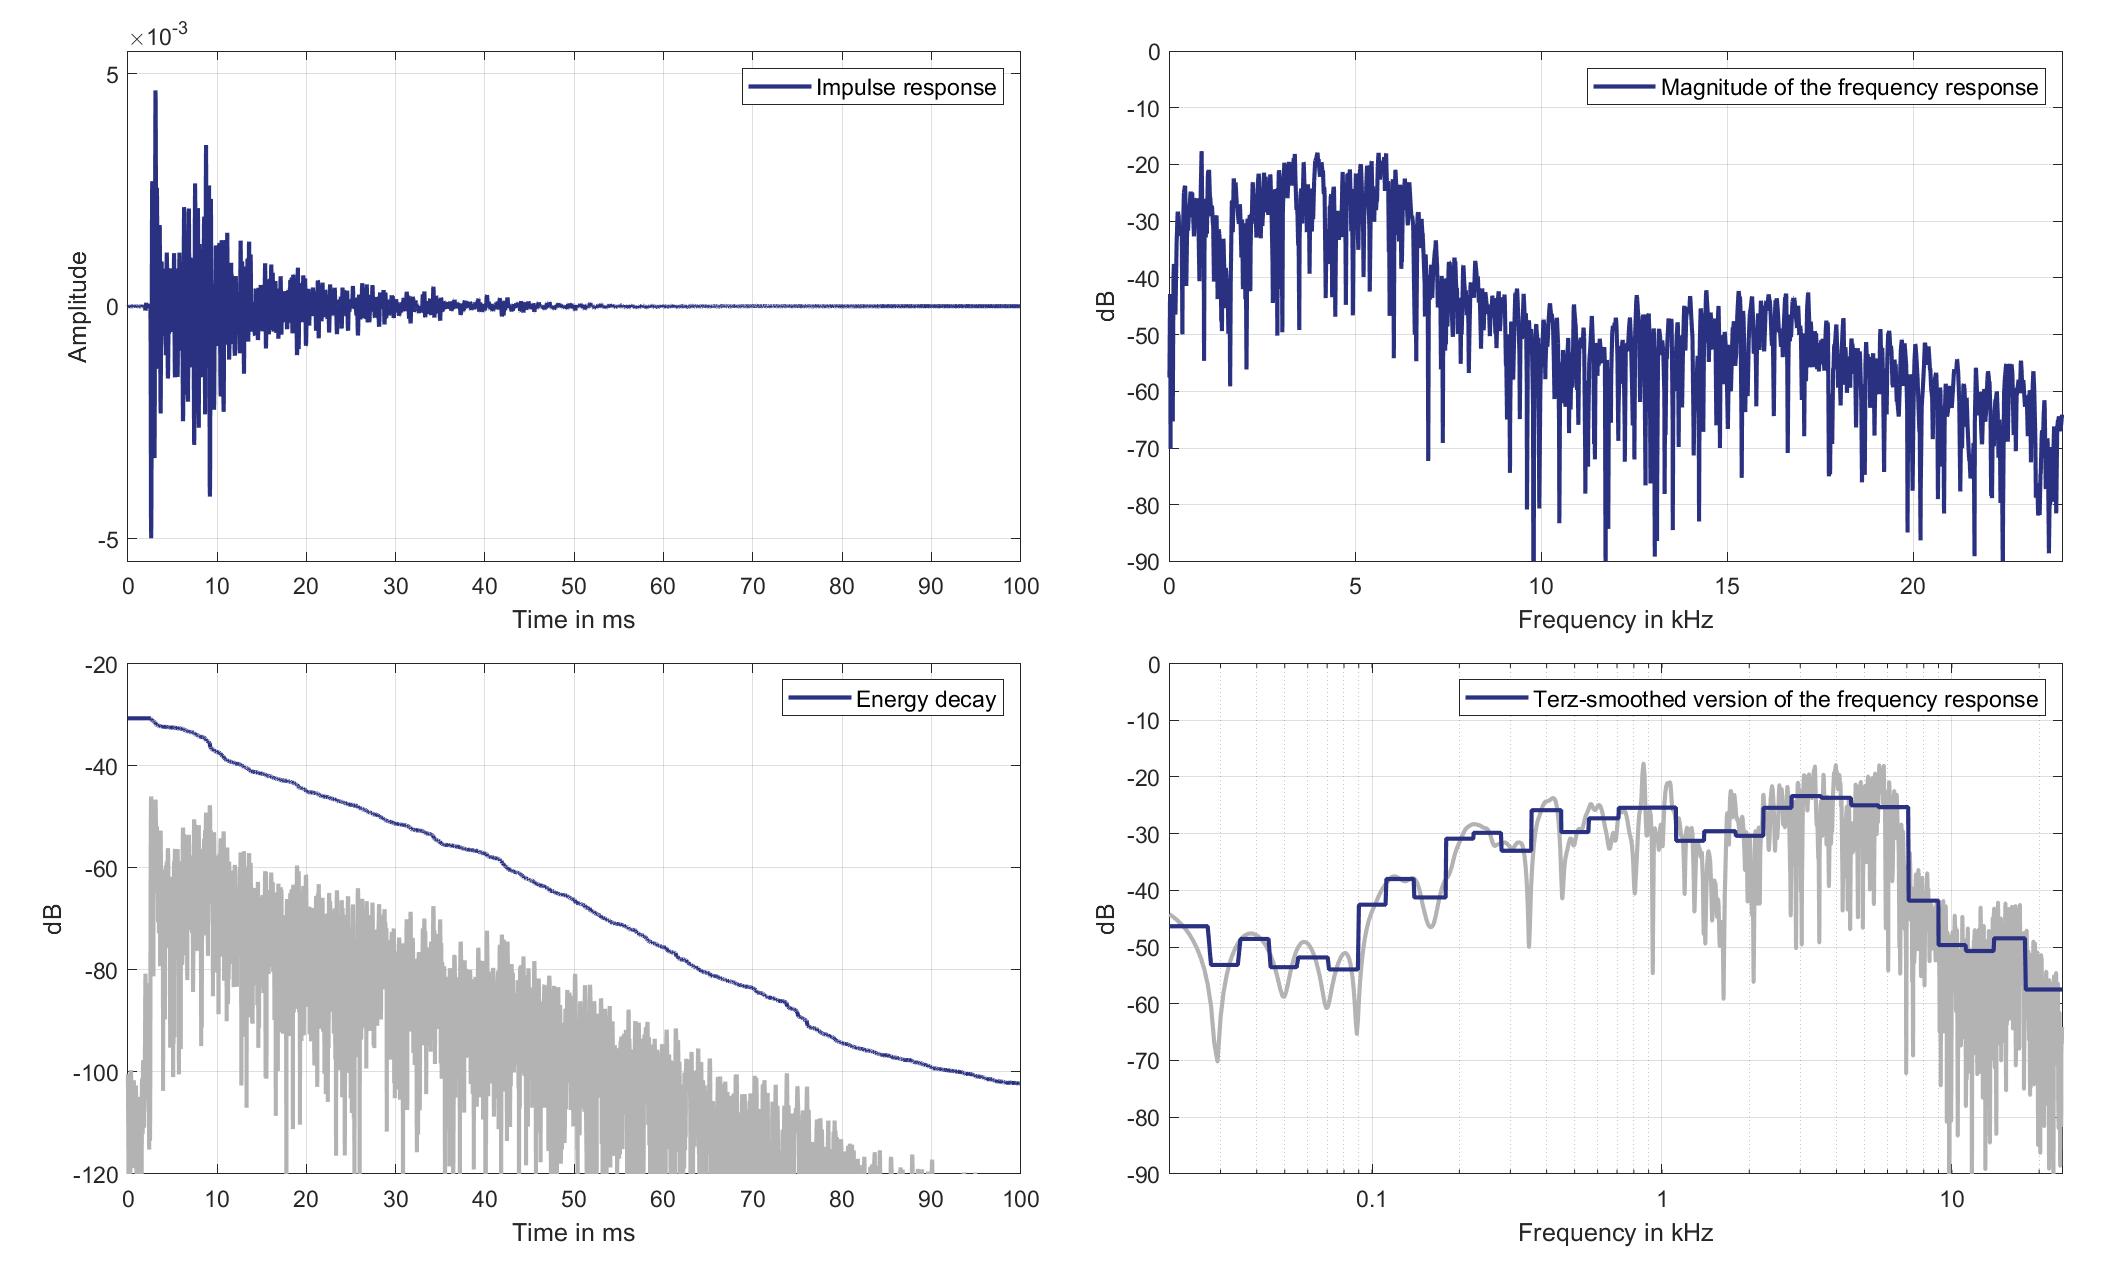
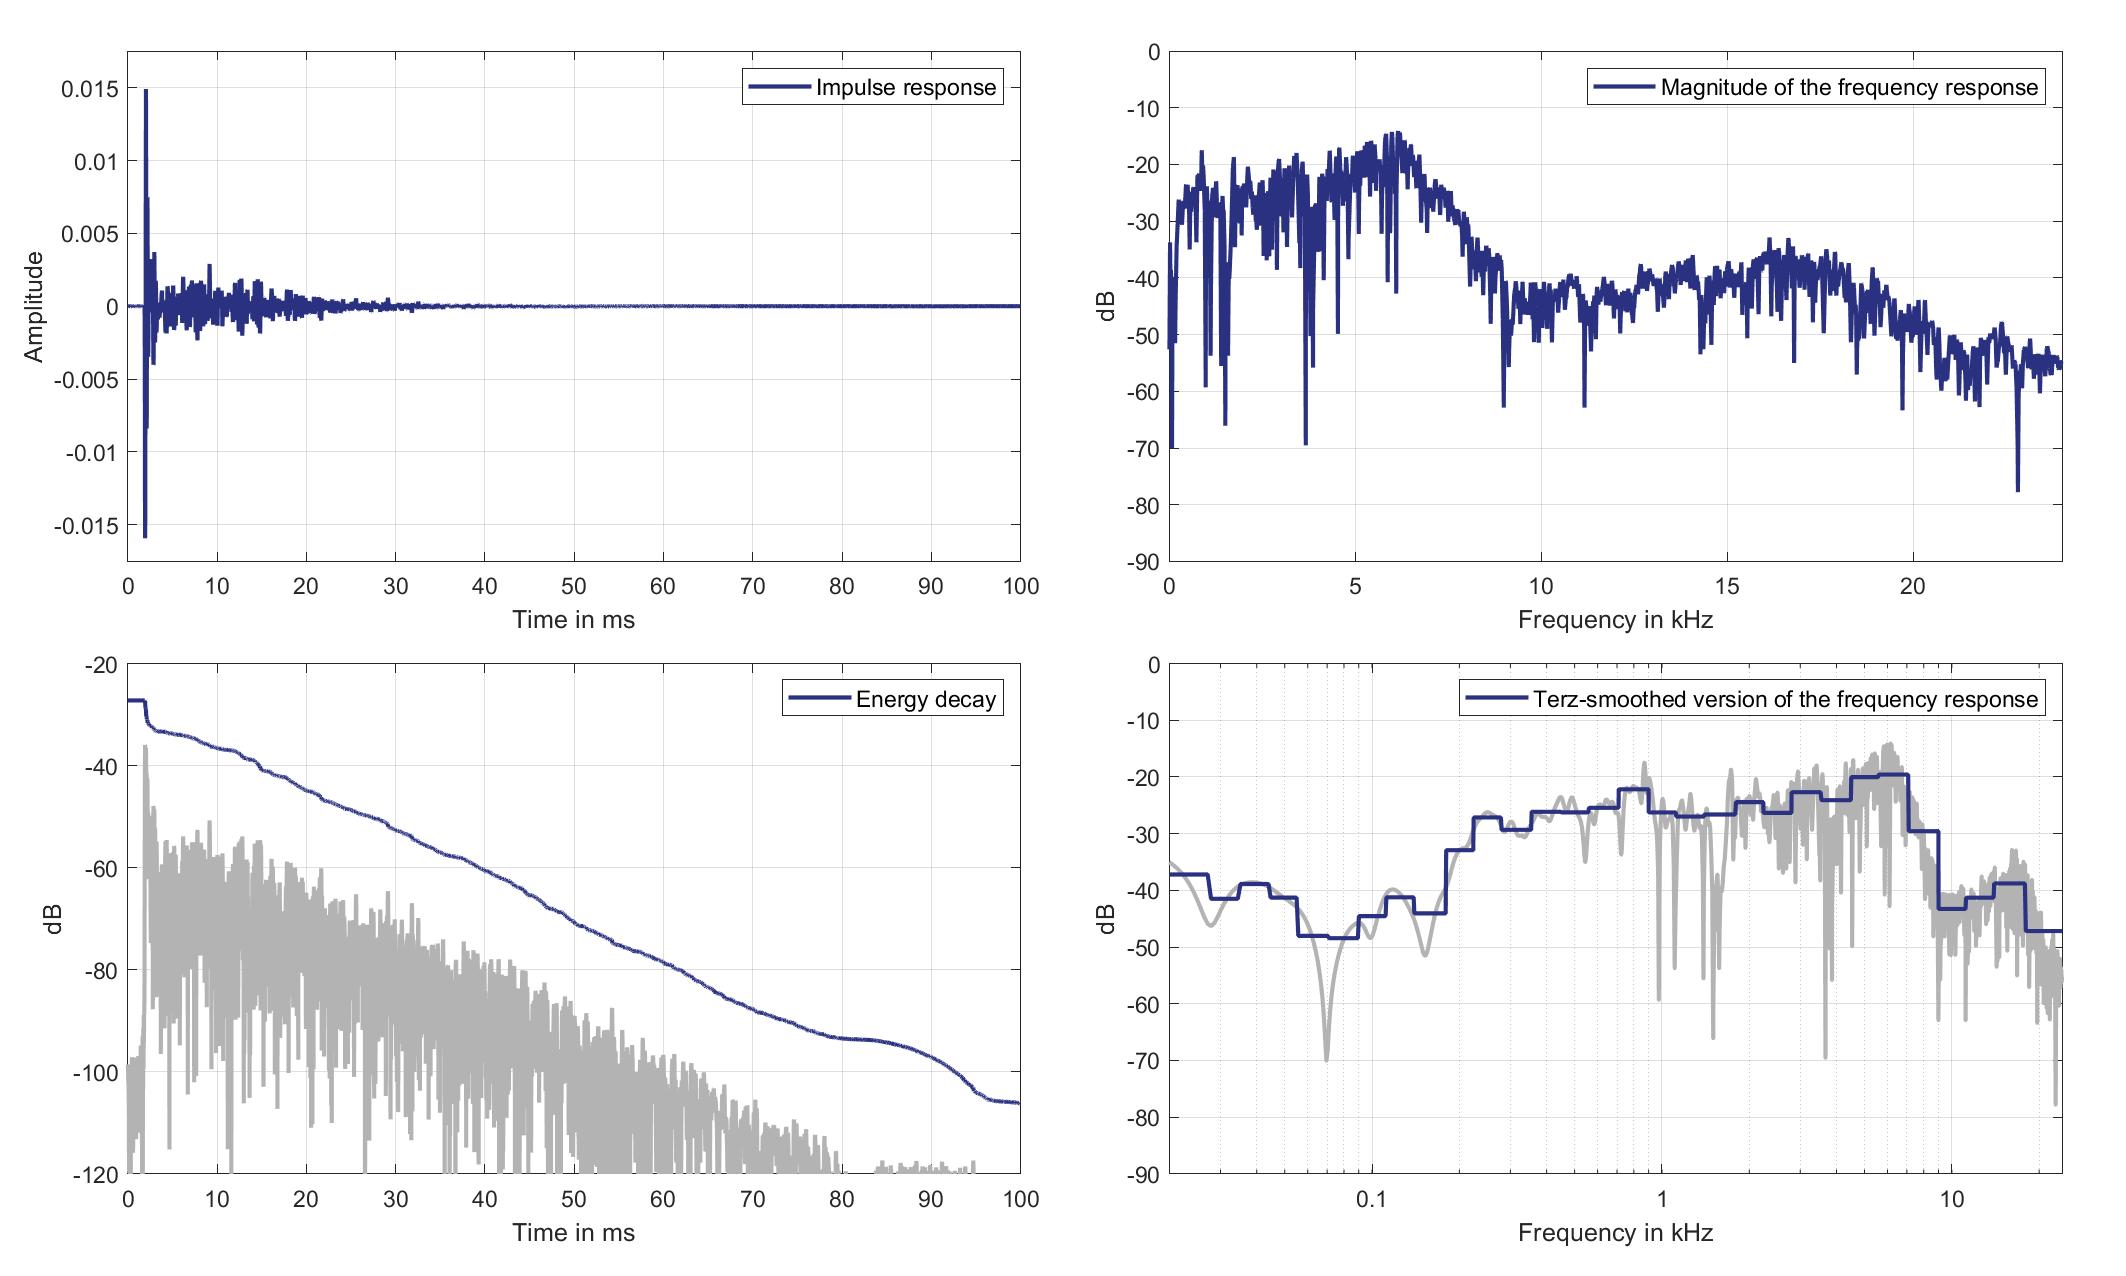
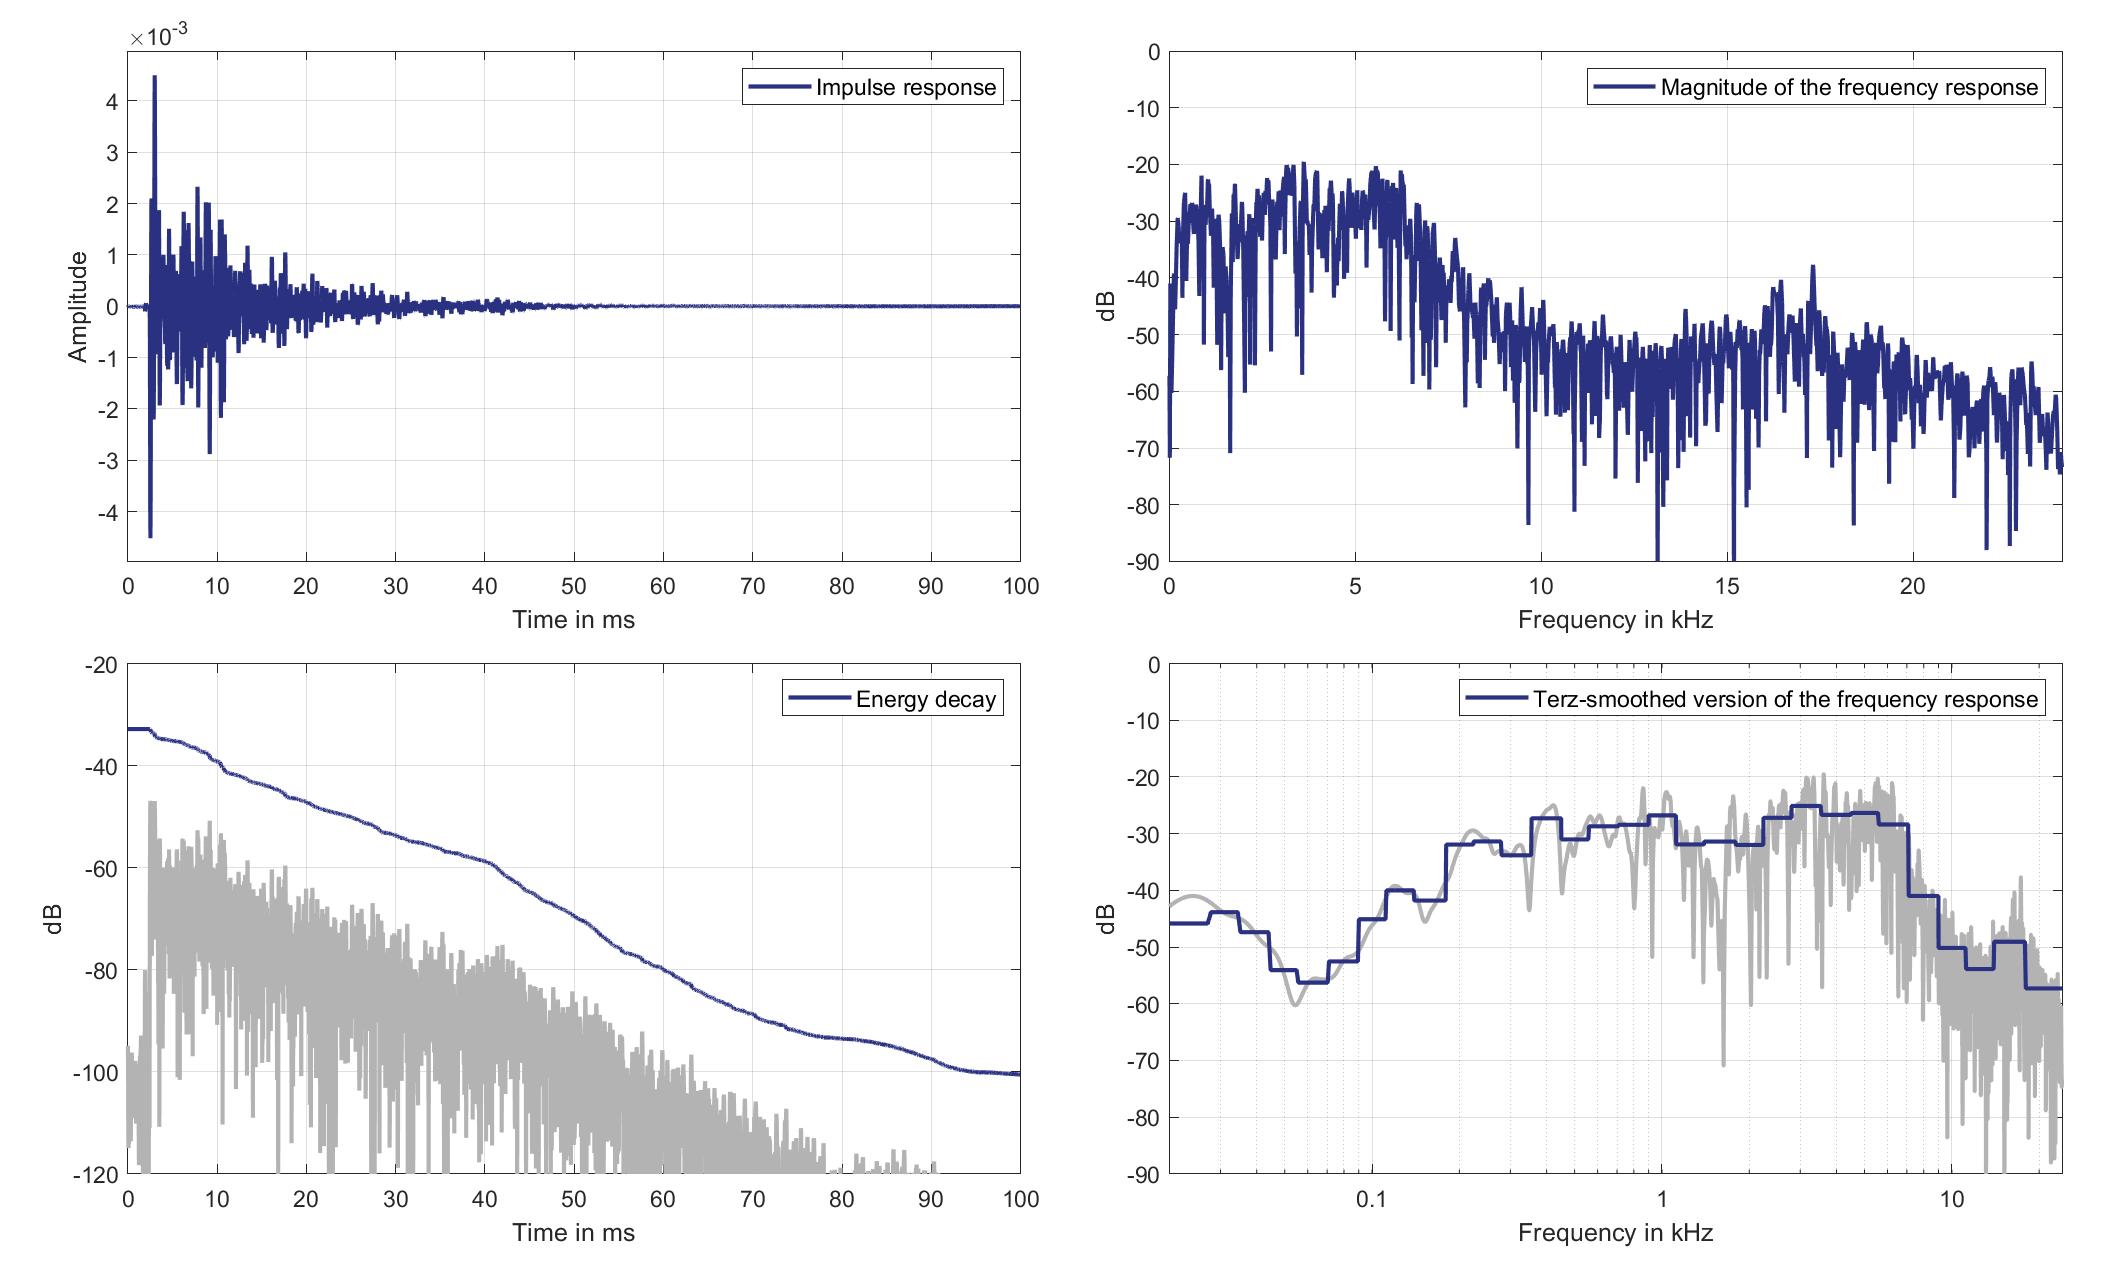
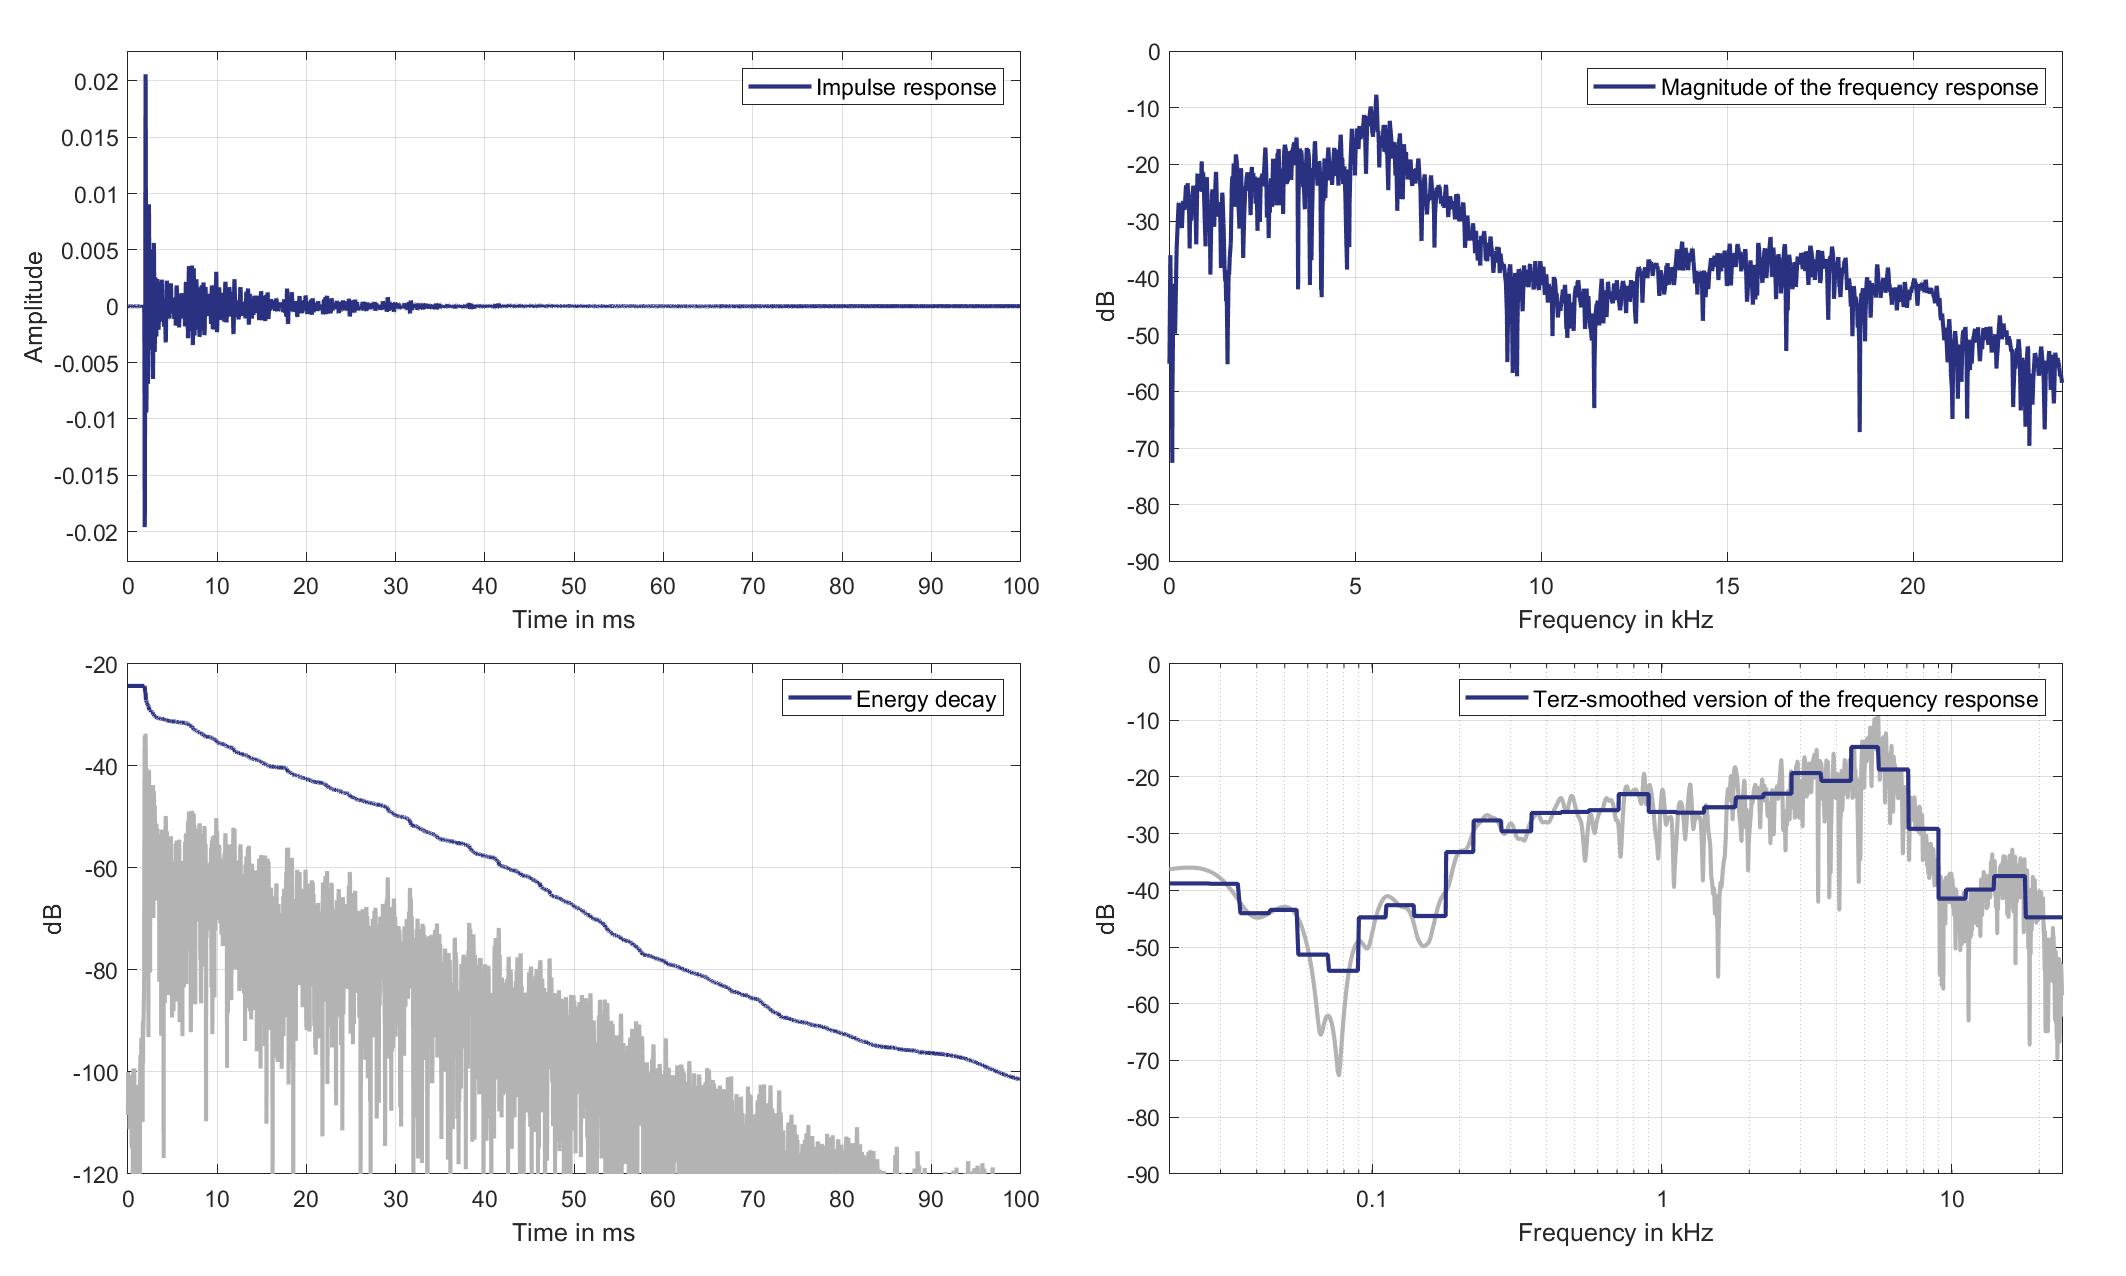
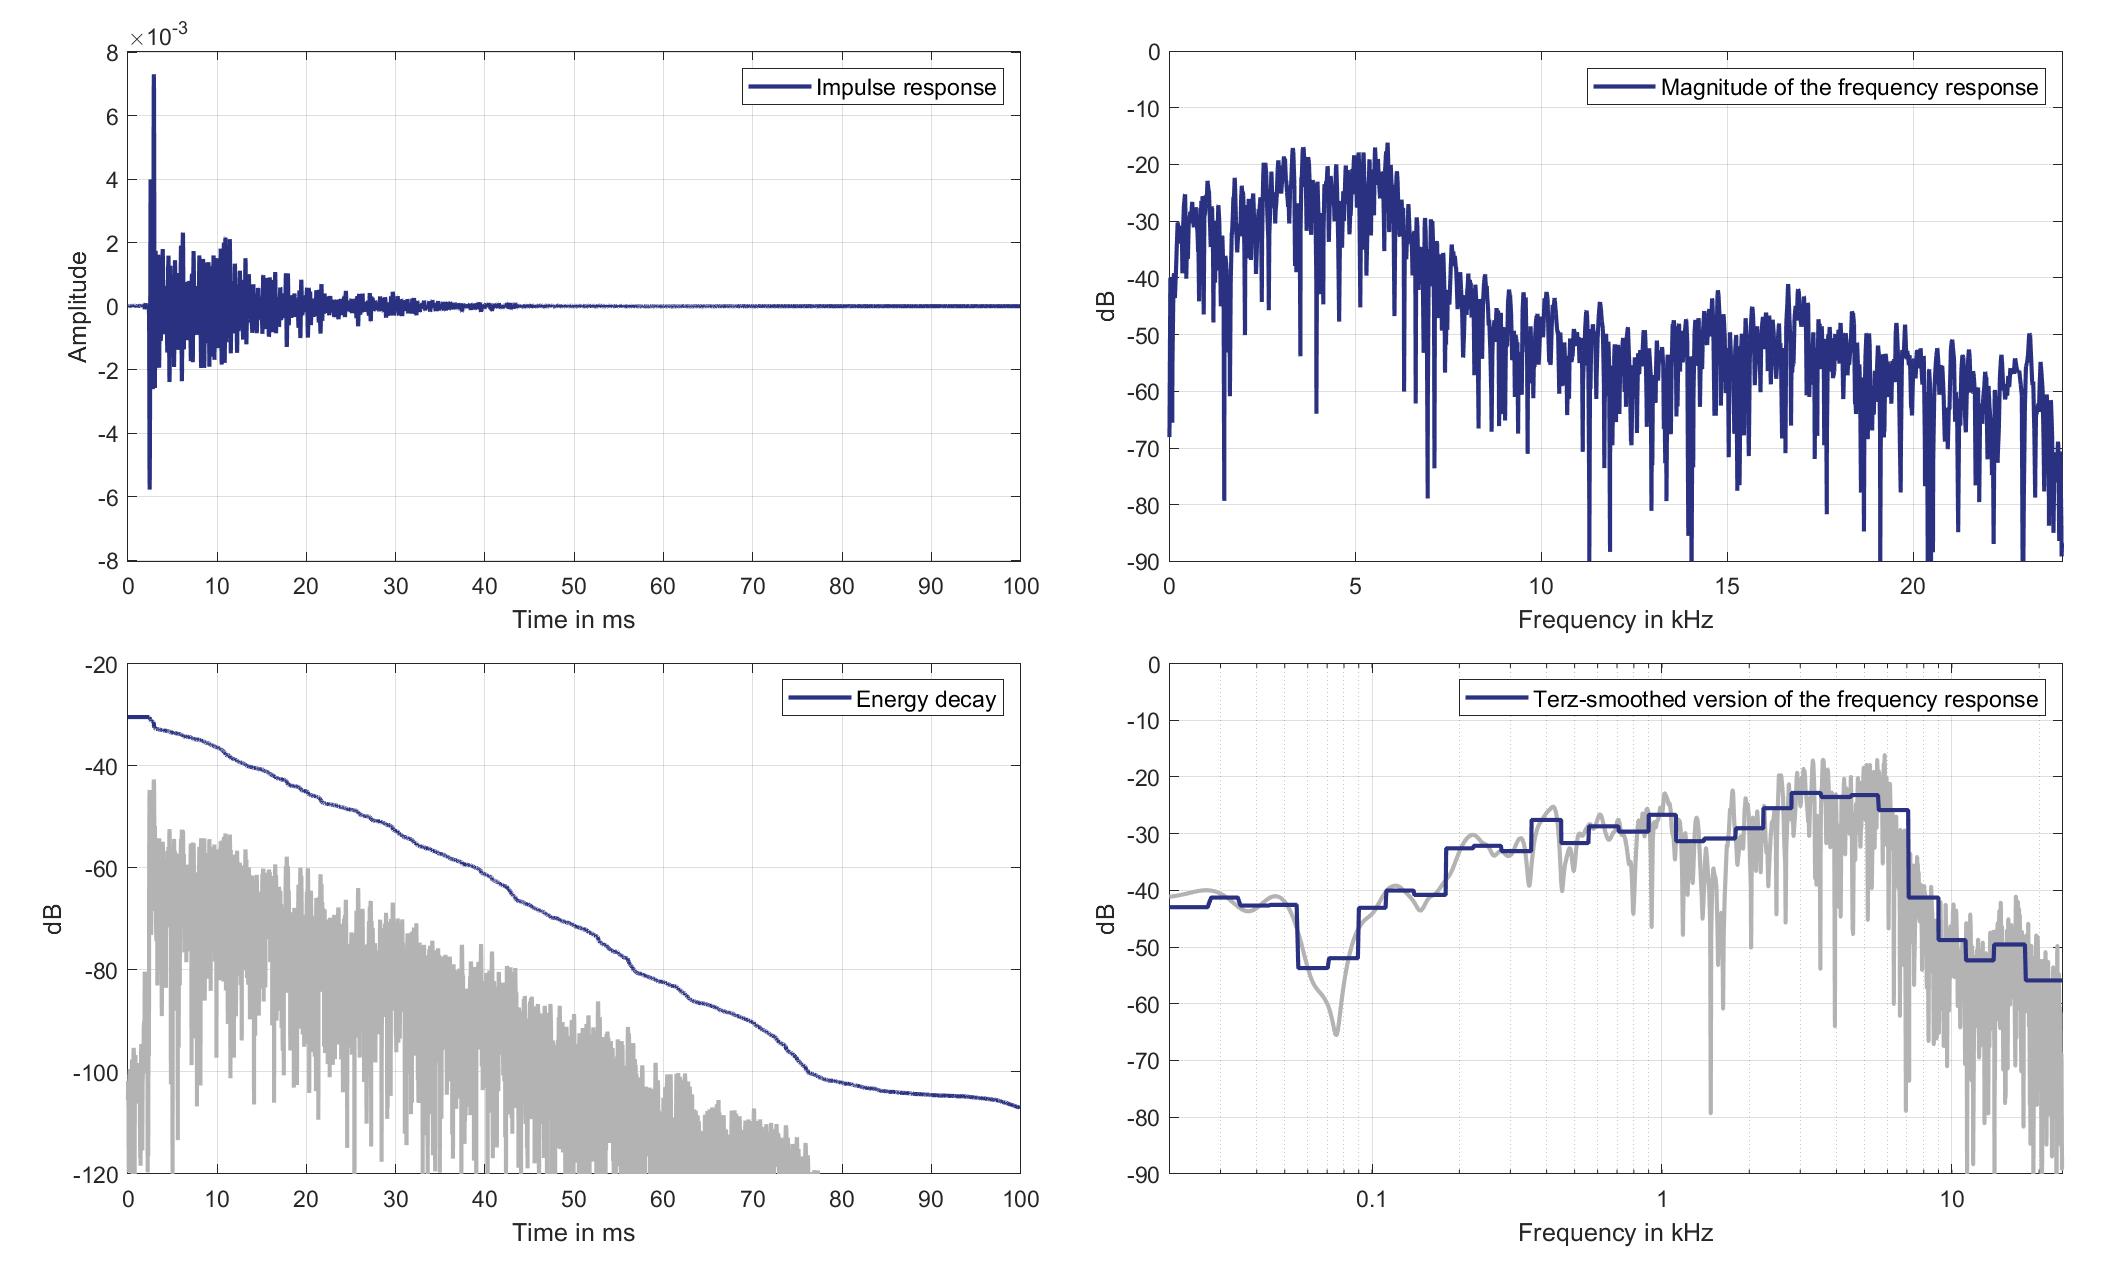
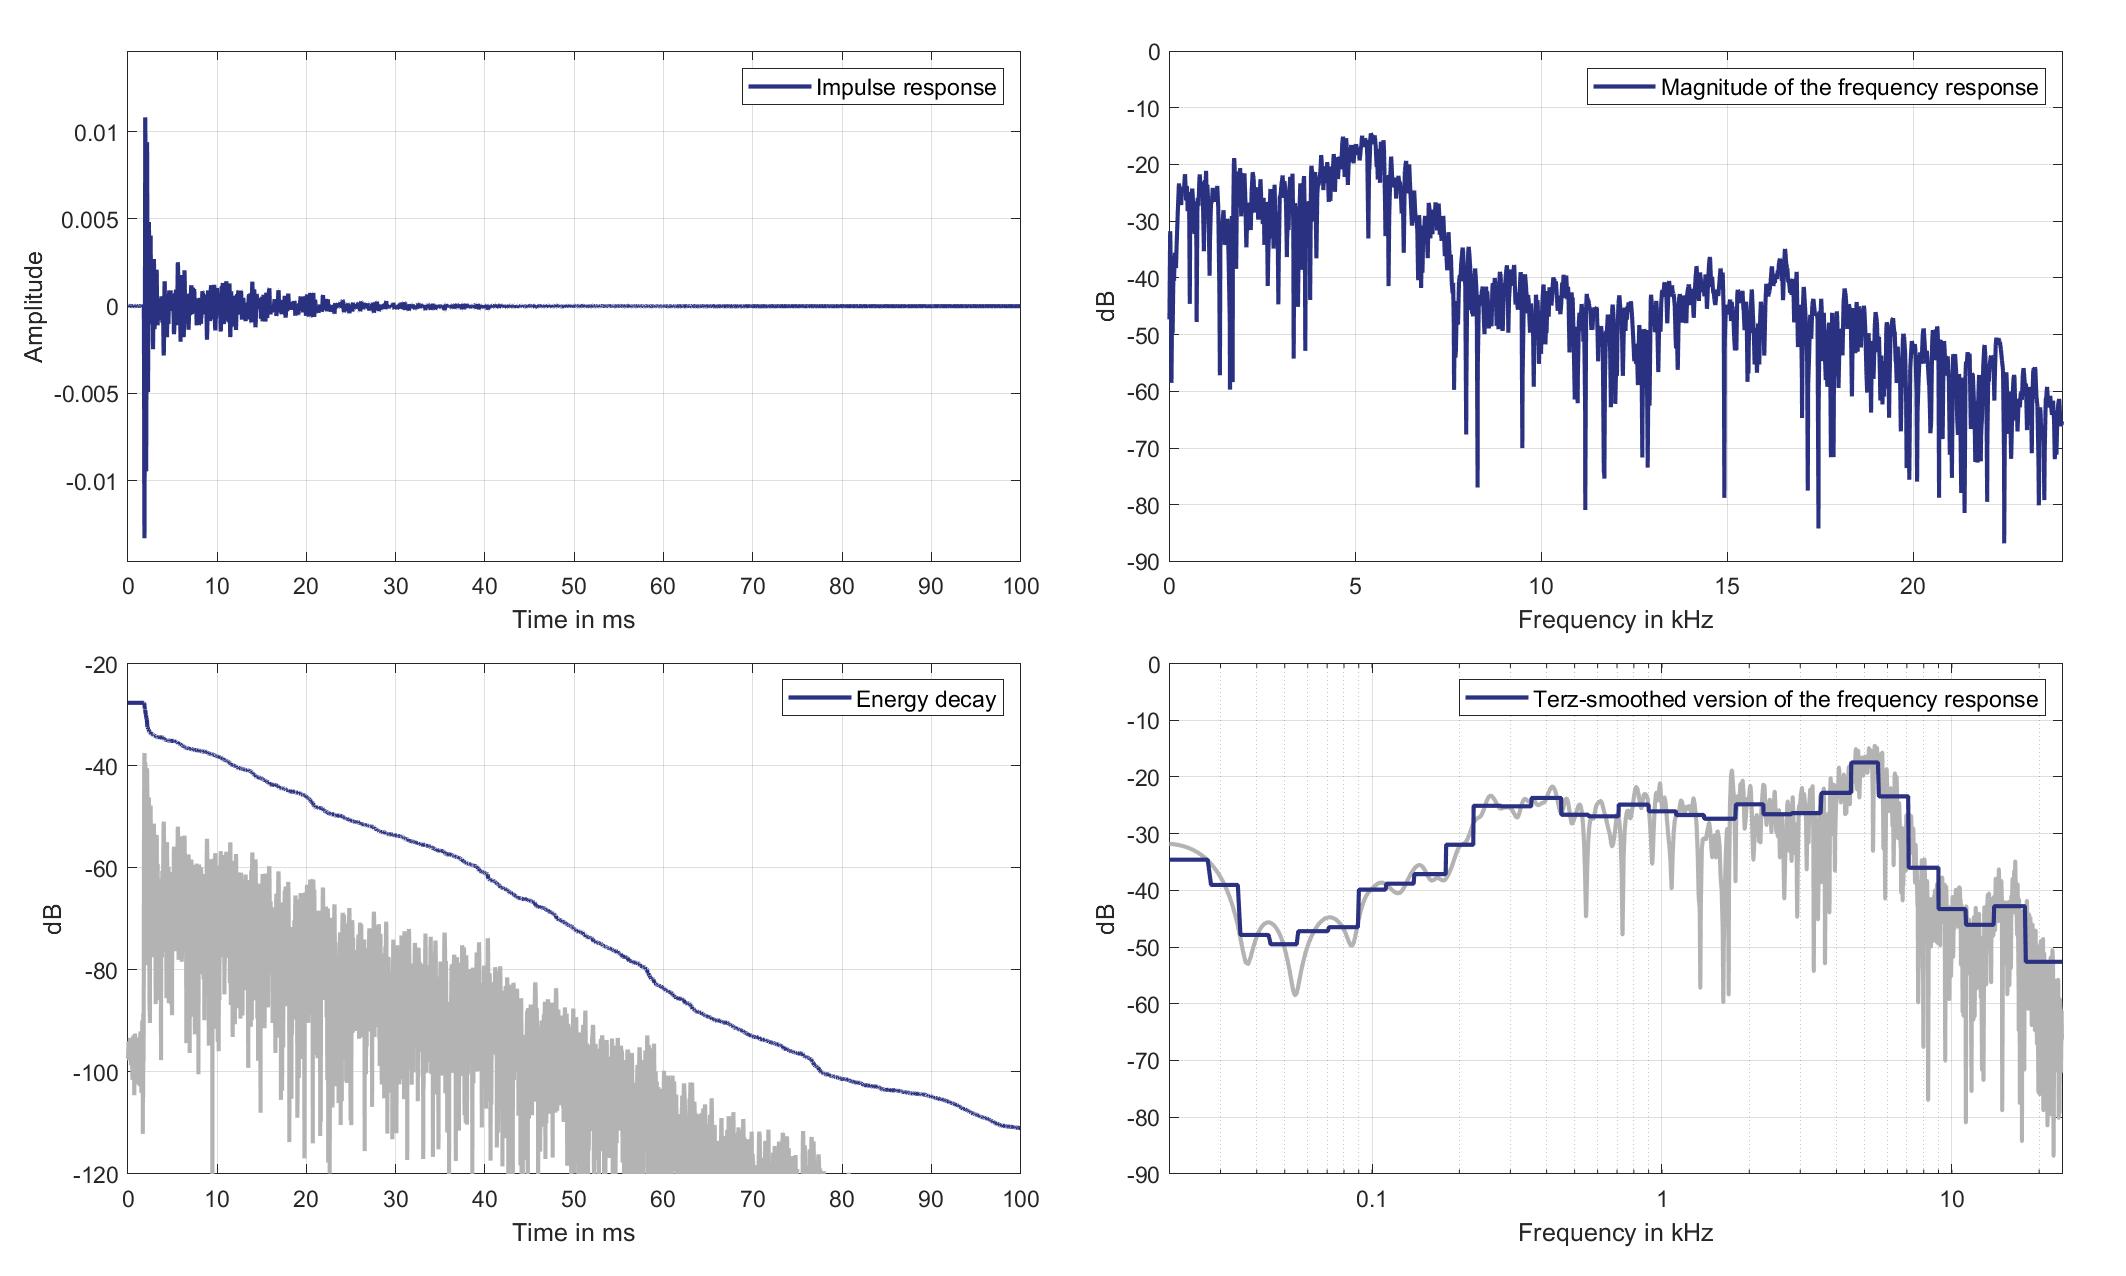
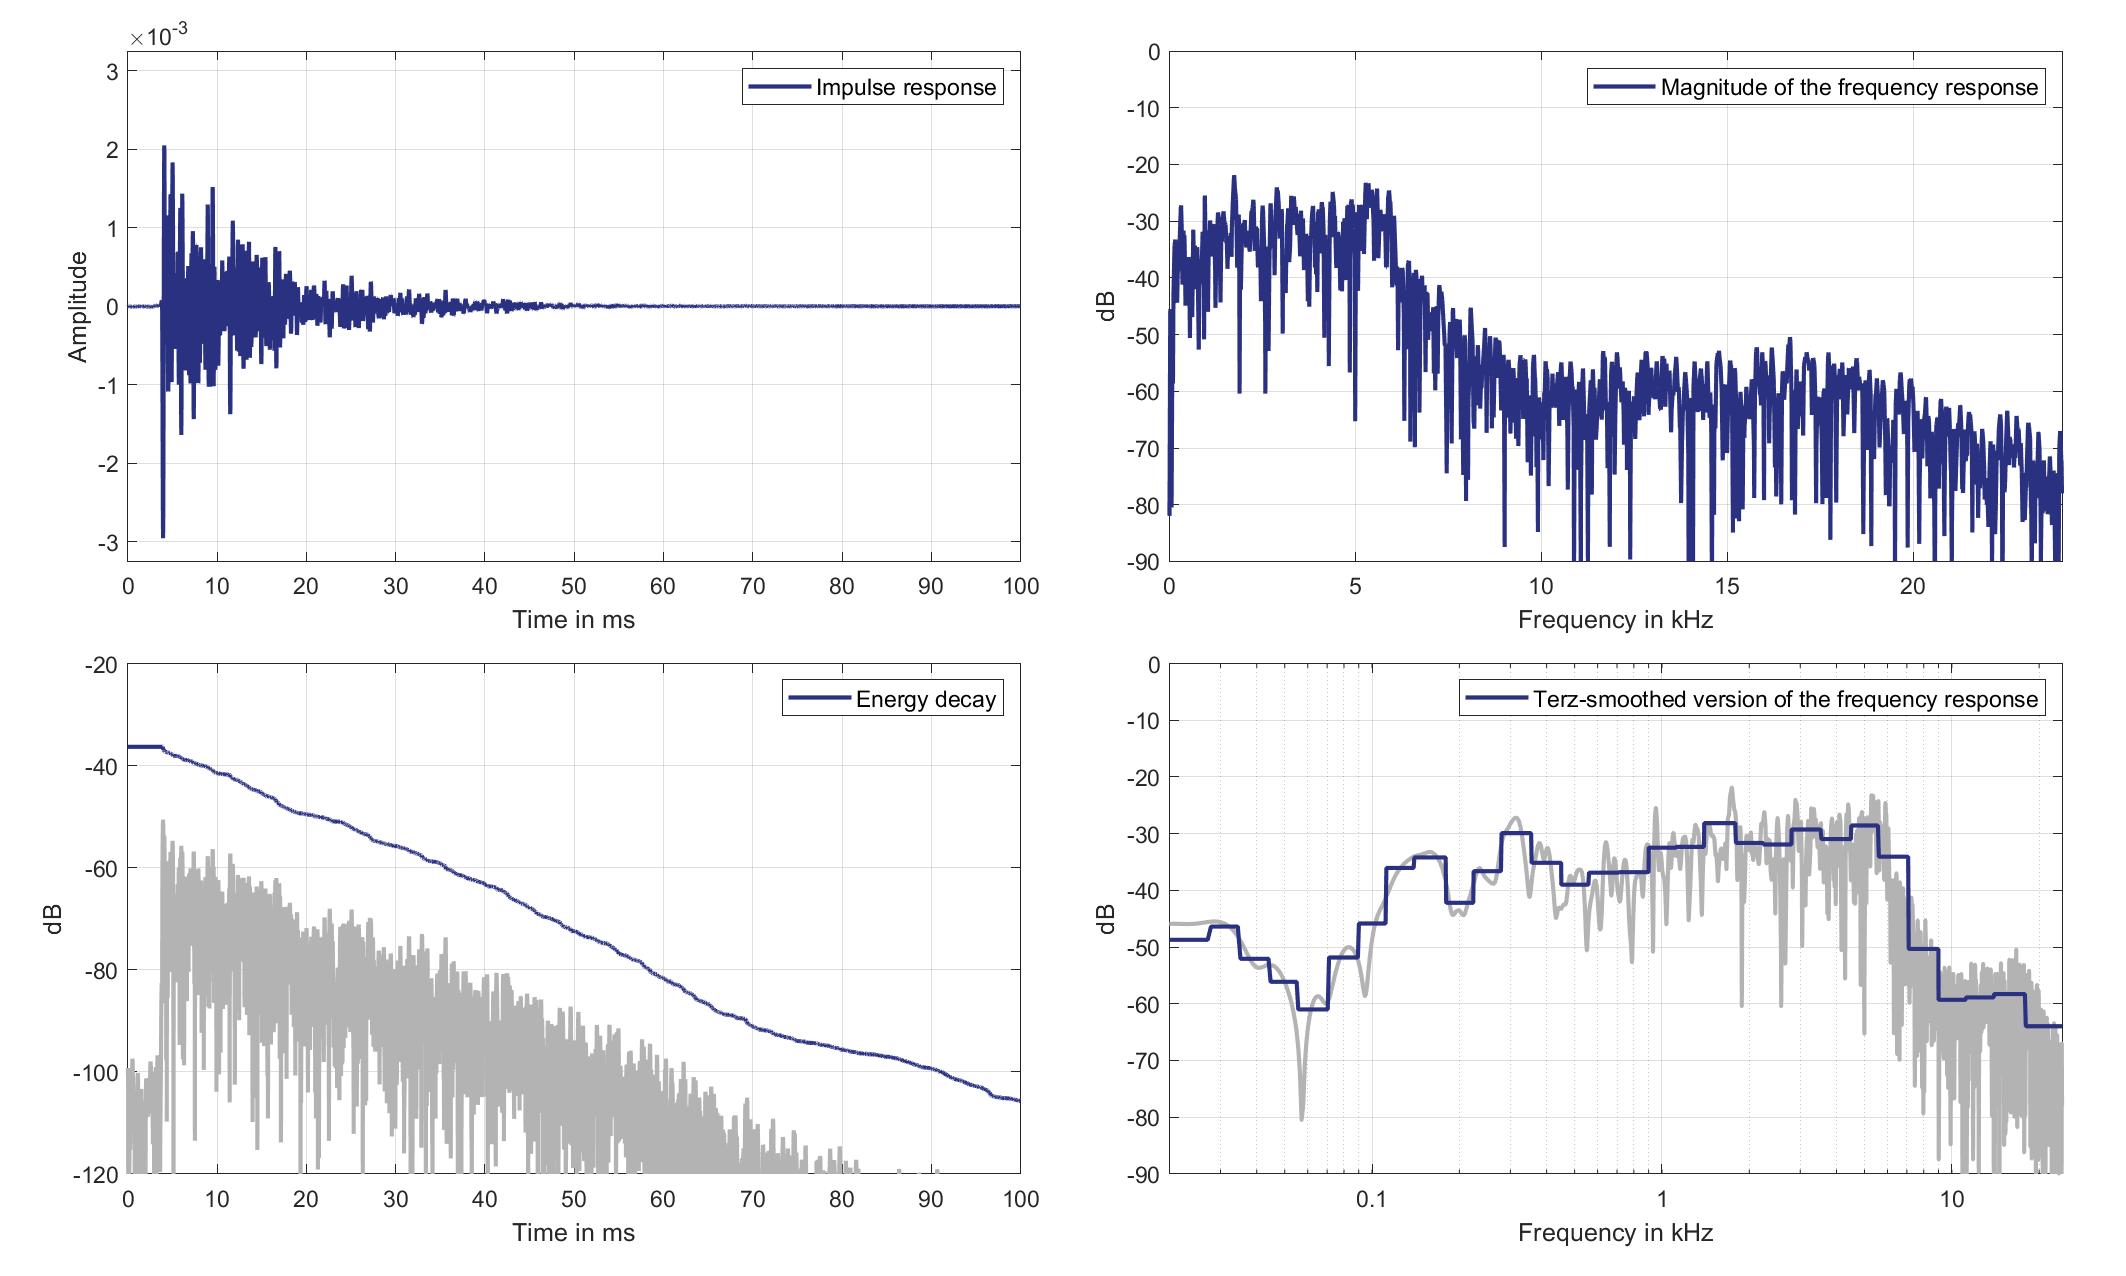
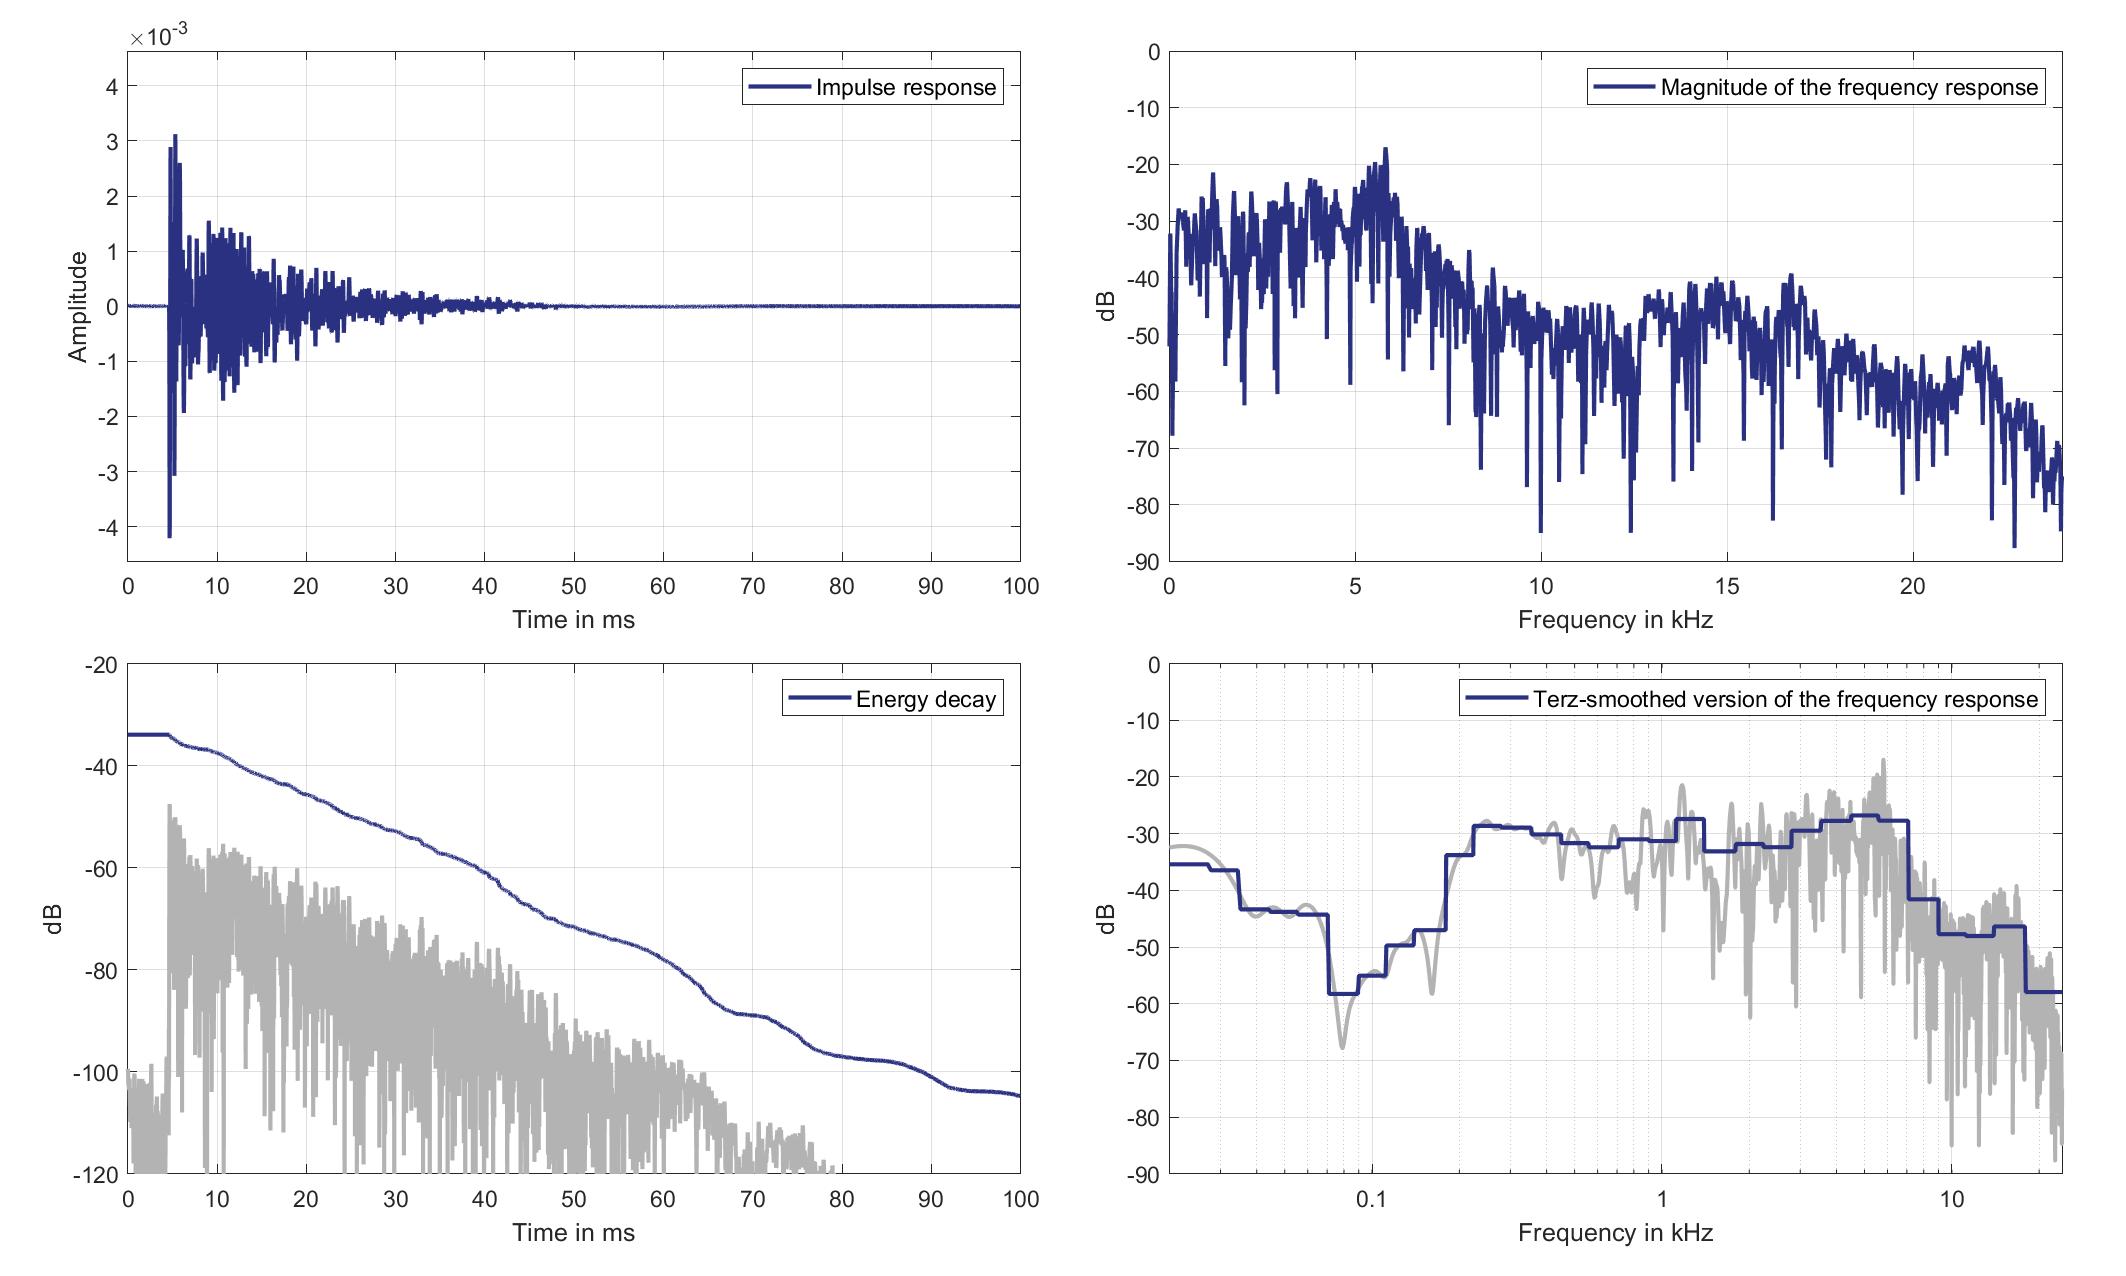
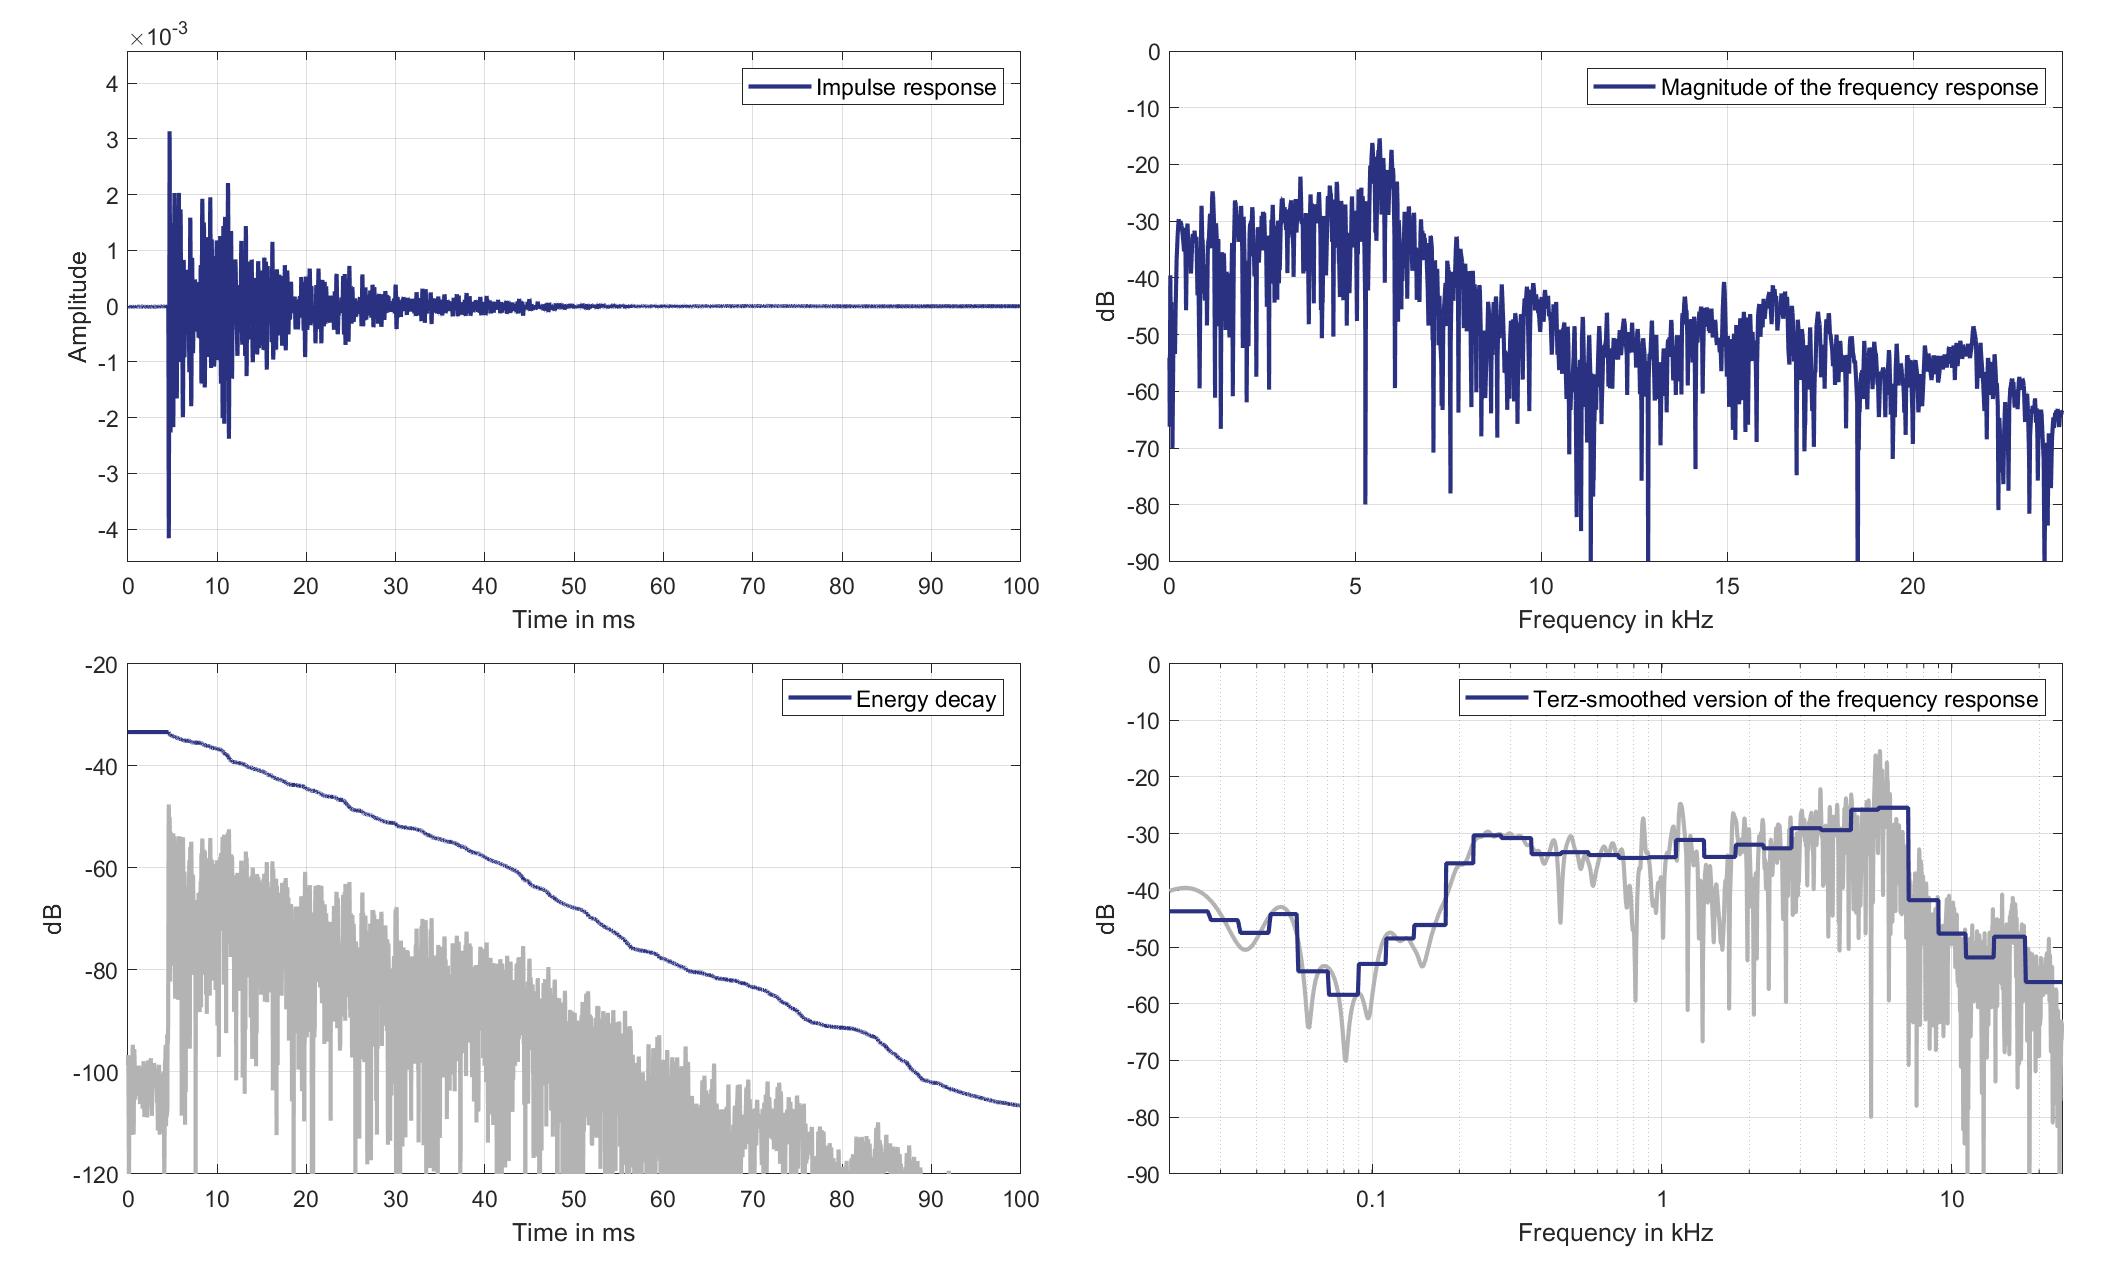
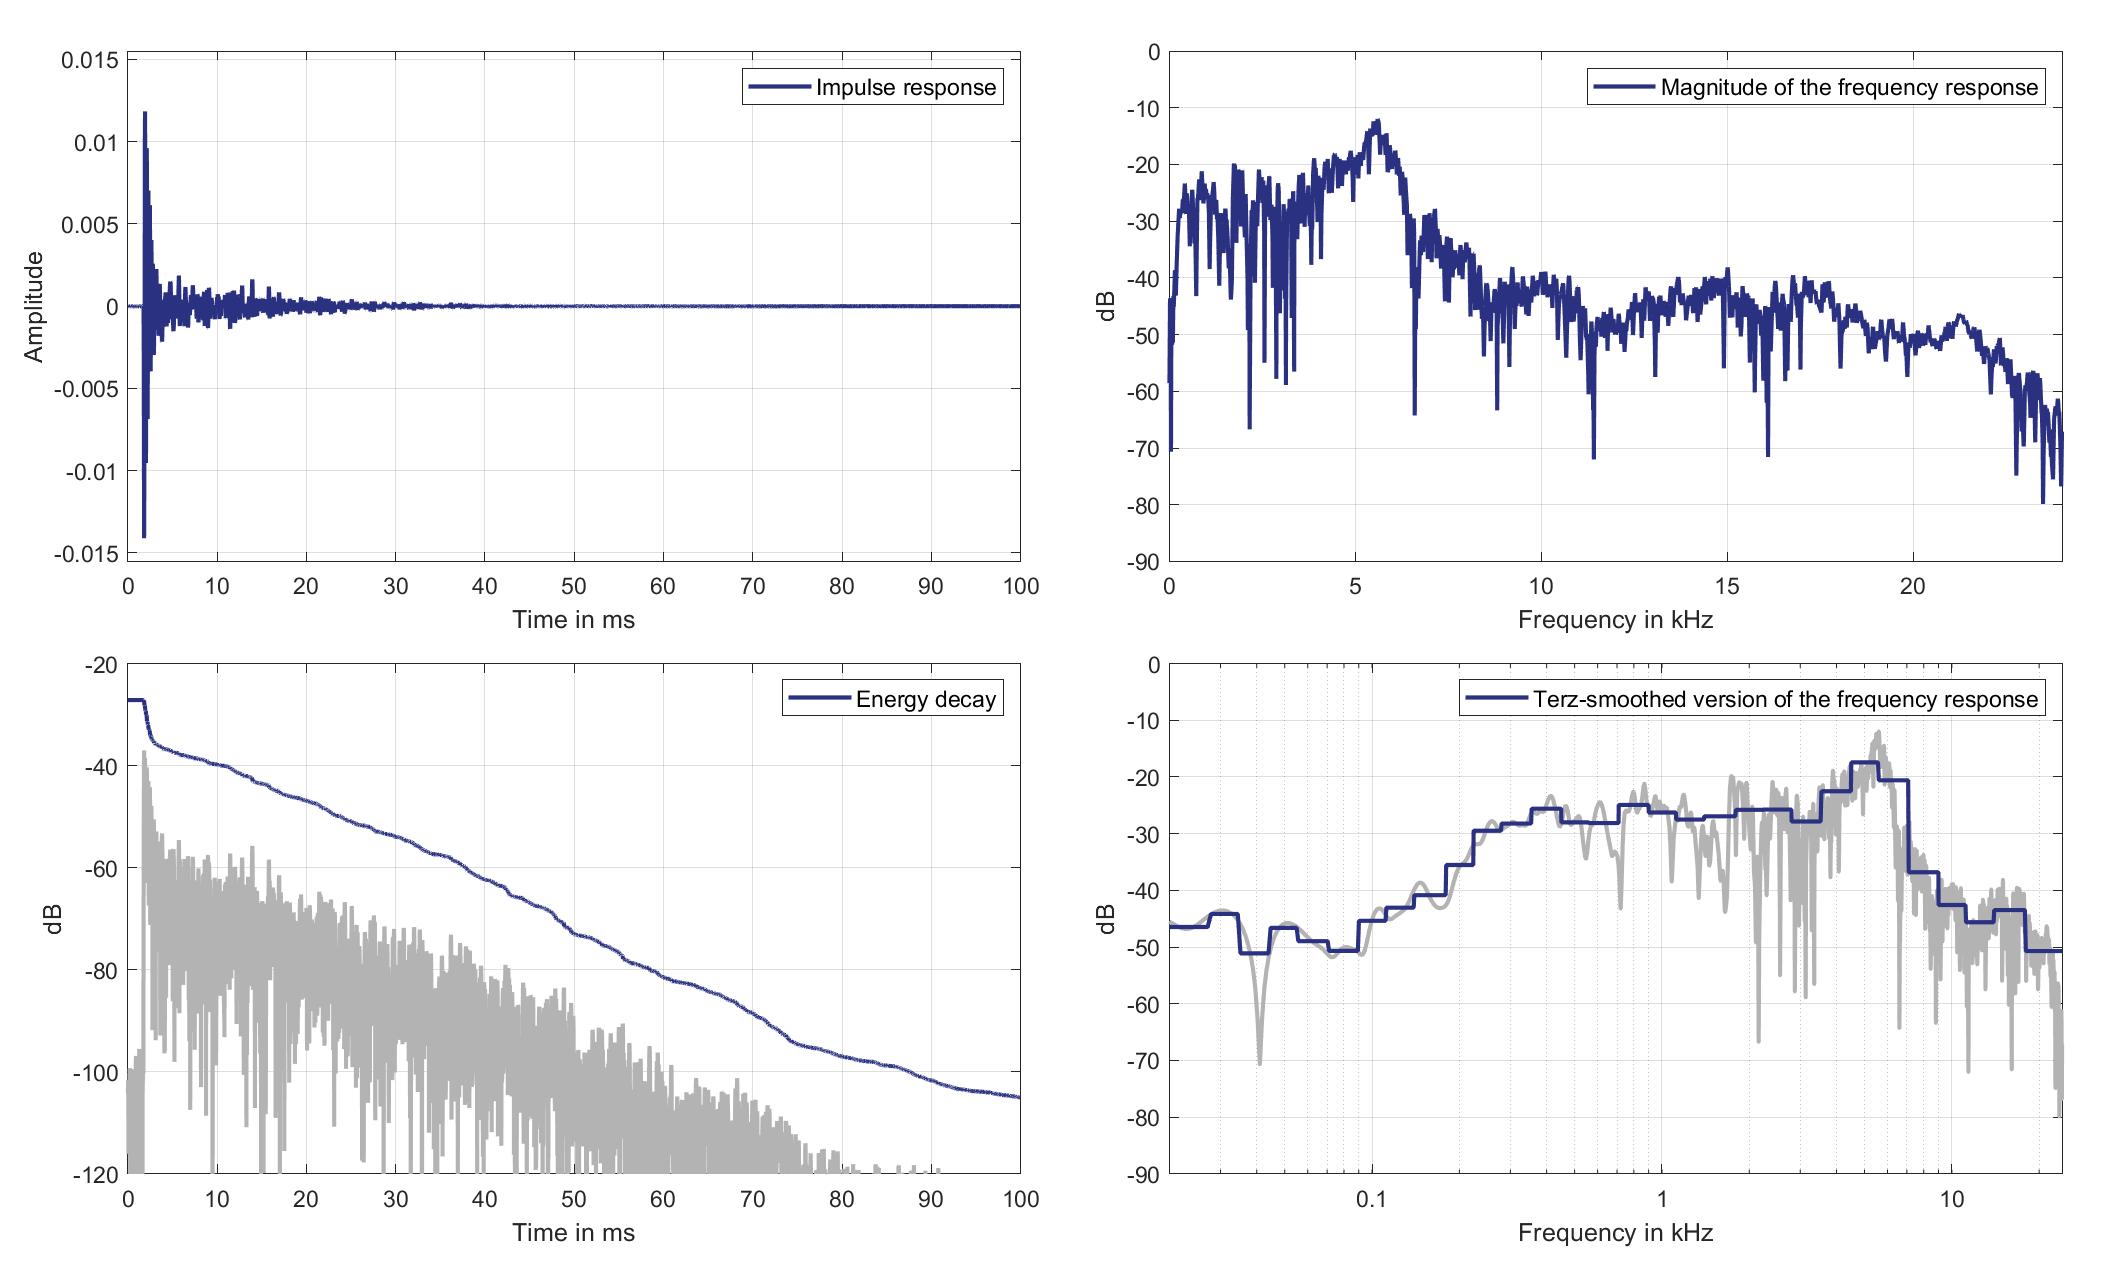
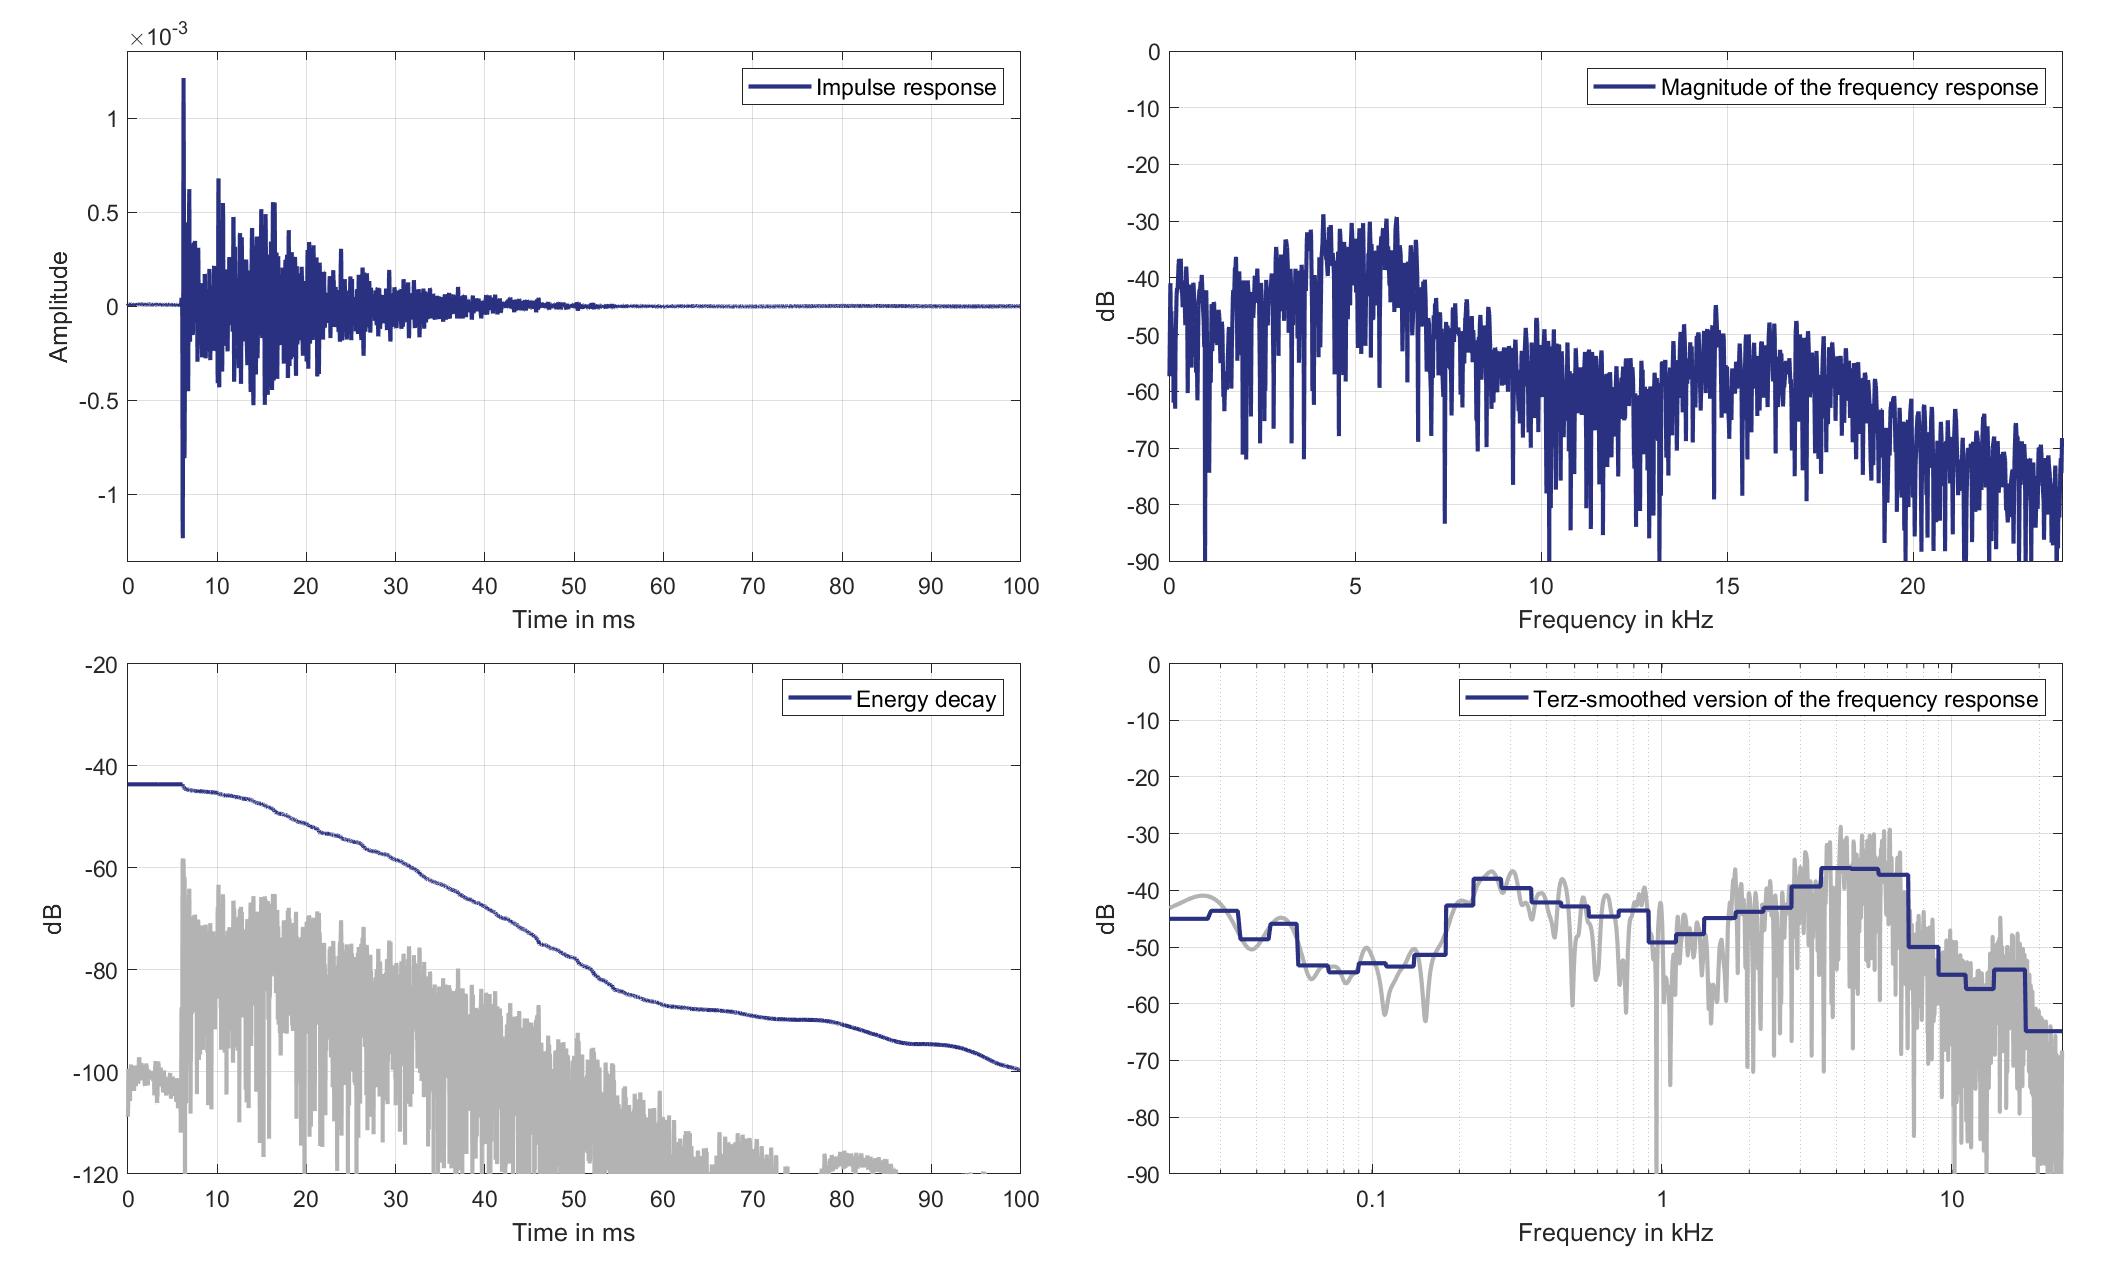
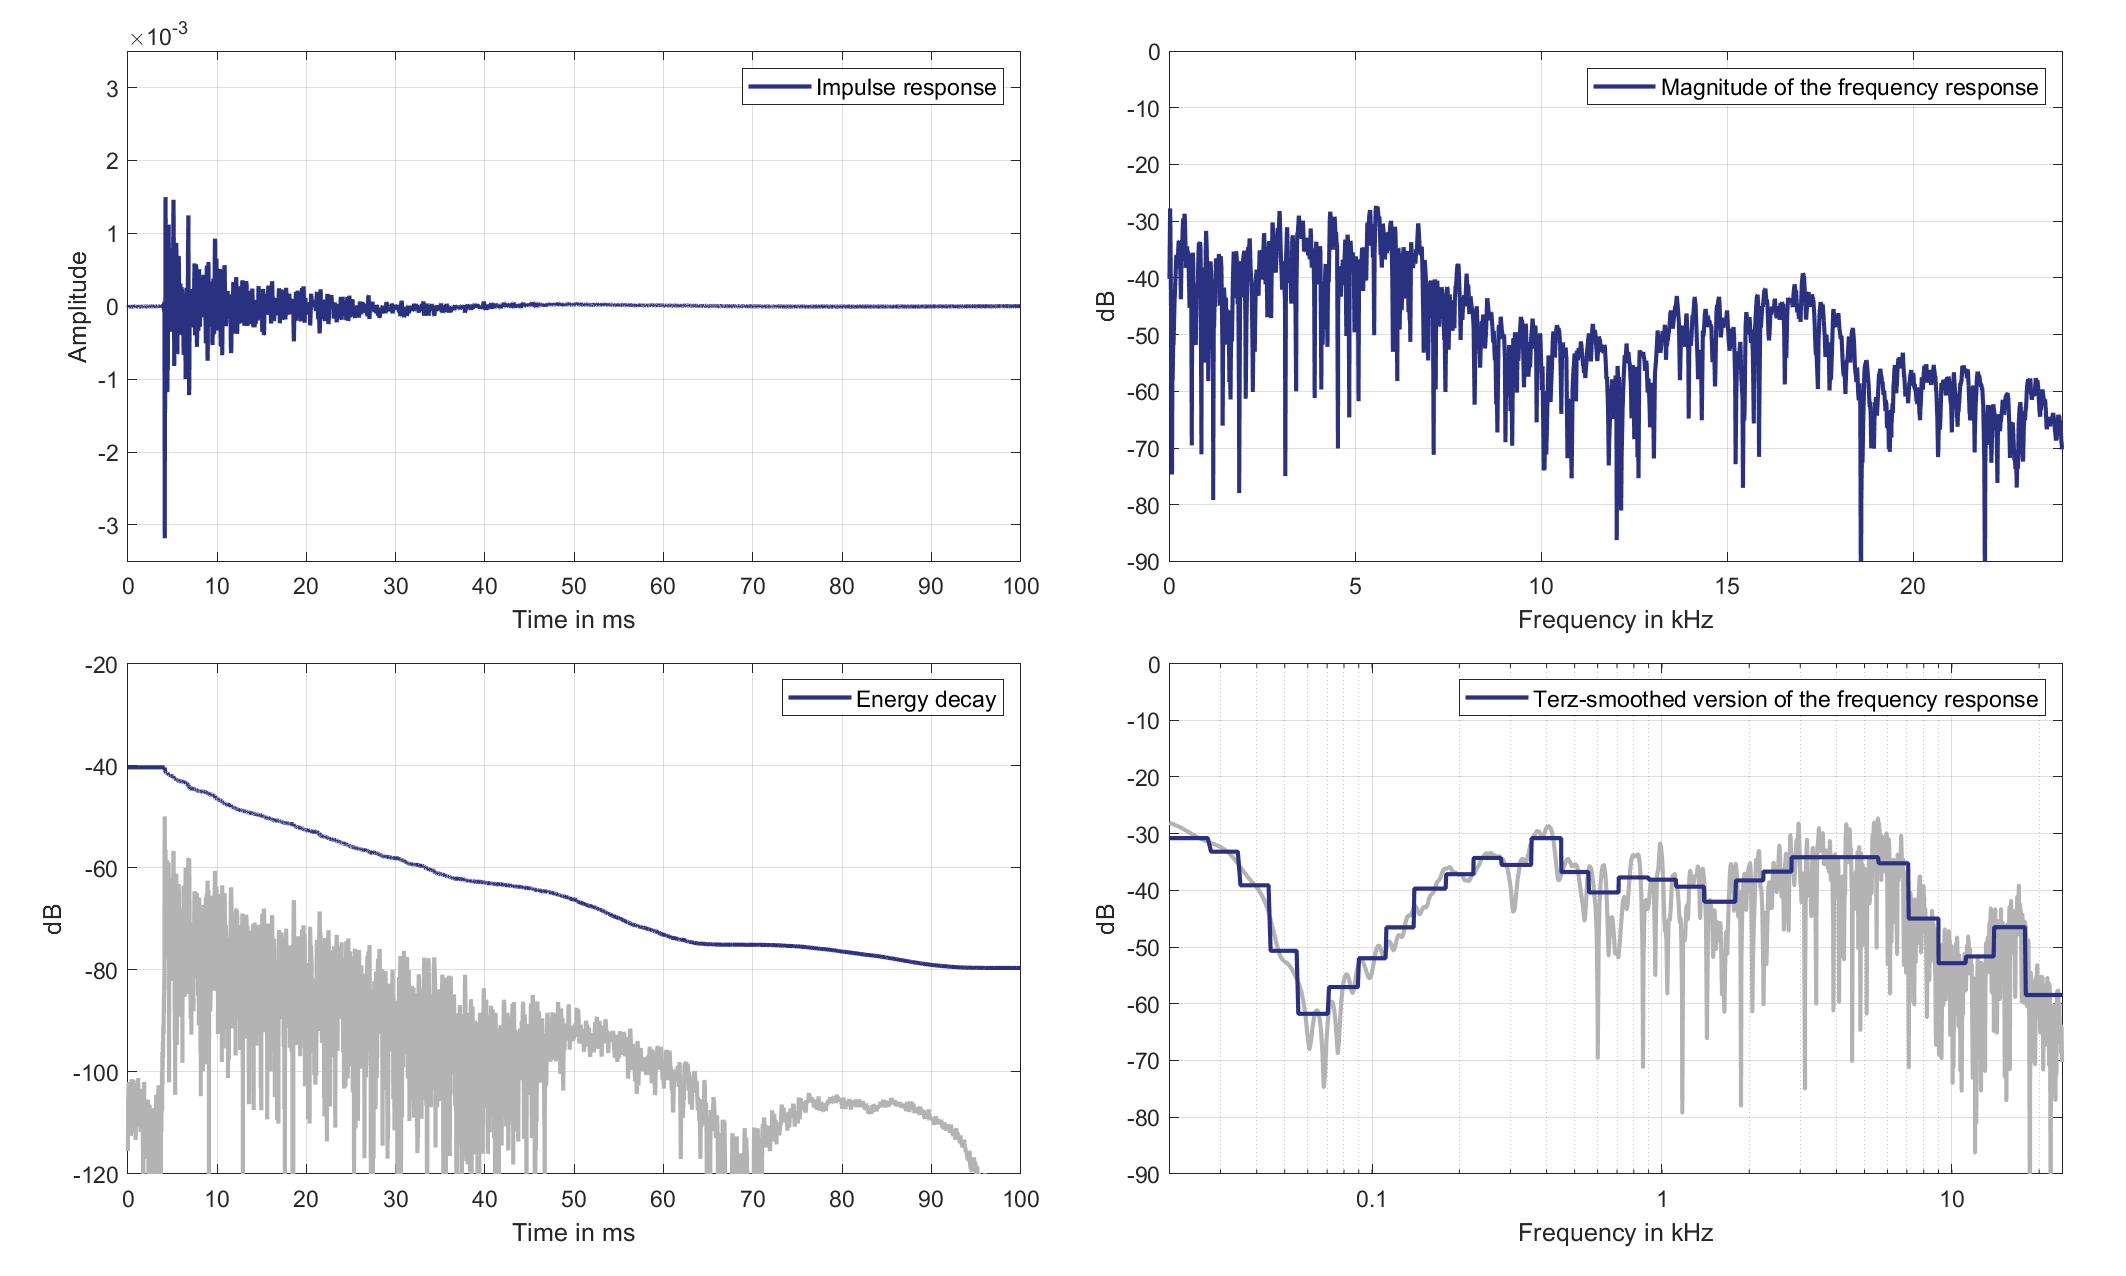
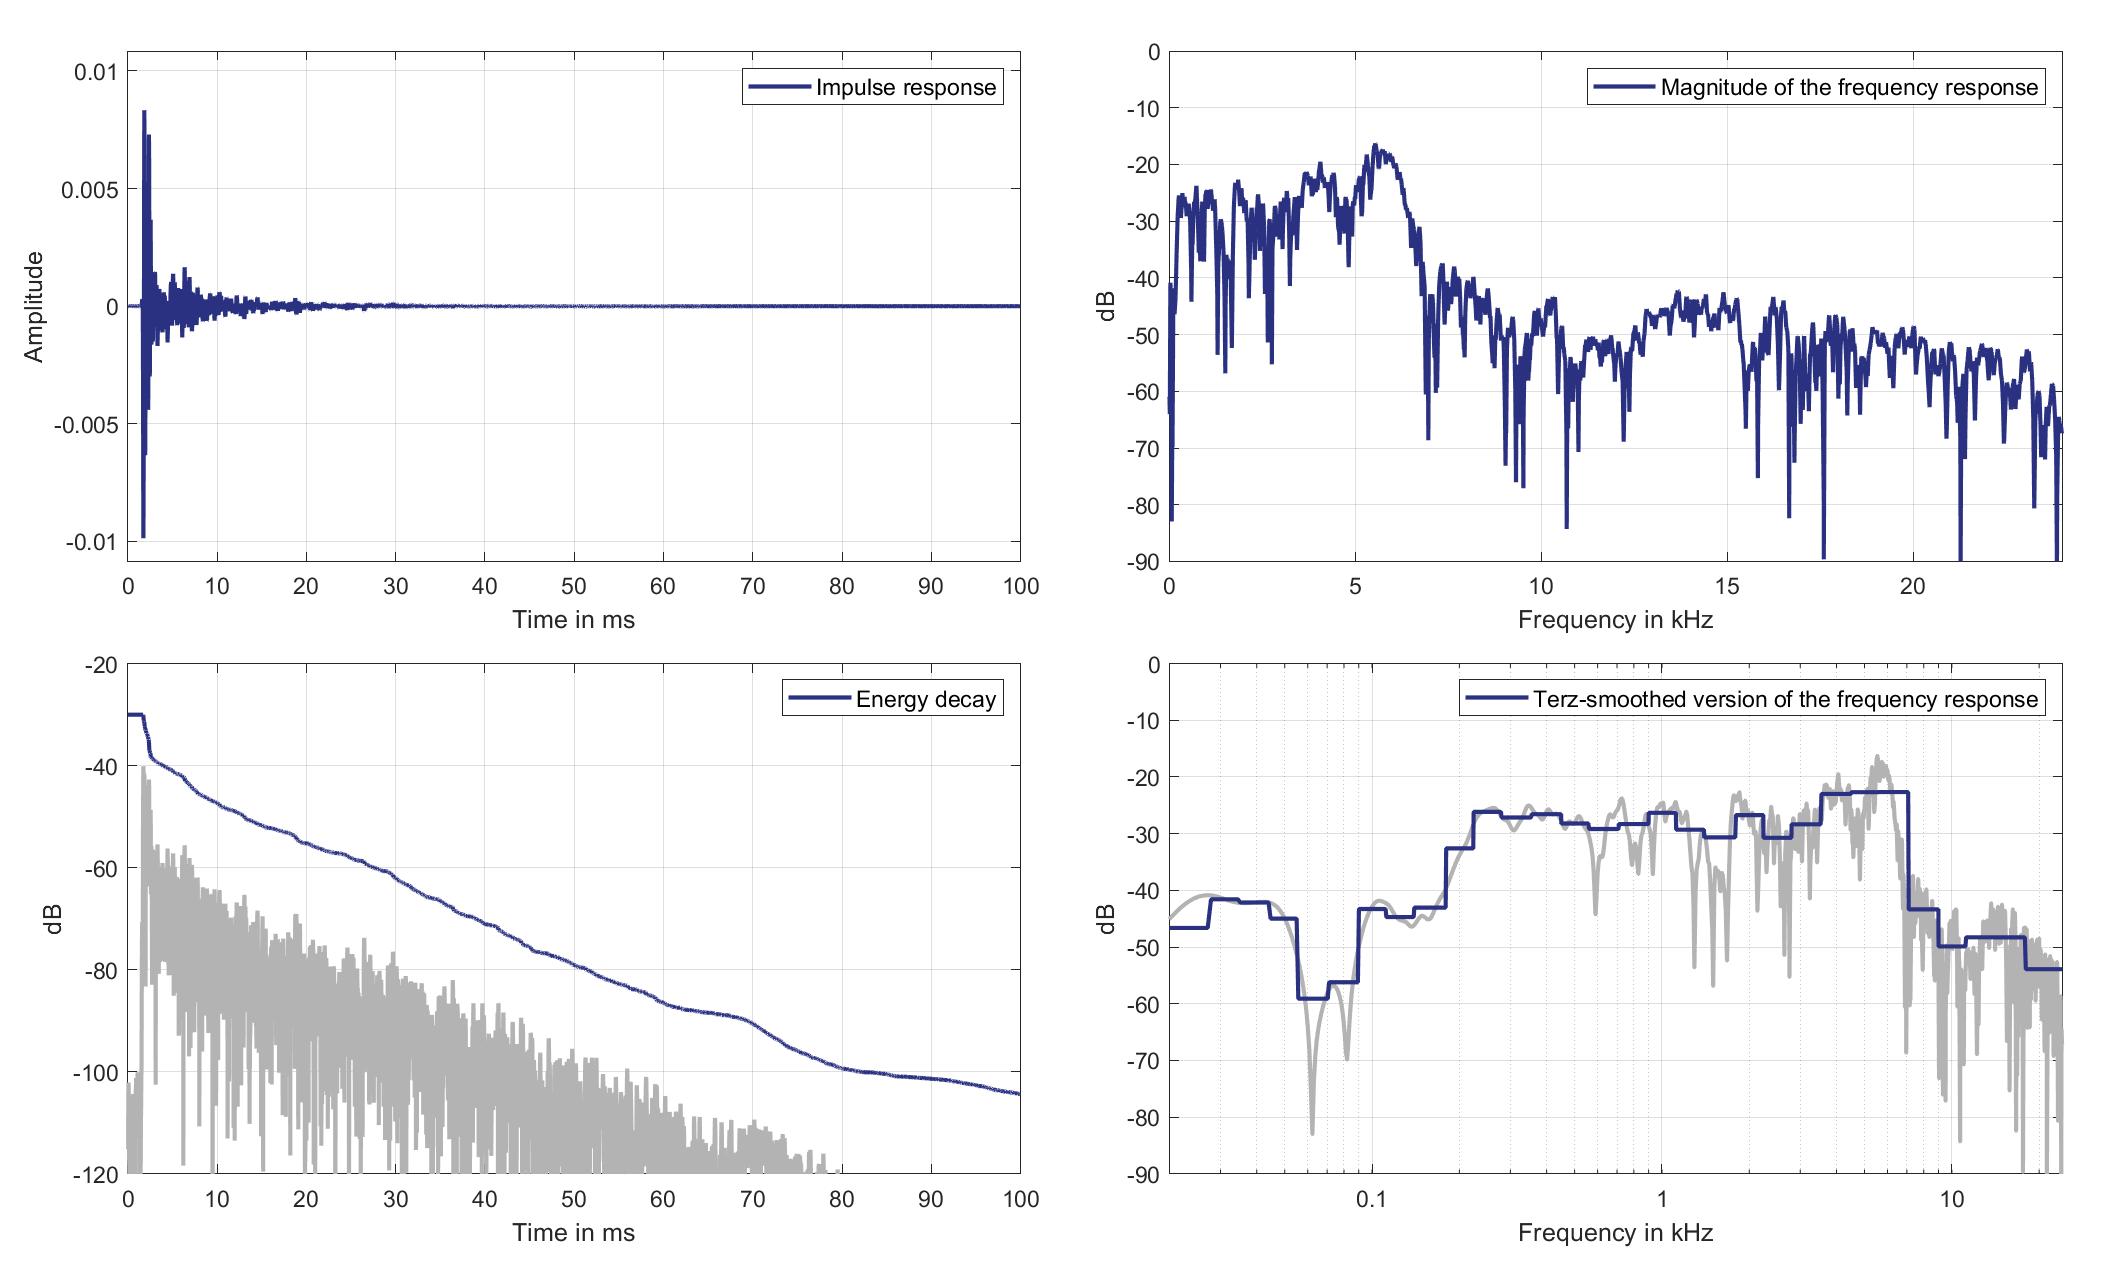
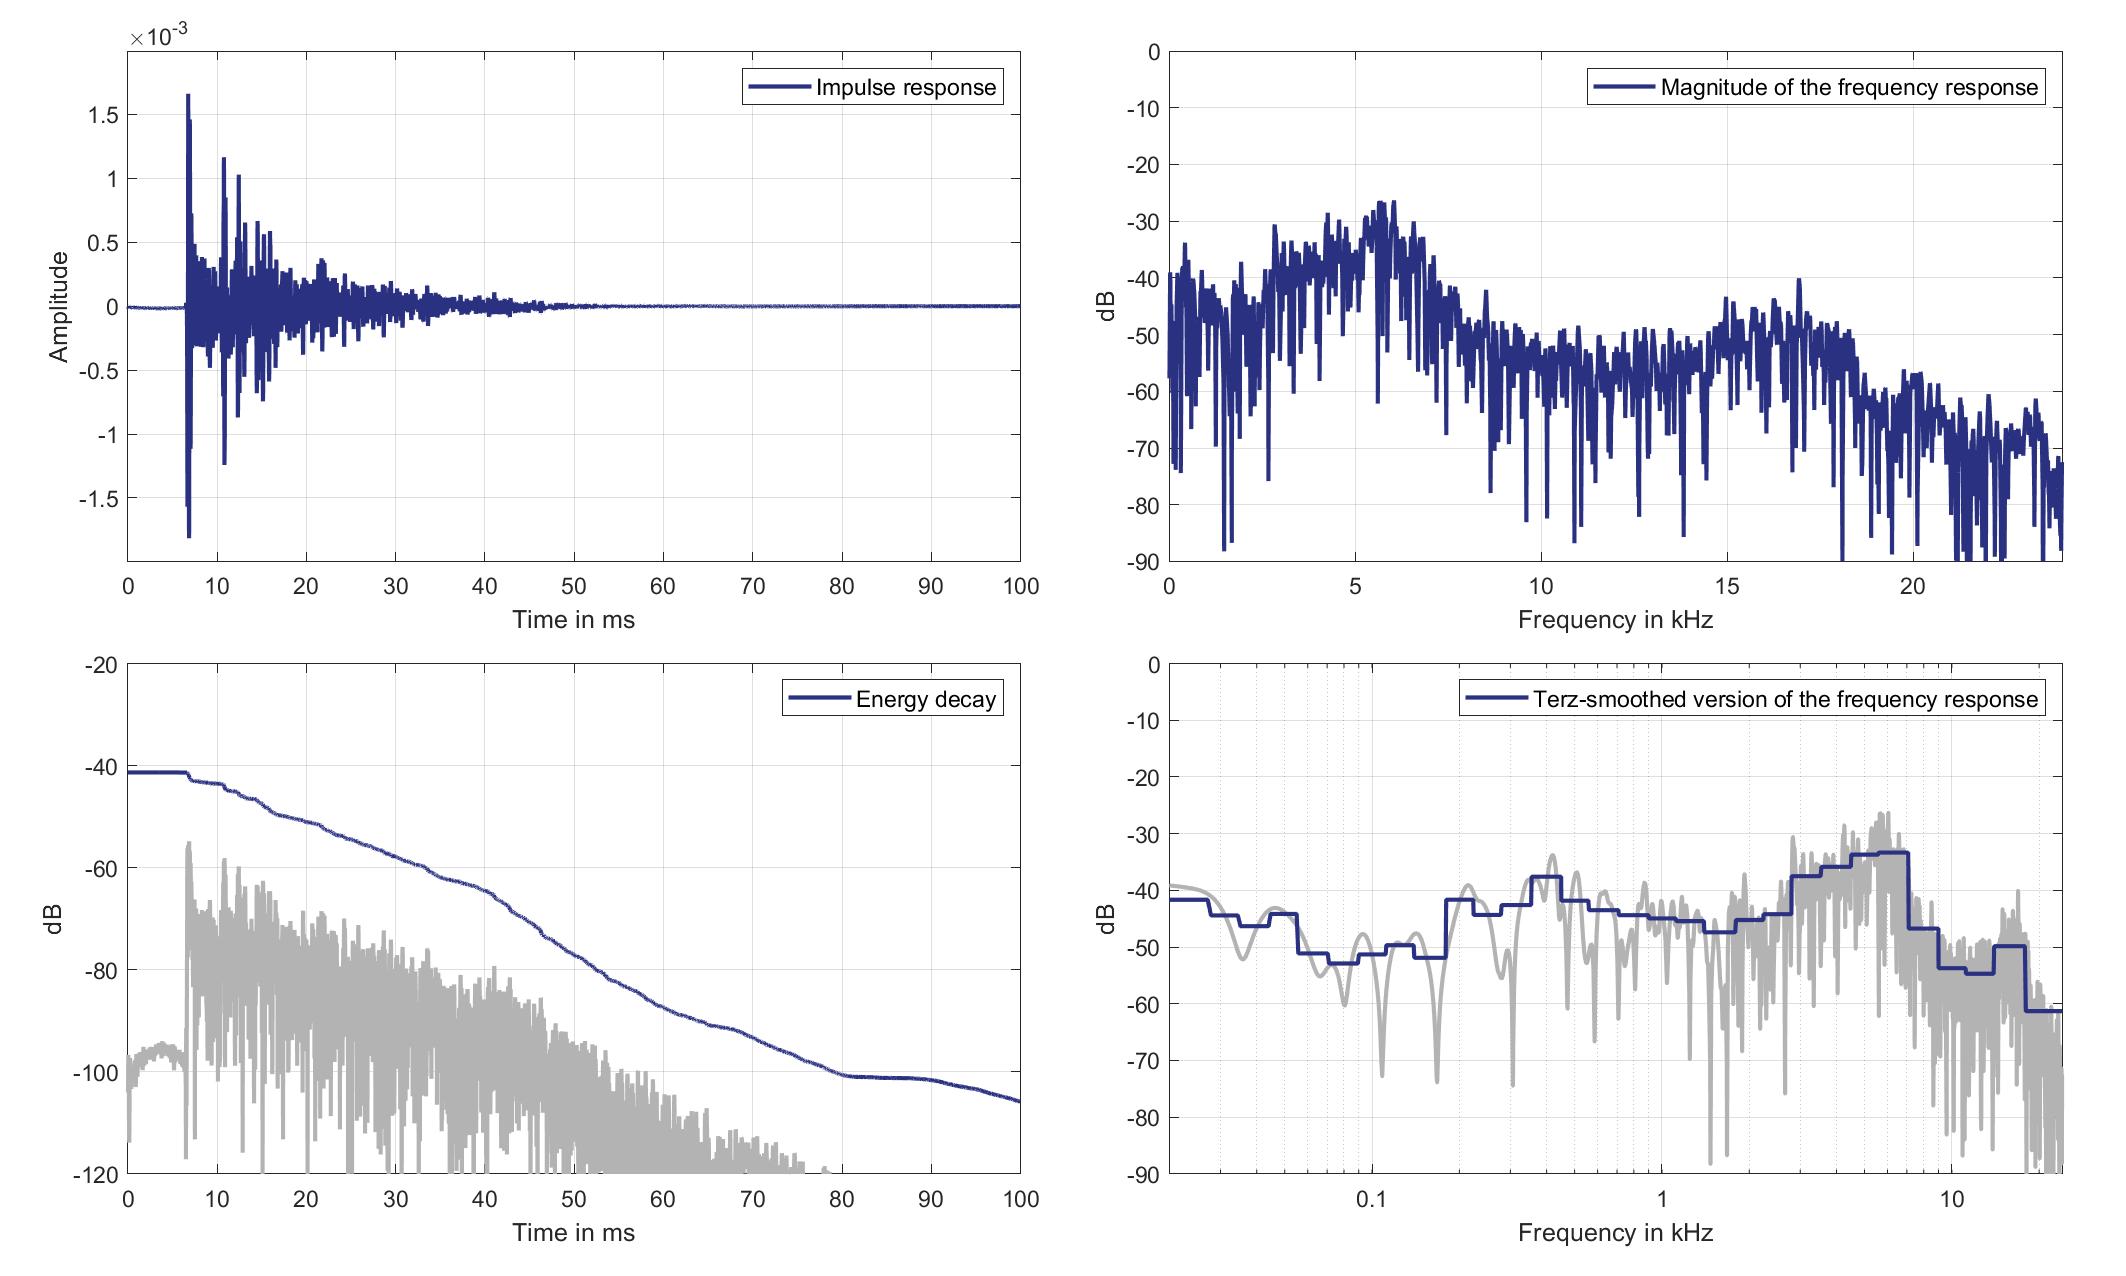
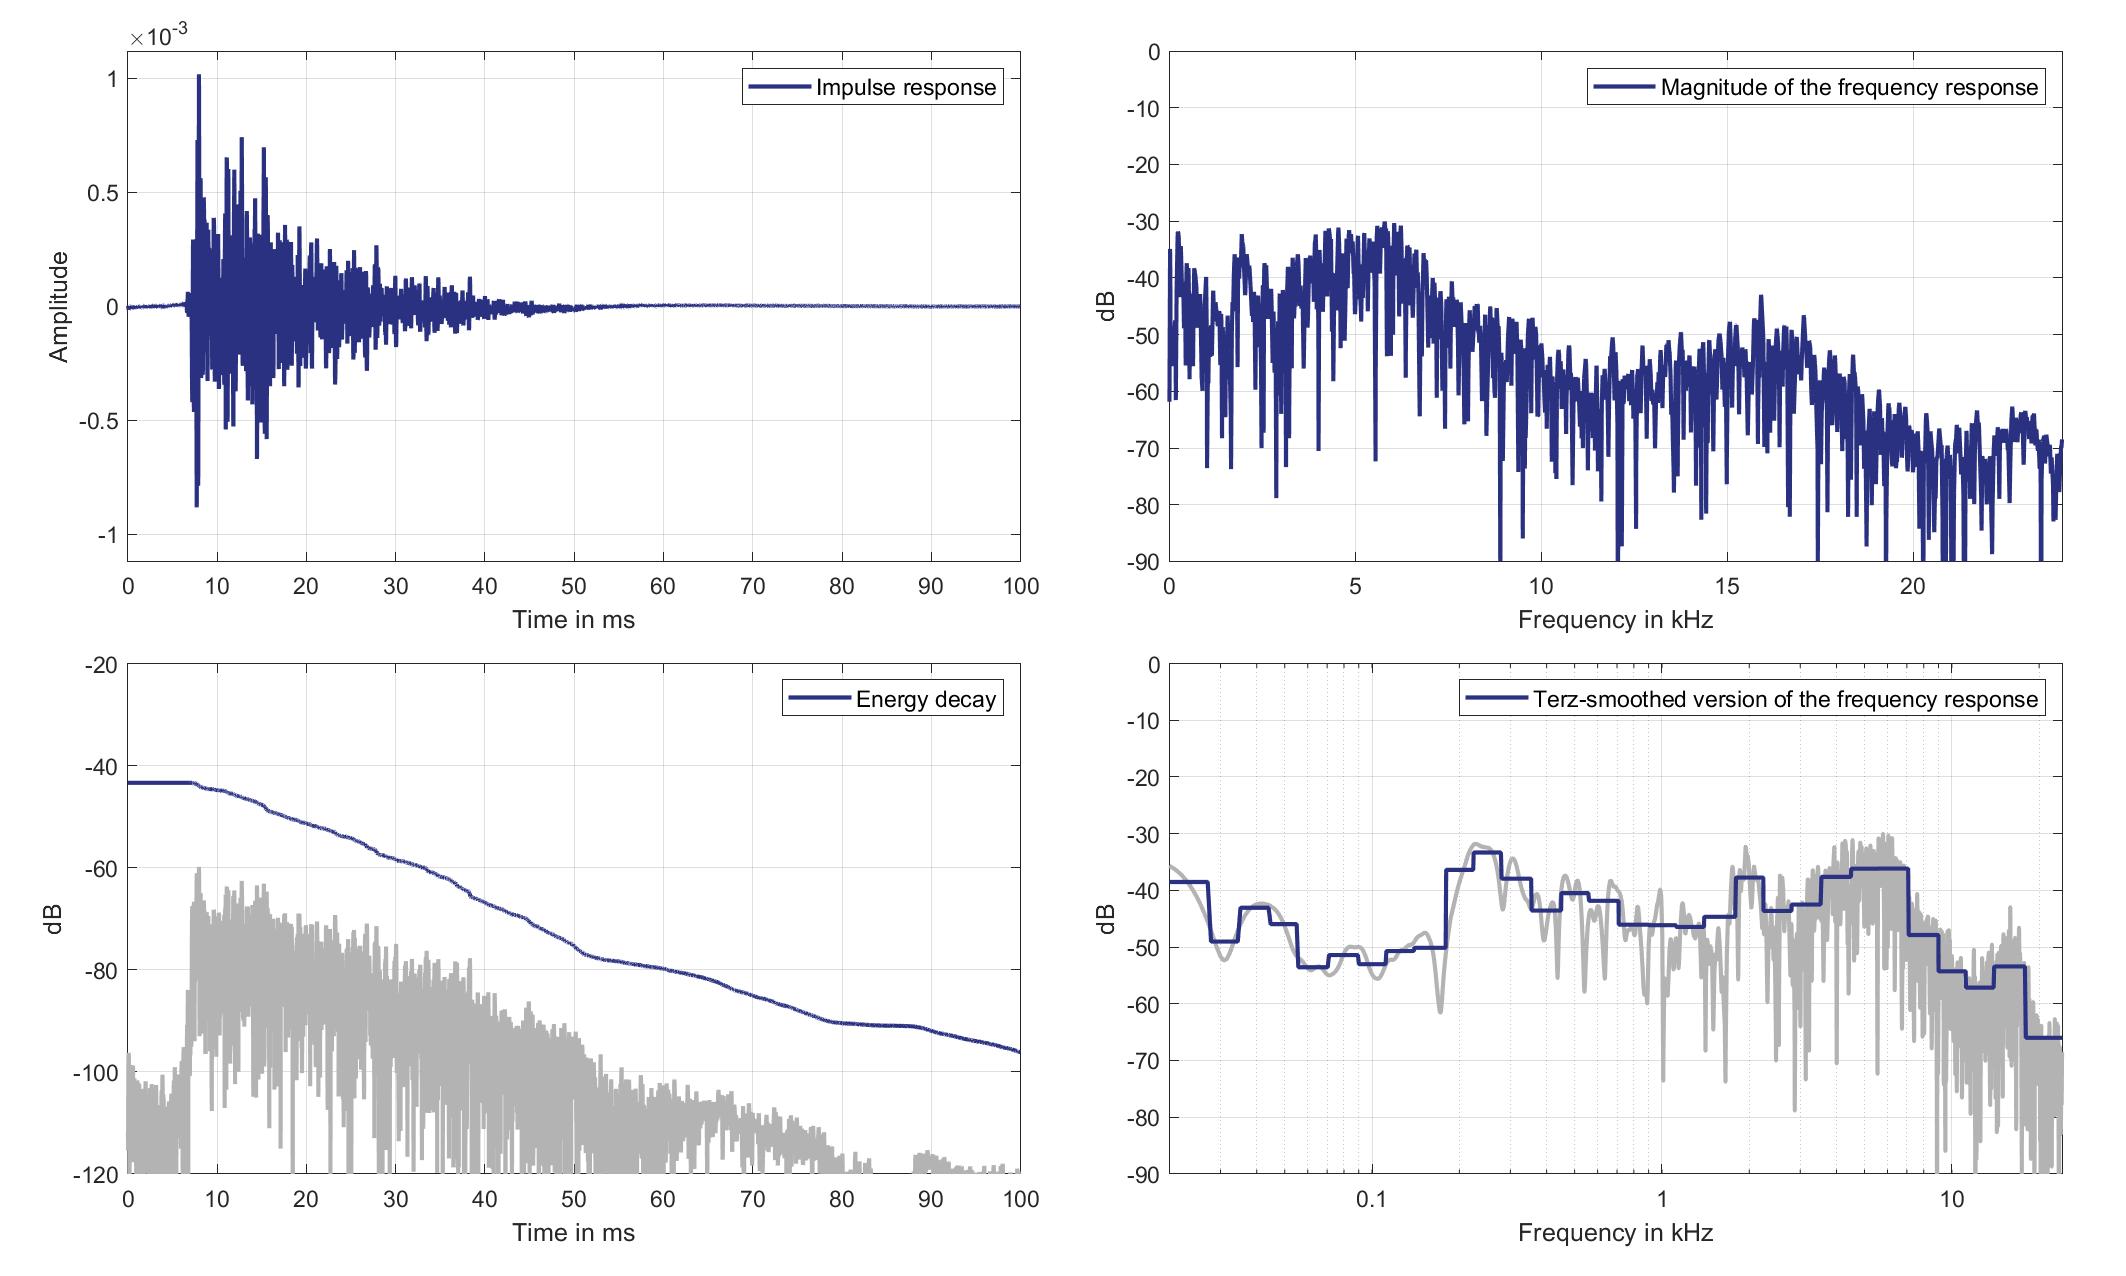
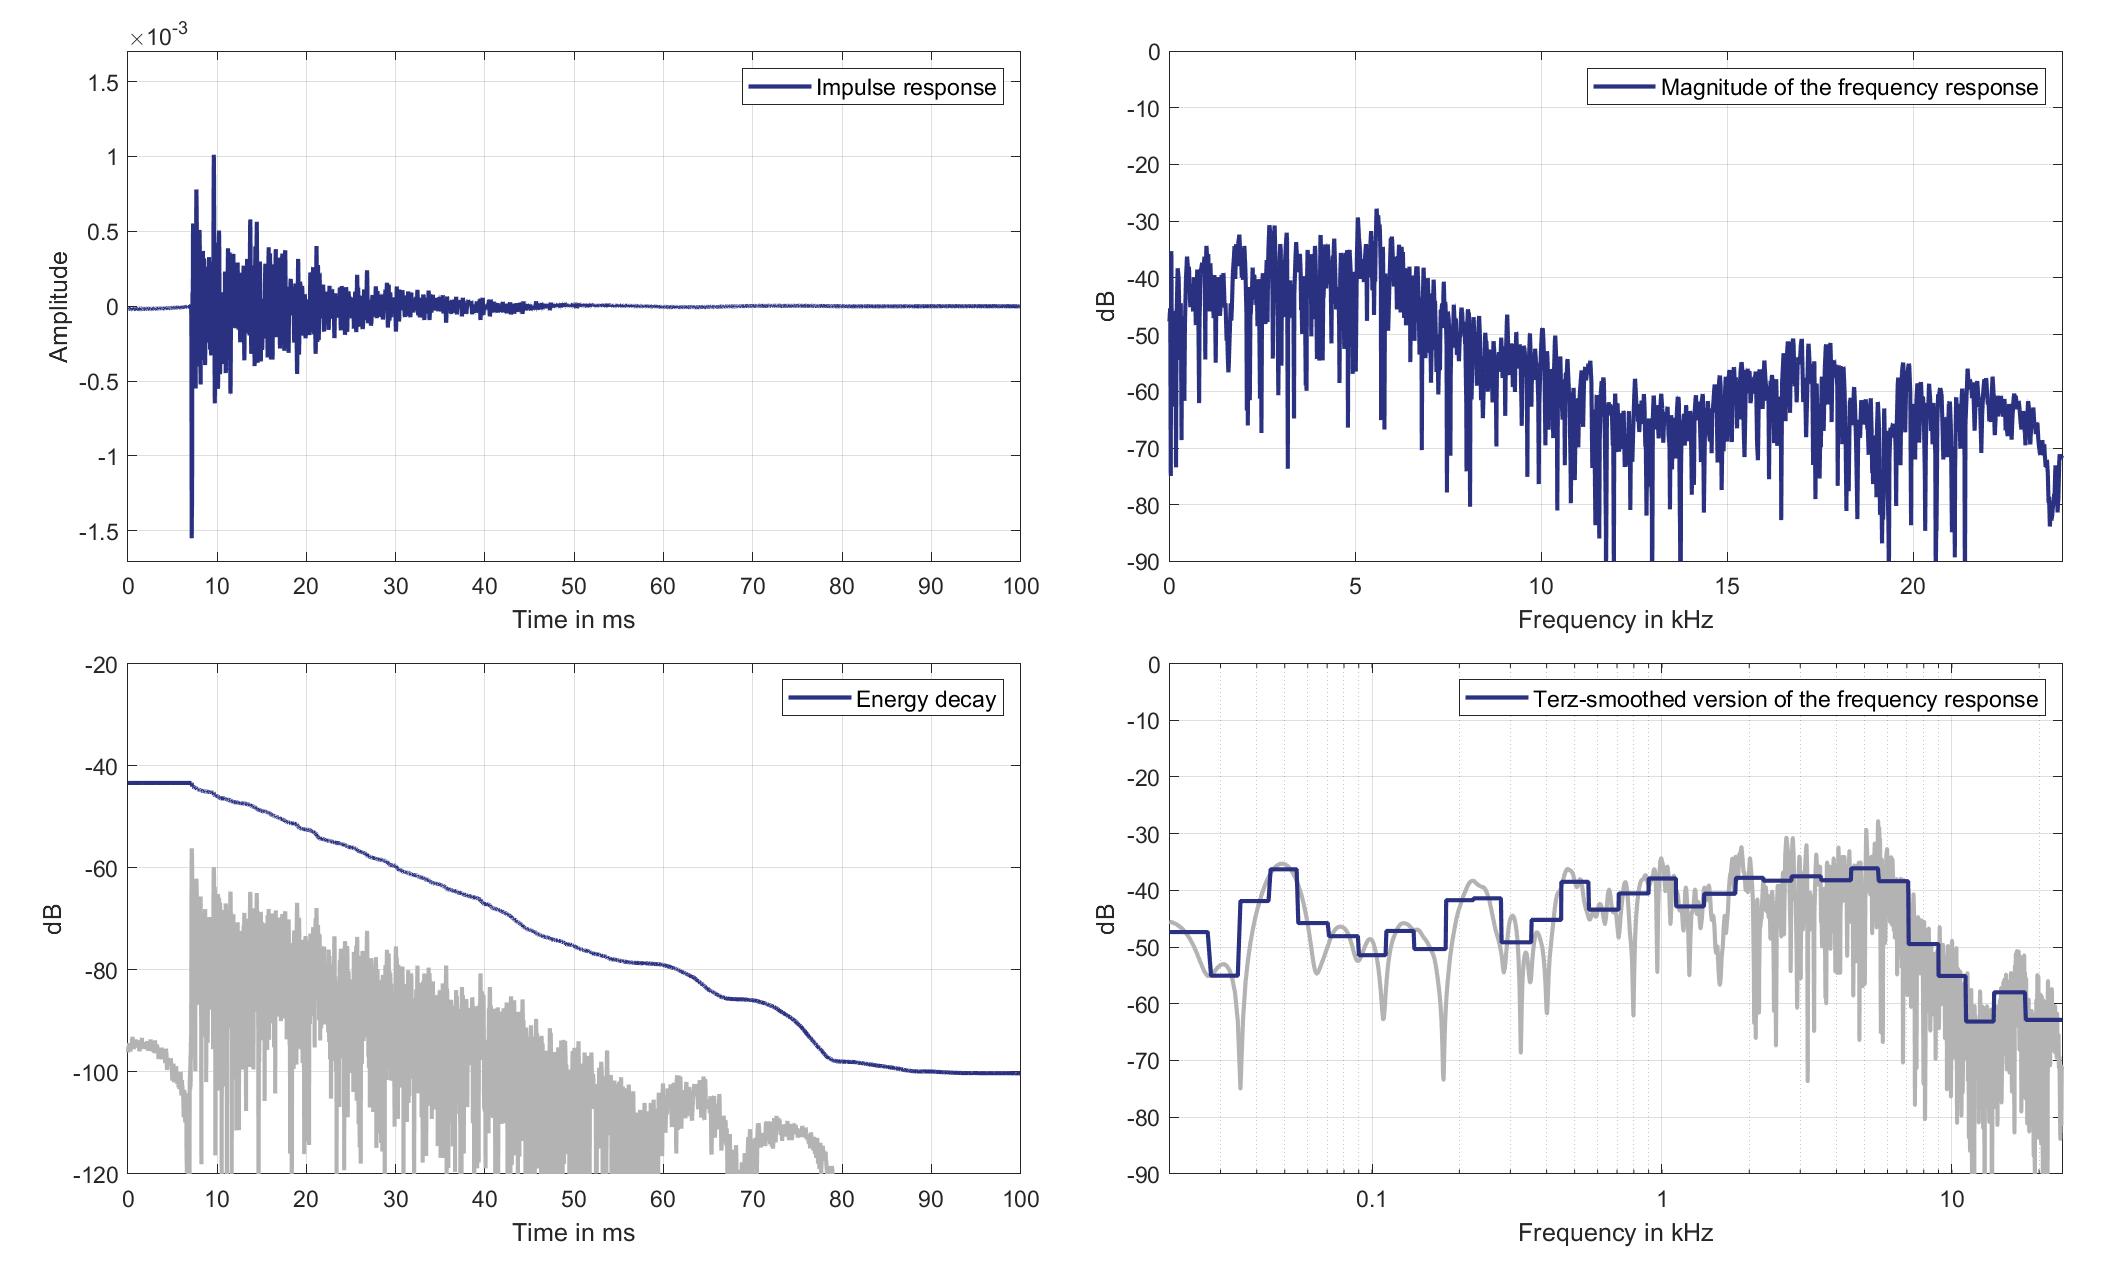
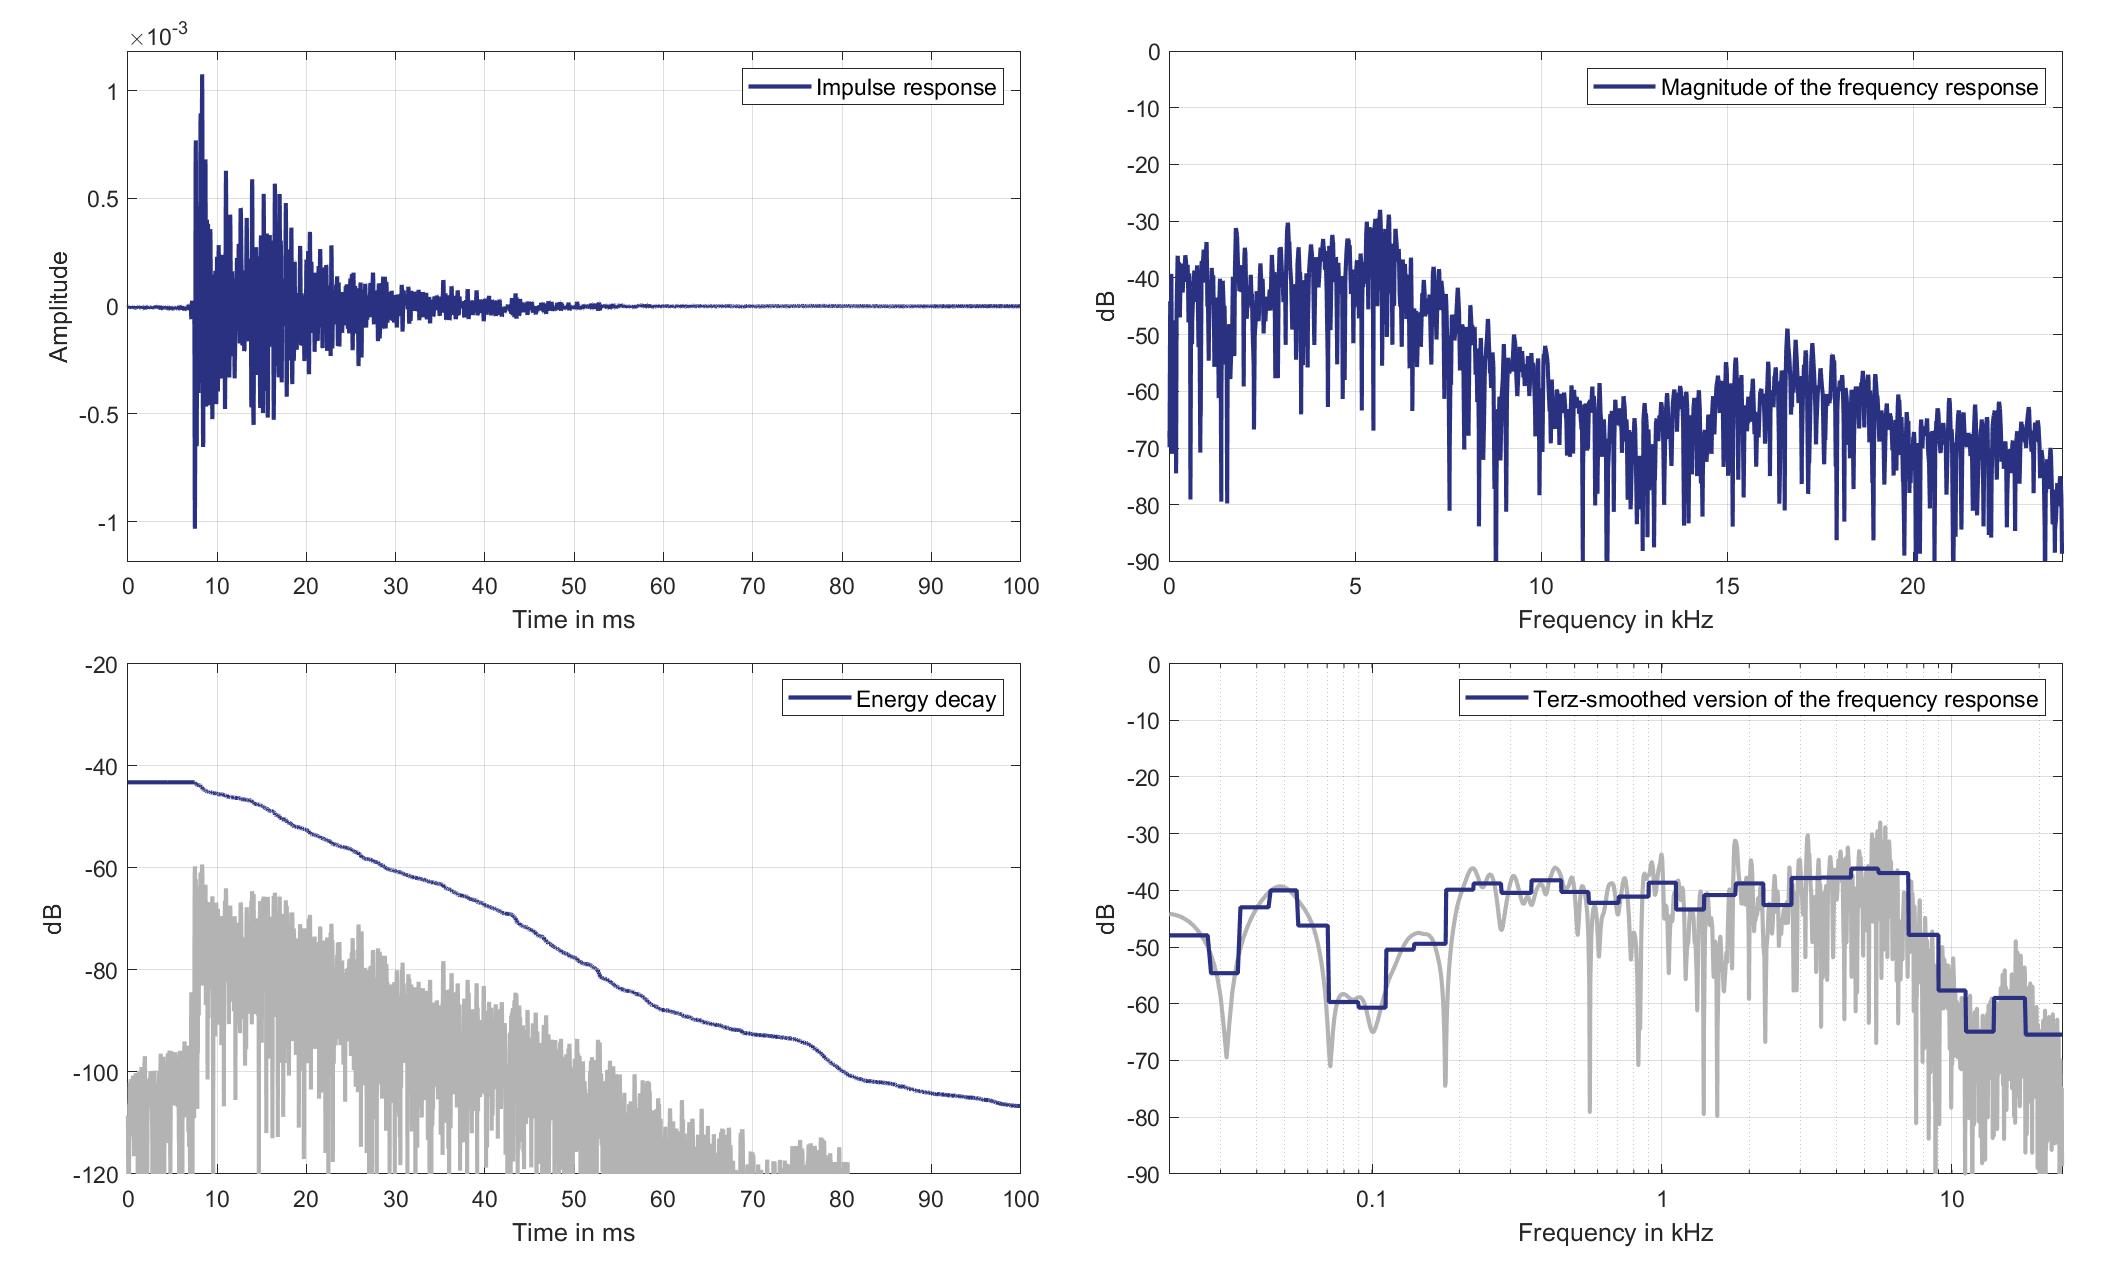
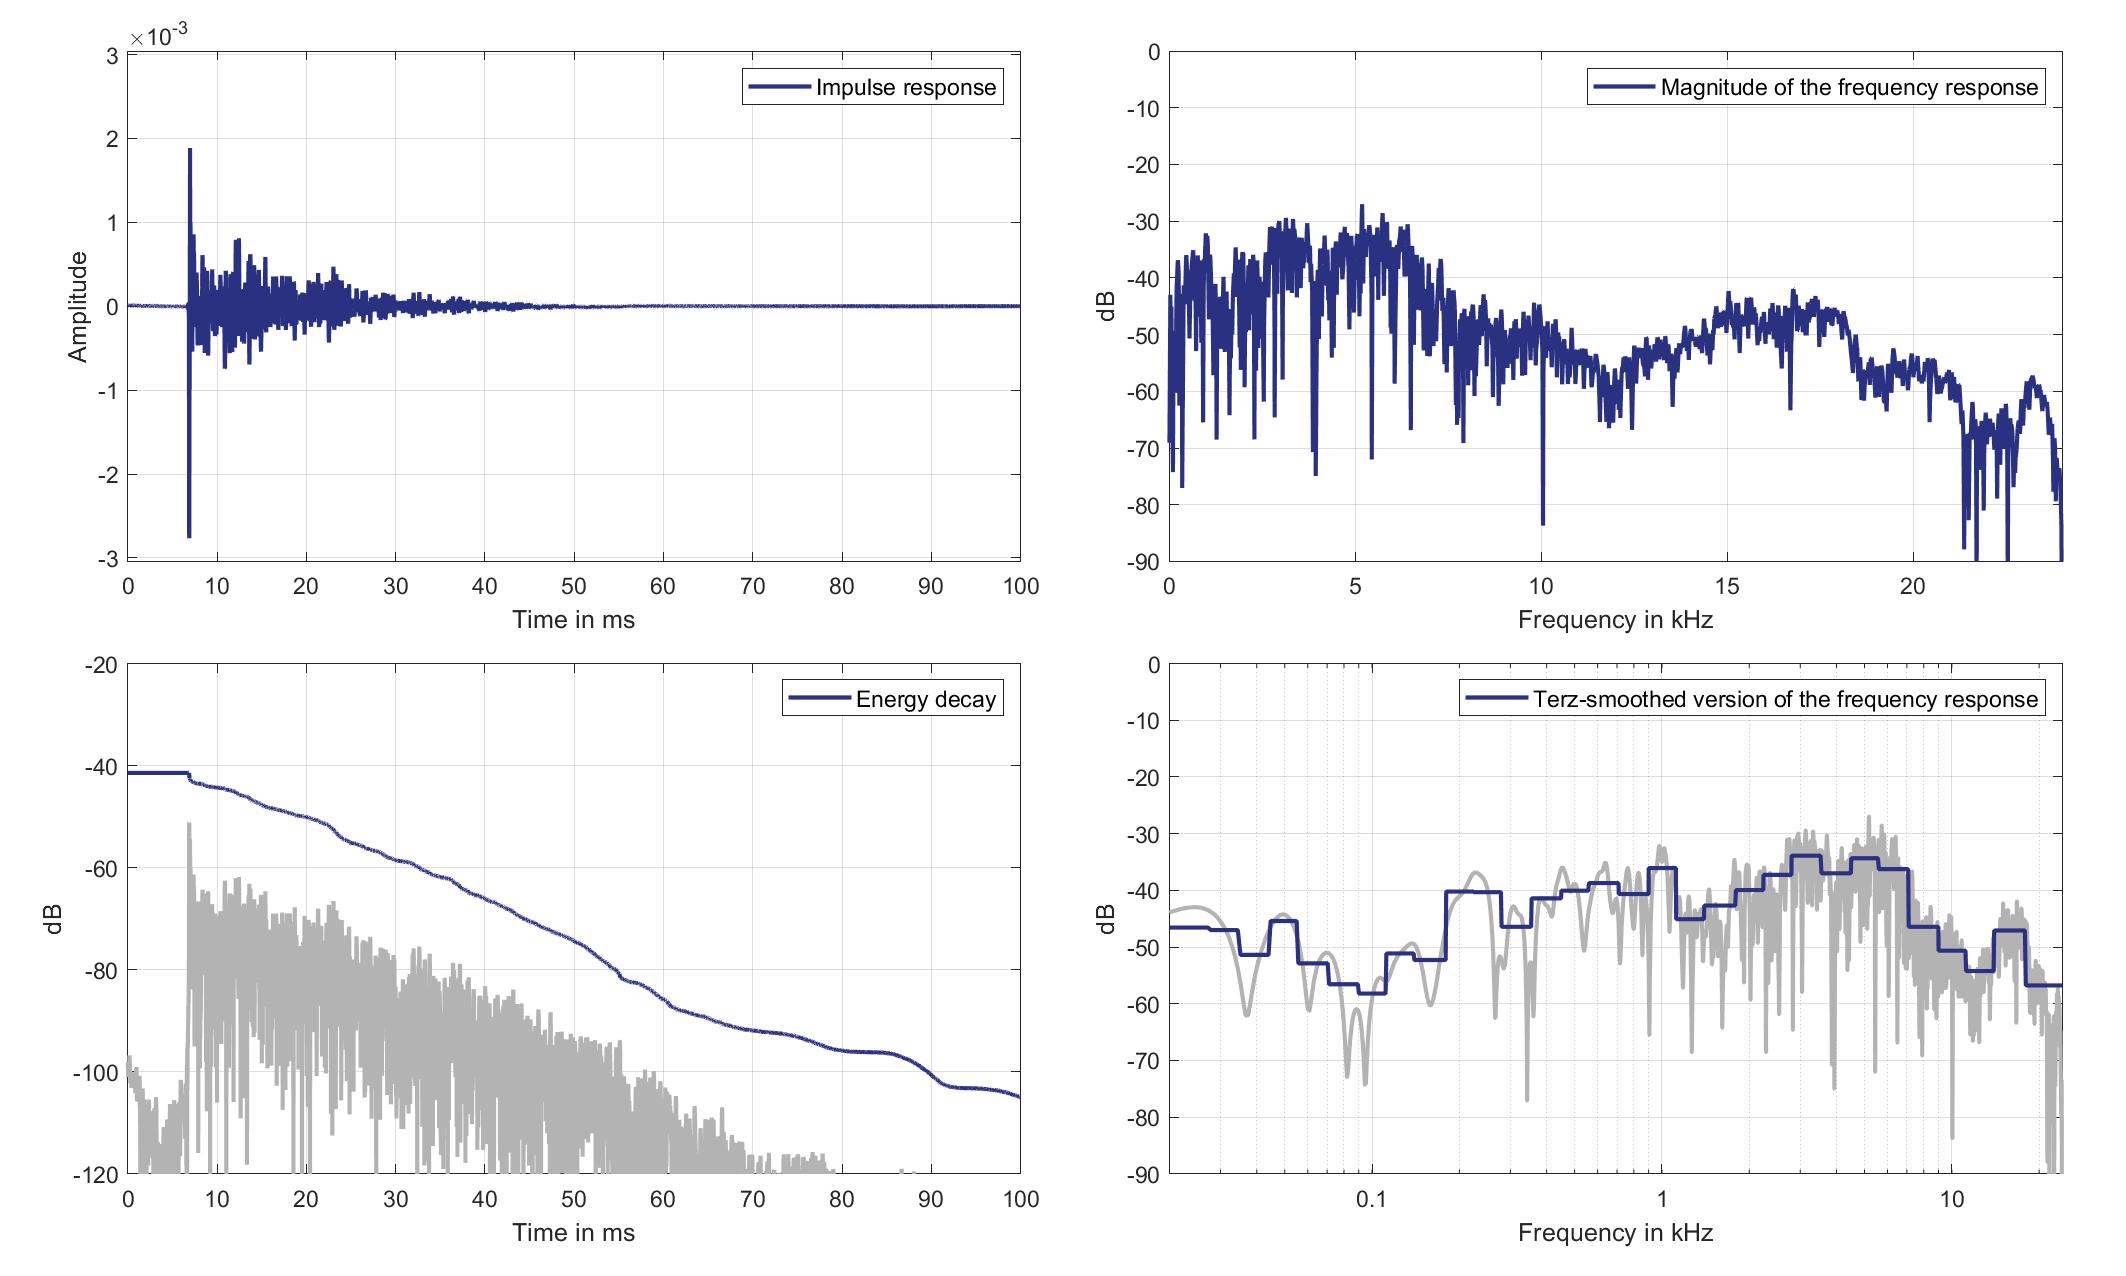
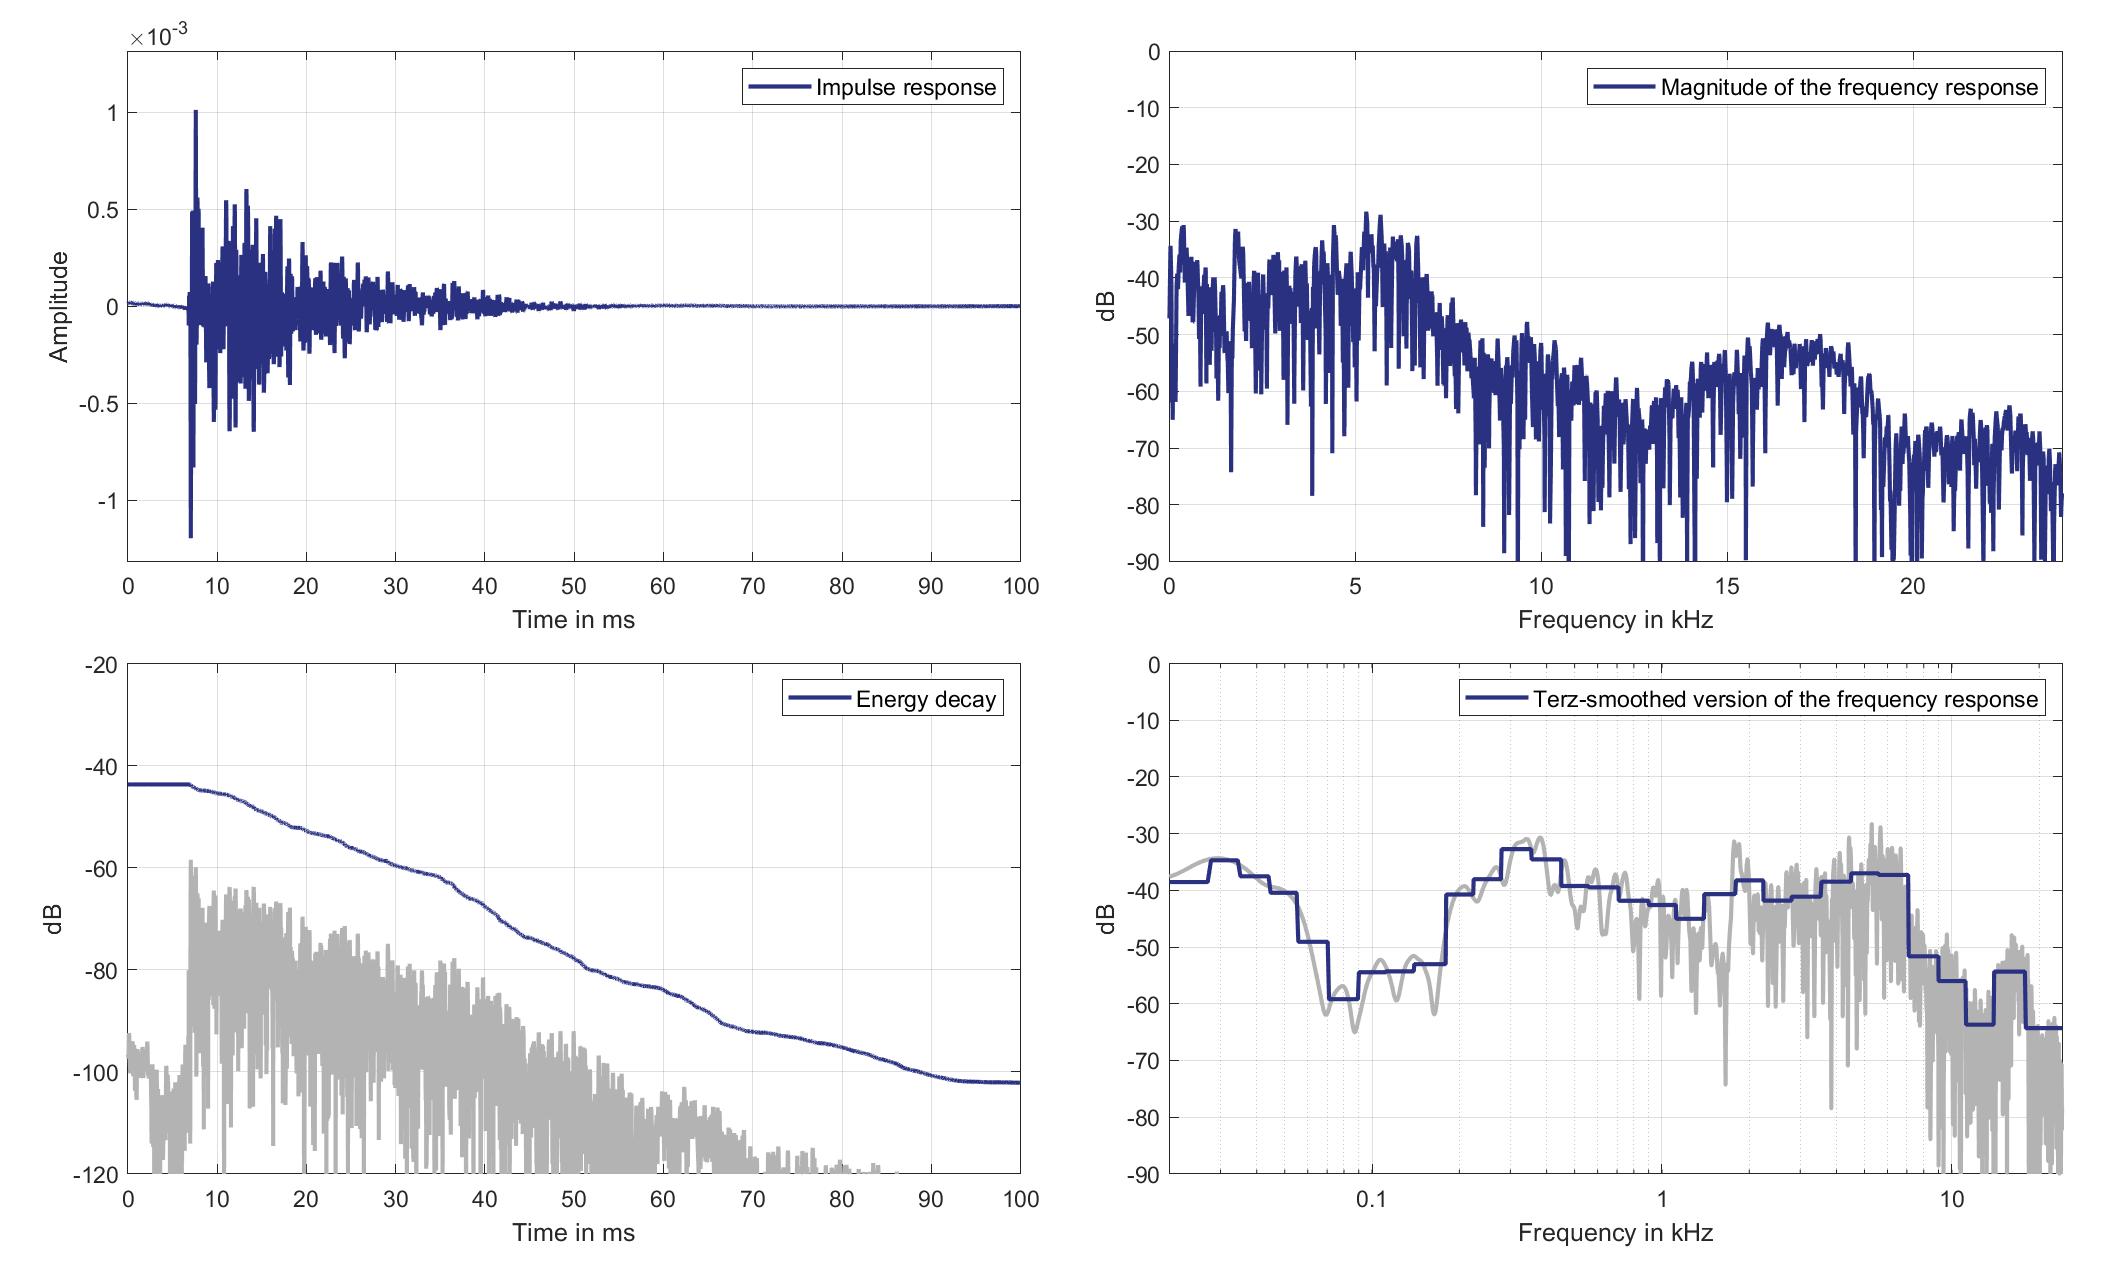
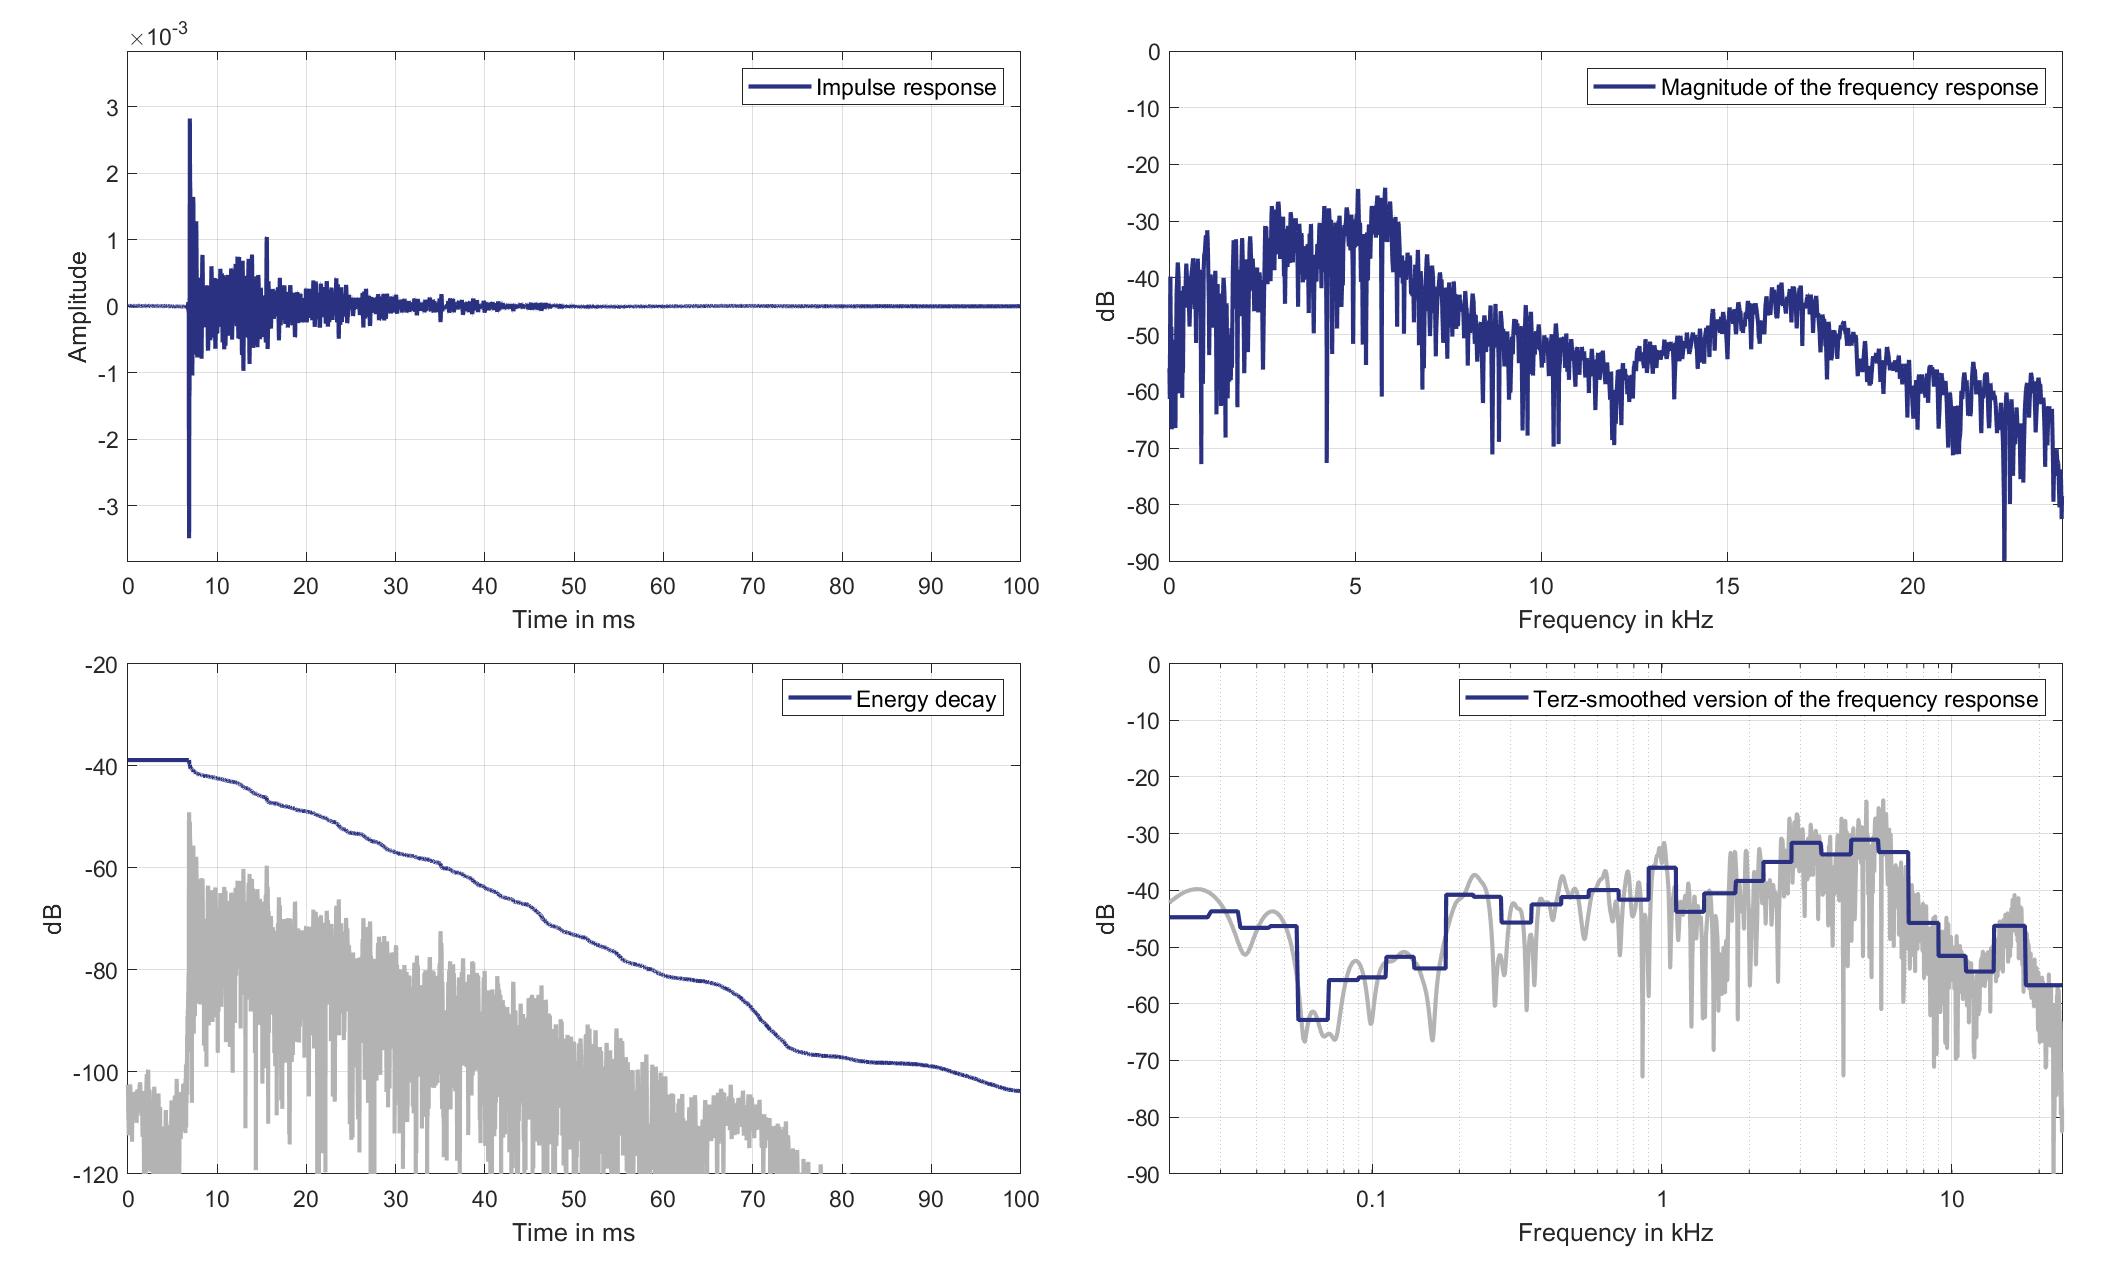
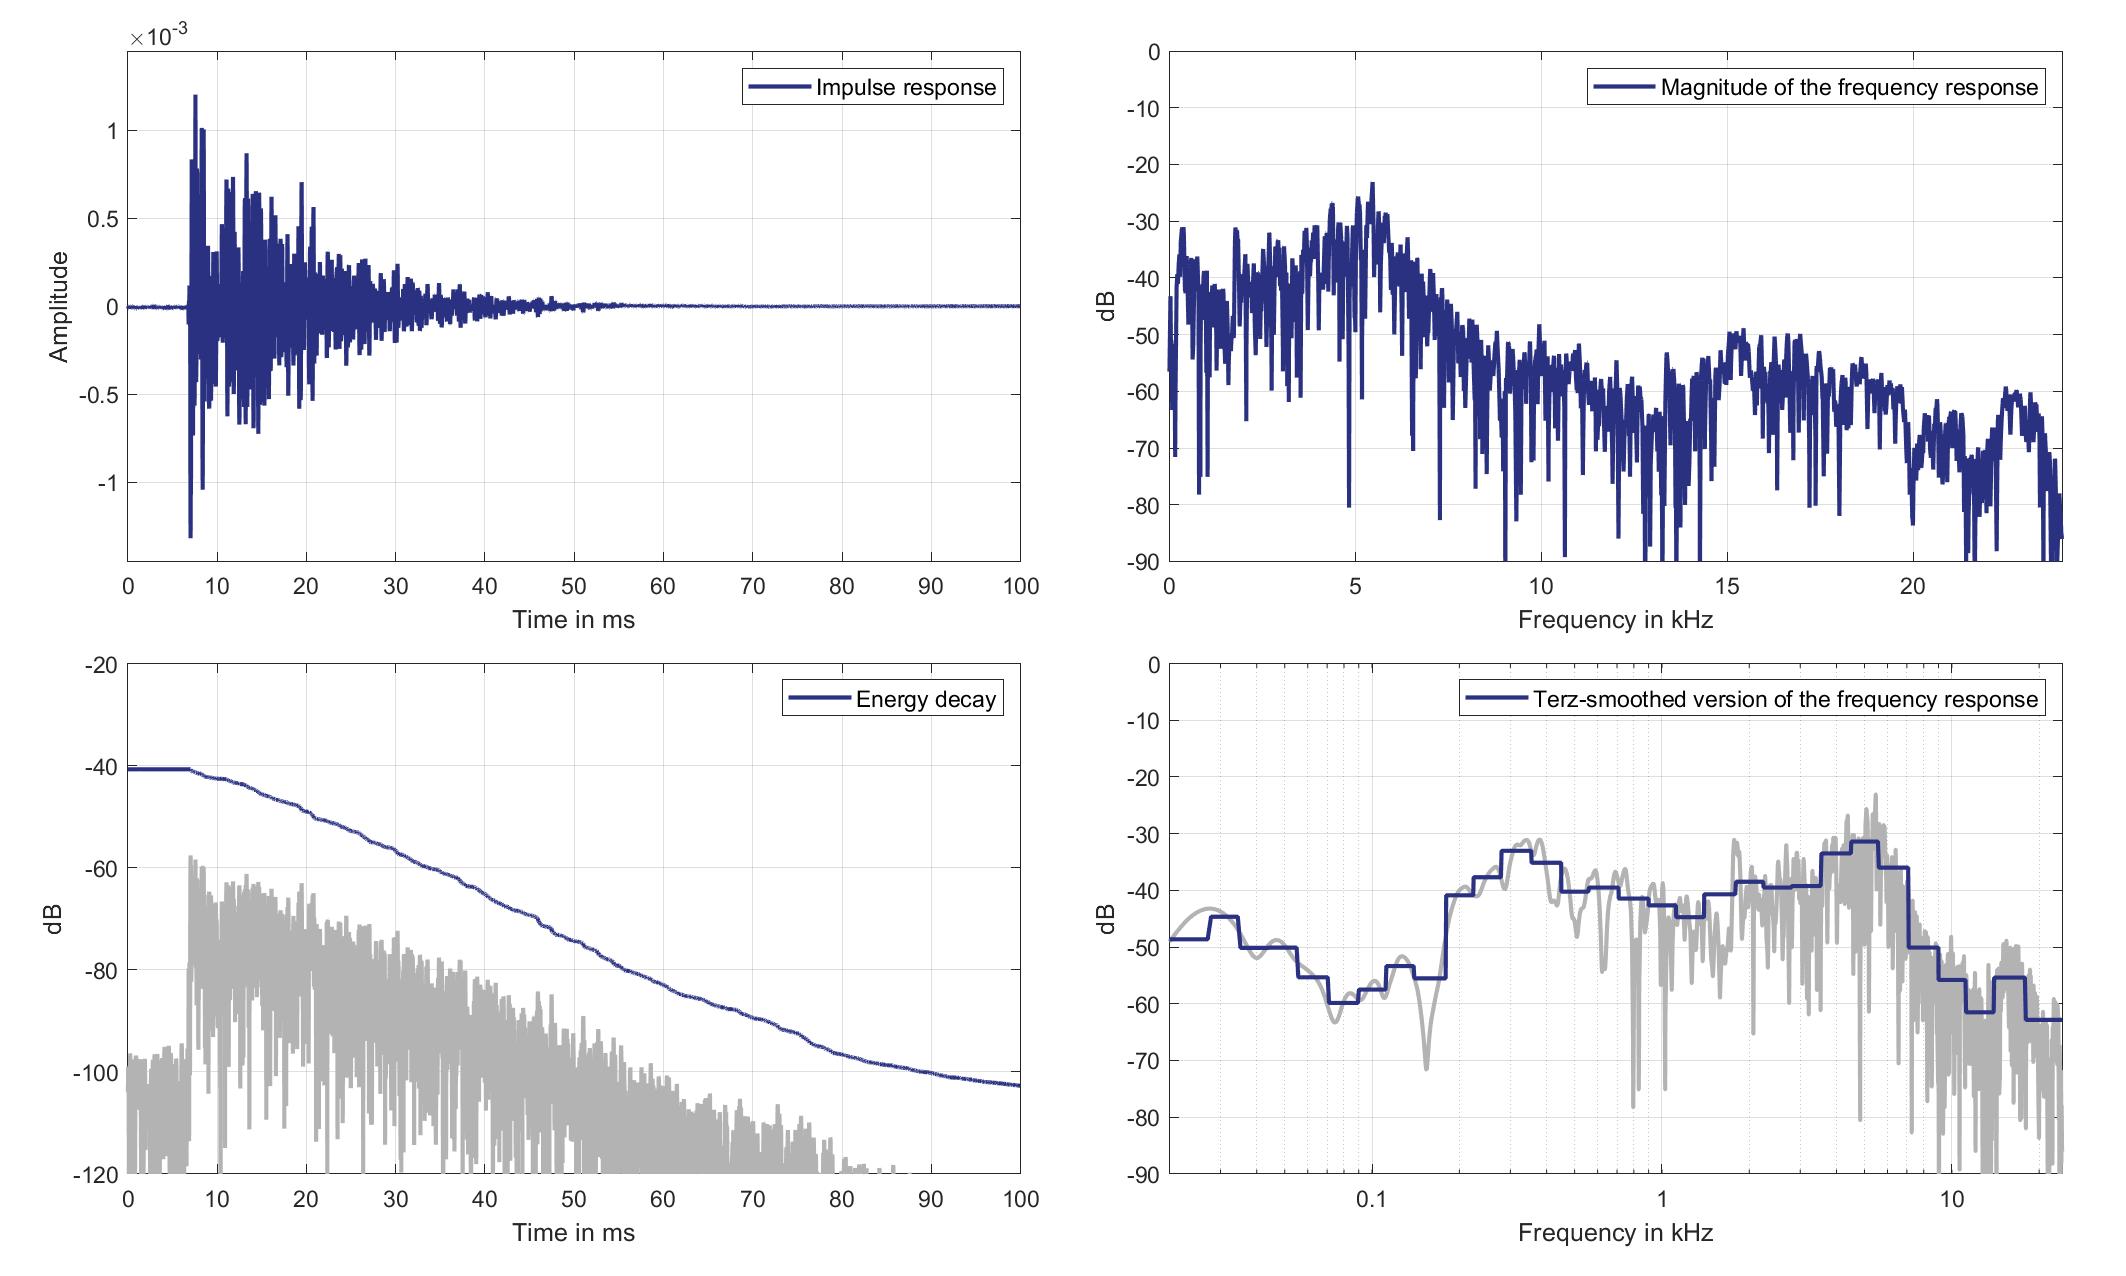
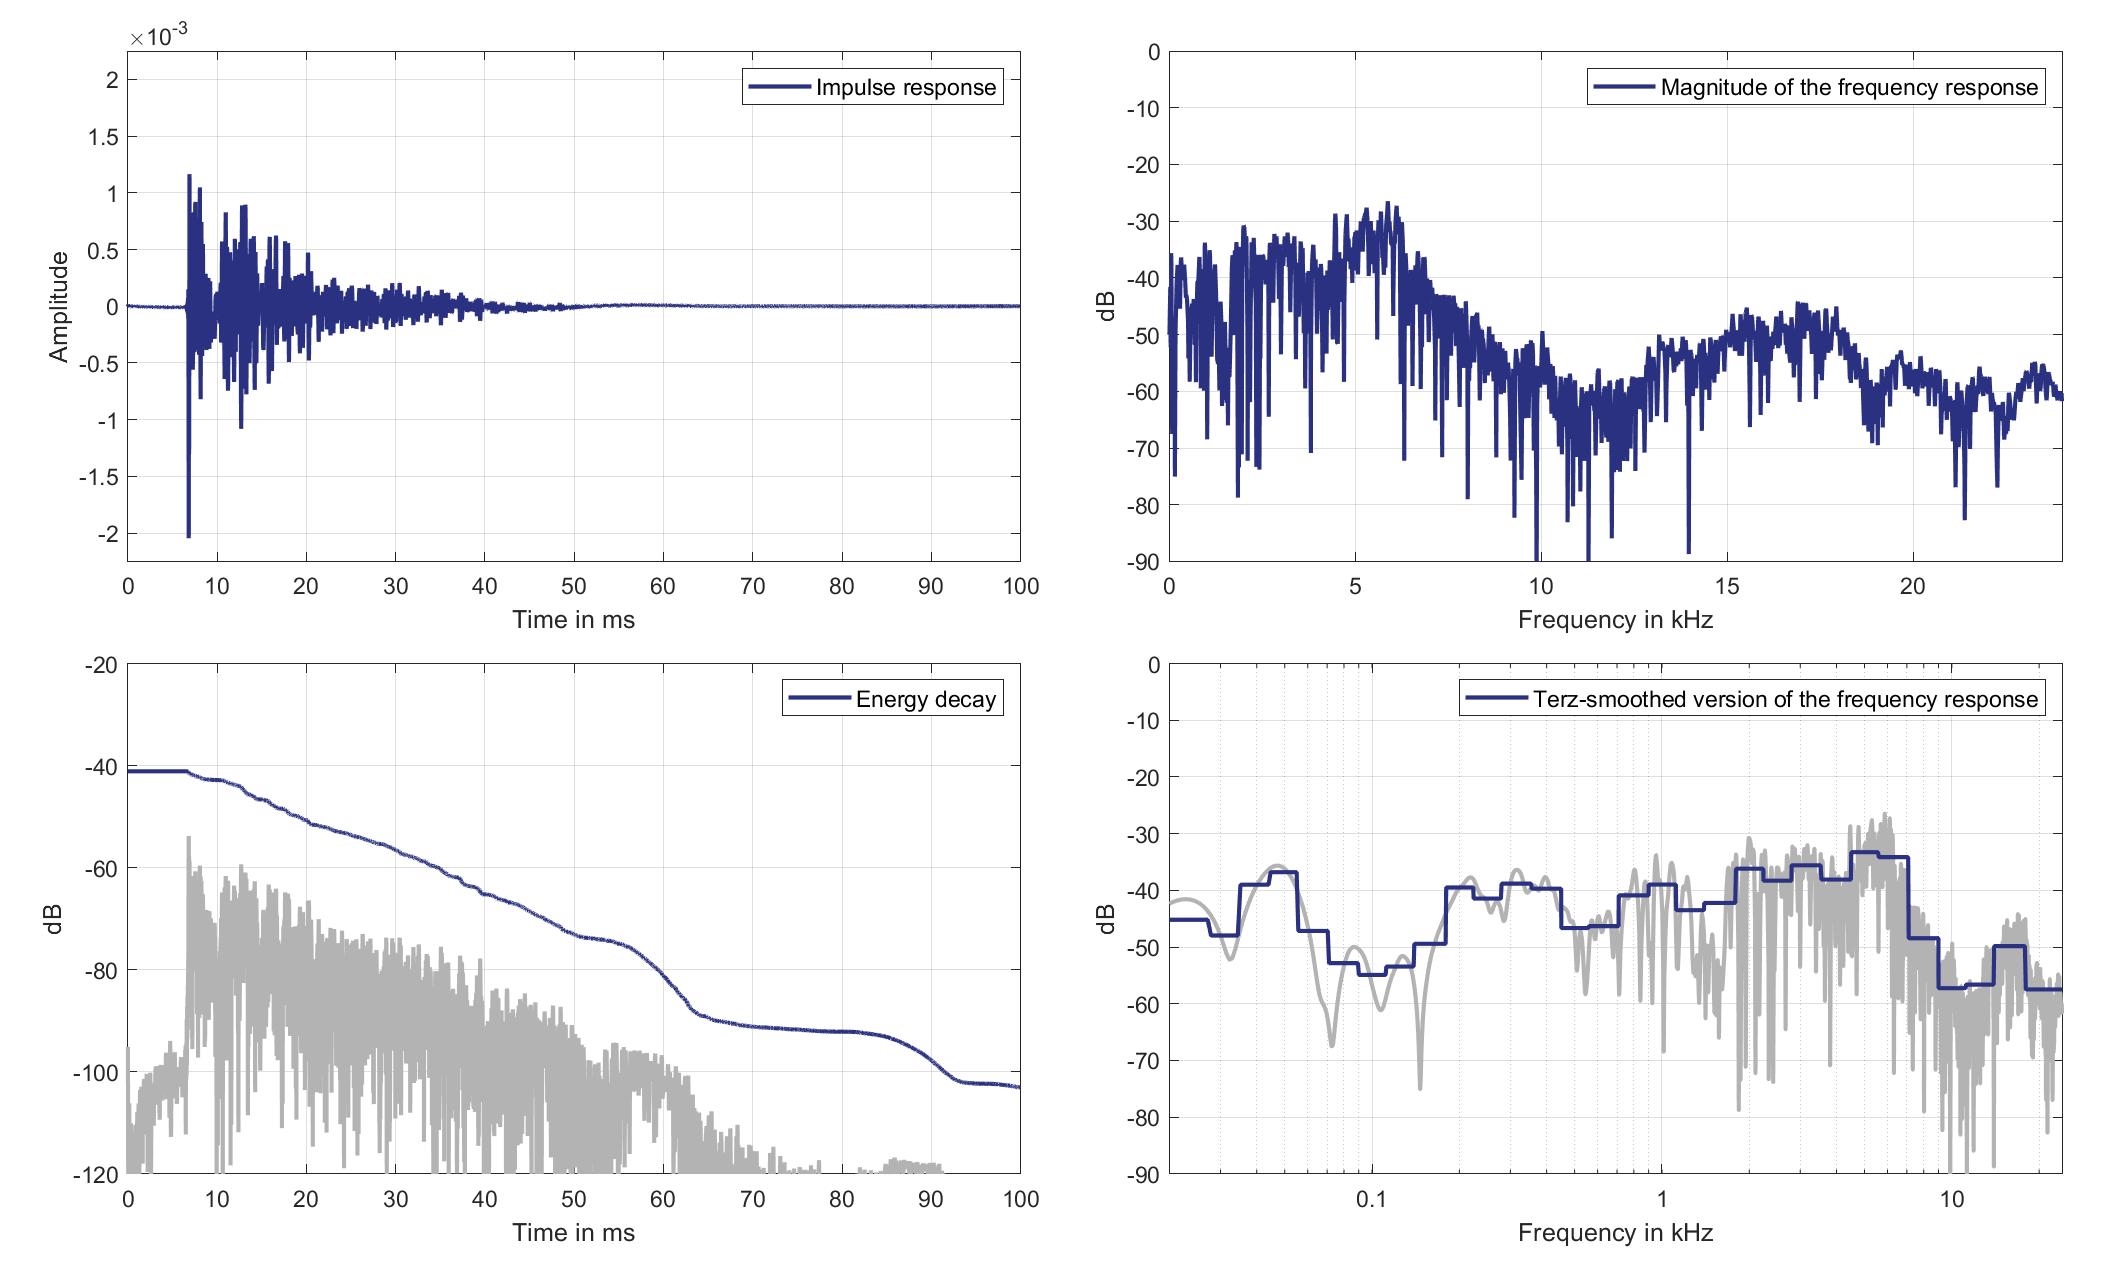
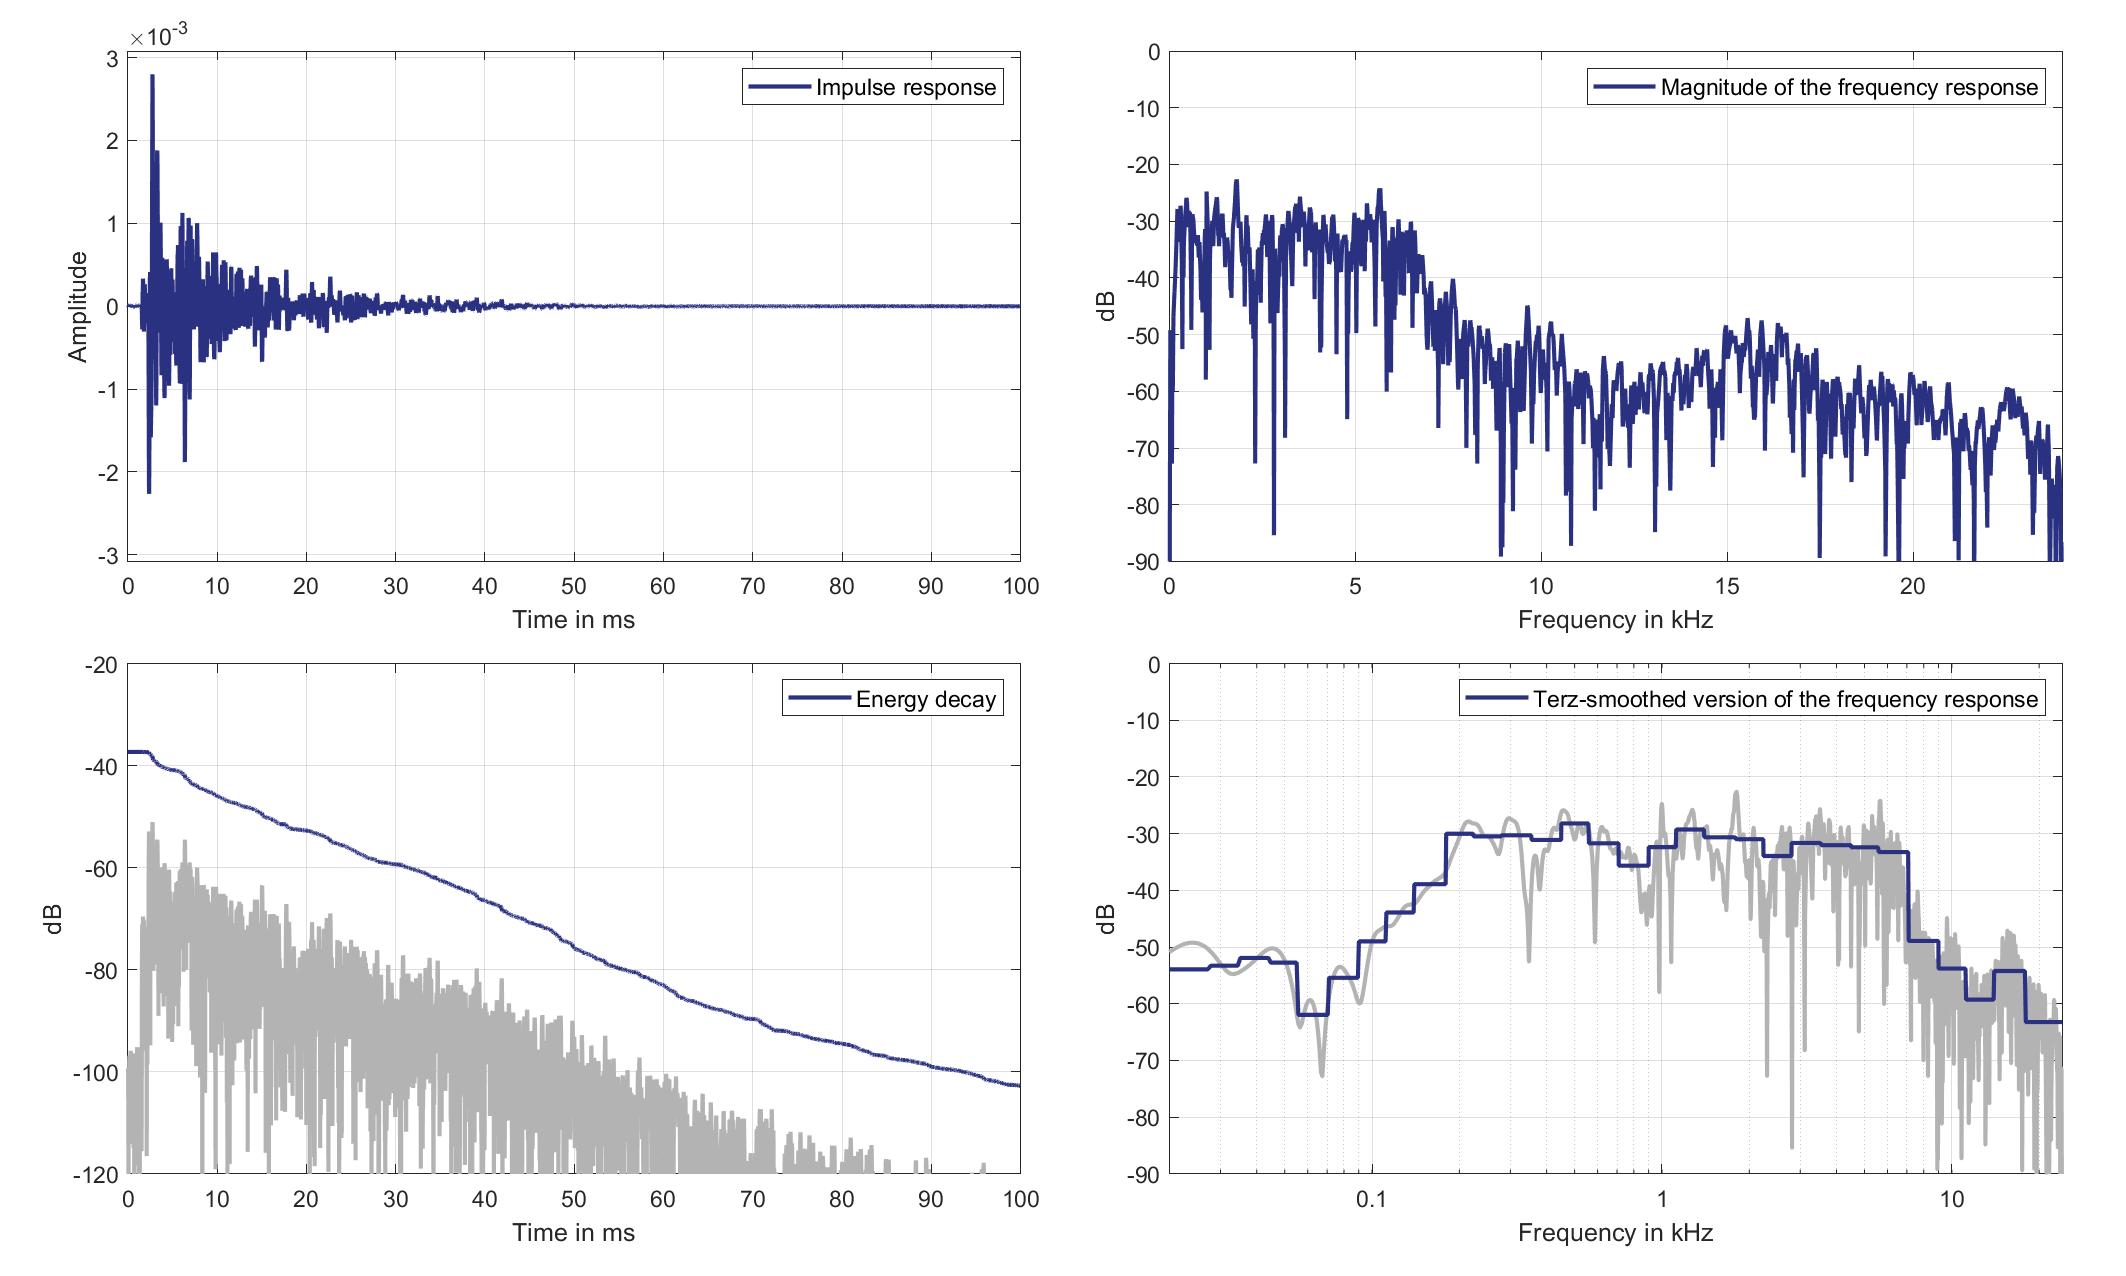
For all vehicles, impulse response are estimated for each loudspeaker and microphone combination. The acoustic paths considered here are the paths from the, e.g., headrest loudspeakers, mouth loudspeakers or standard loudspeakers to the standard microphones or the ear microphones. Consequently, all standard and ear microphone signals can be fully simulated for an arbitrary combination of system output and local speech sources.
The impulse responses are estimated using the Normalized Least-Mean-Squares (NLMS) algorithm in the time-domain. Specifically, a white noise excitation and a fixed stepsize are used. All impulse responses are available at a sample rate of 48 kHz.
System Delay
The system delay of our measuring equipment was determined and removed from the impulse responses. Consequently, the delay contained in the impulse responses only describes the analog/acoustic path from soundcard output to soundcard input. This allows simulating an arbitrary communication system, especially with respect to the delay of the simulated system.
Calibration and Equalization
The impulse responses are measured using calibrated microphones, see the background noise section for more information on the calibration. Hence, signals simulated using the impulse responses can be analyzed with respect to their sound pressure level at the microphones. Impulse responses involving a mouth loudspeaker are, additionally, scaled in such a way that a digital excitation power level of -26 dBov simulates an average sound pressure of -1.7 dBPa at the Mouth-Reference-Point (MRP). Mouth and ear equalization is included in the impulse responses. Since linear-phase filters are used for equaliztion, the (group) delay of the filters is removed from the impulse responses after equalization.
Analysis and Download
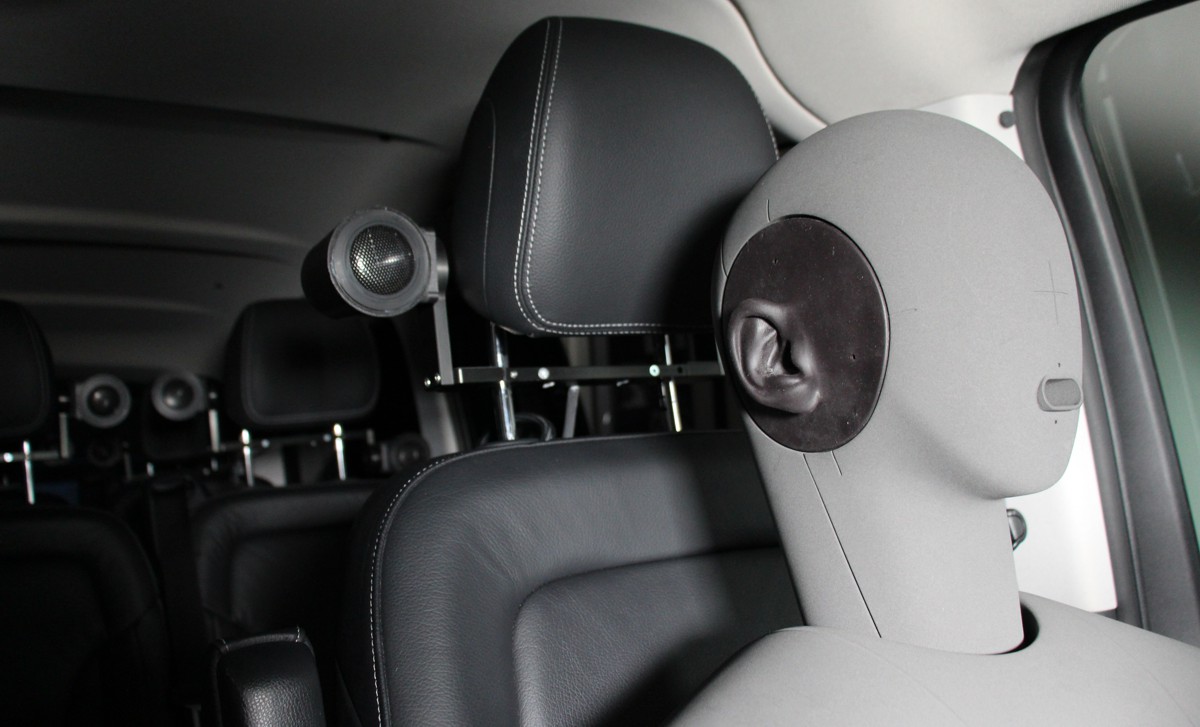
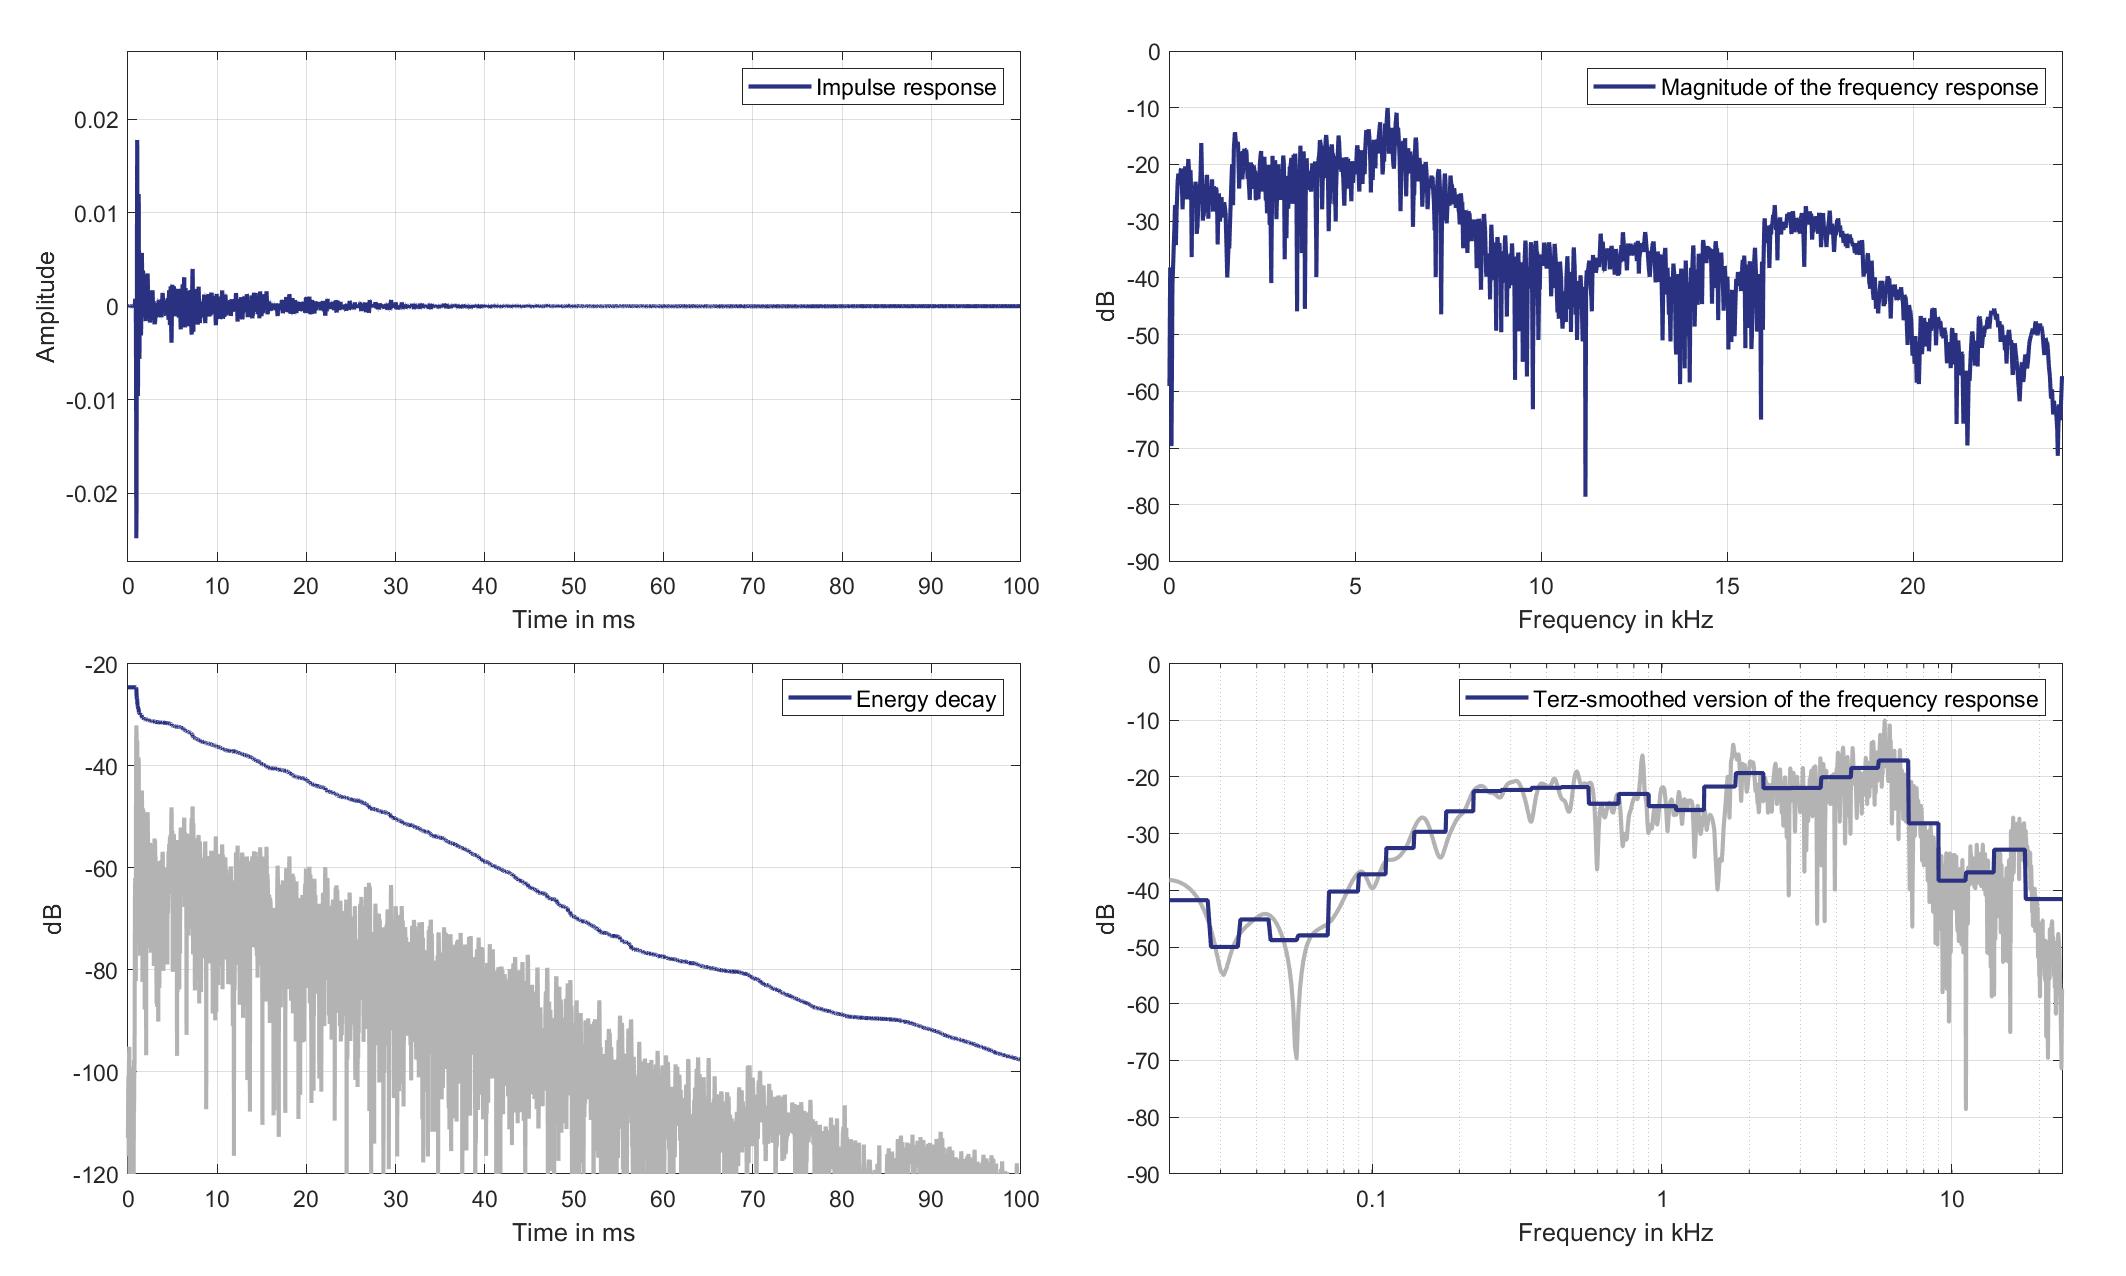
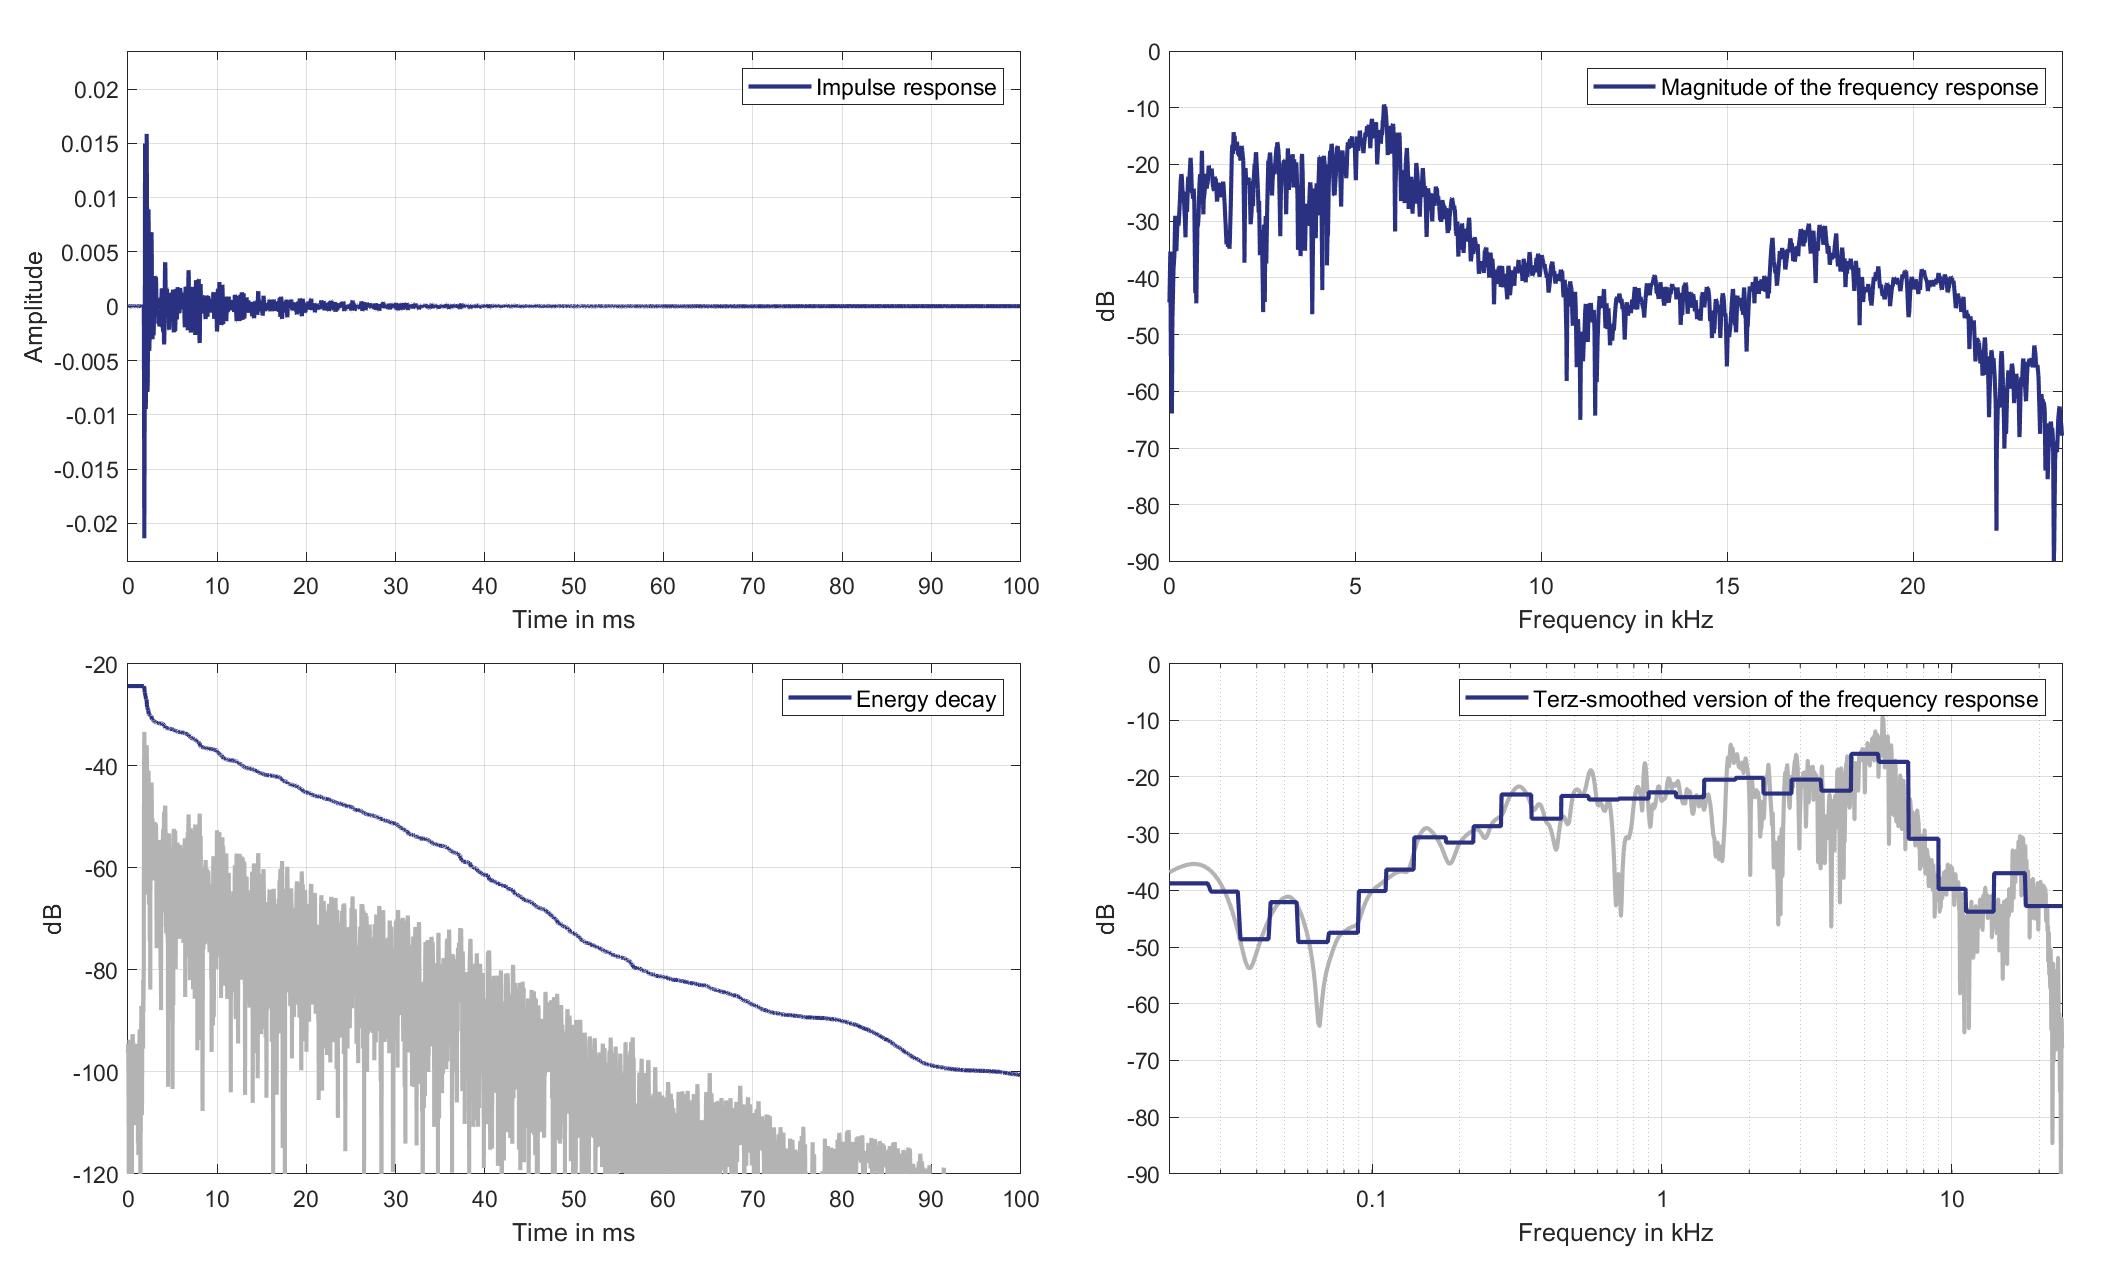
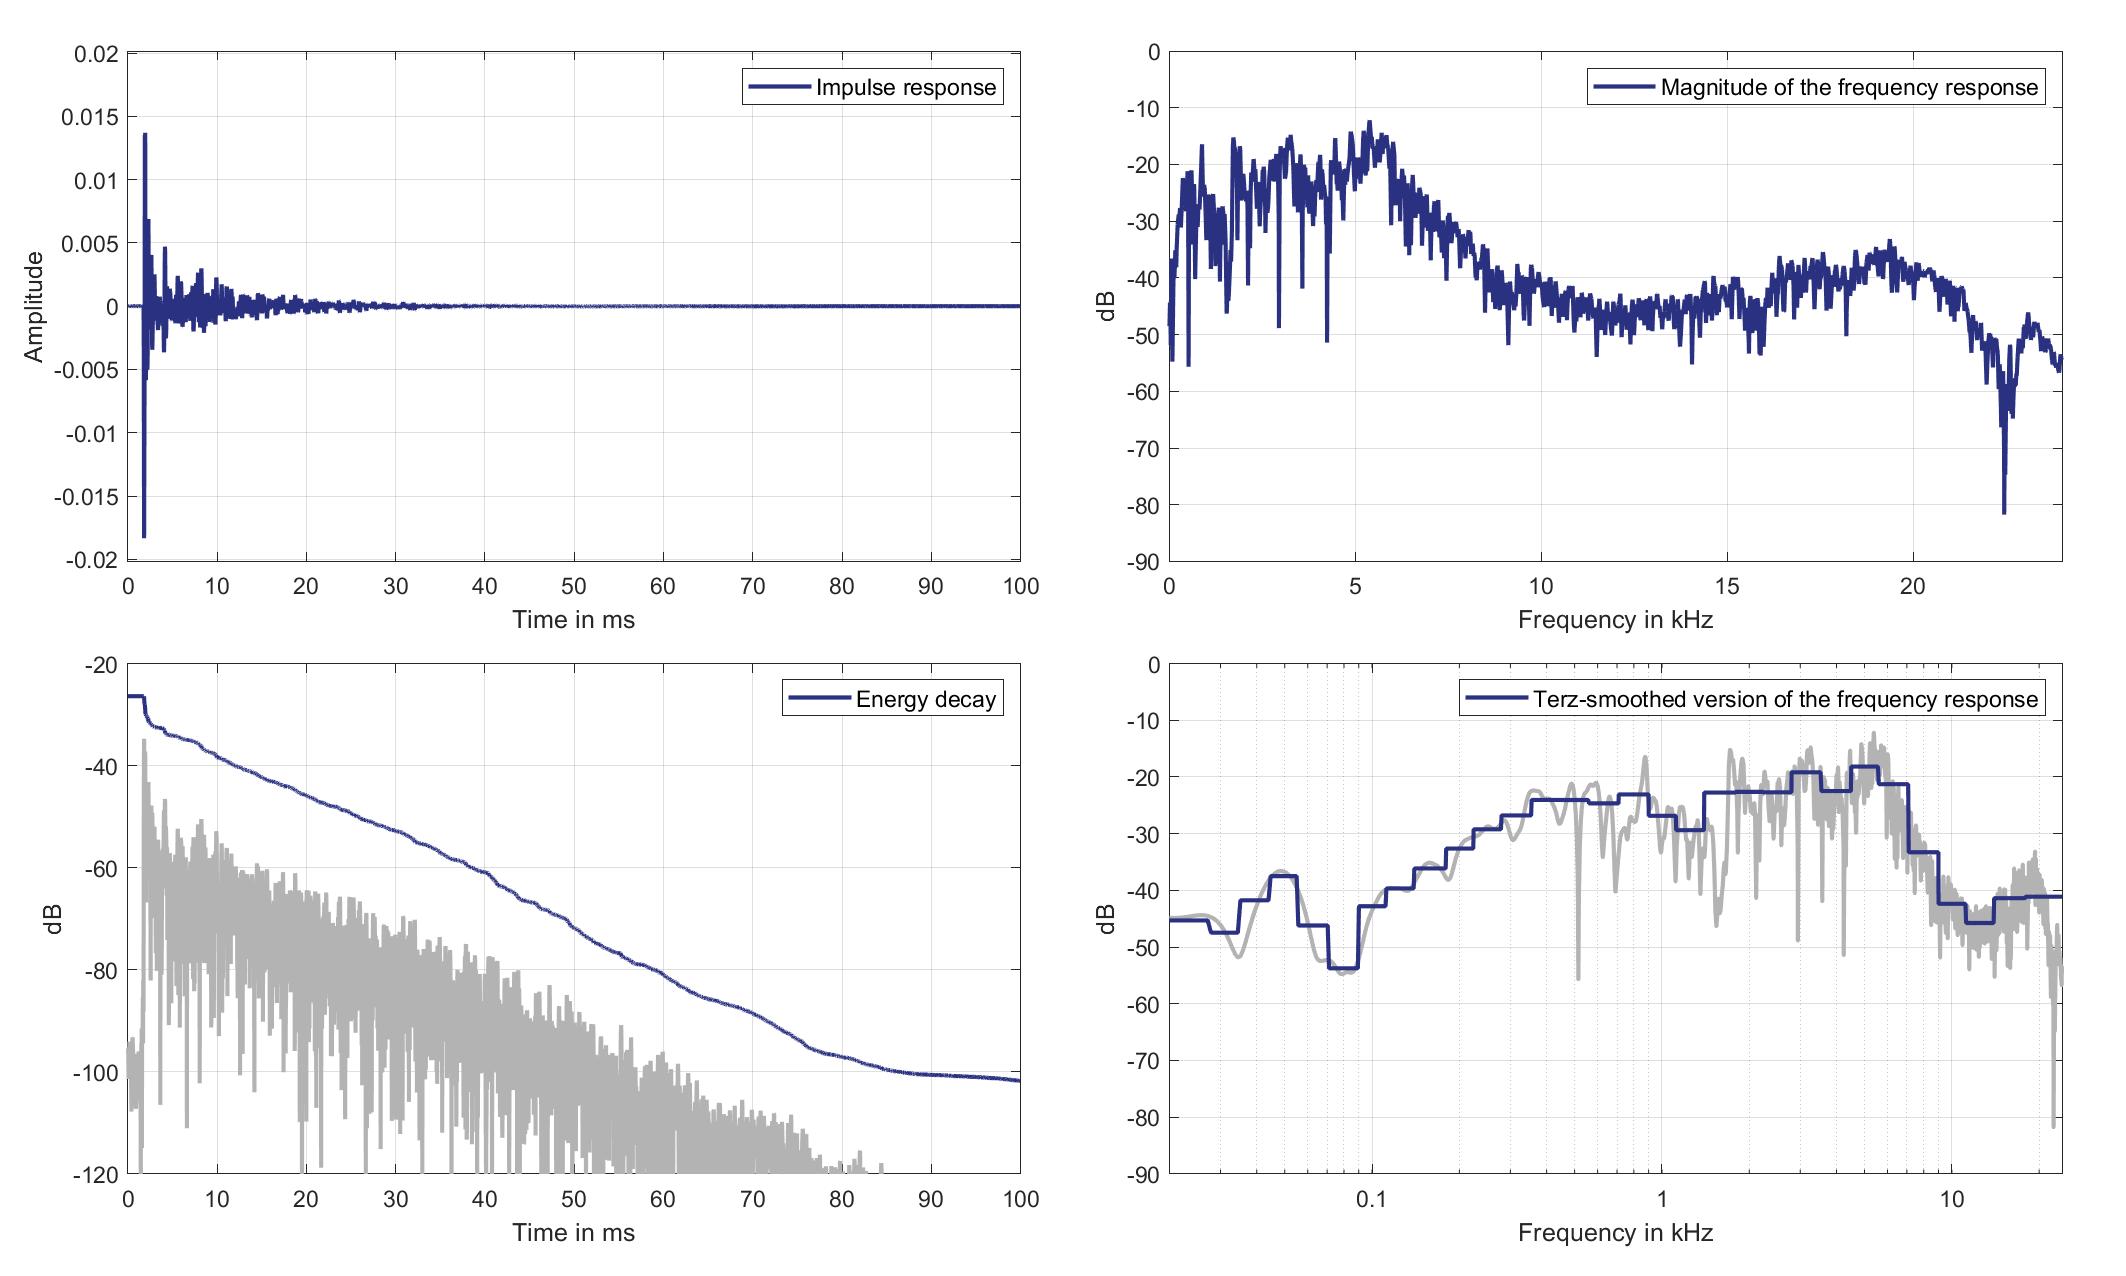
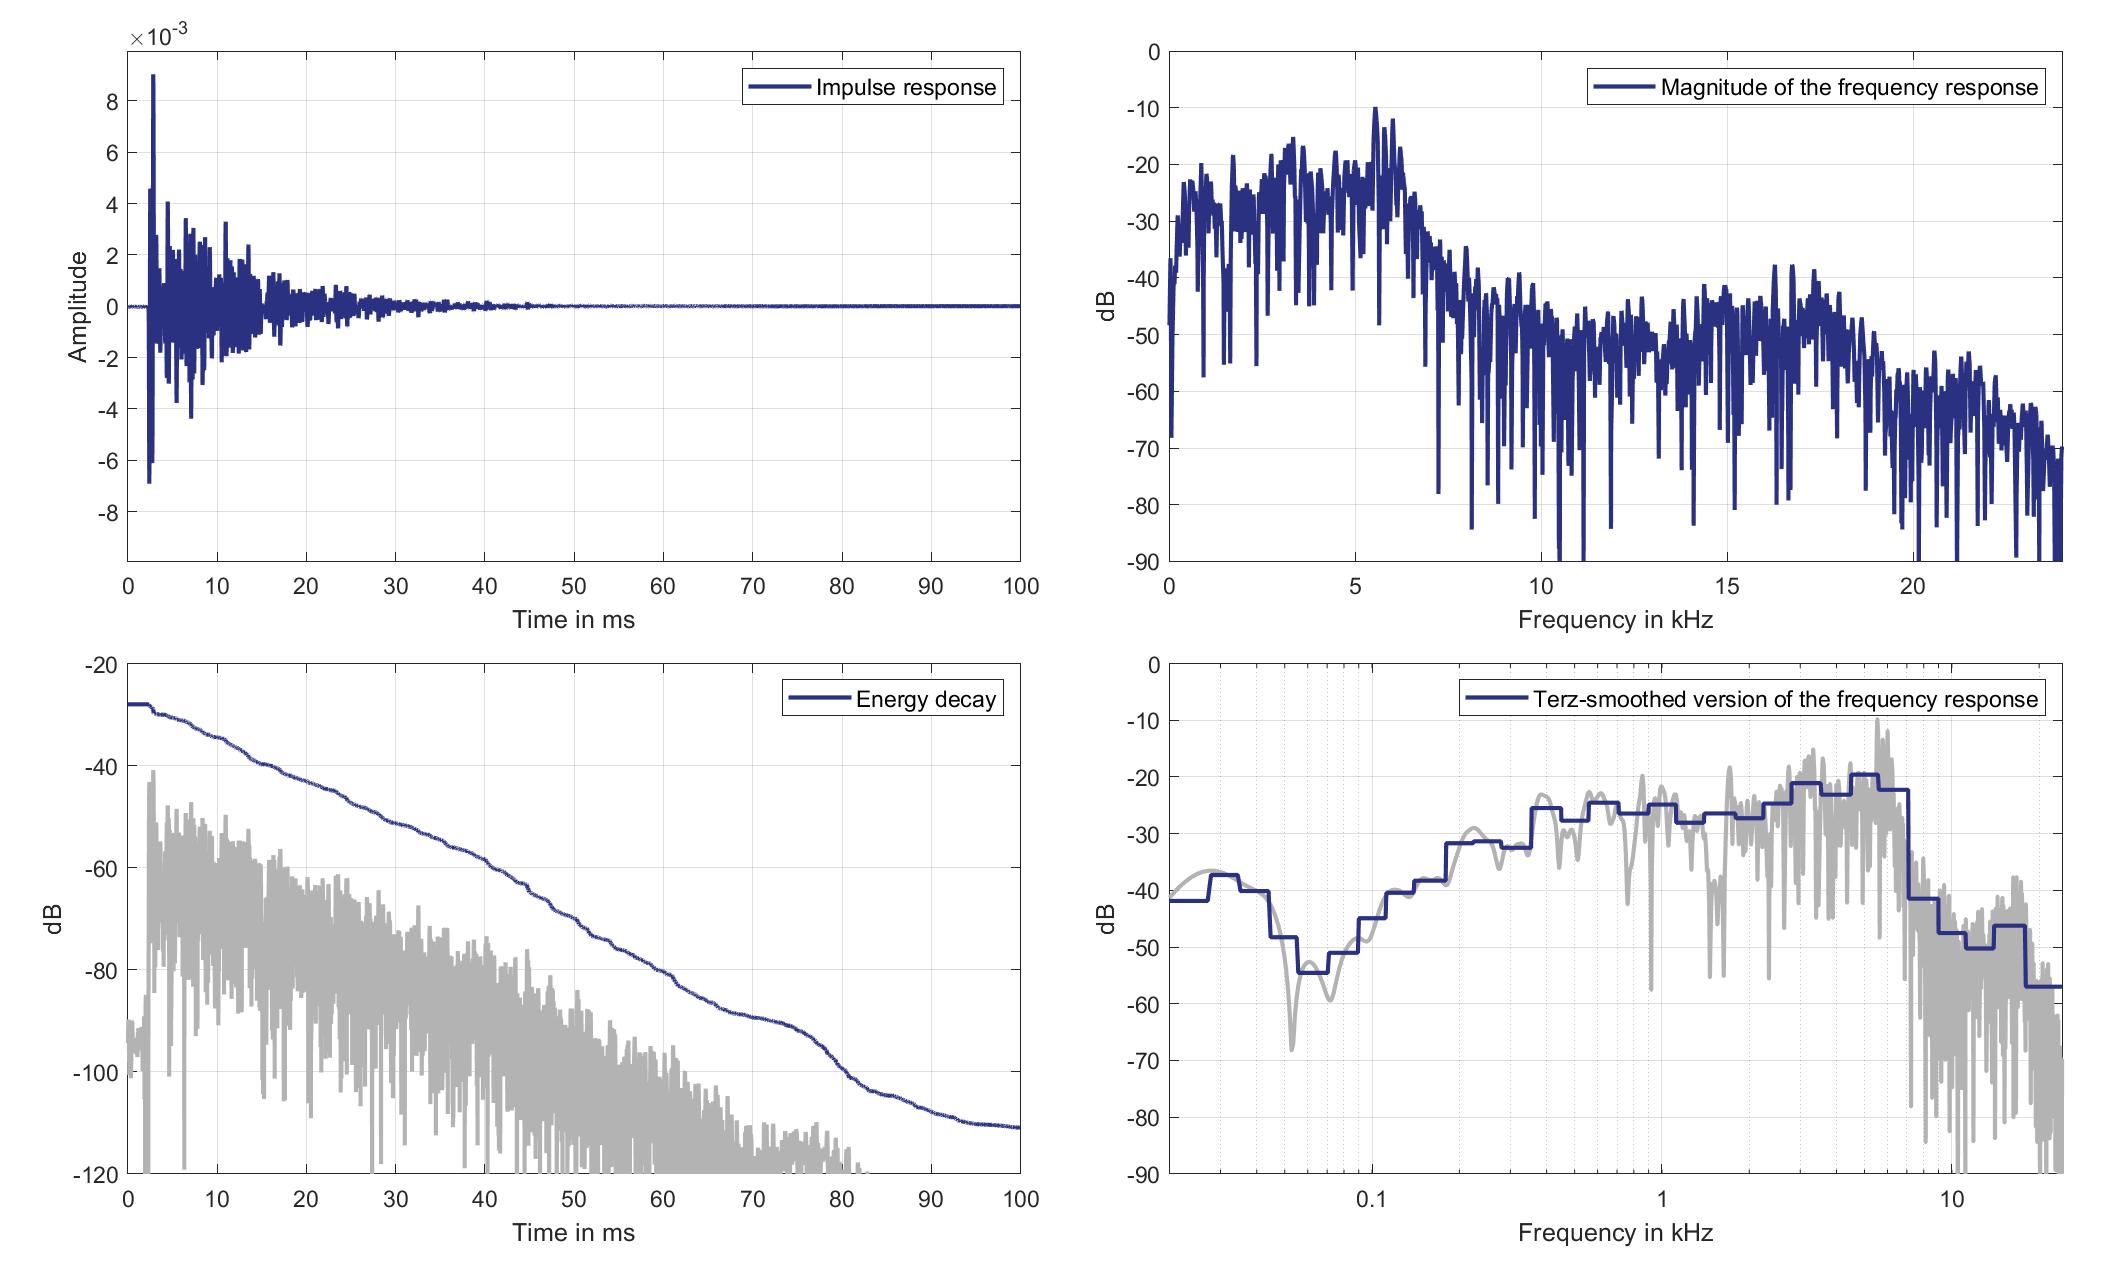
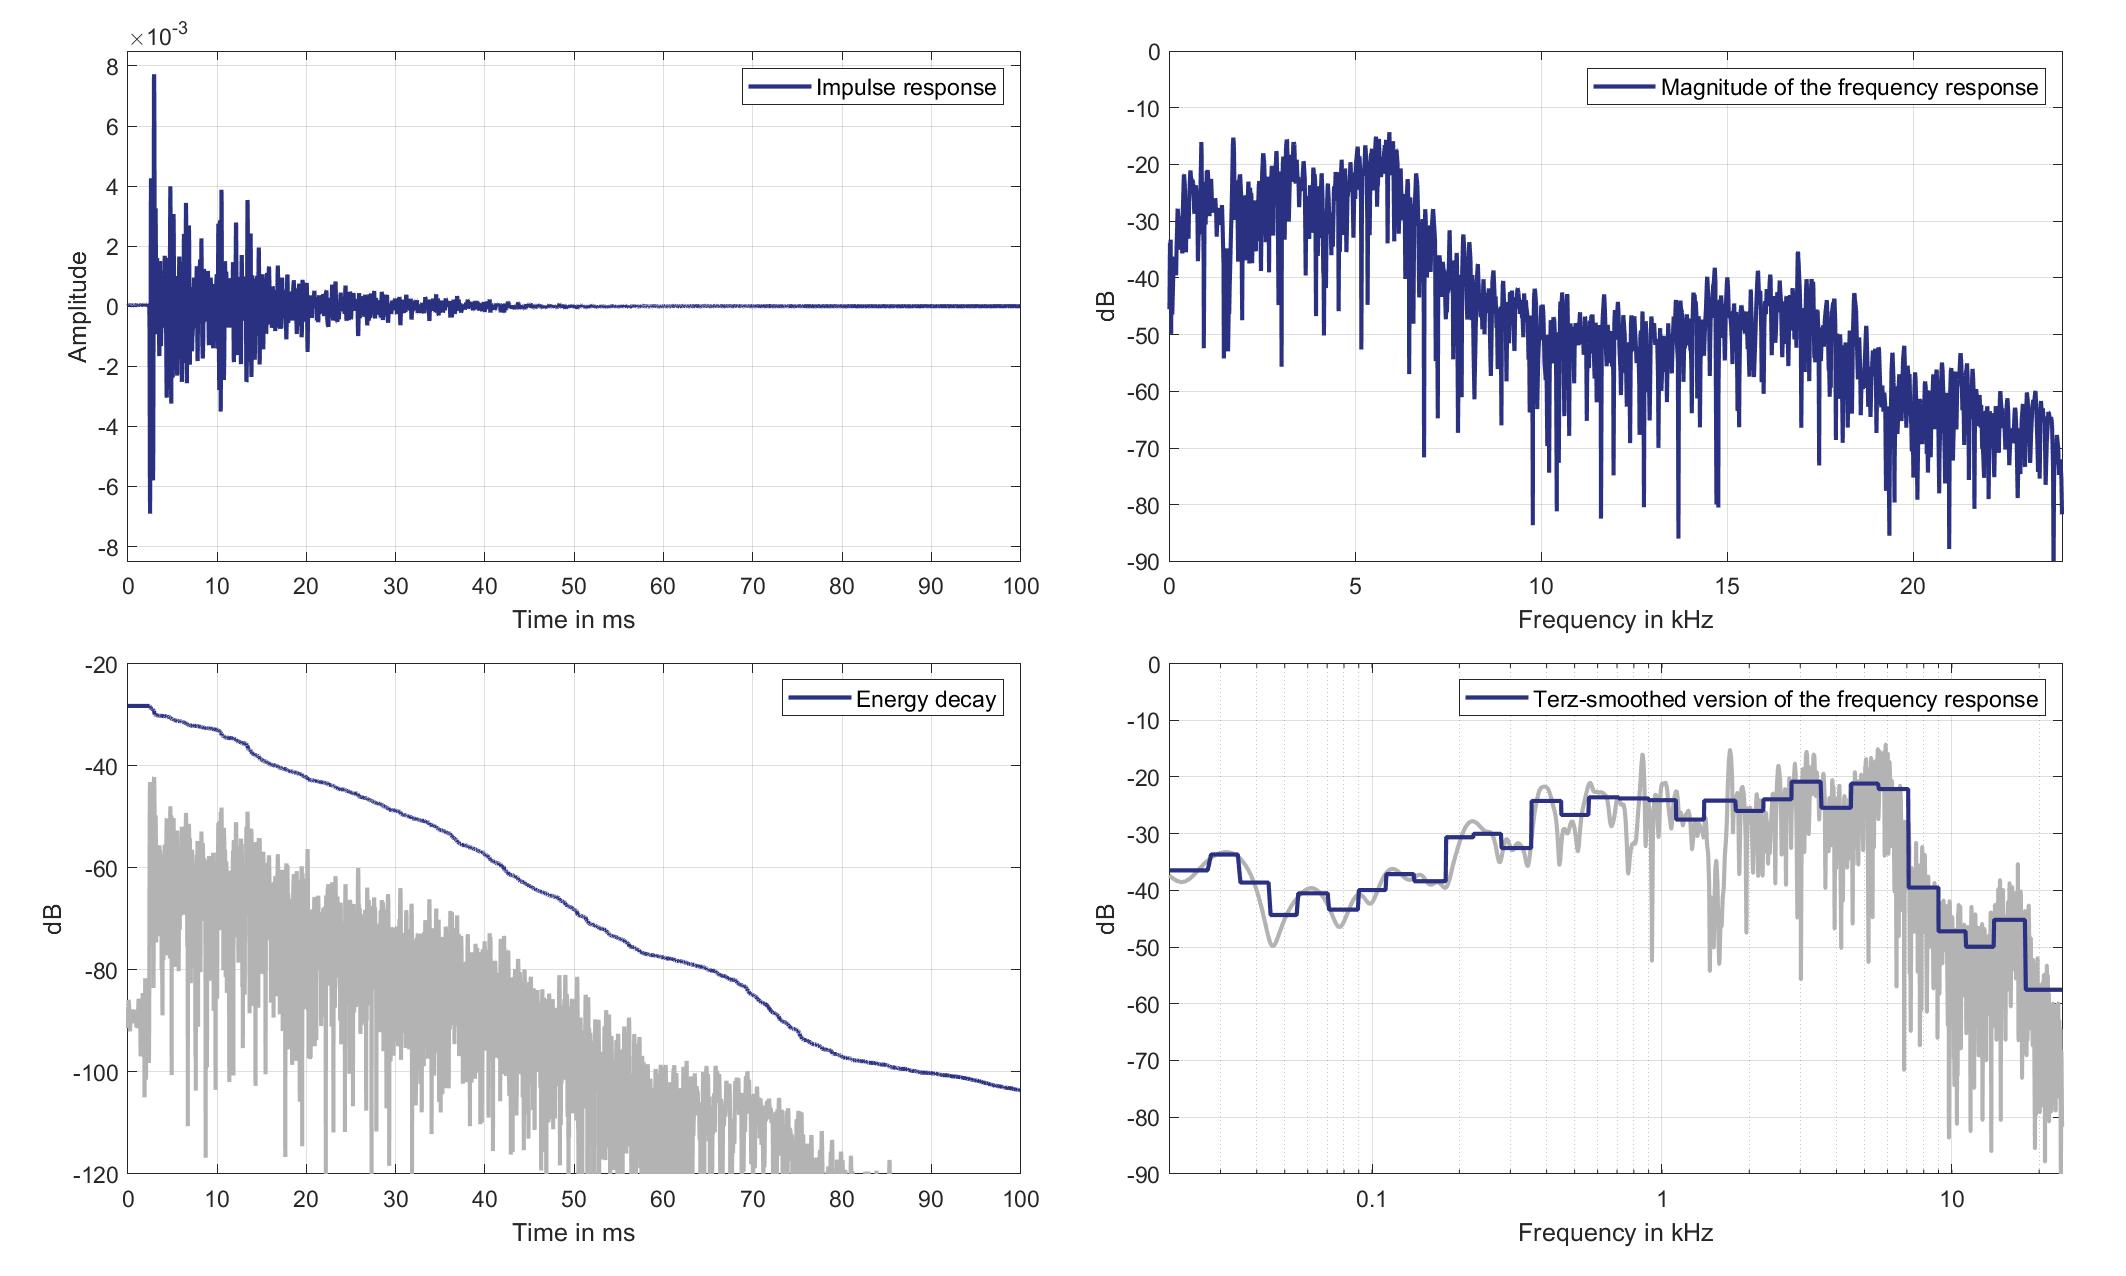
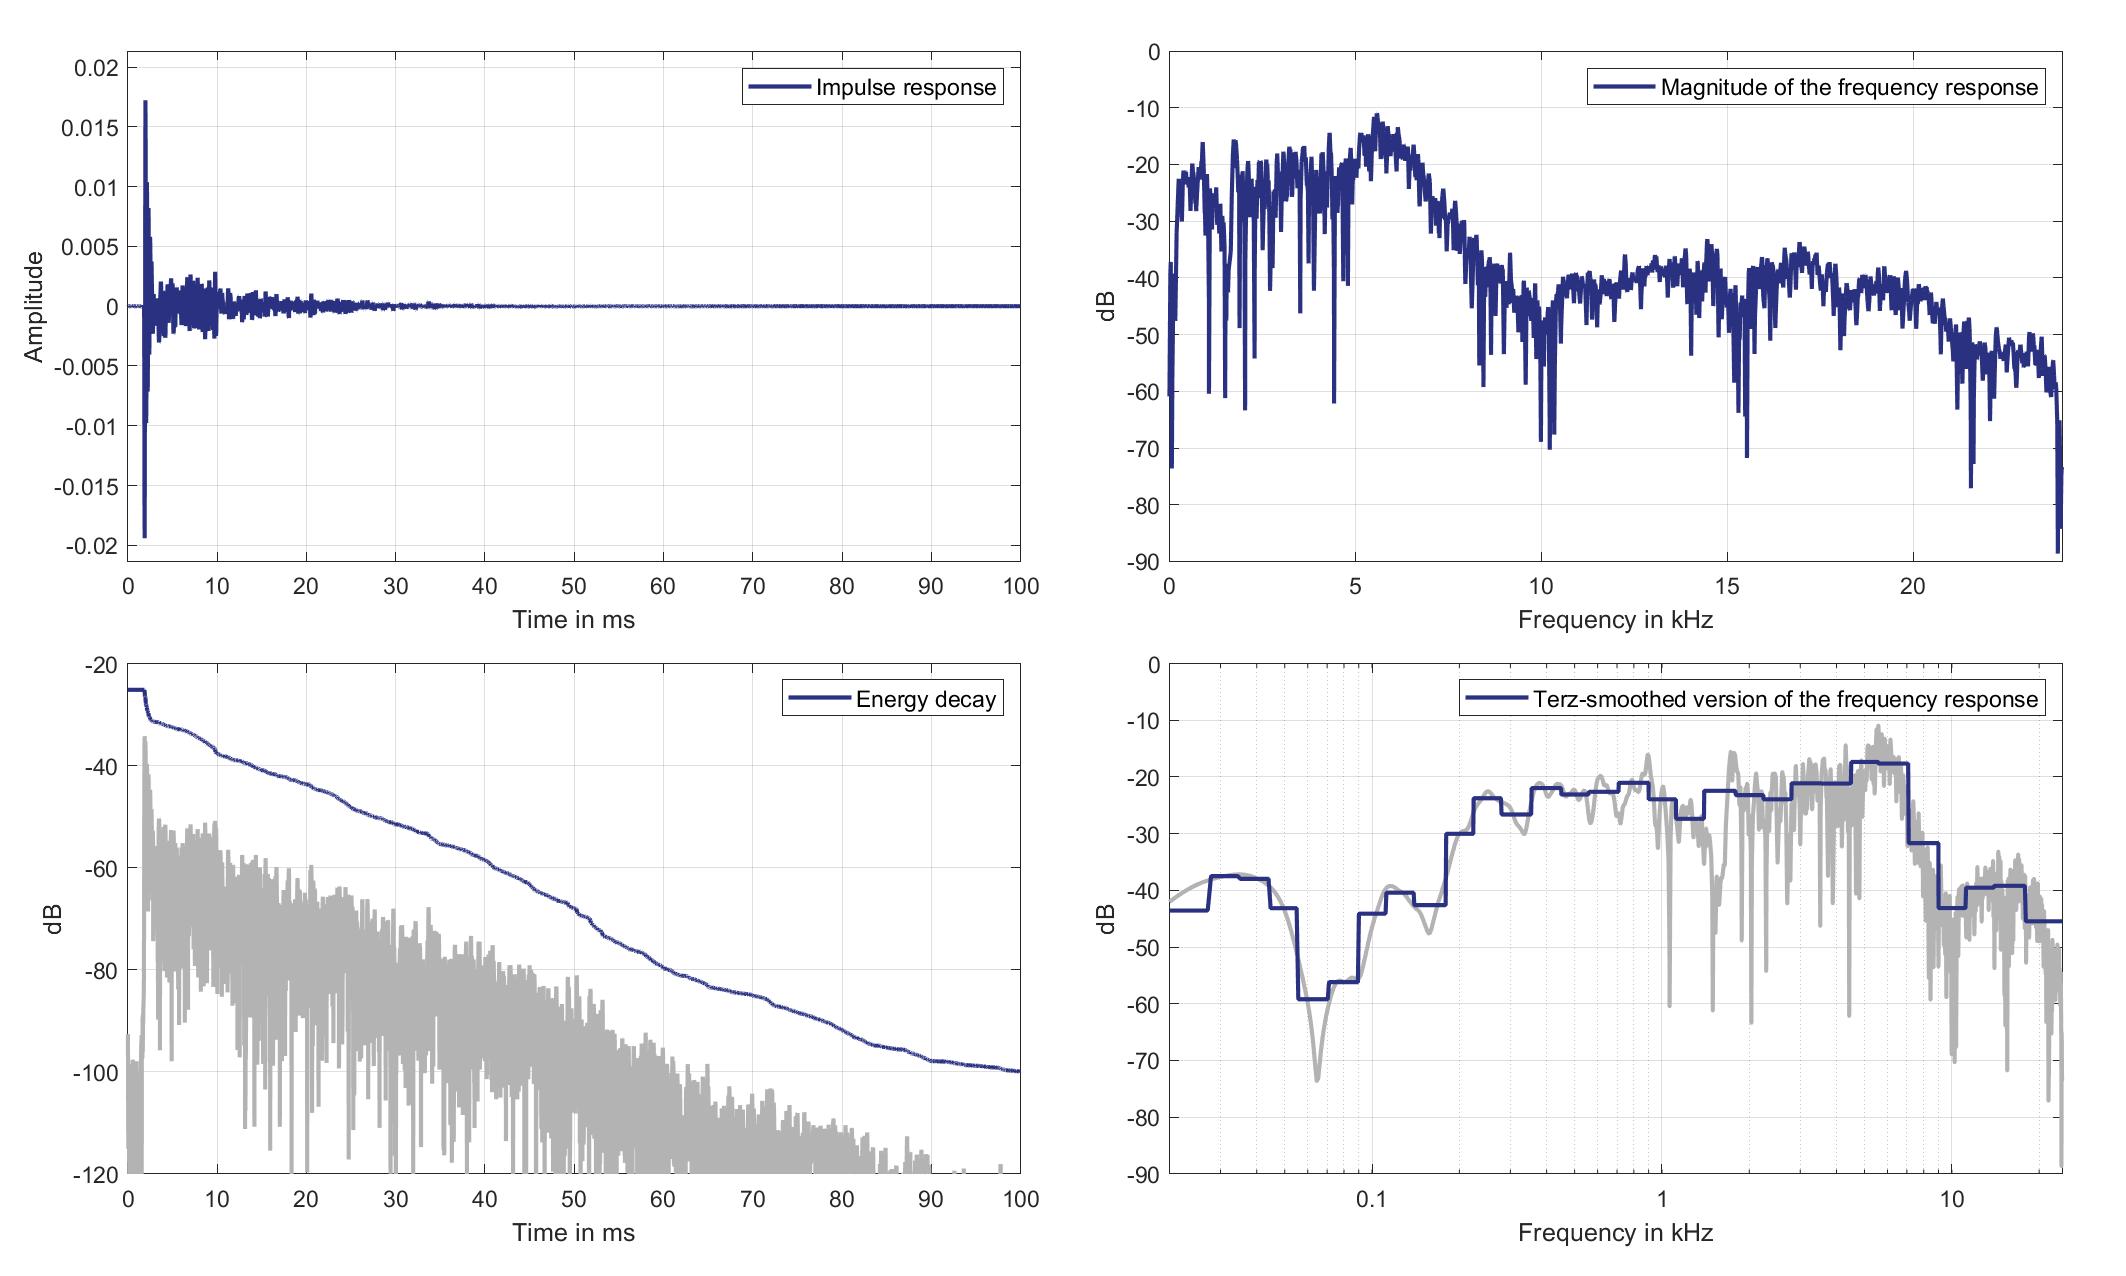
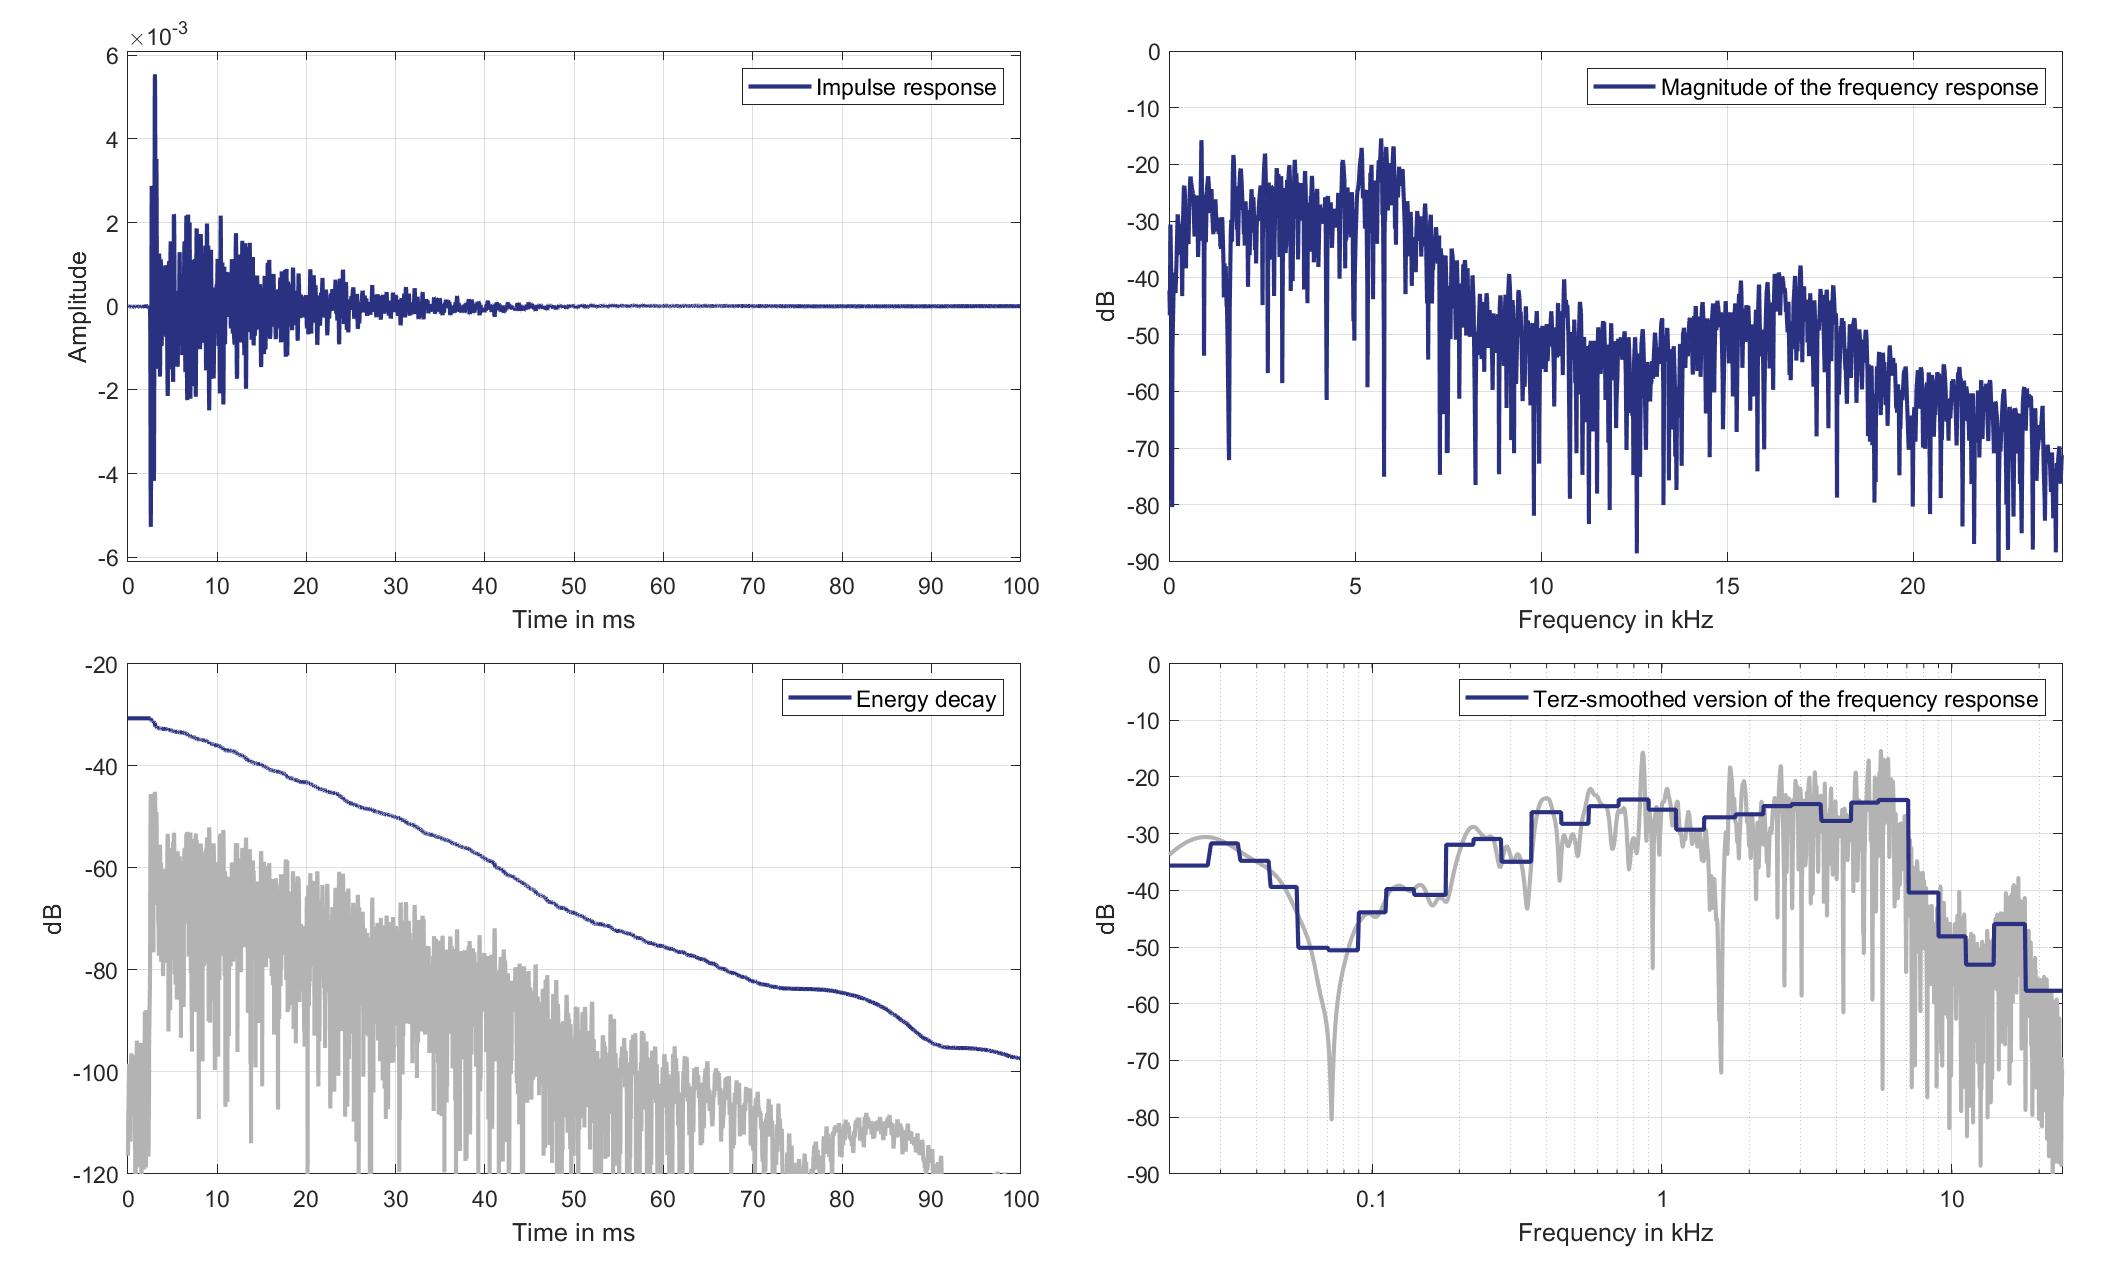
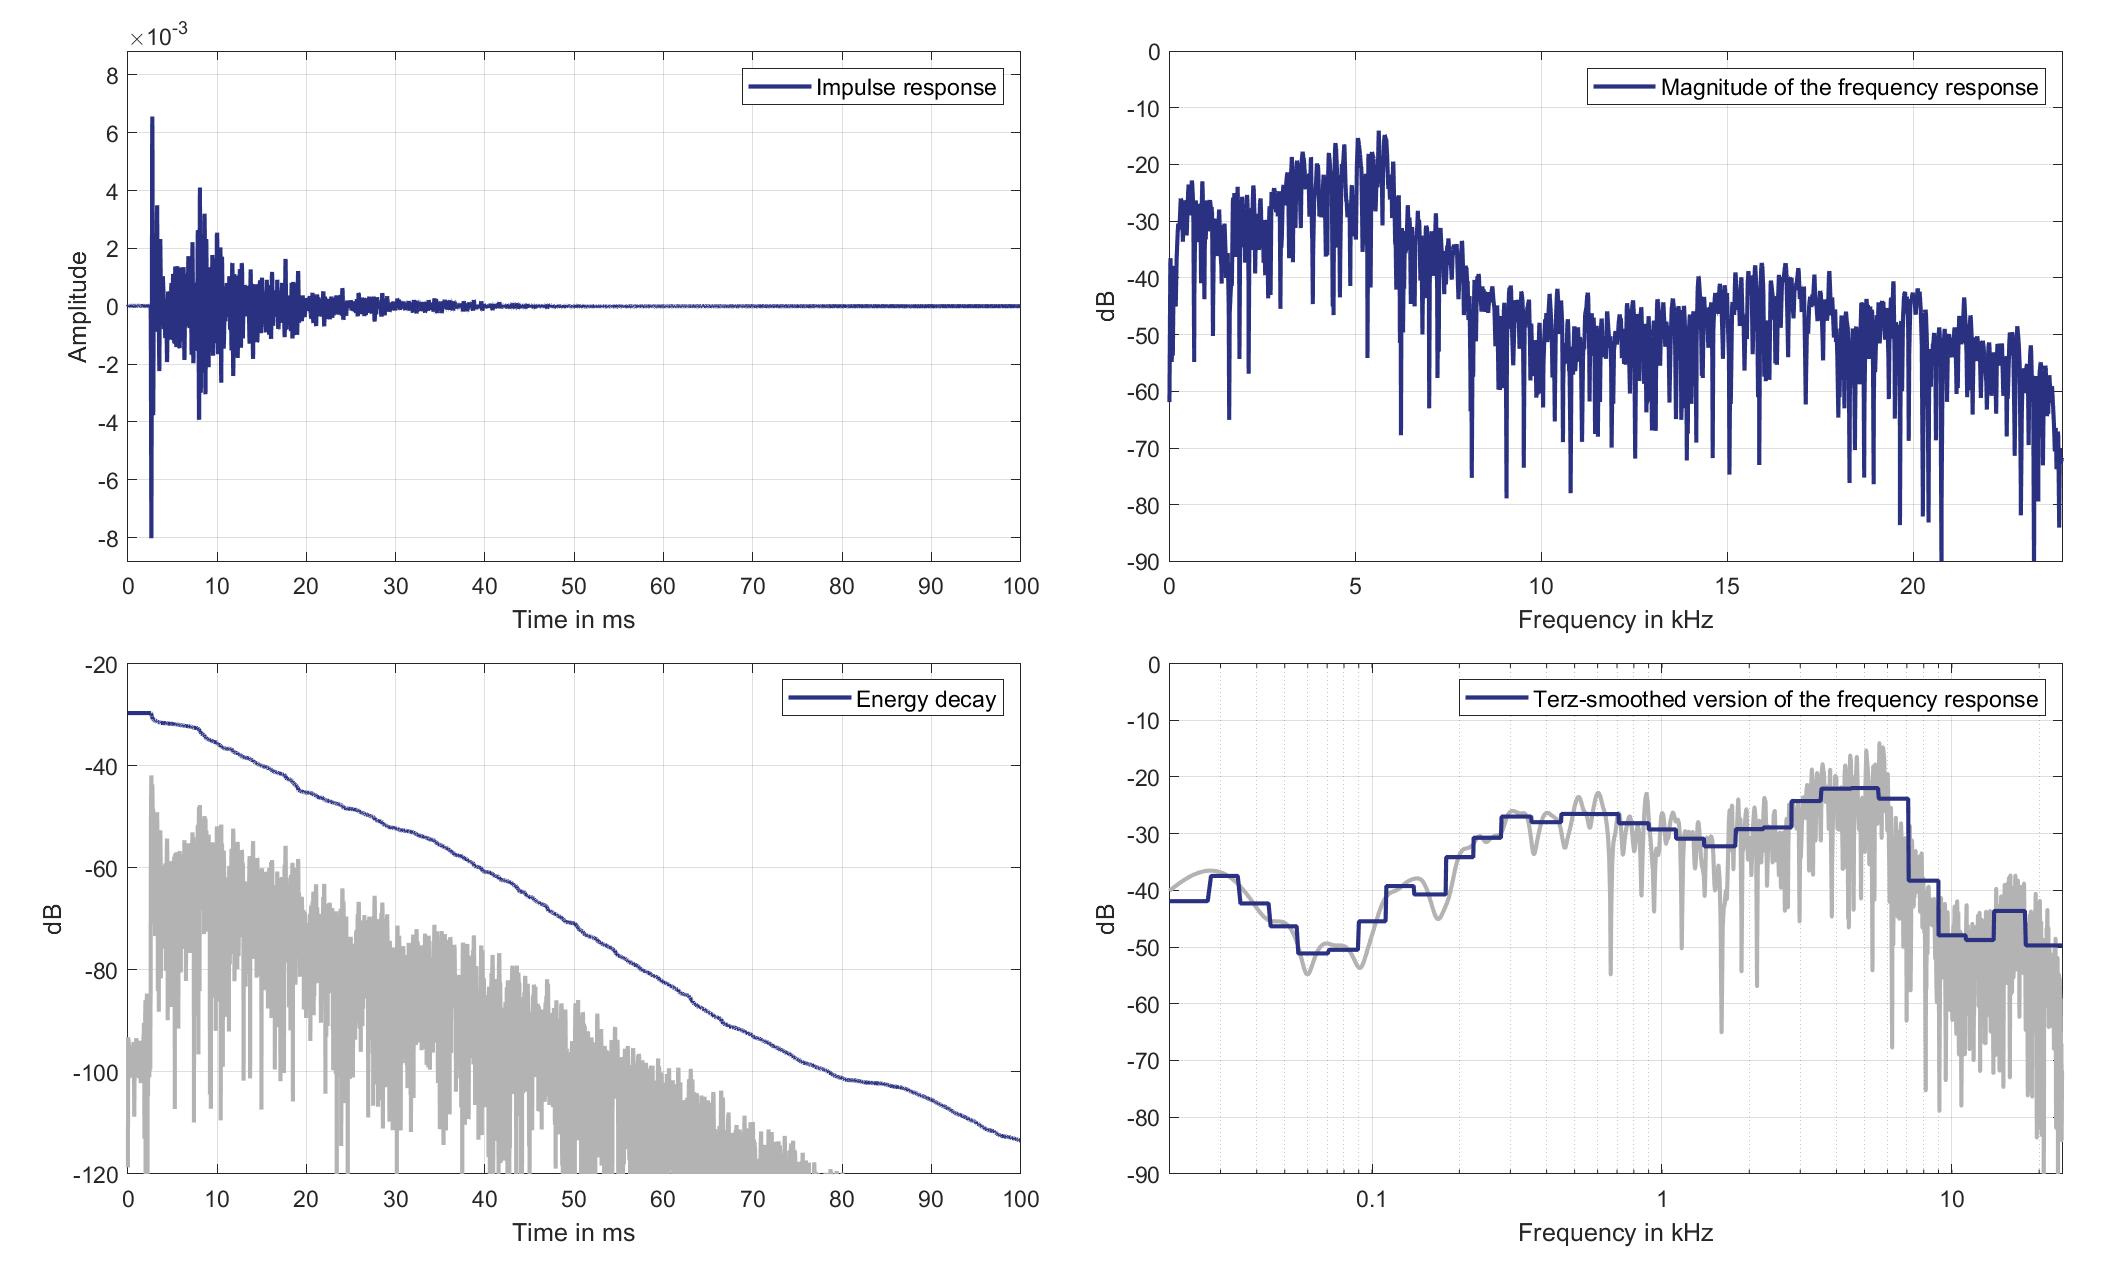
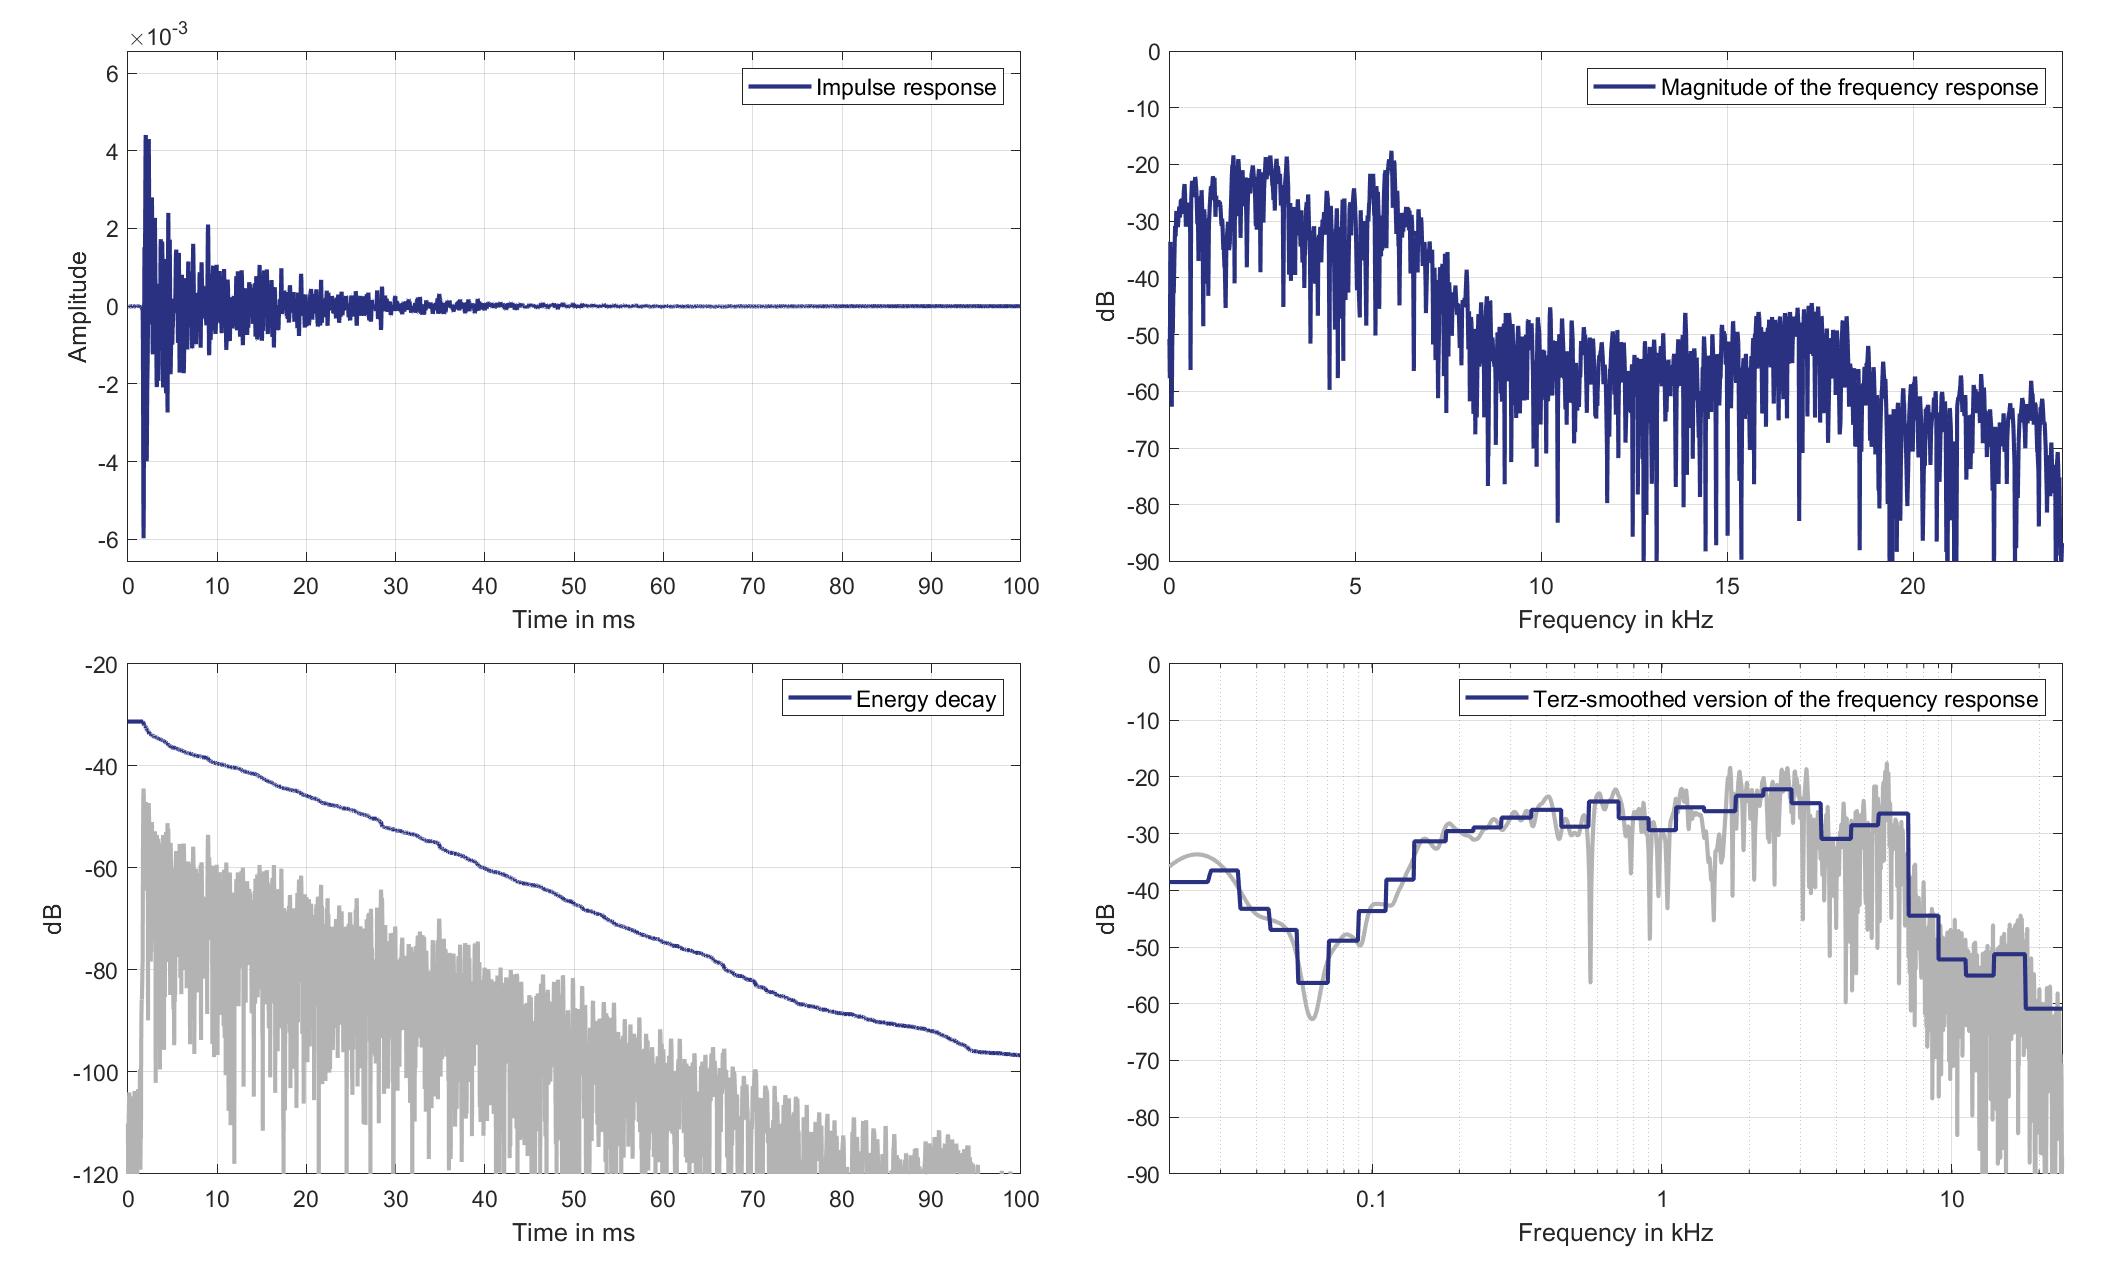
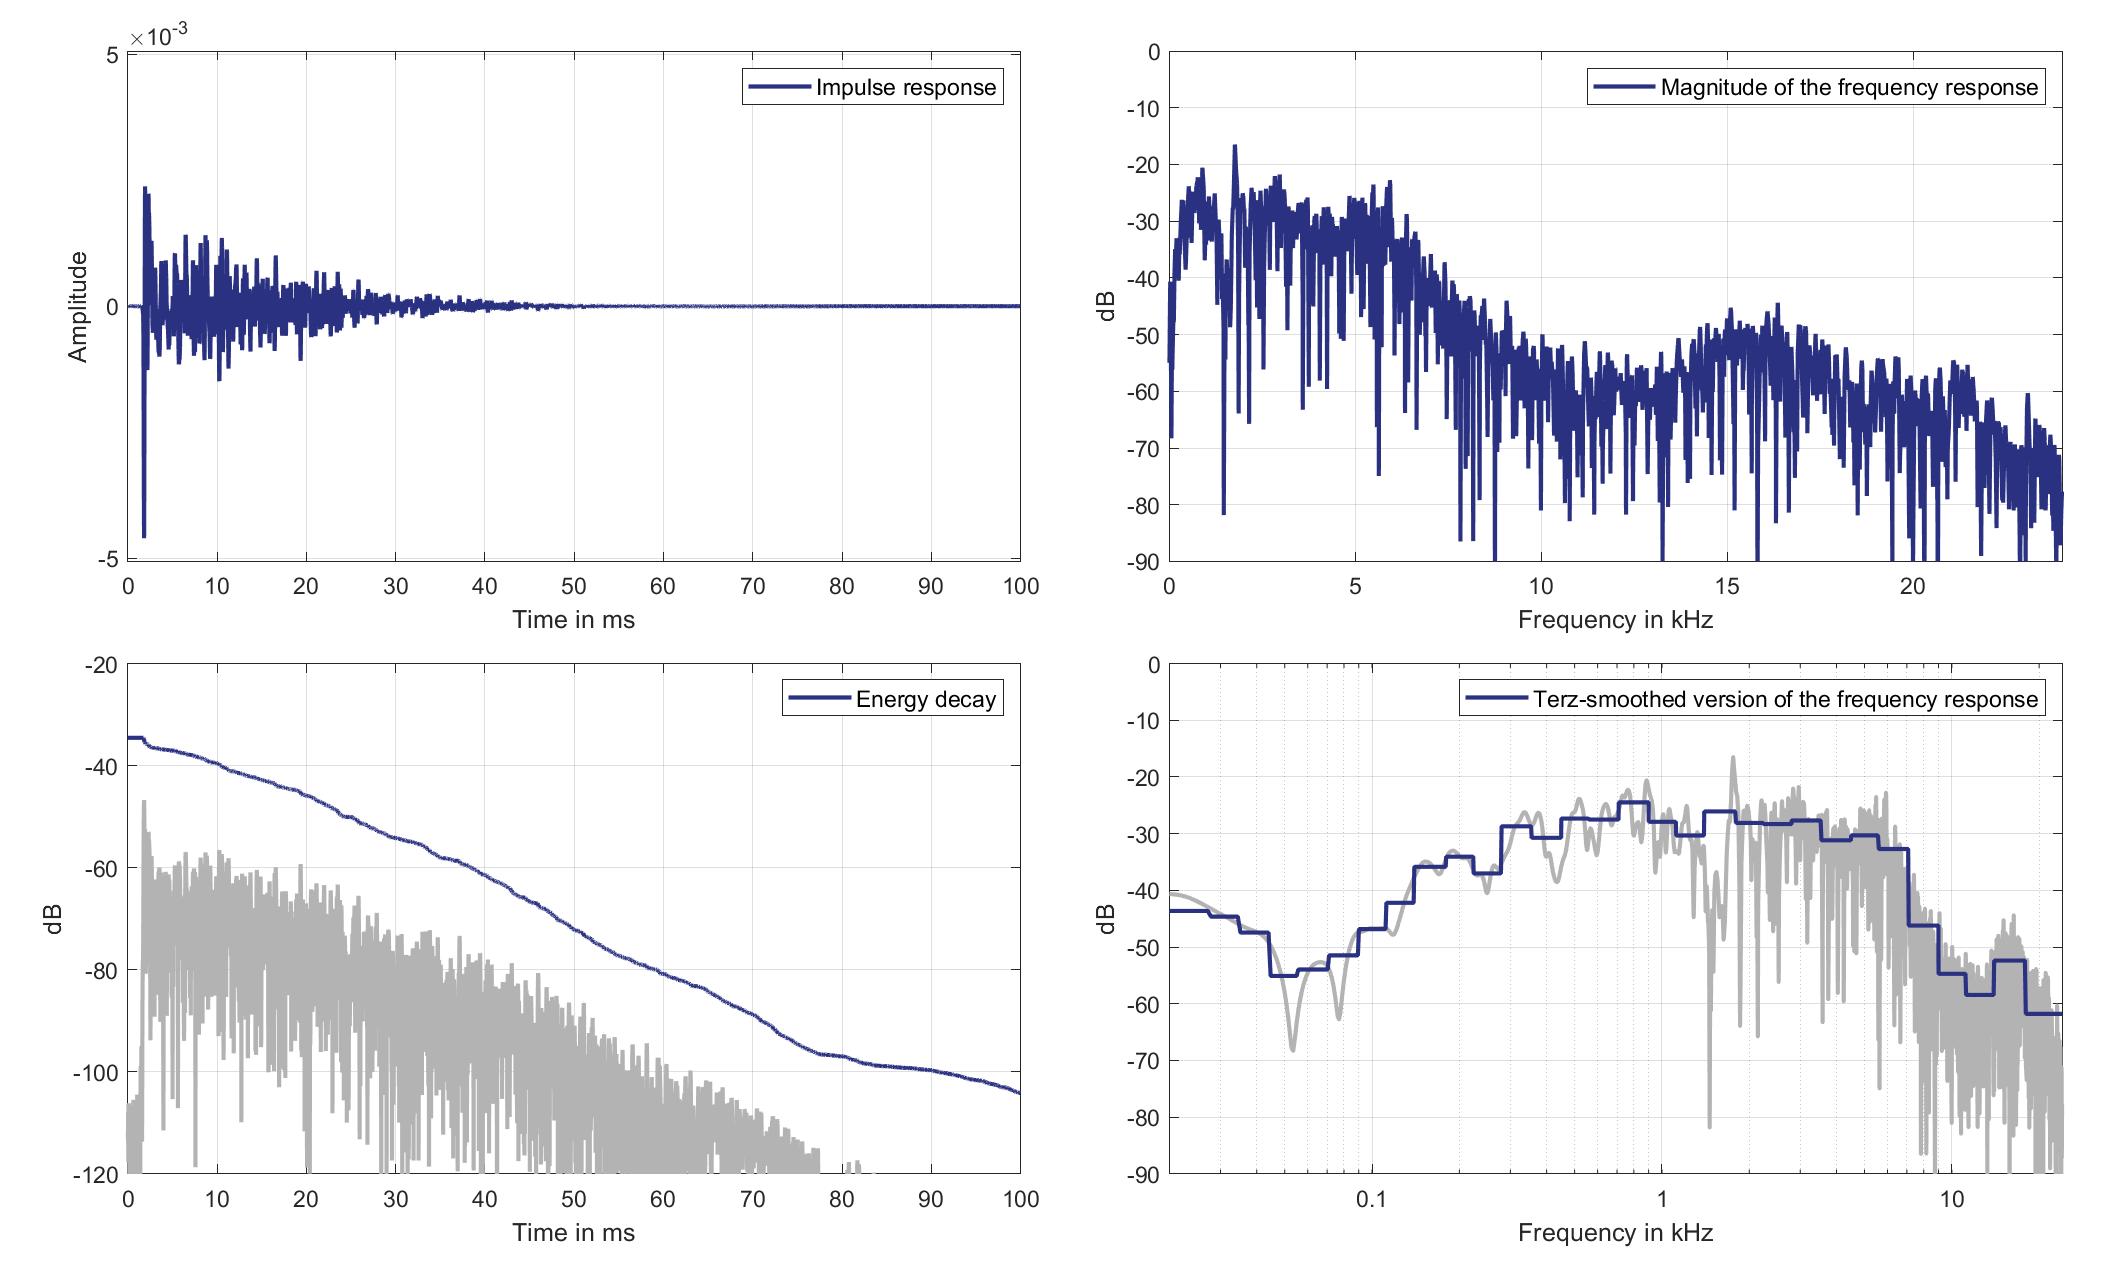
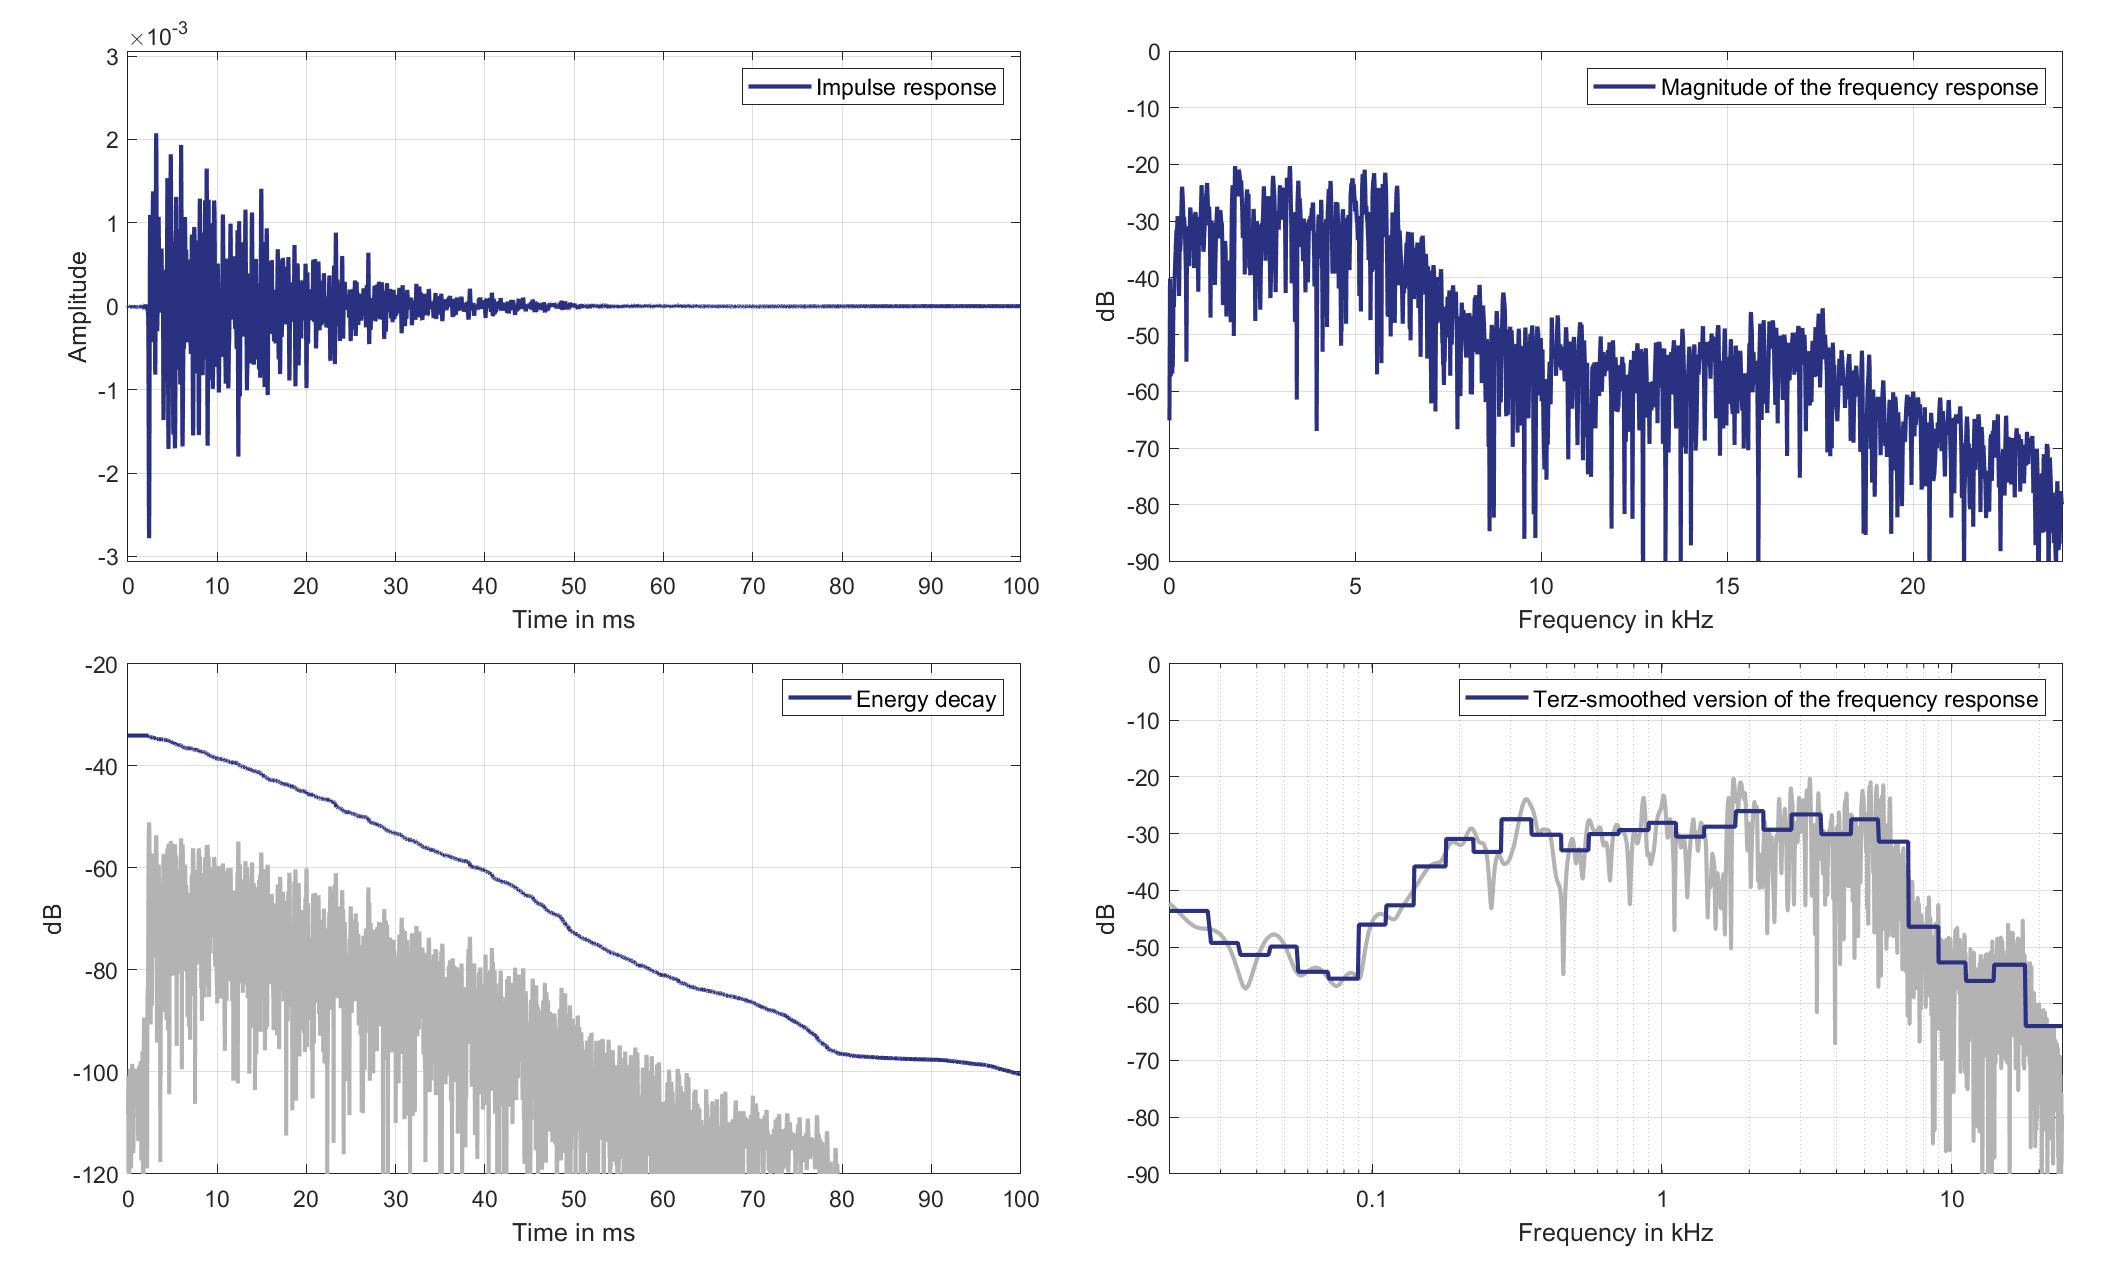
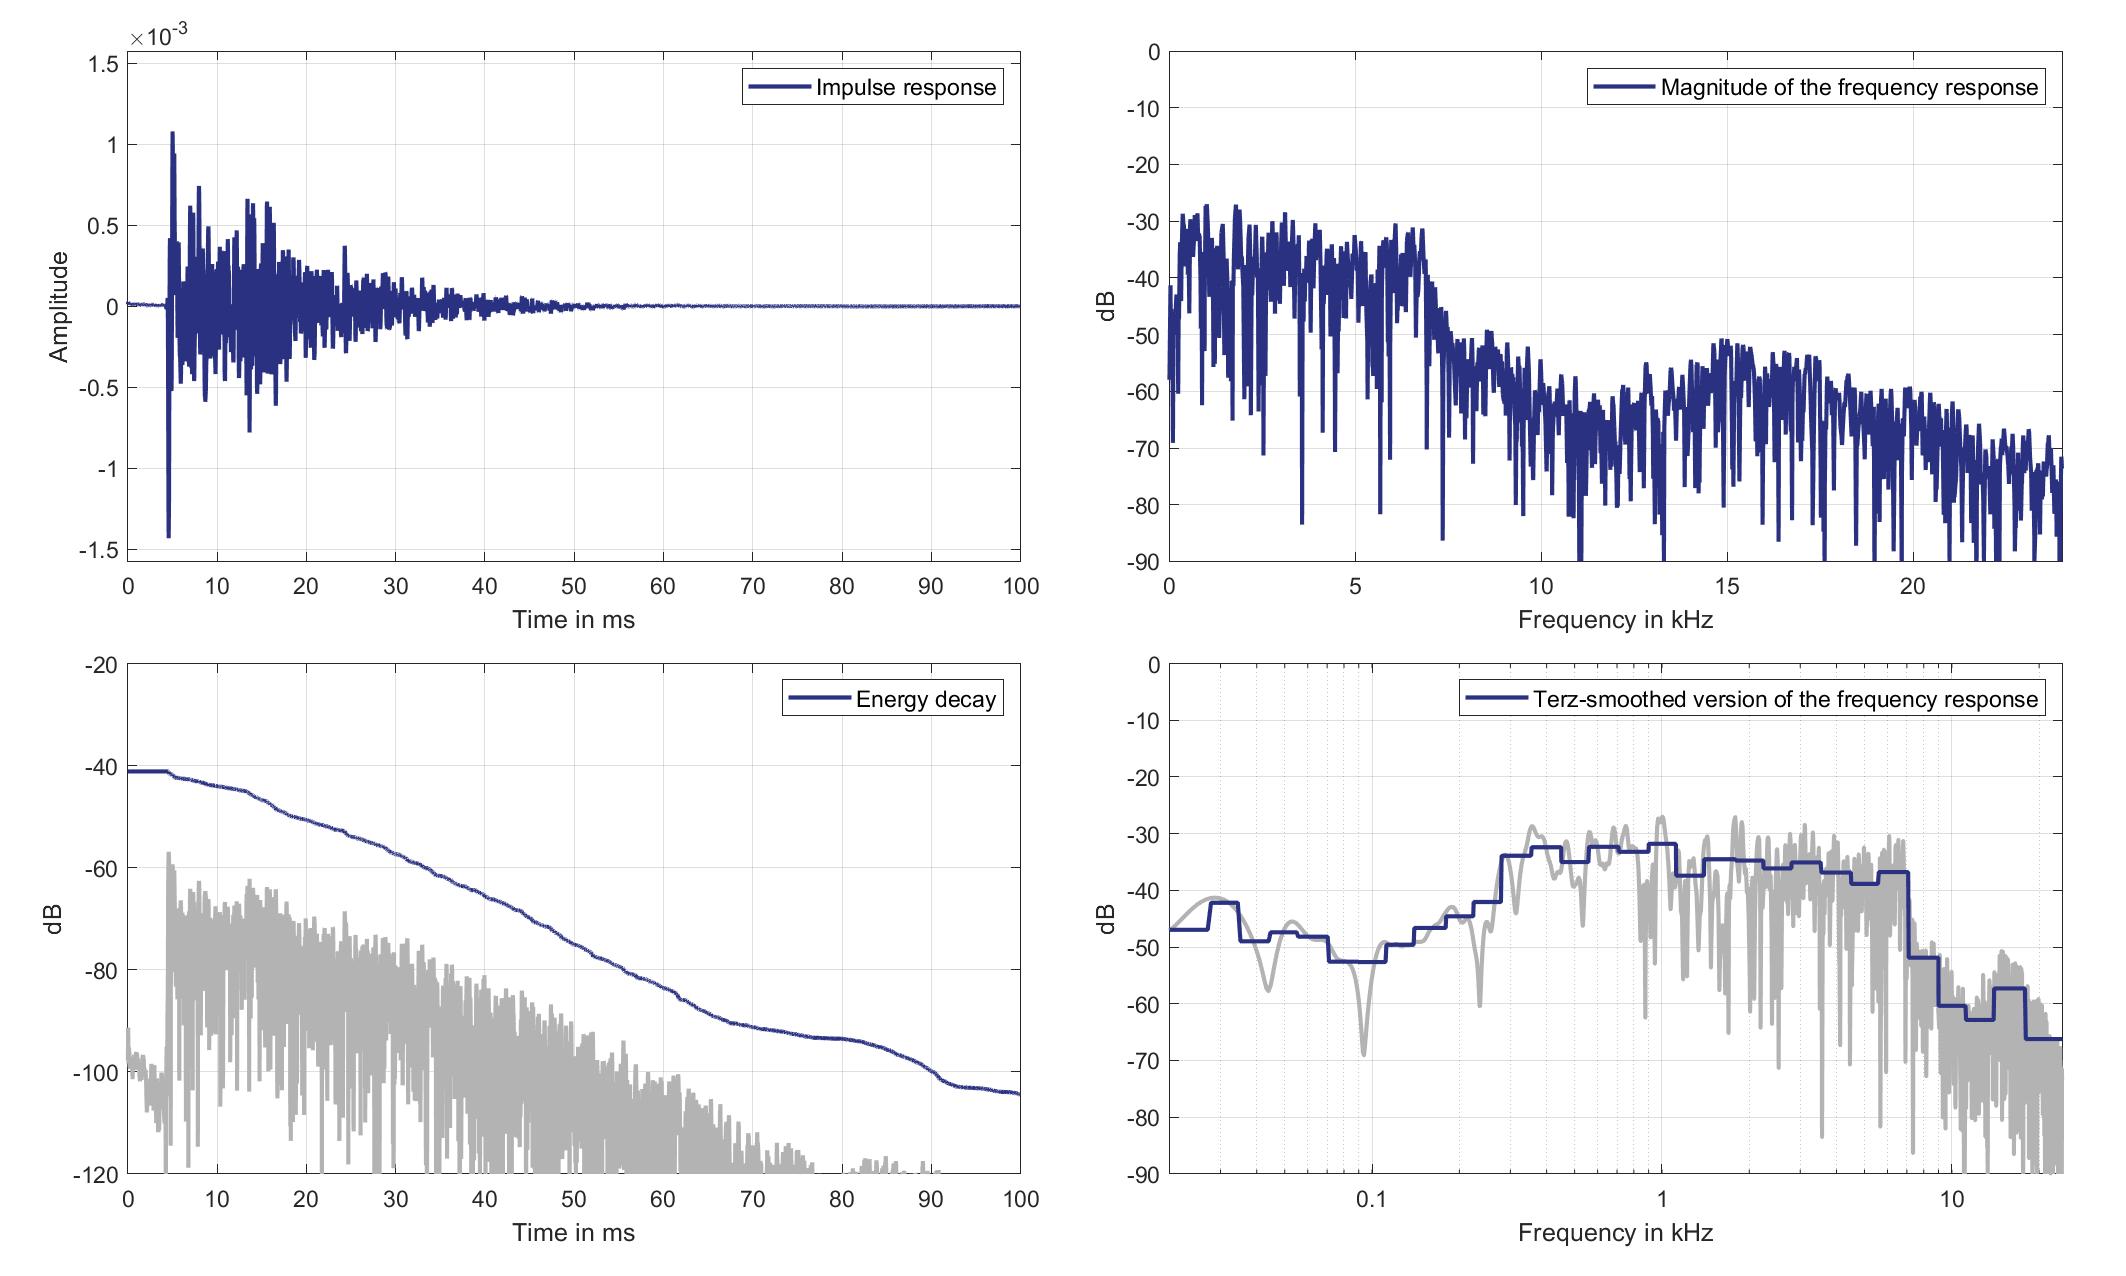
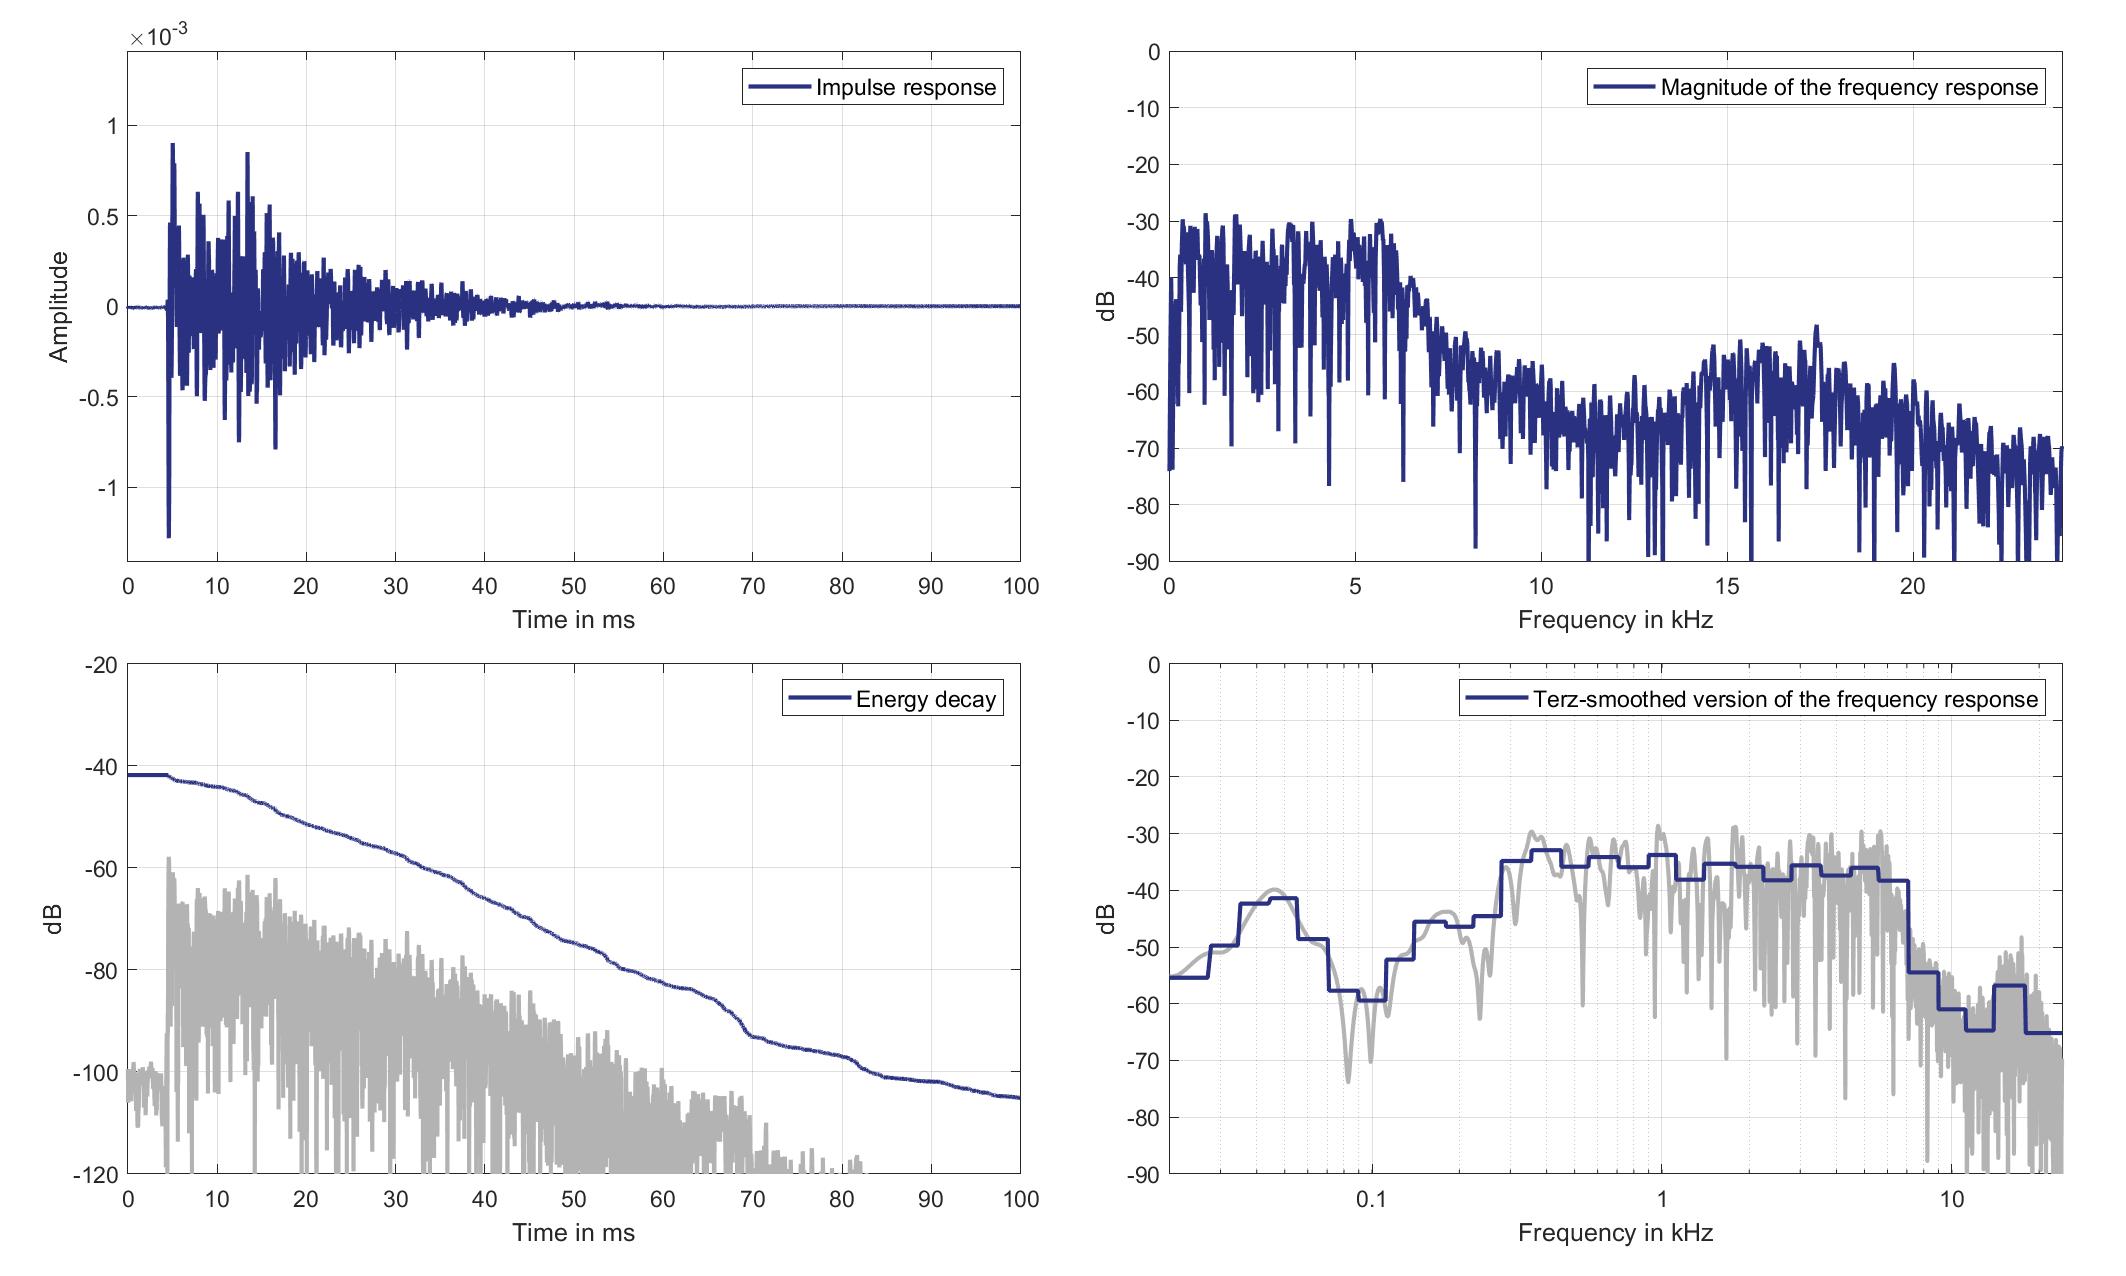
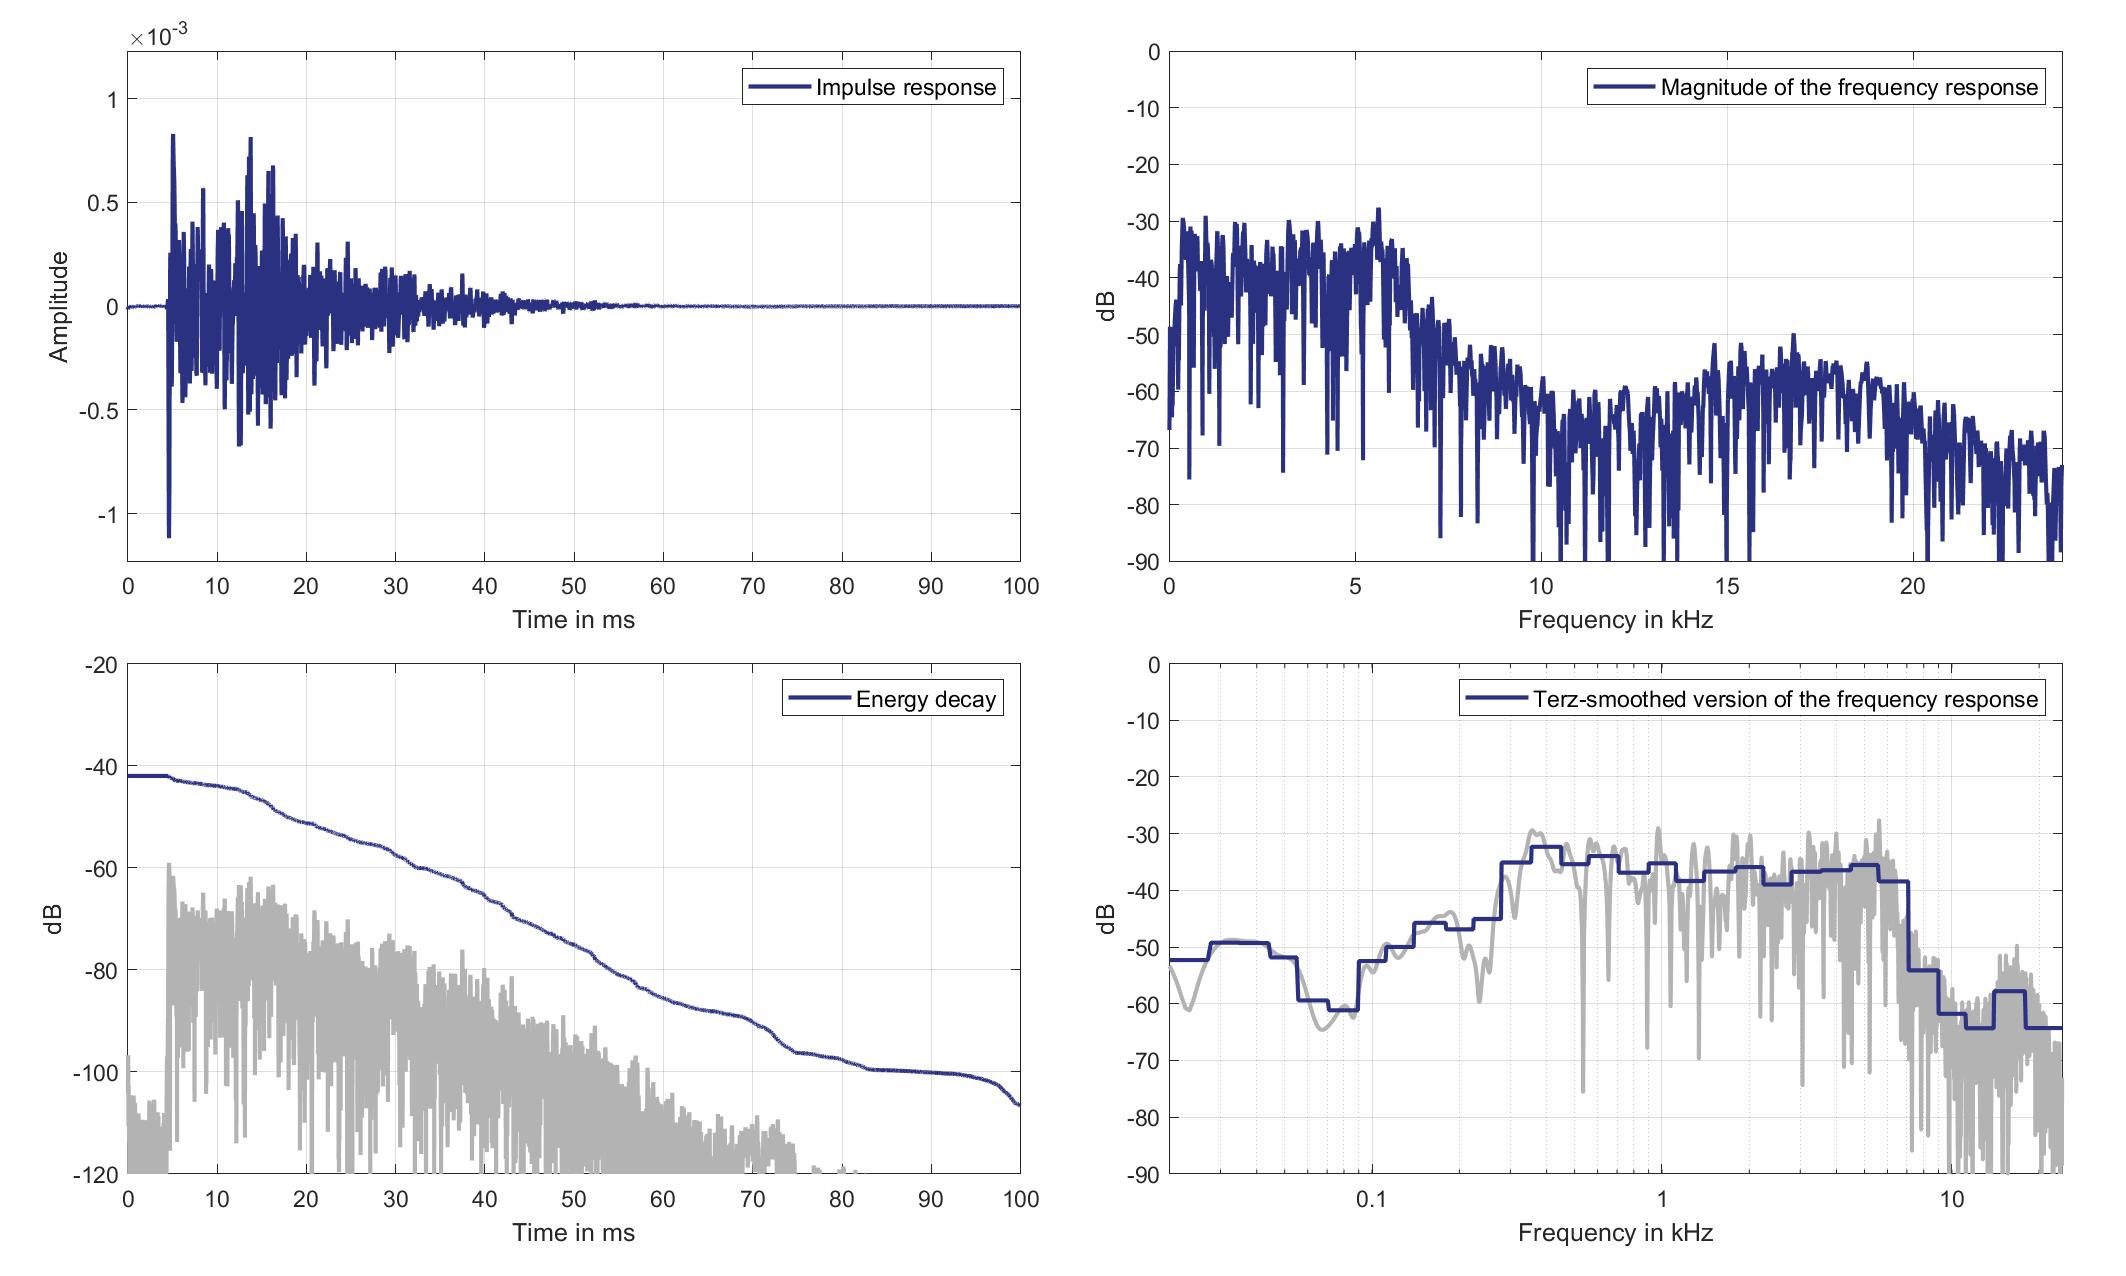
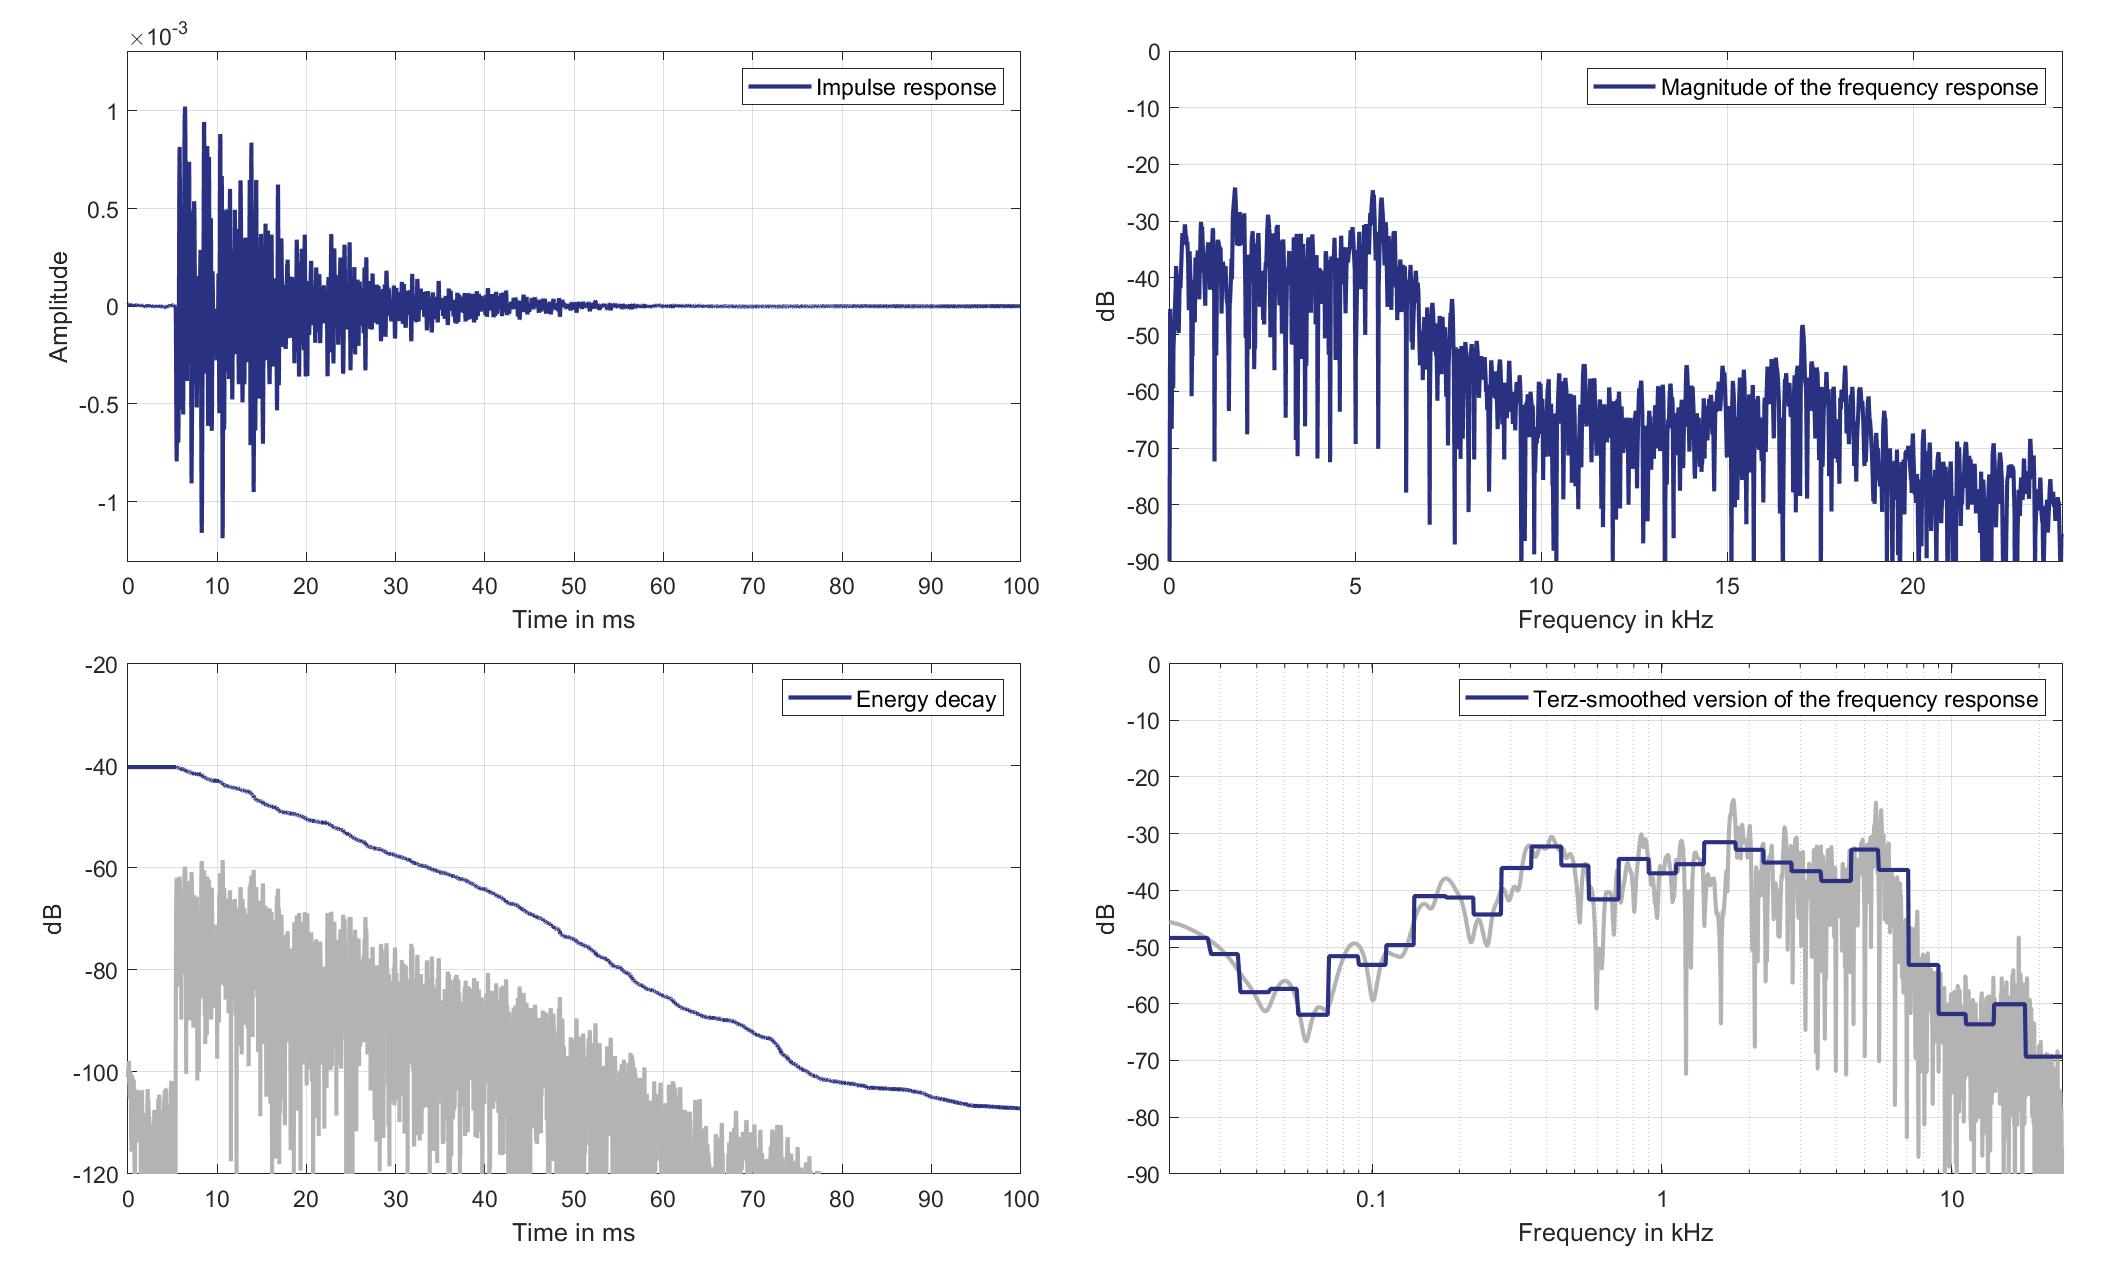
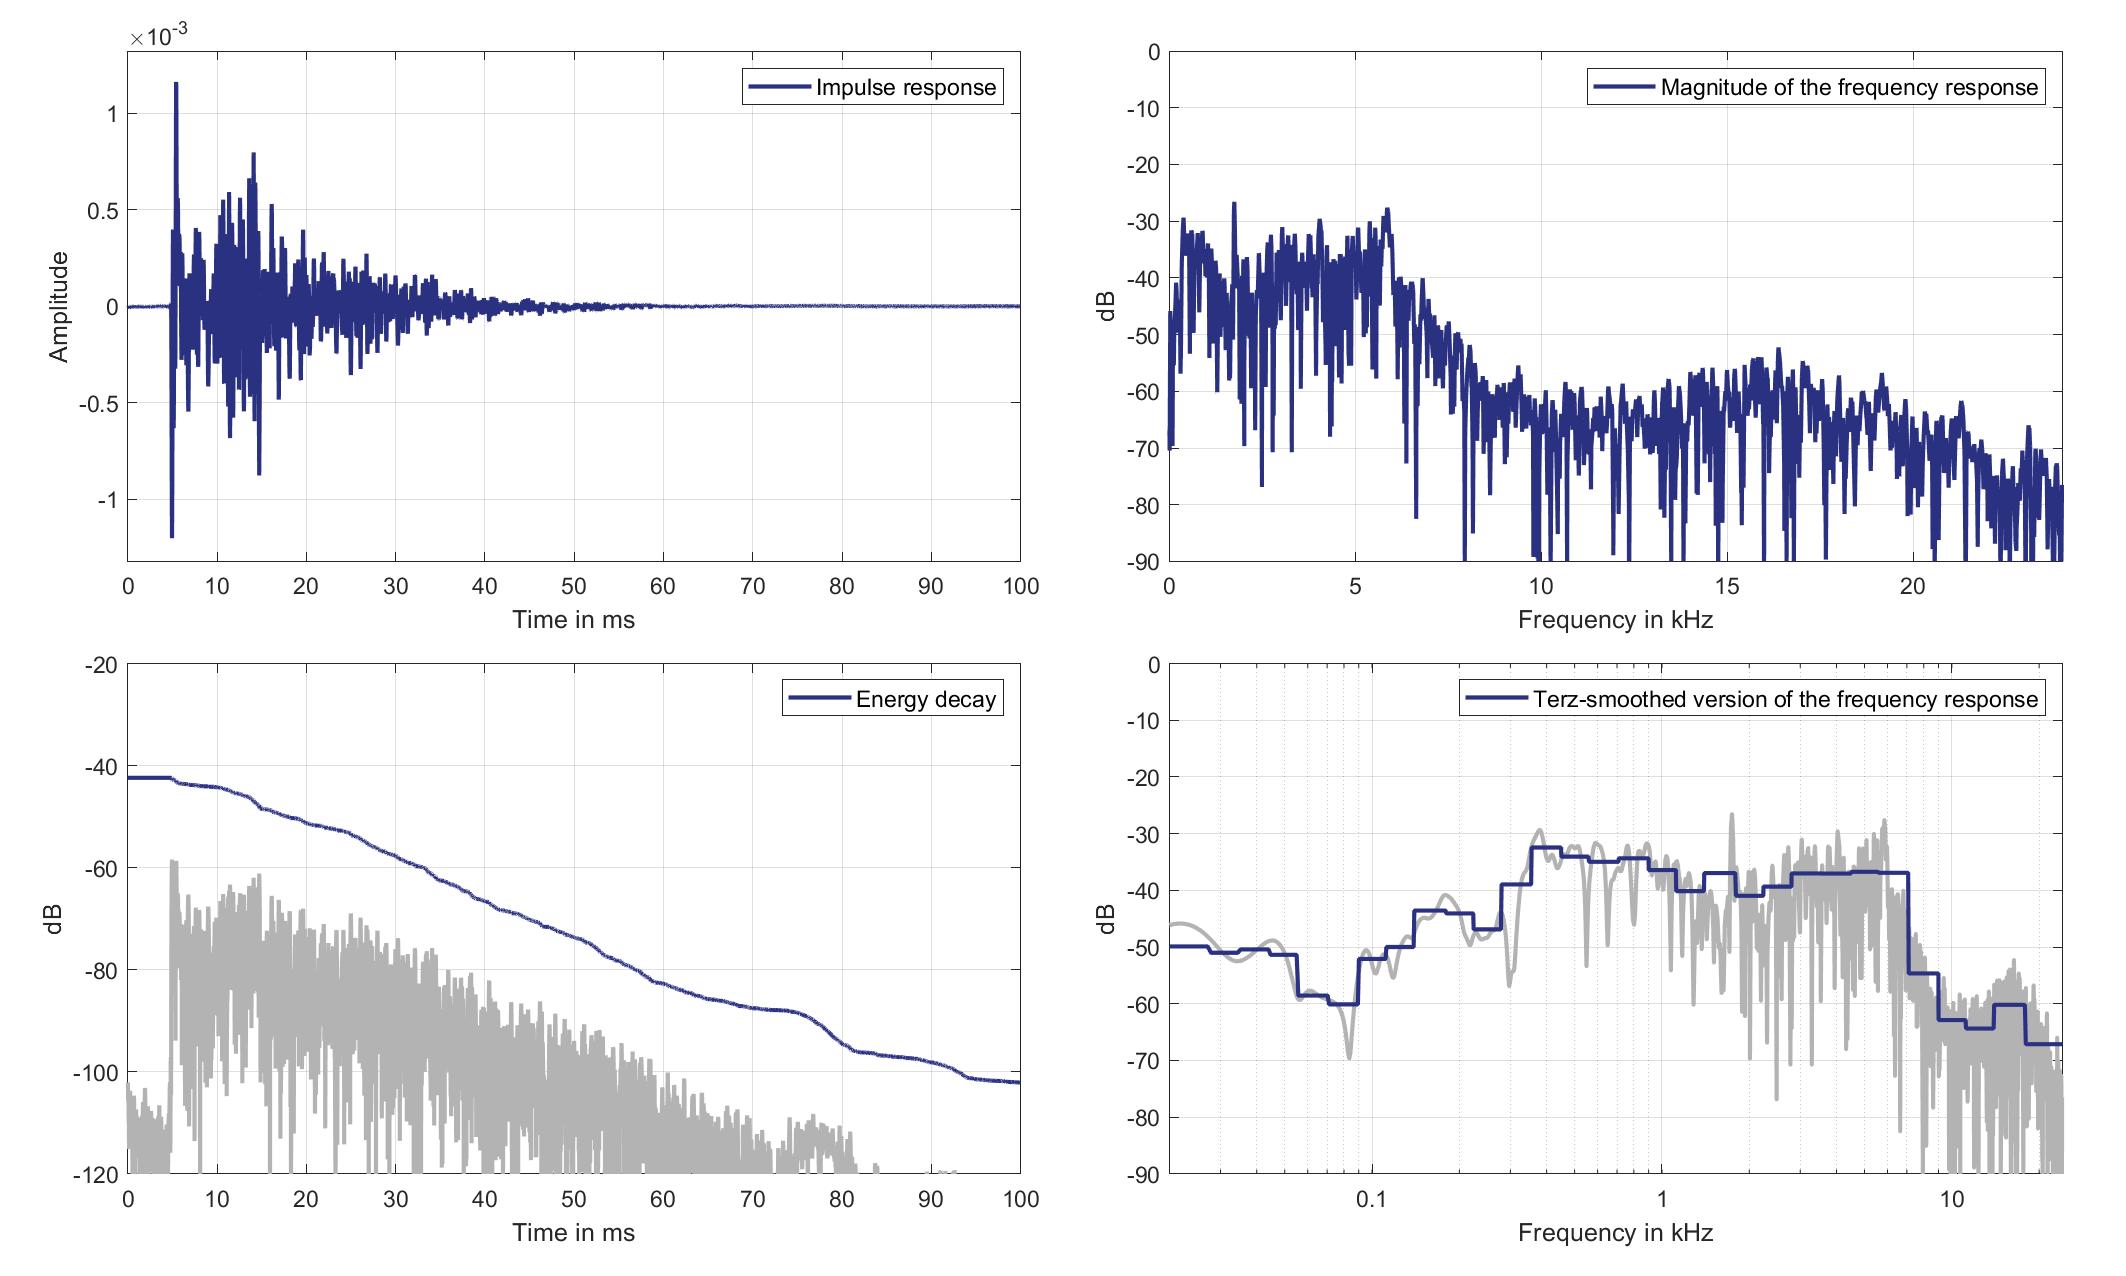
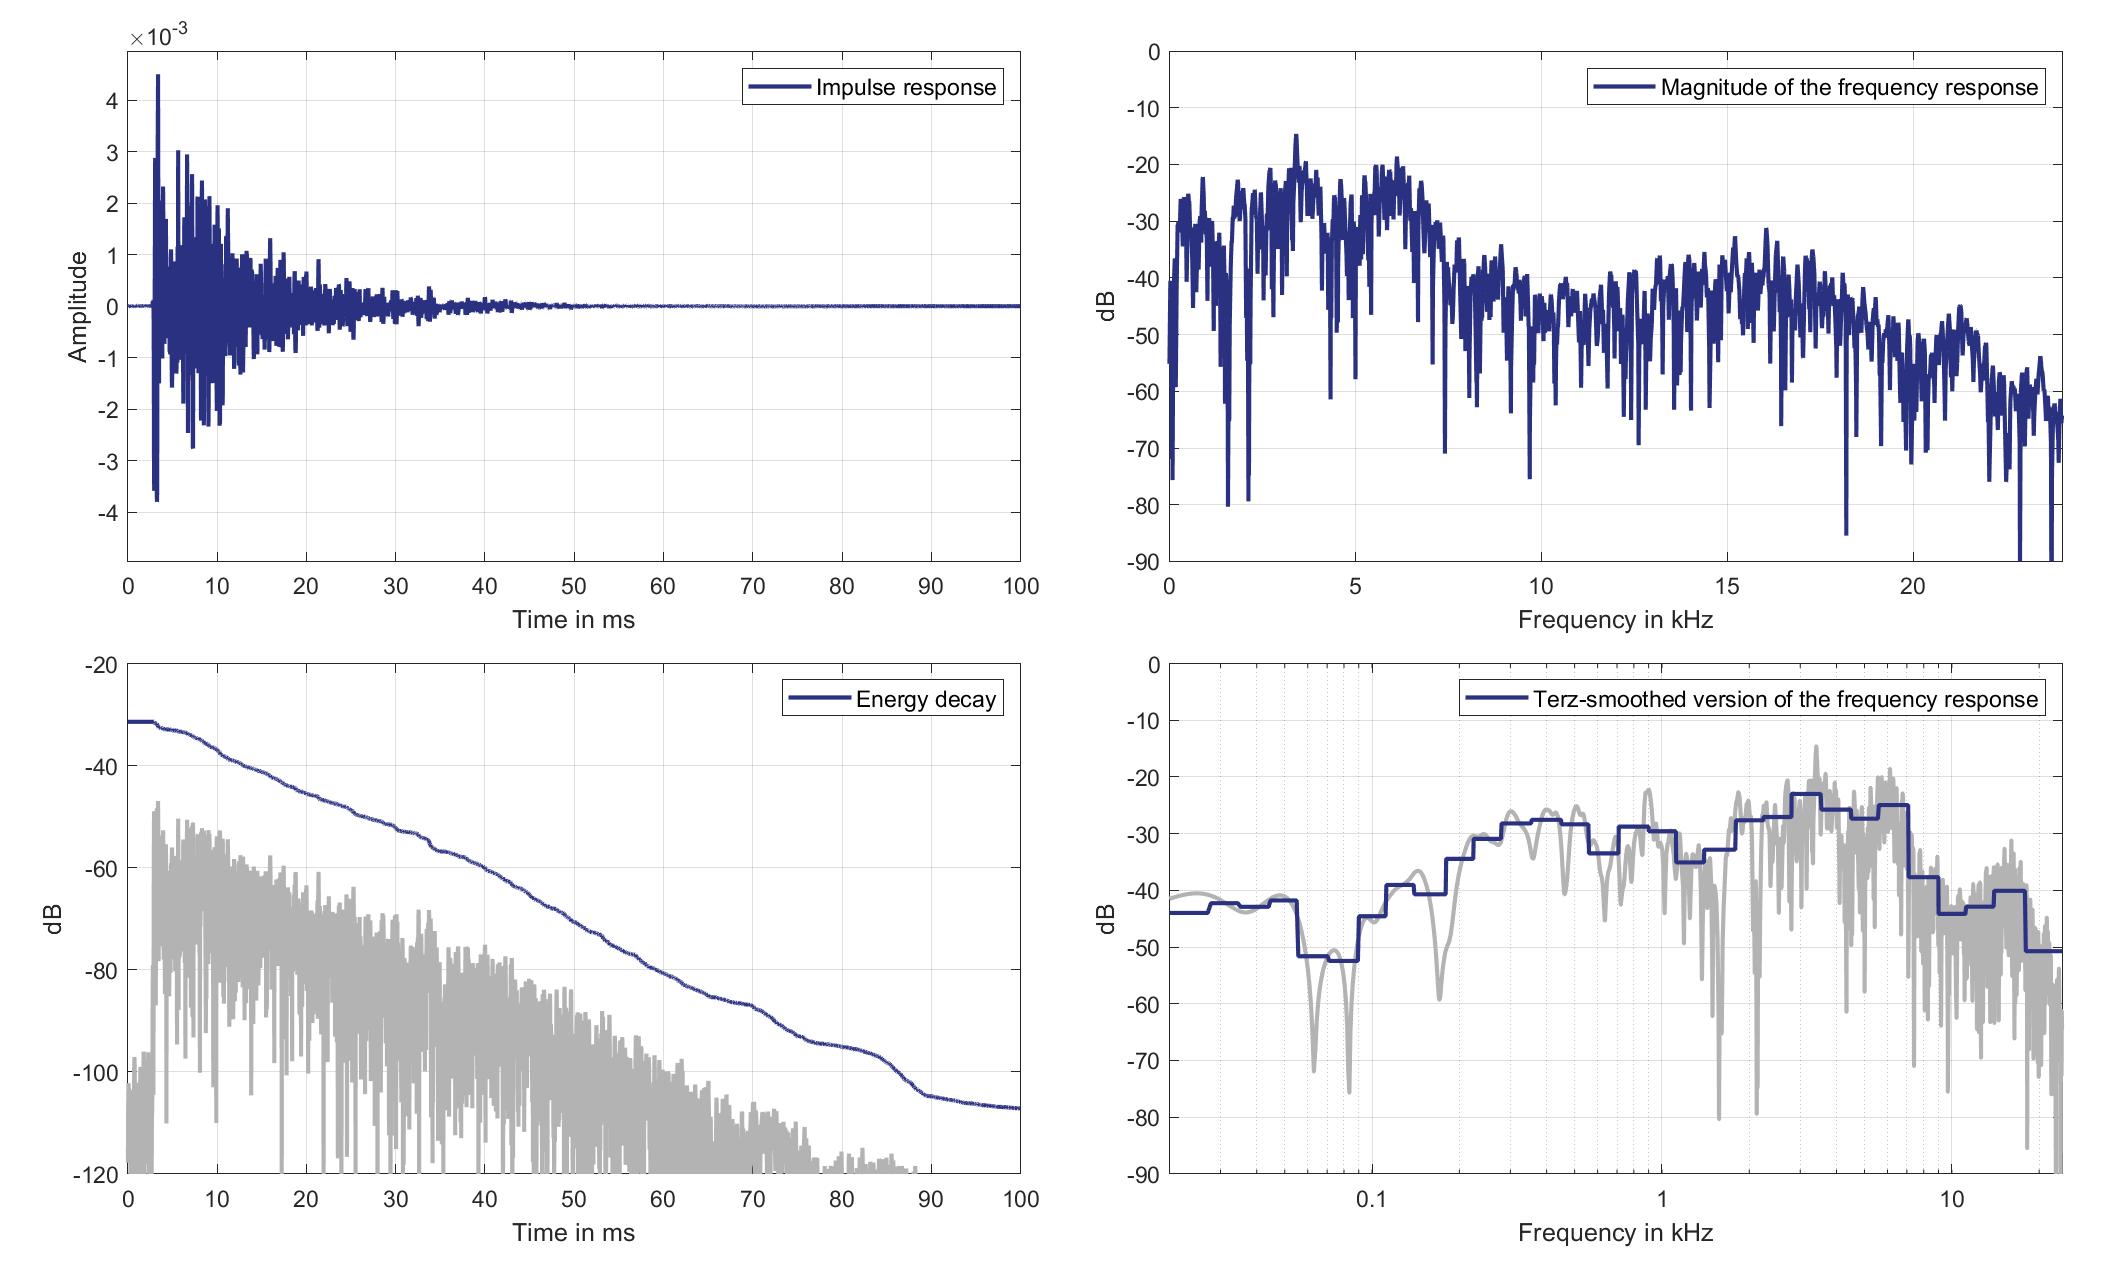
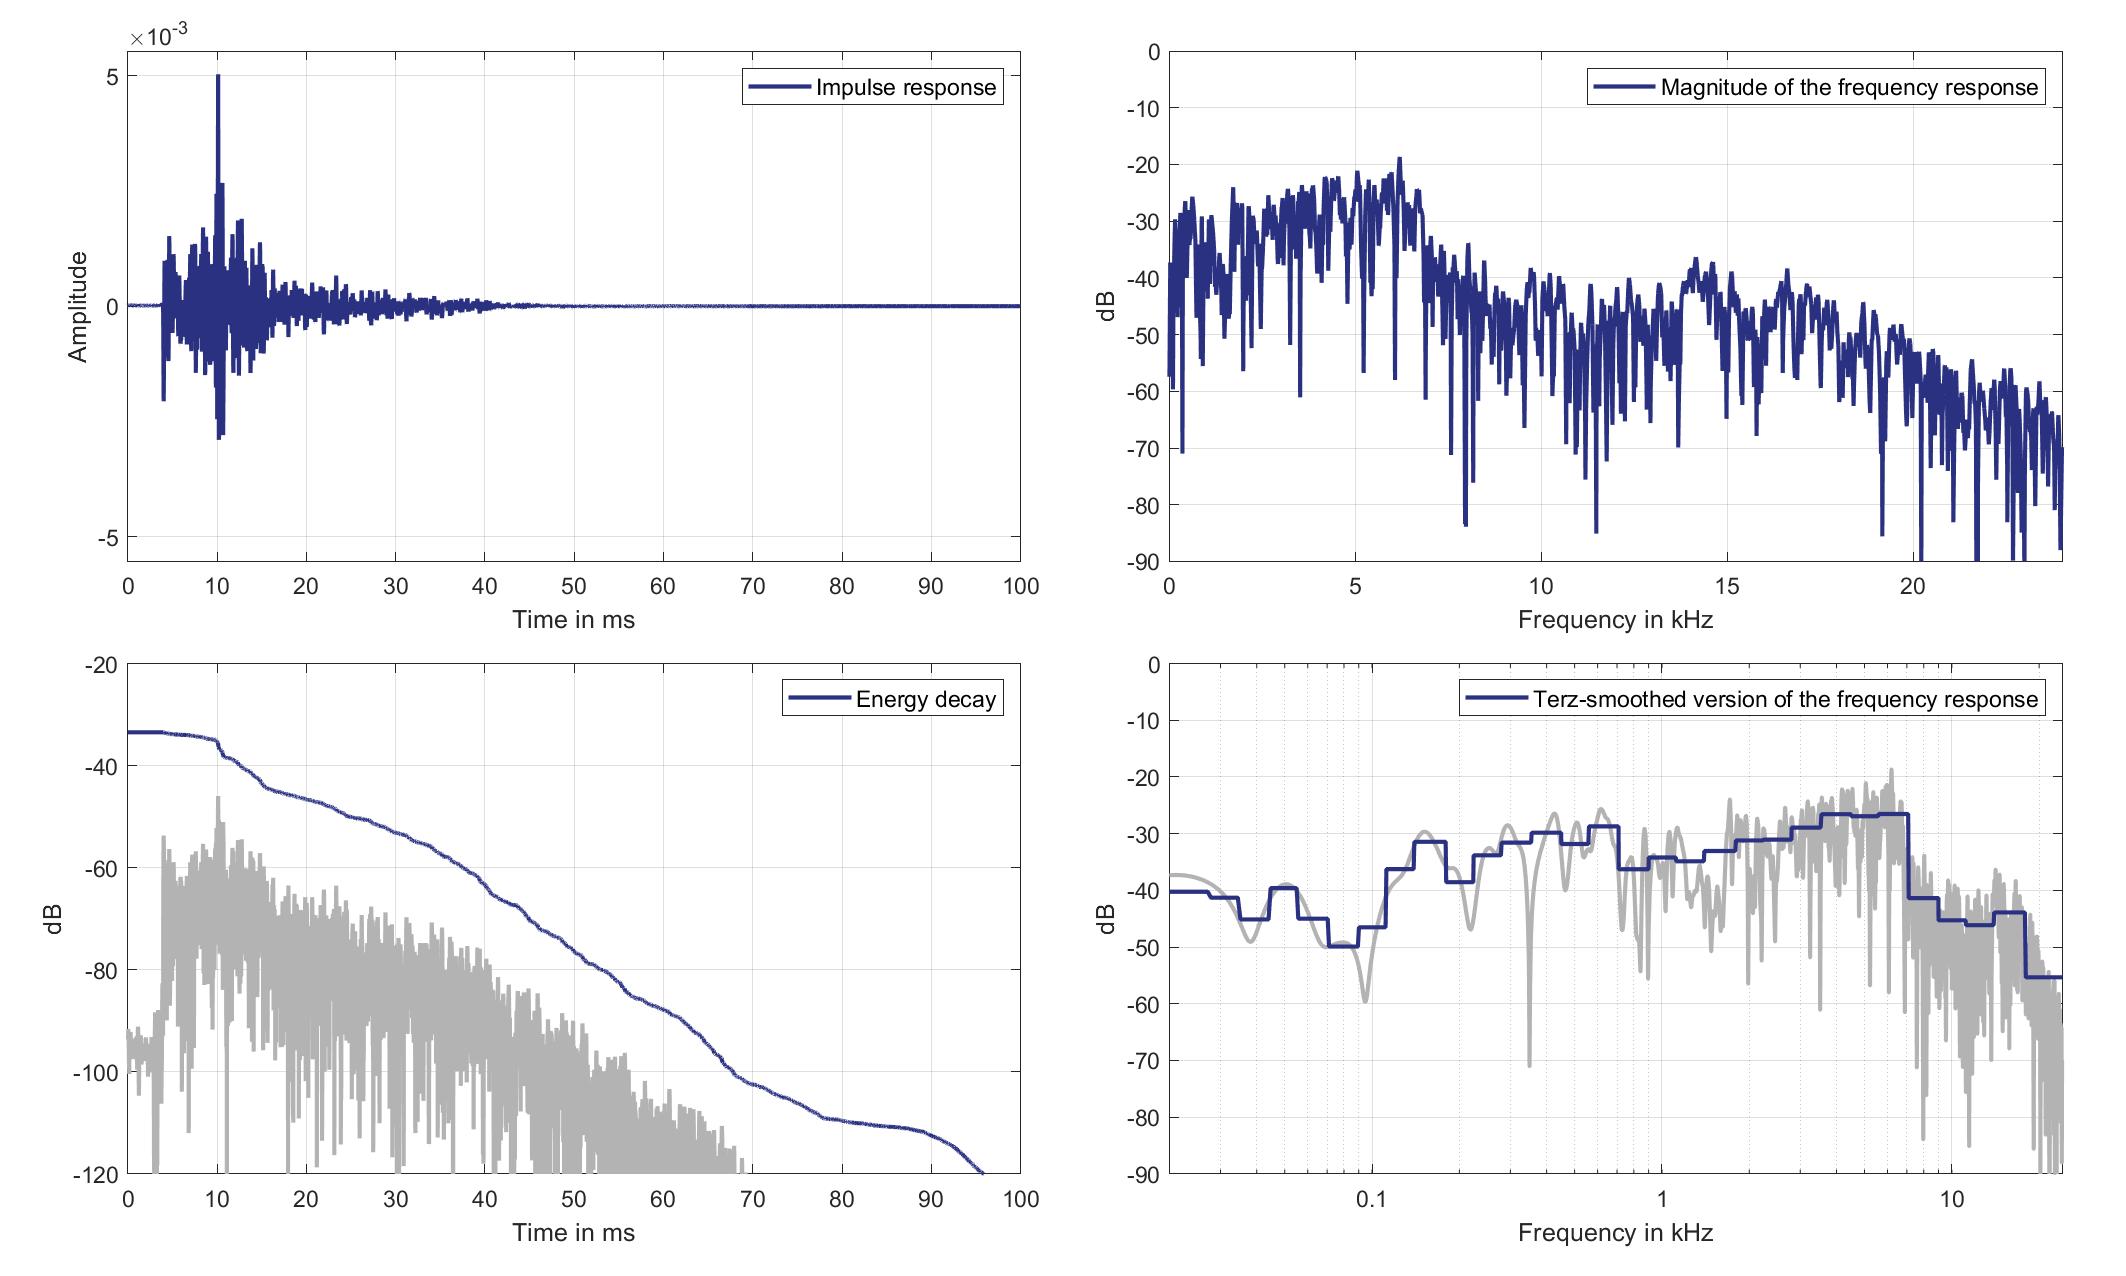
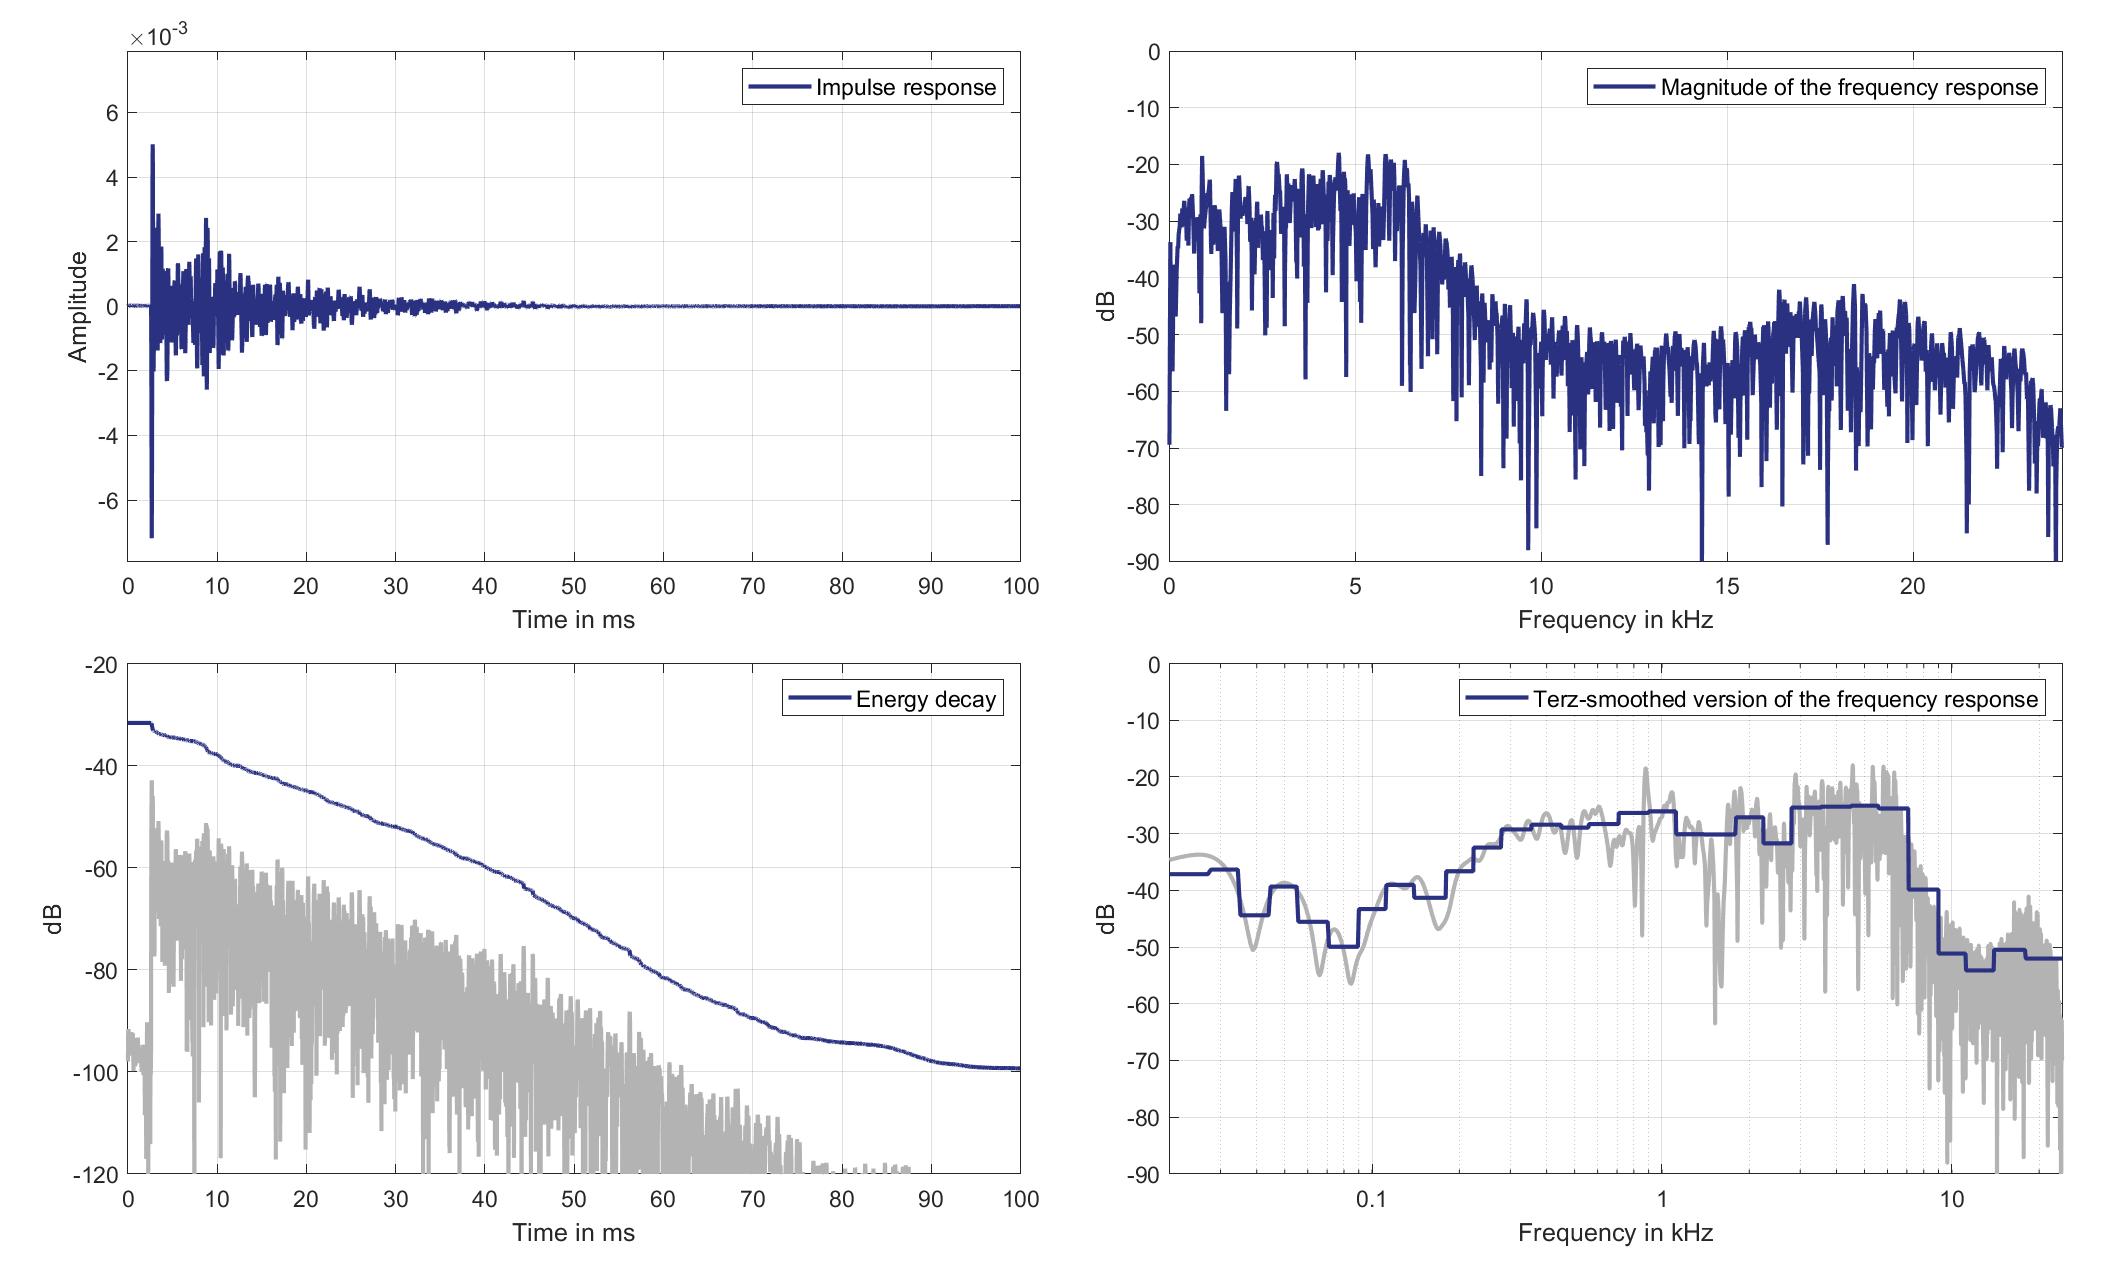
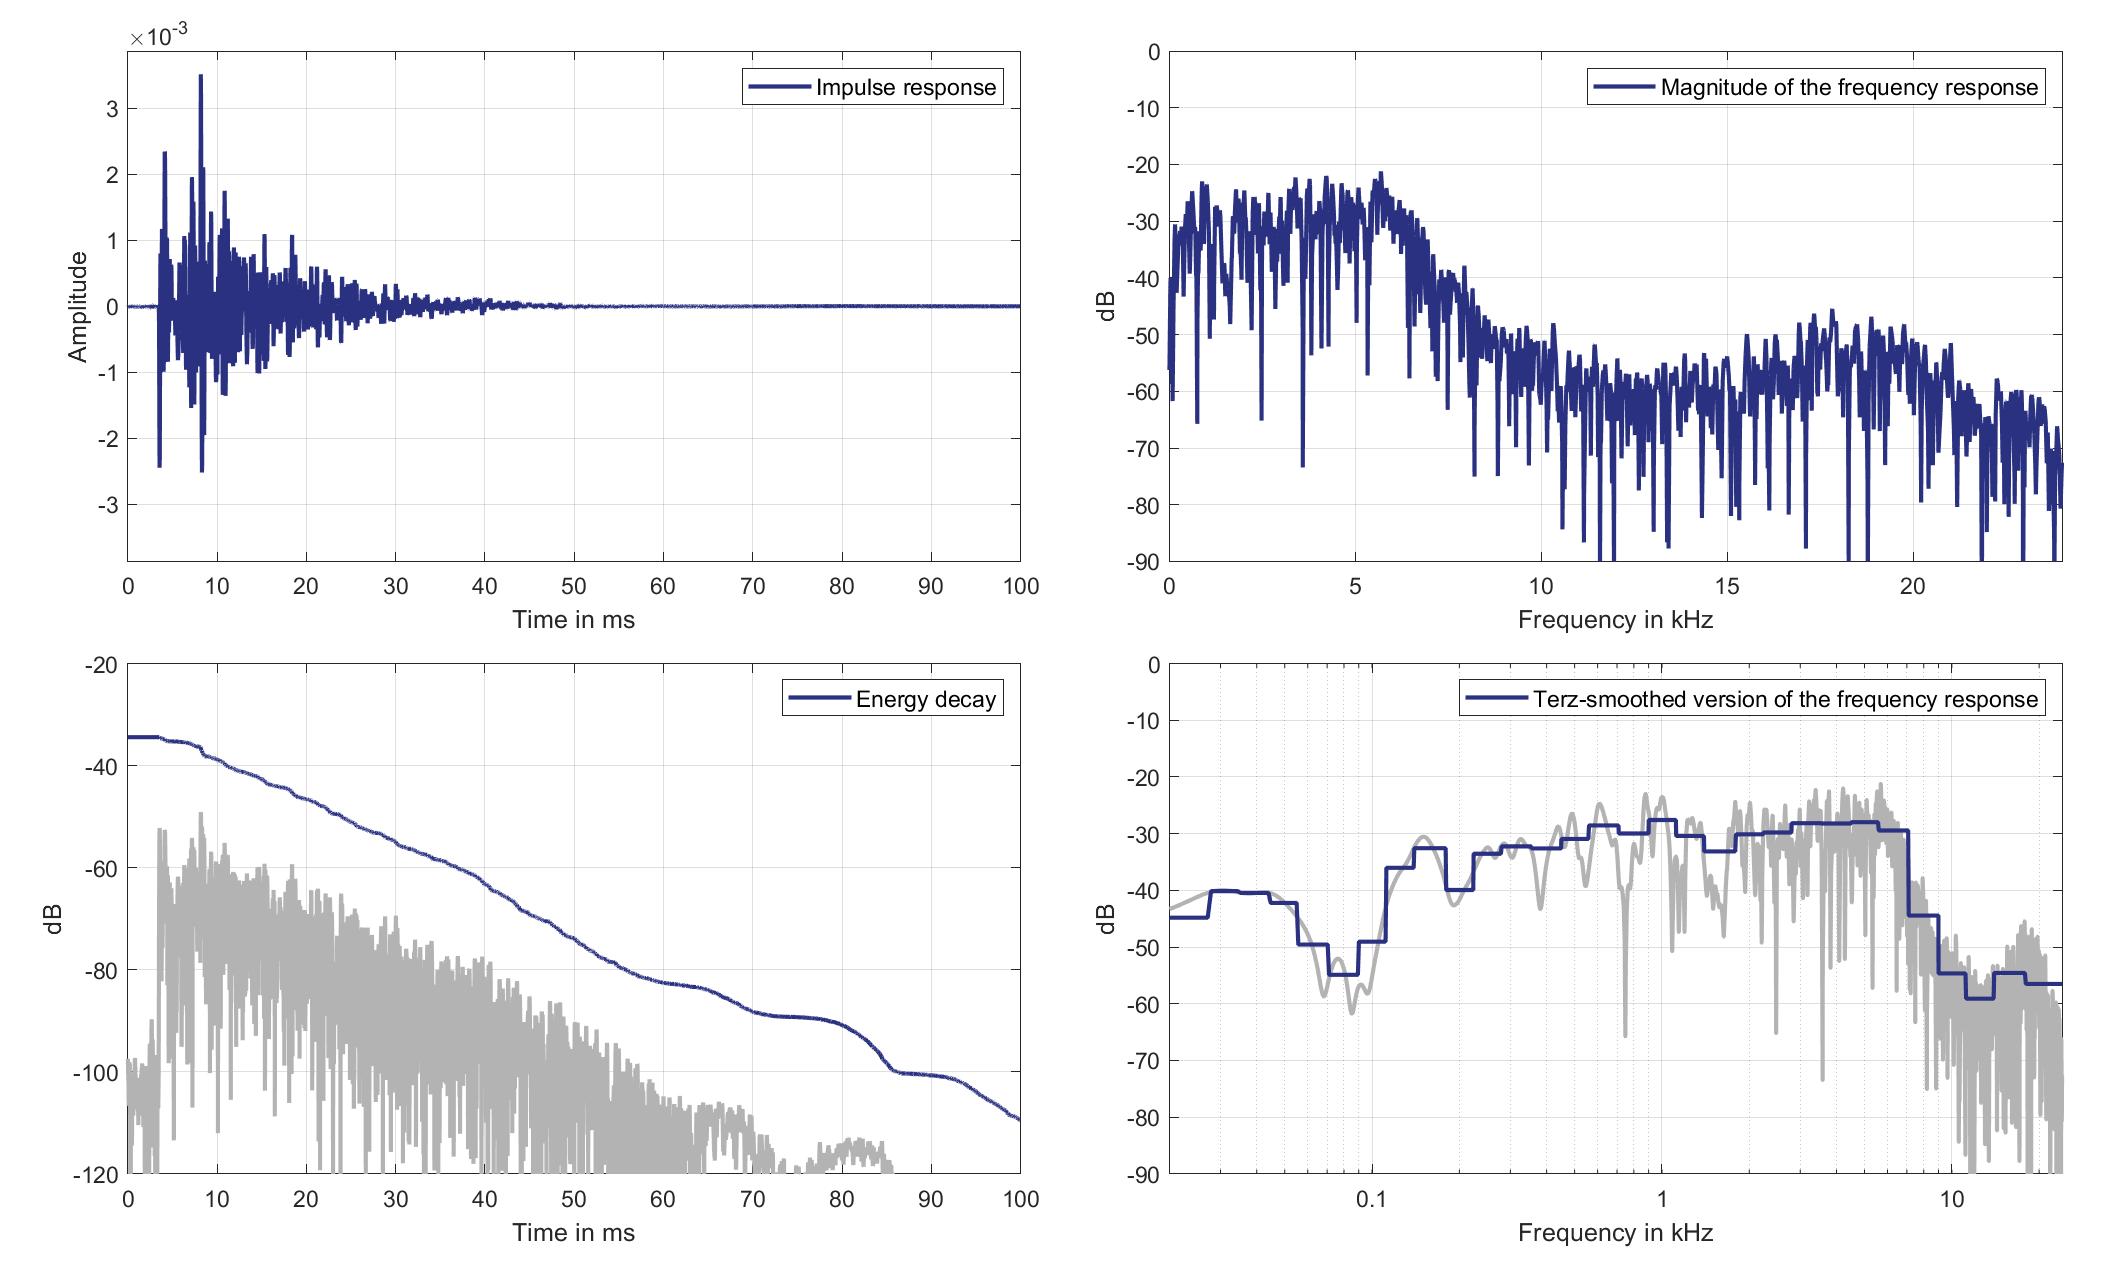
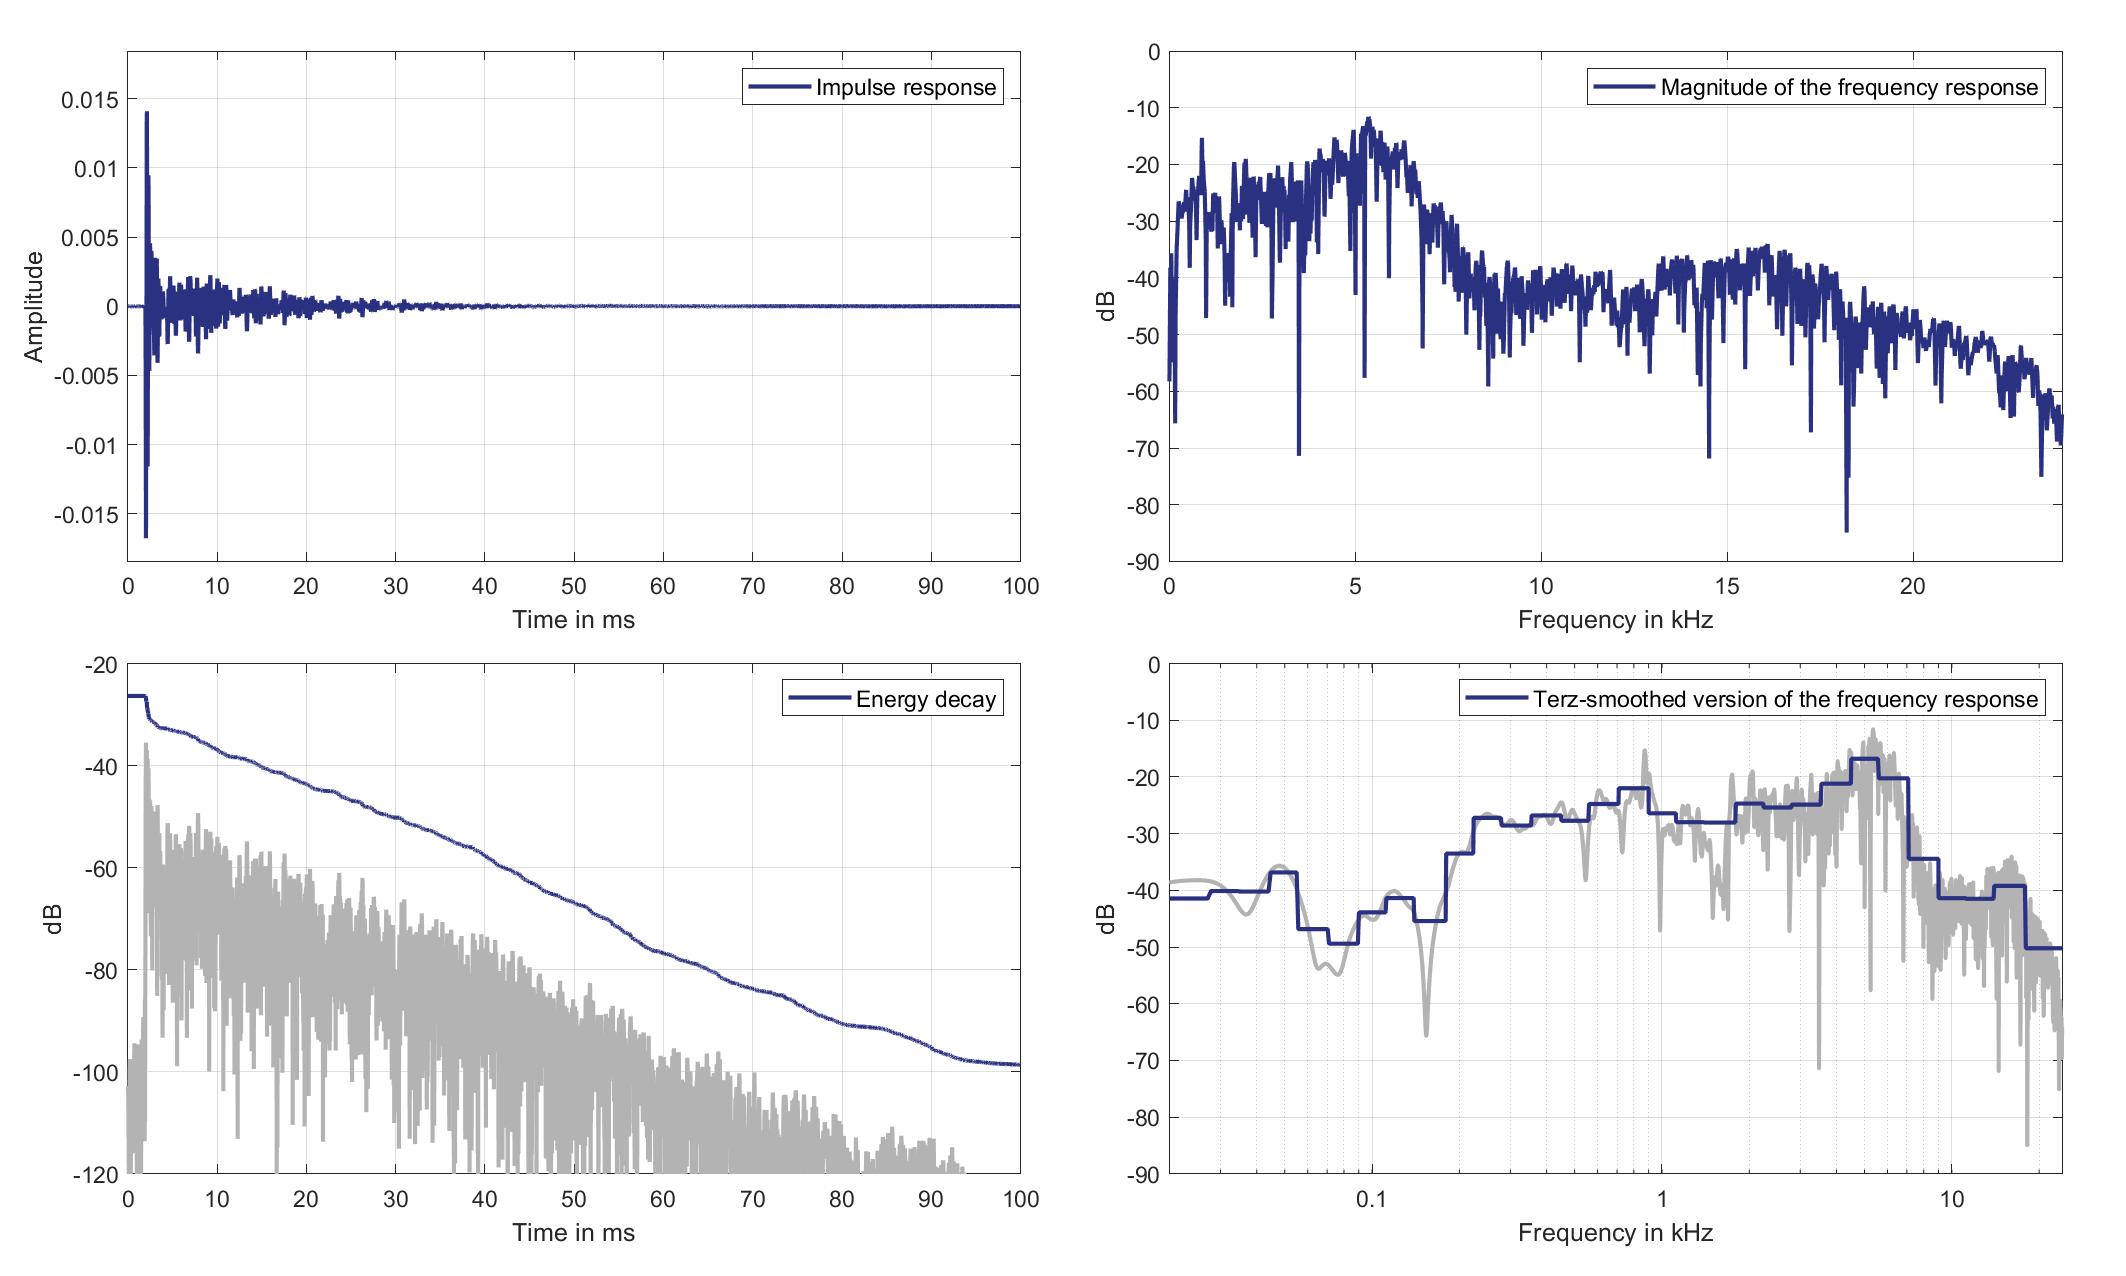
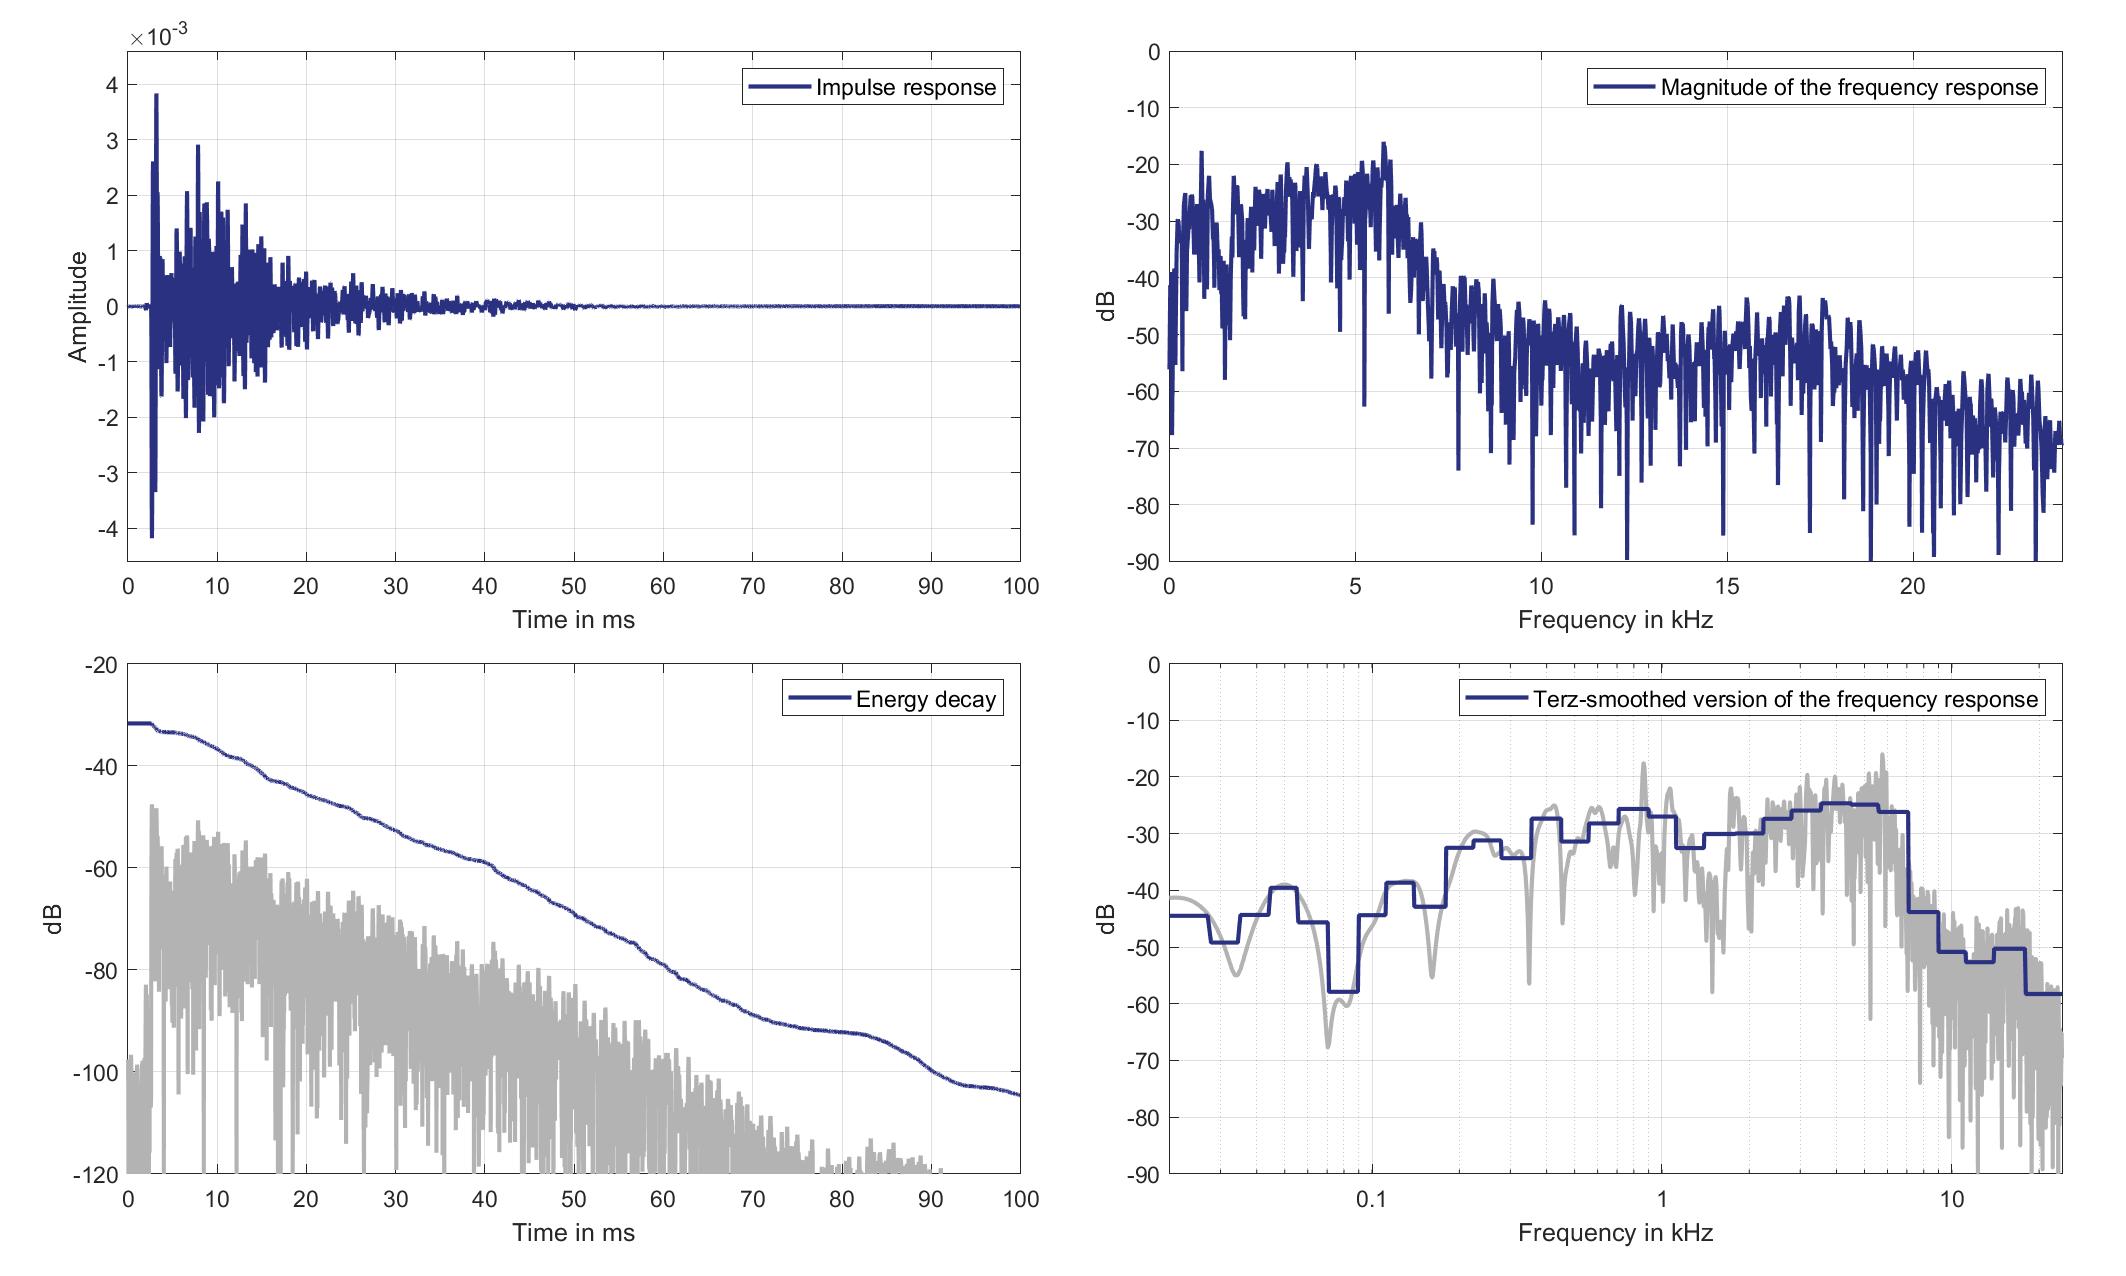
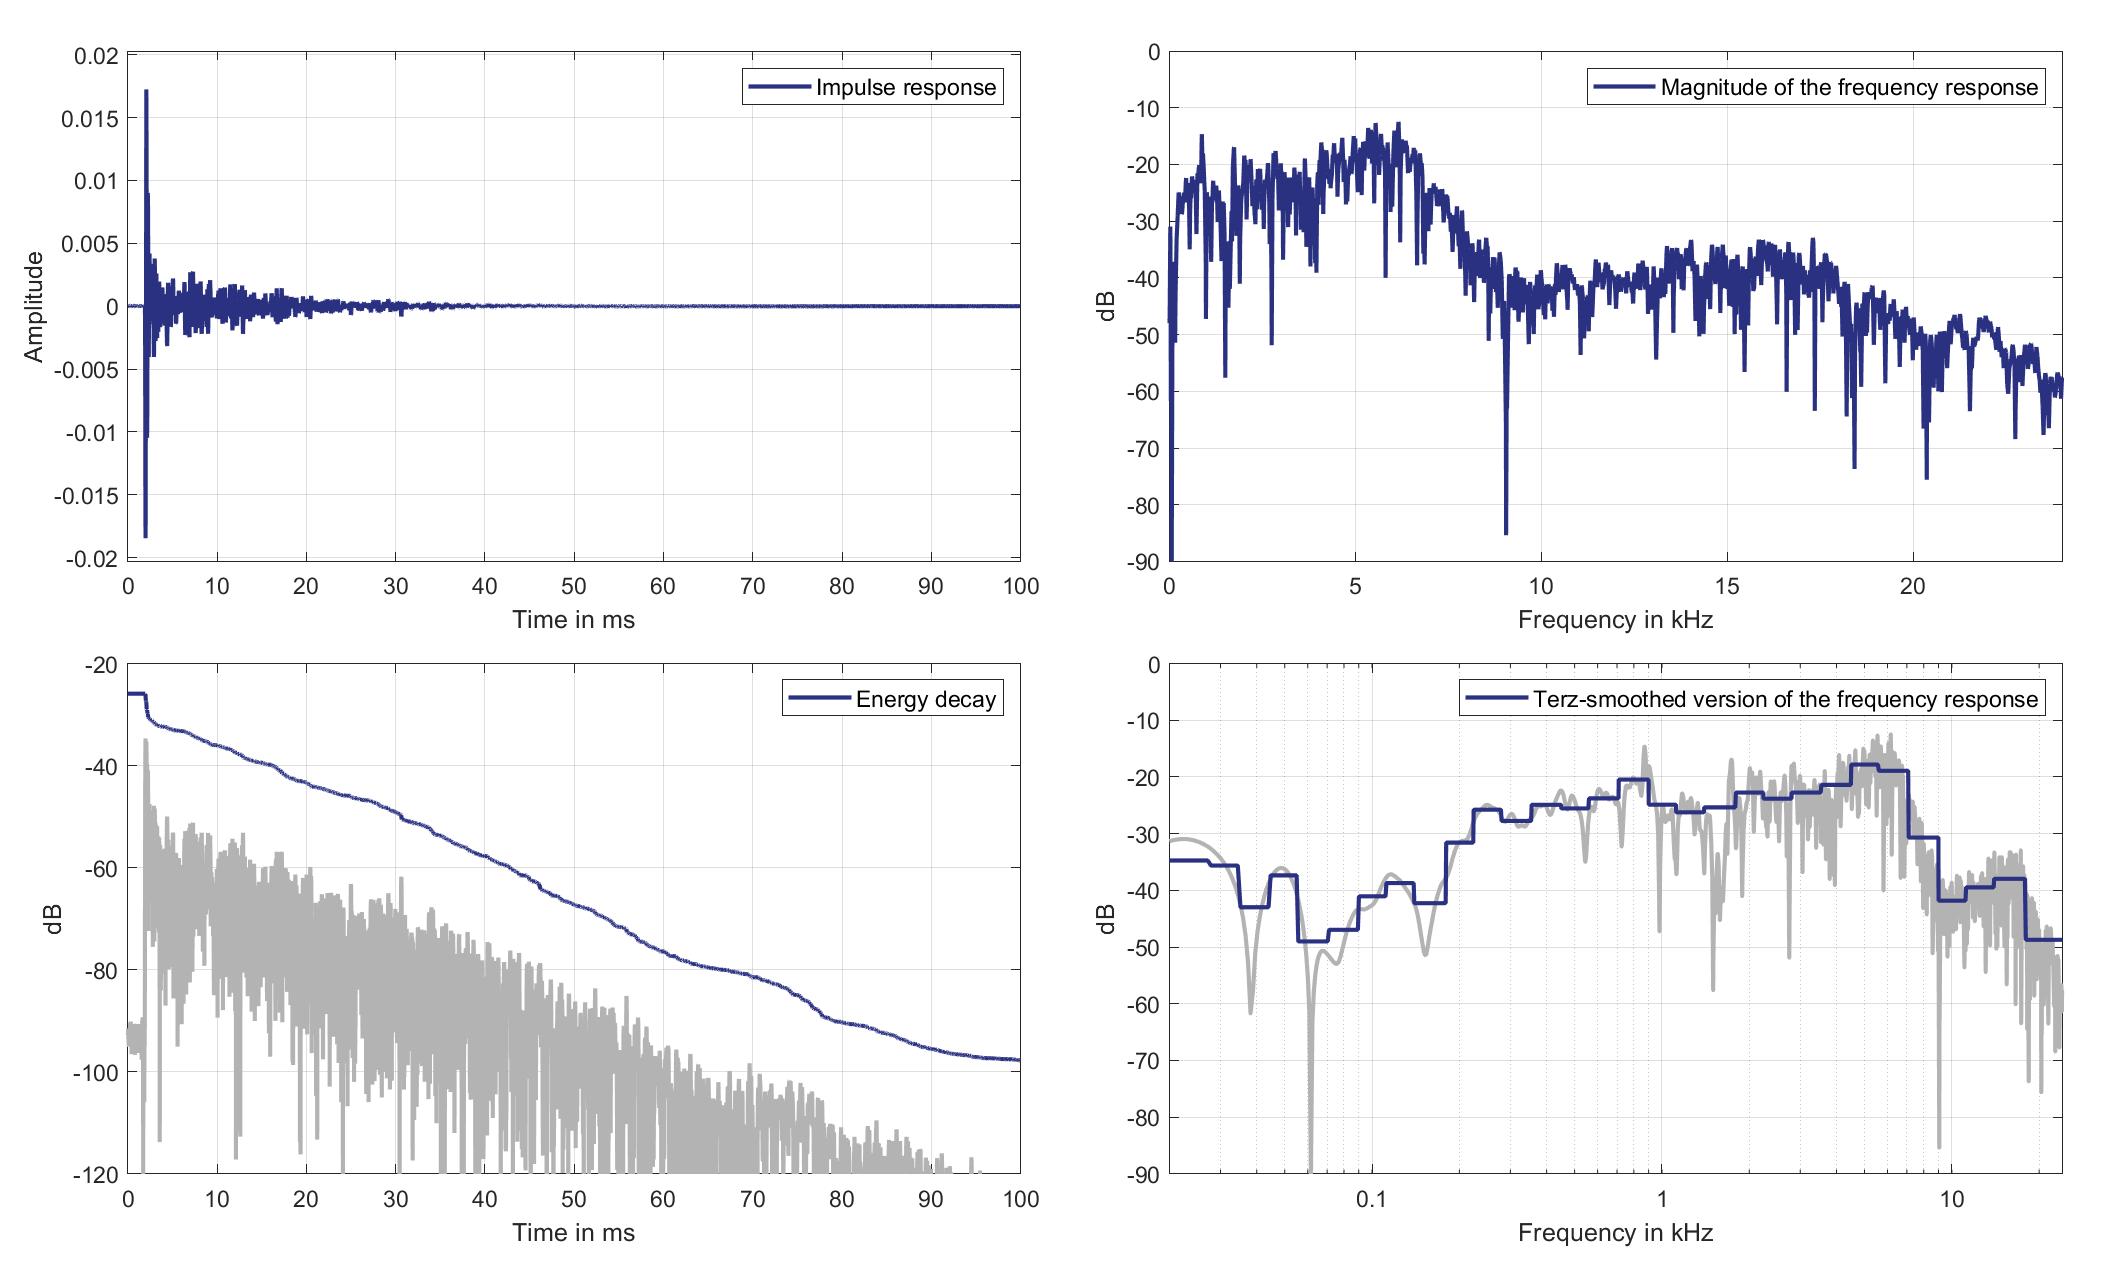
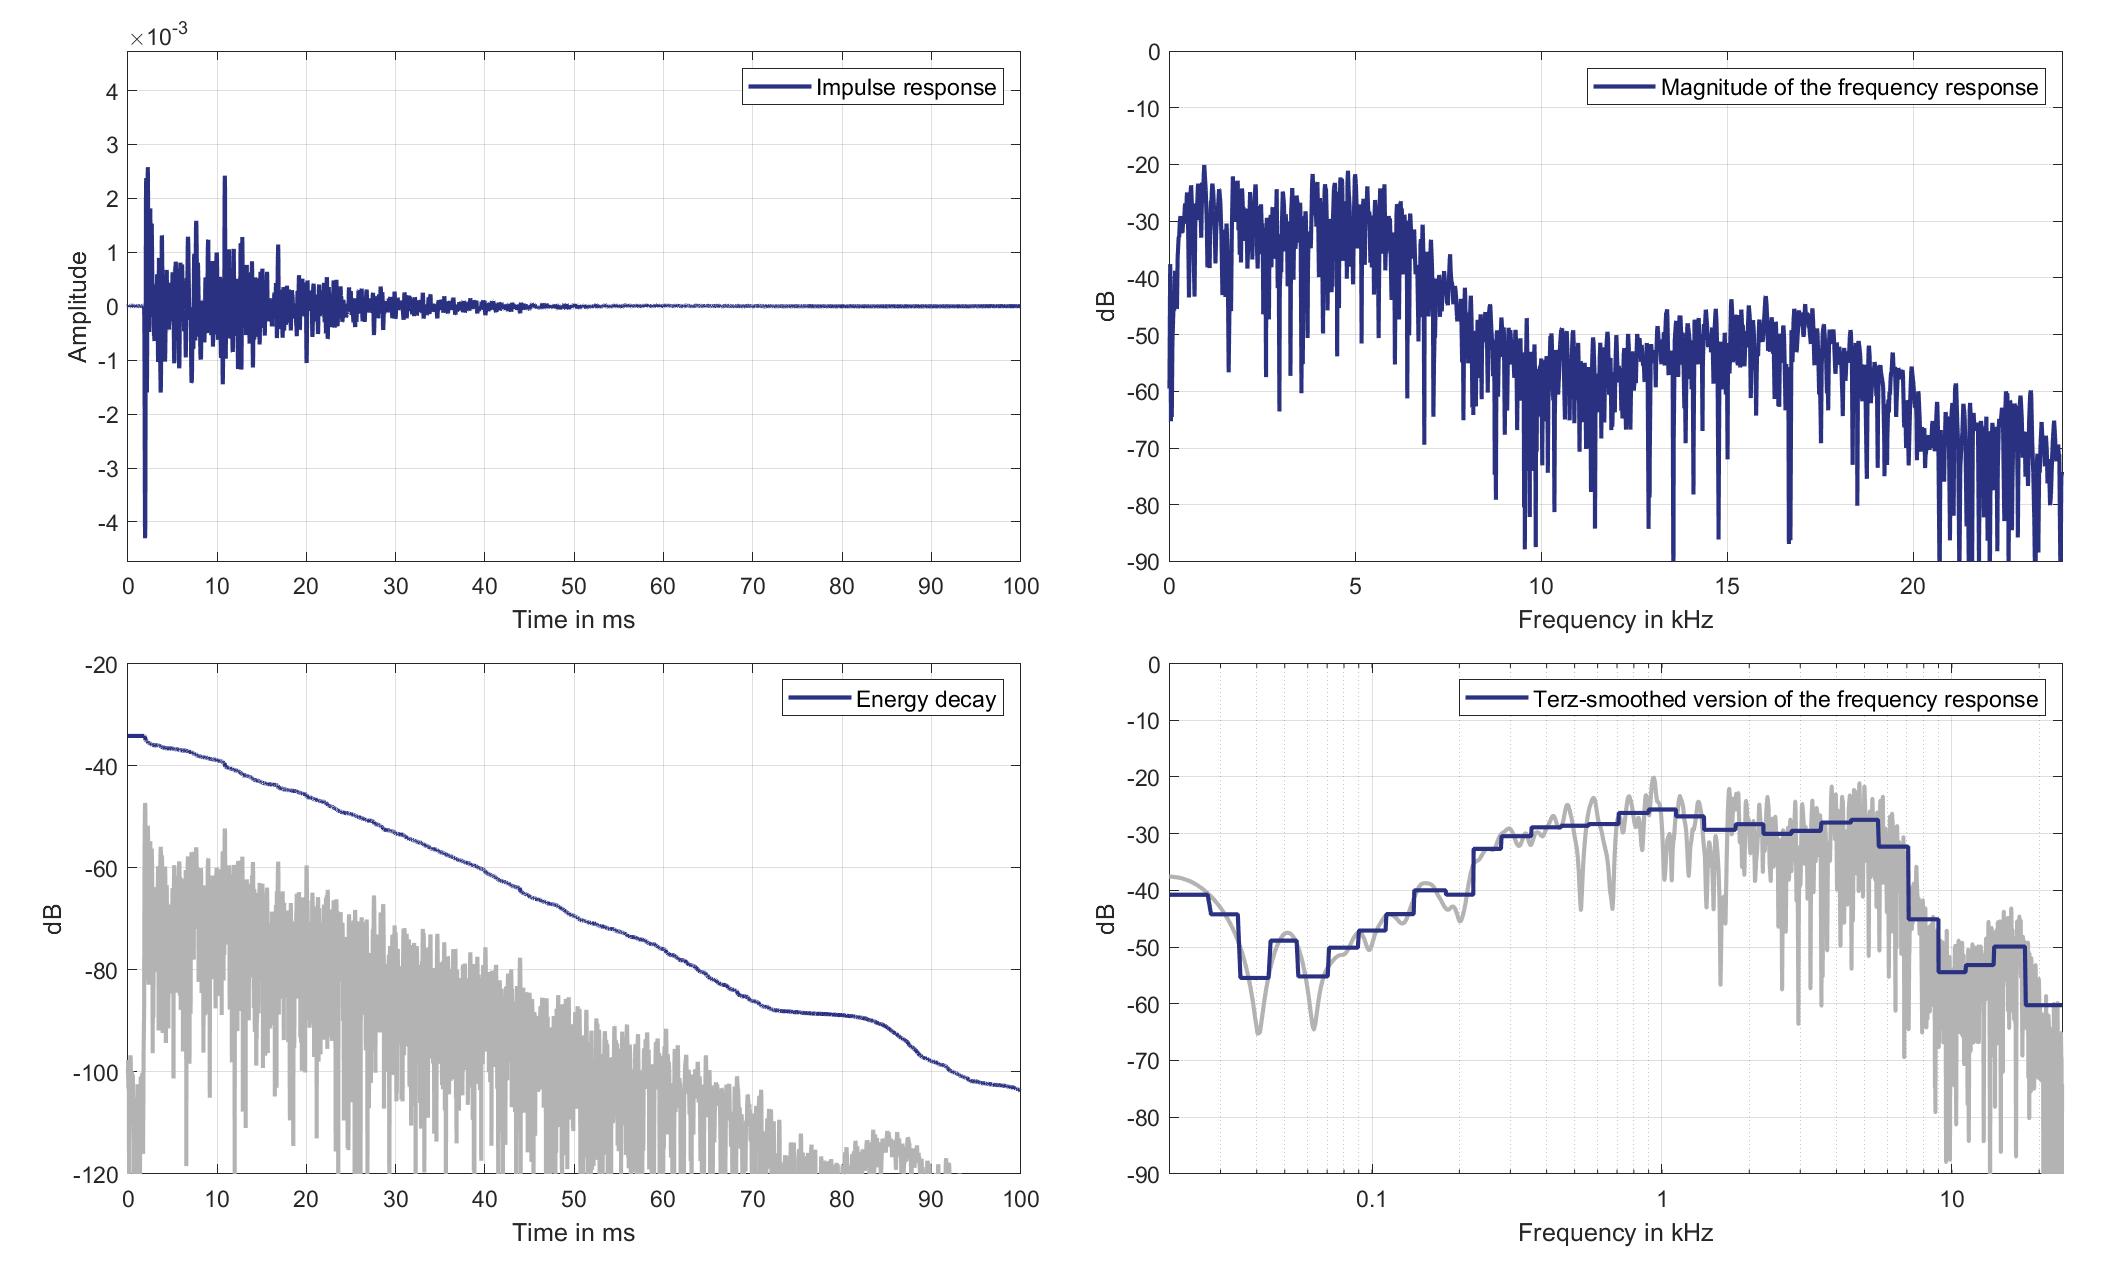
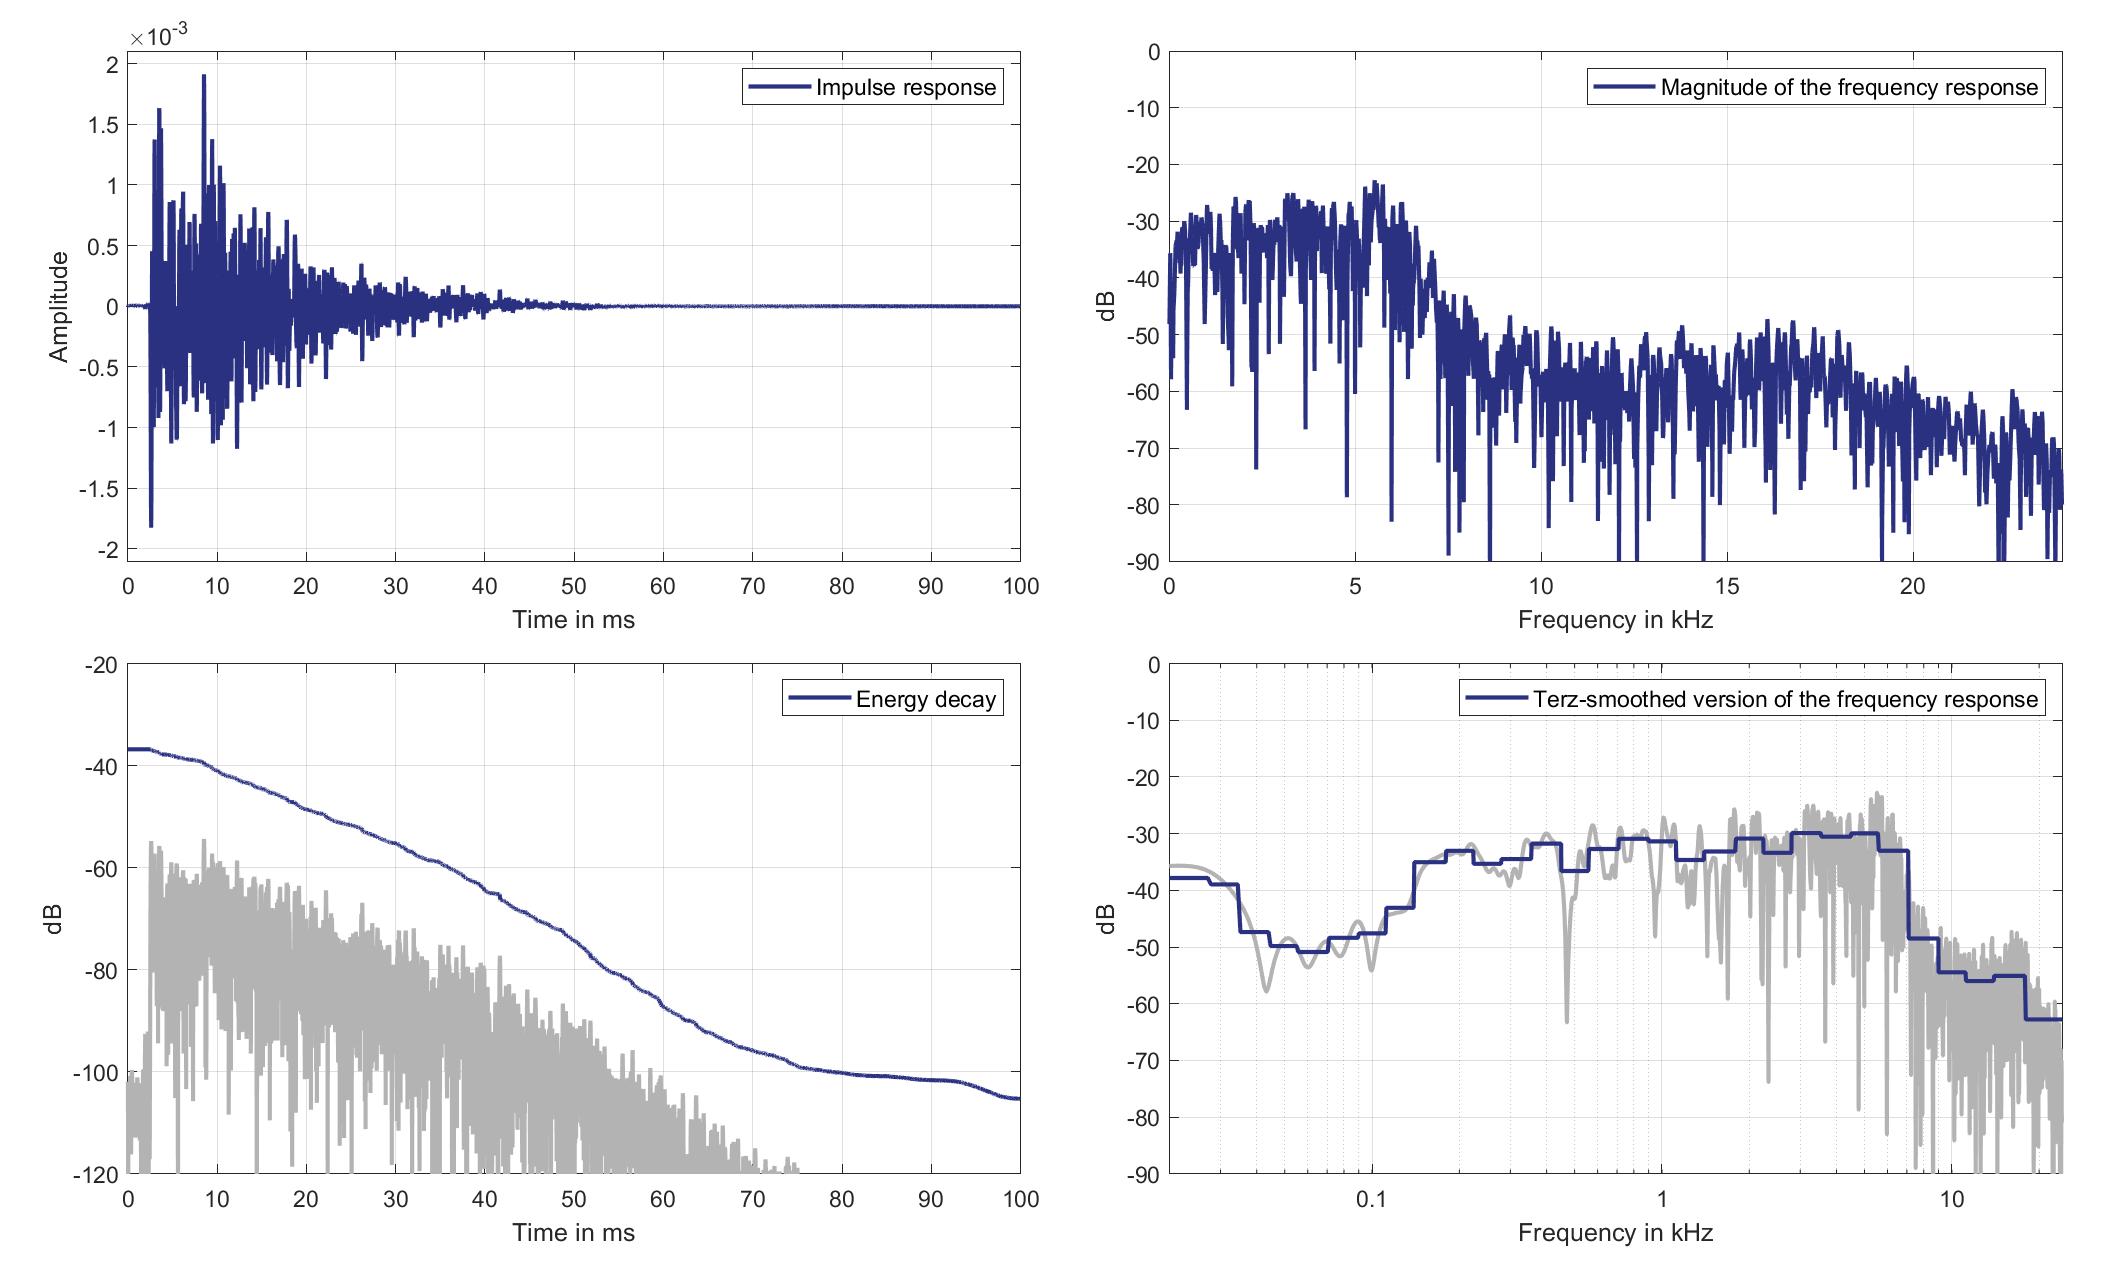
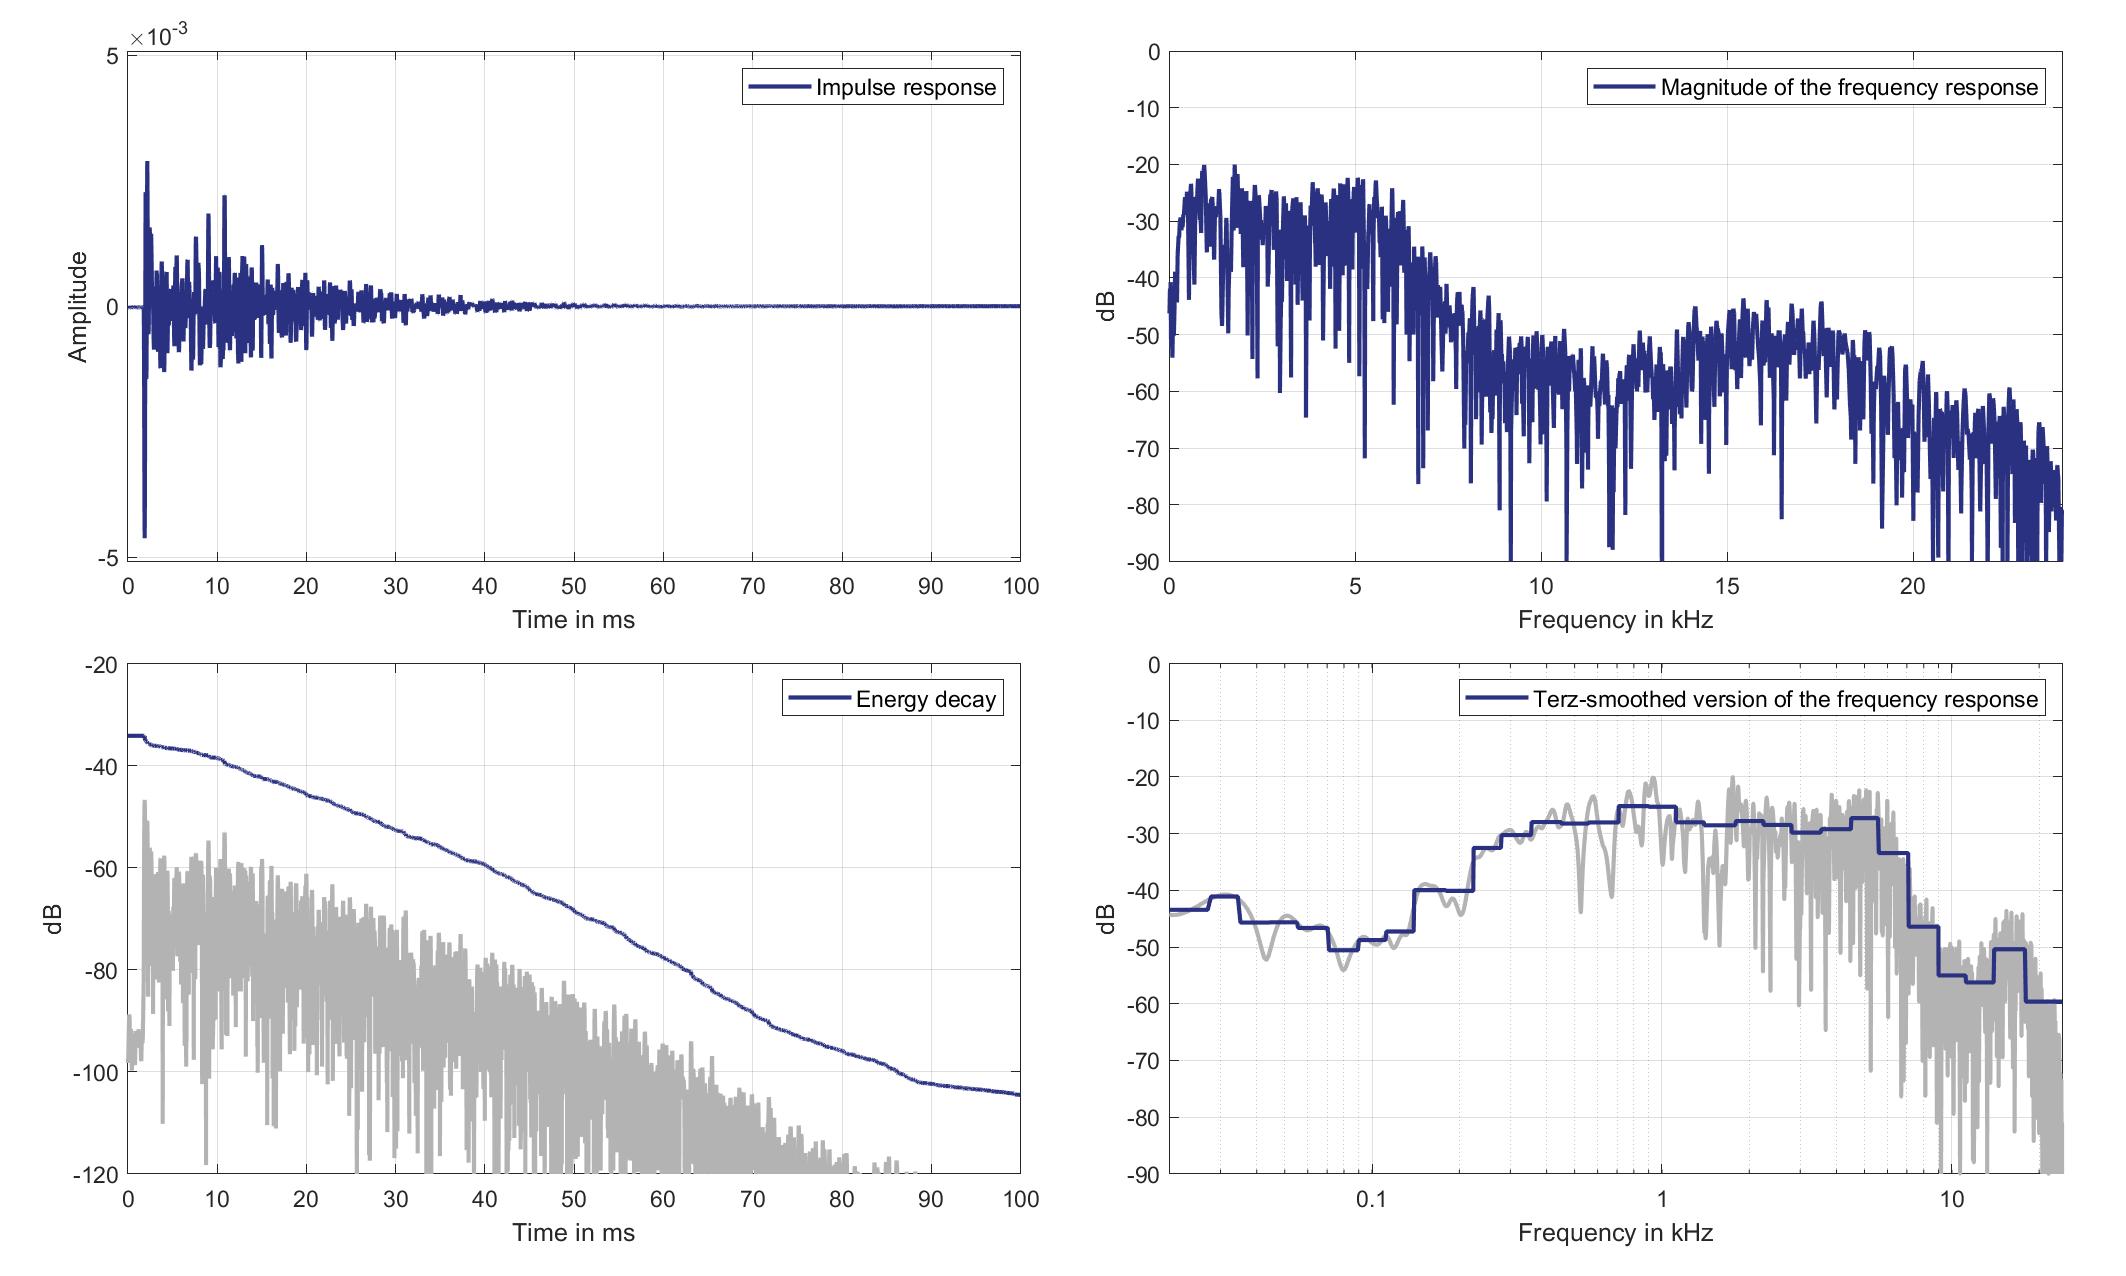
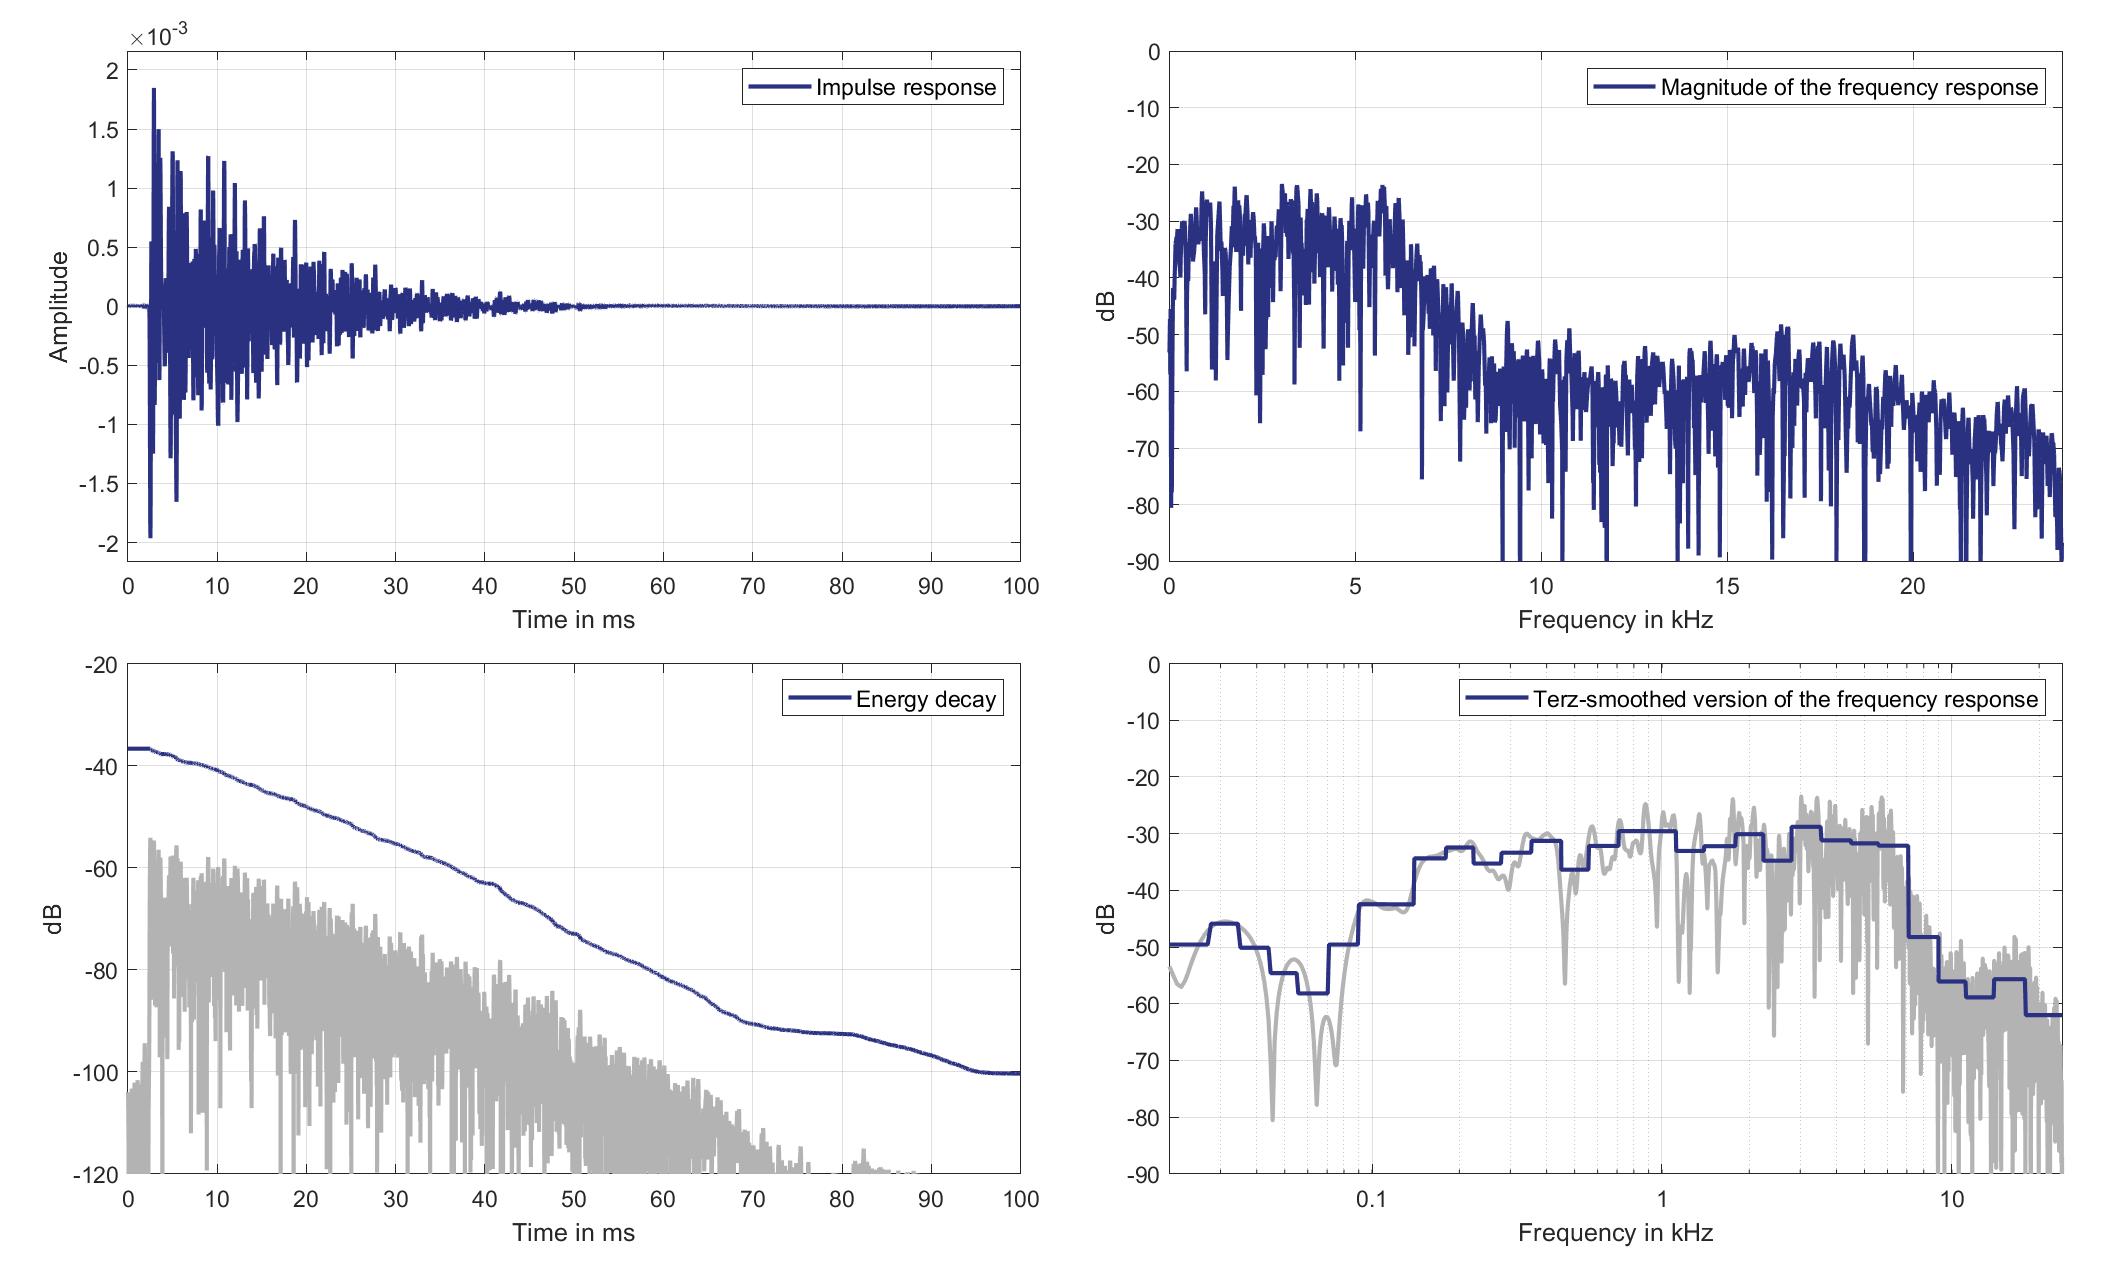
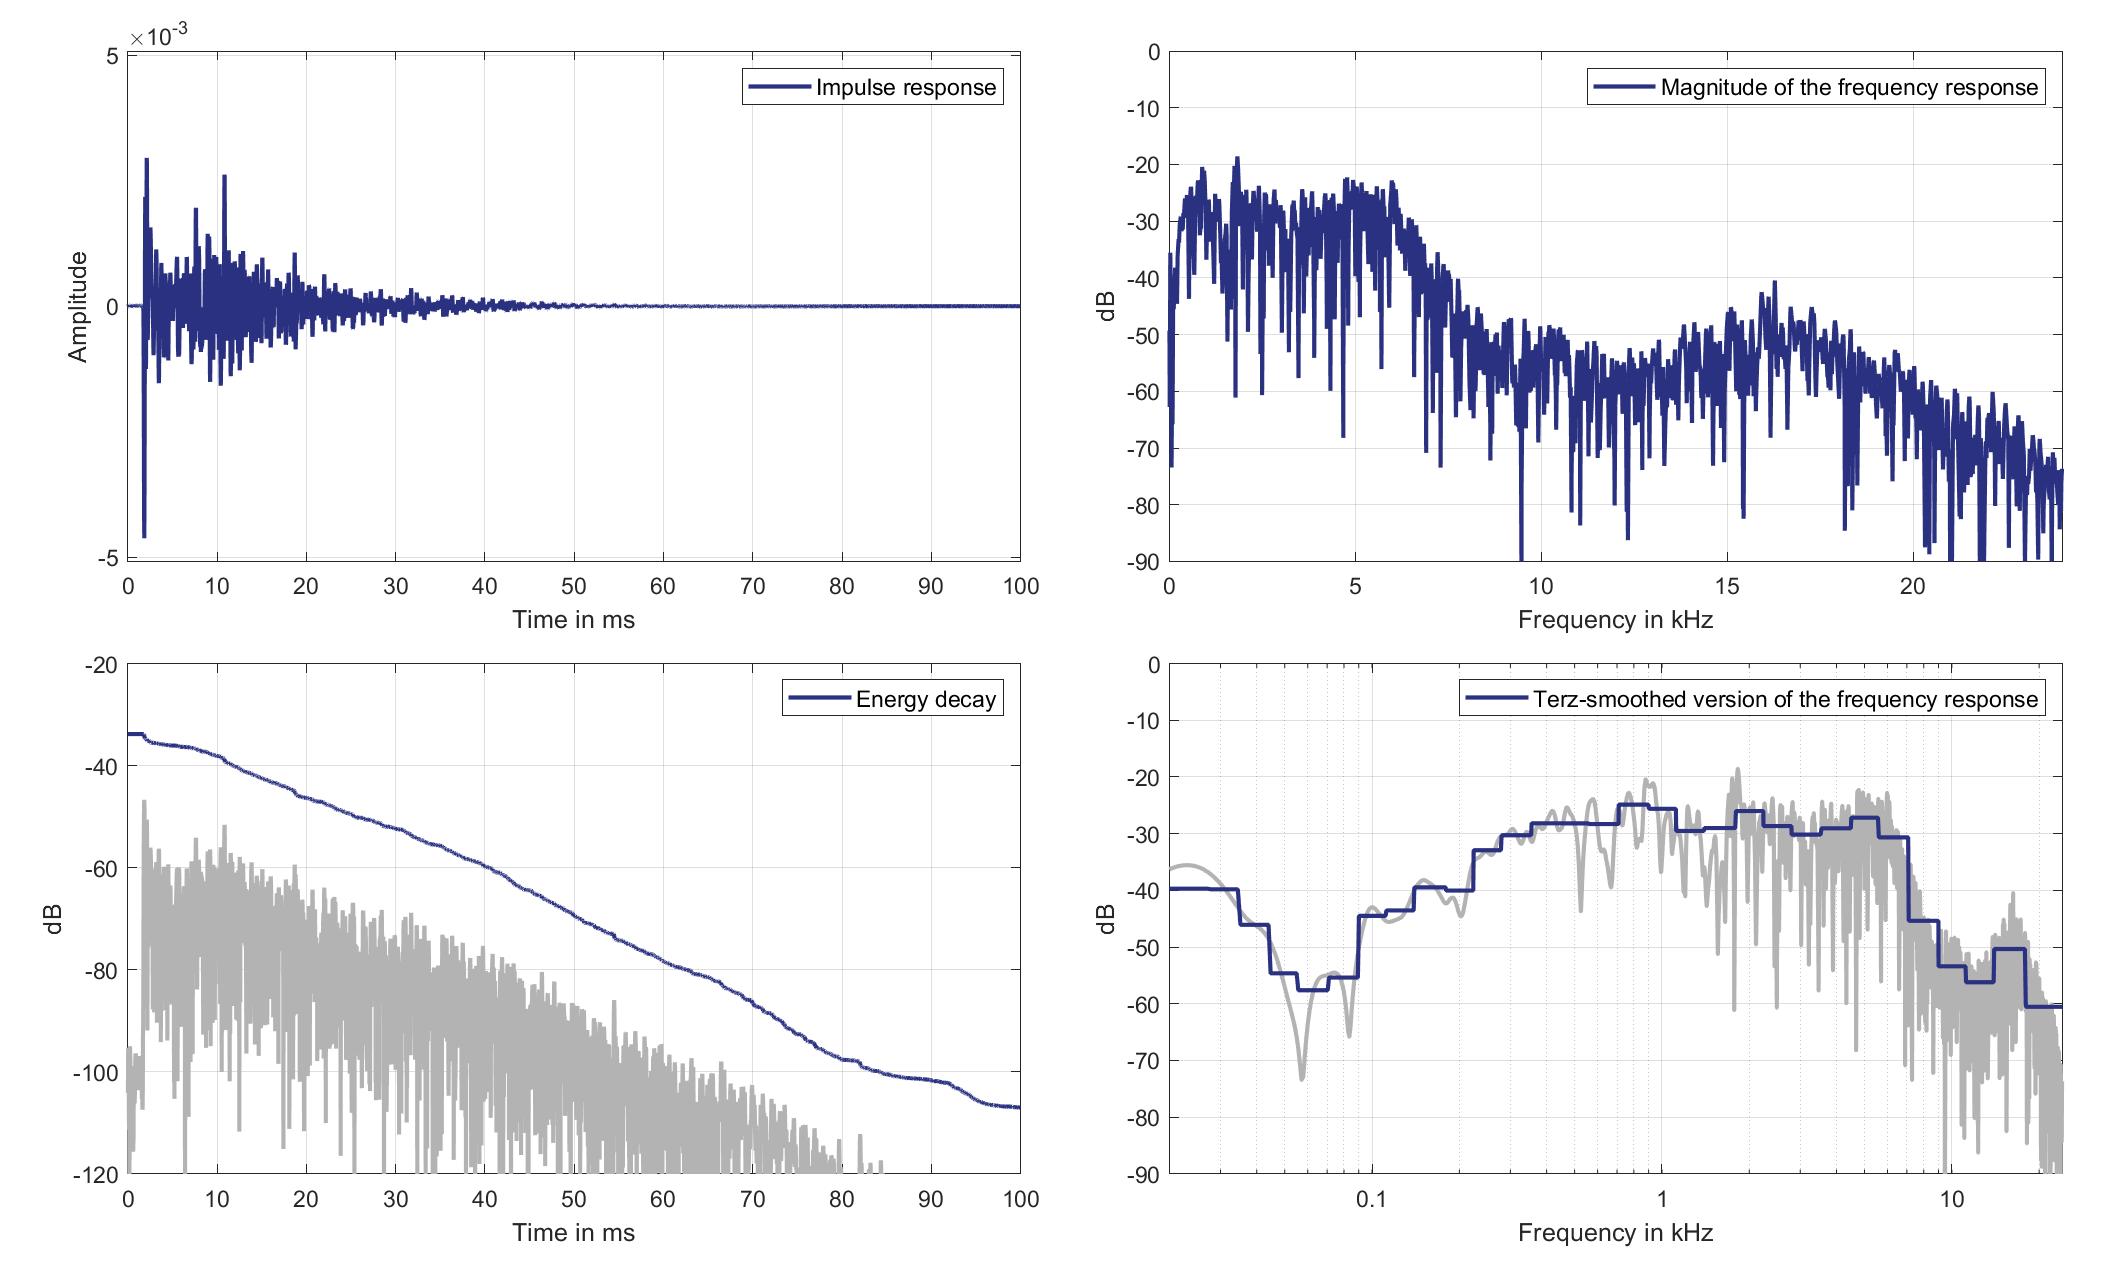
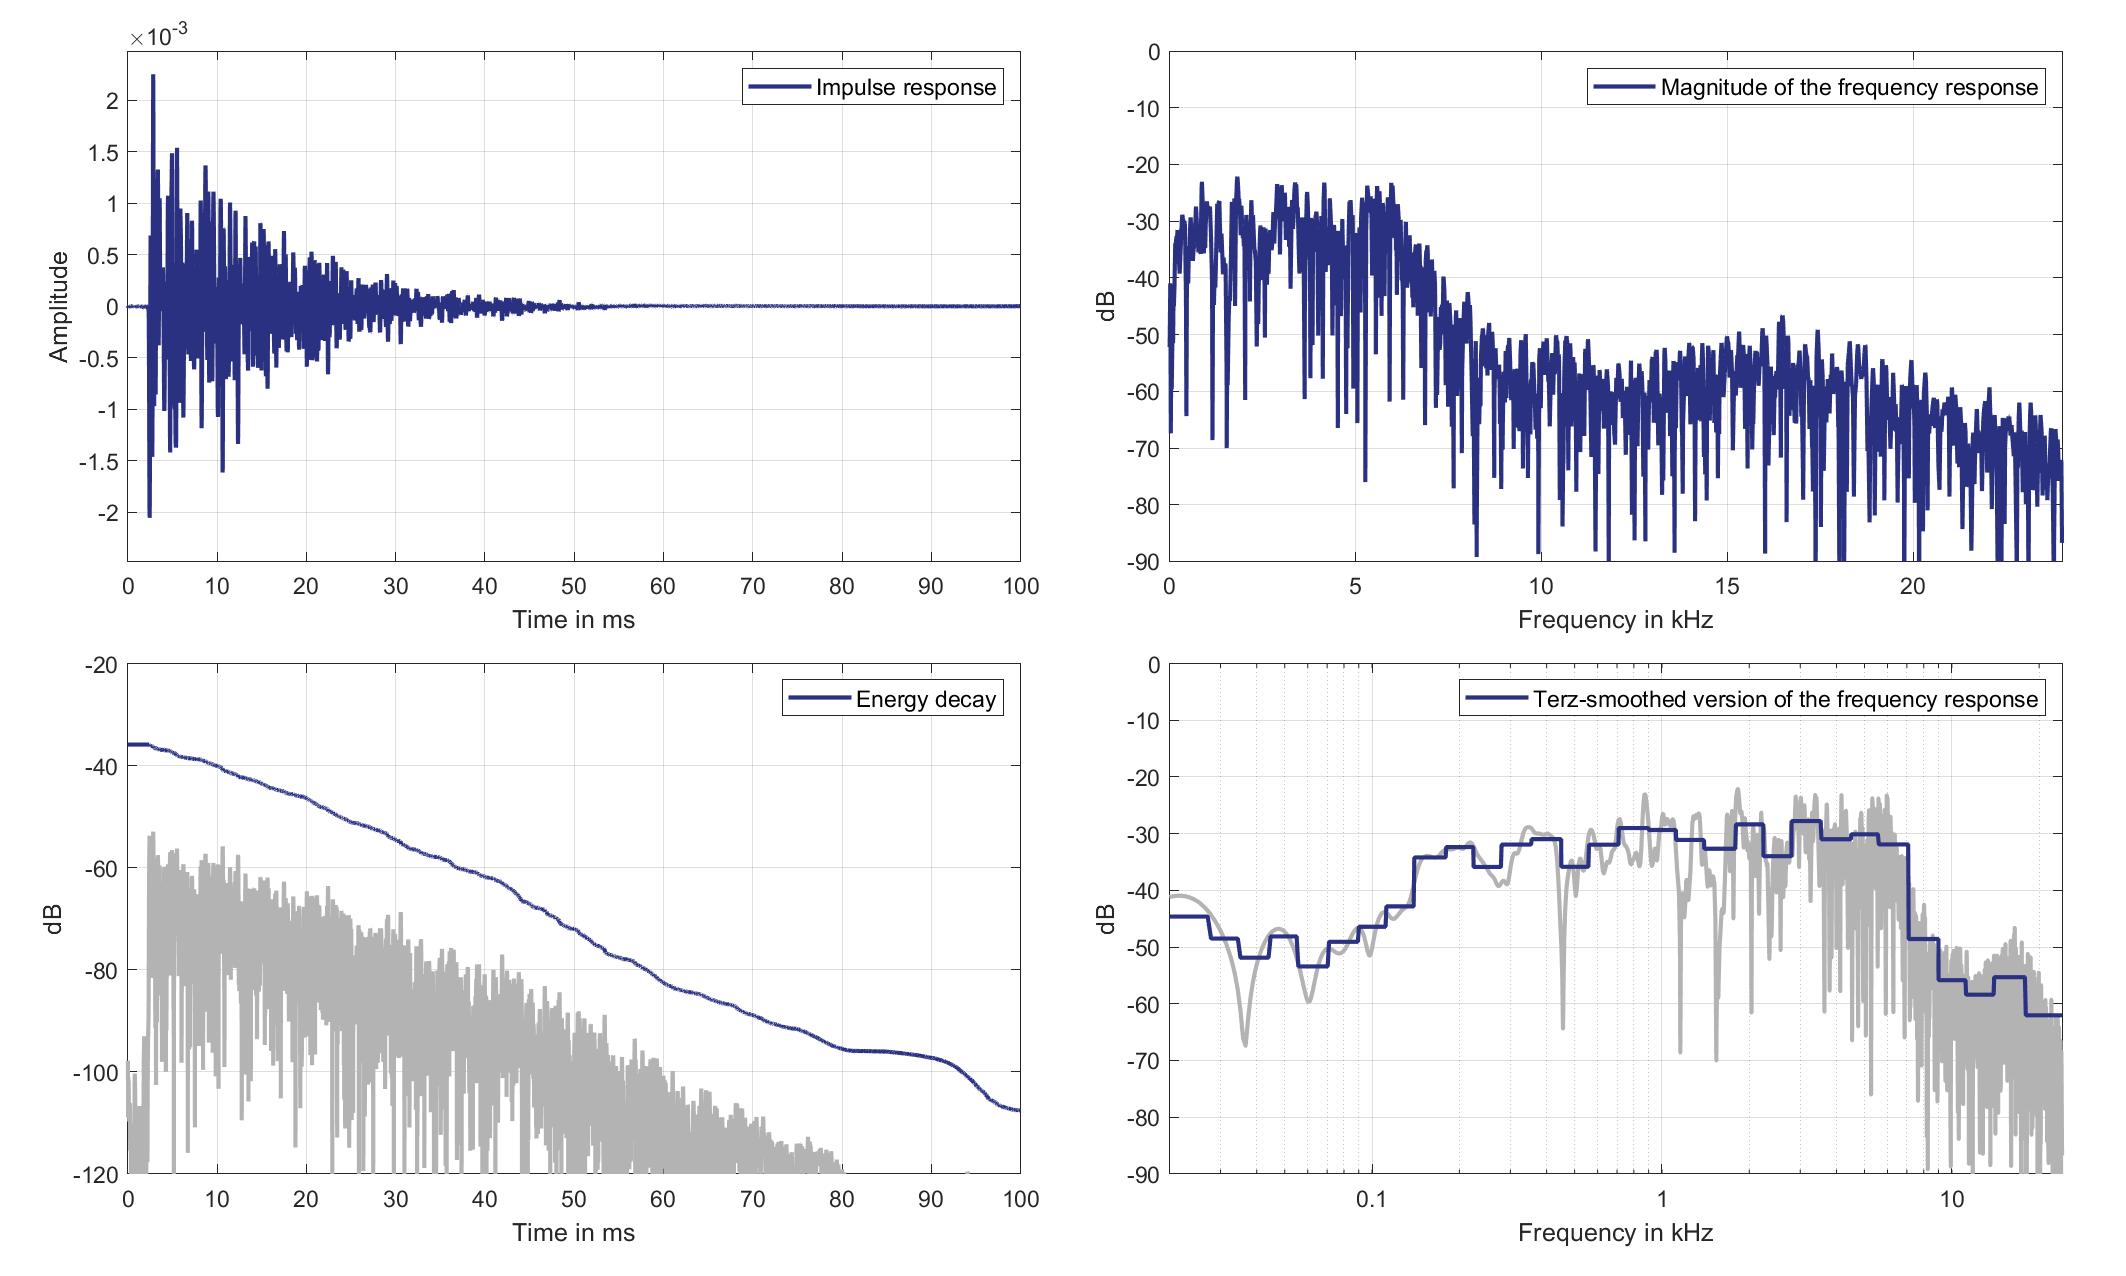
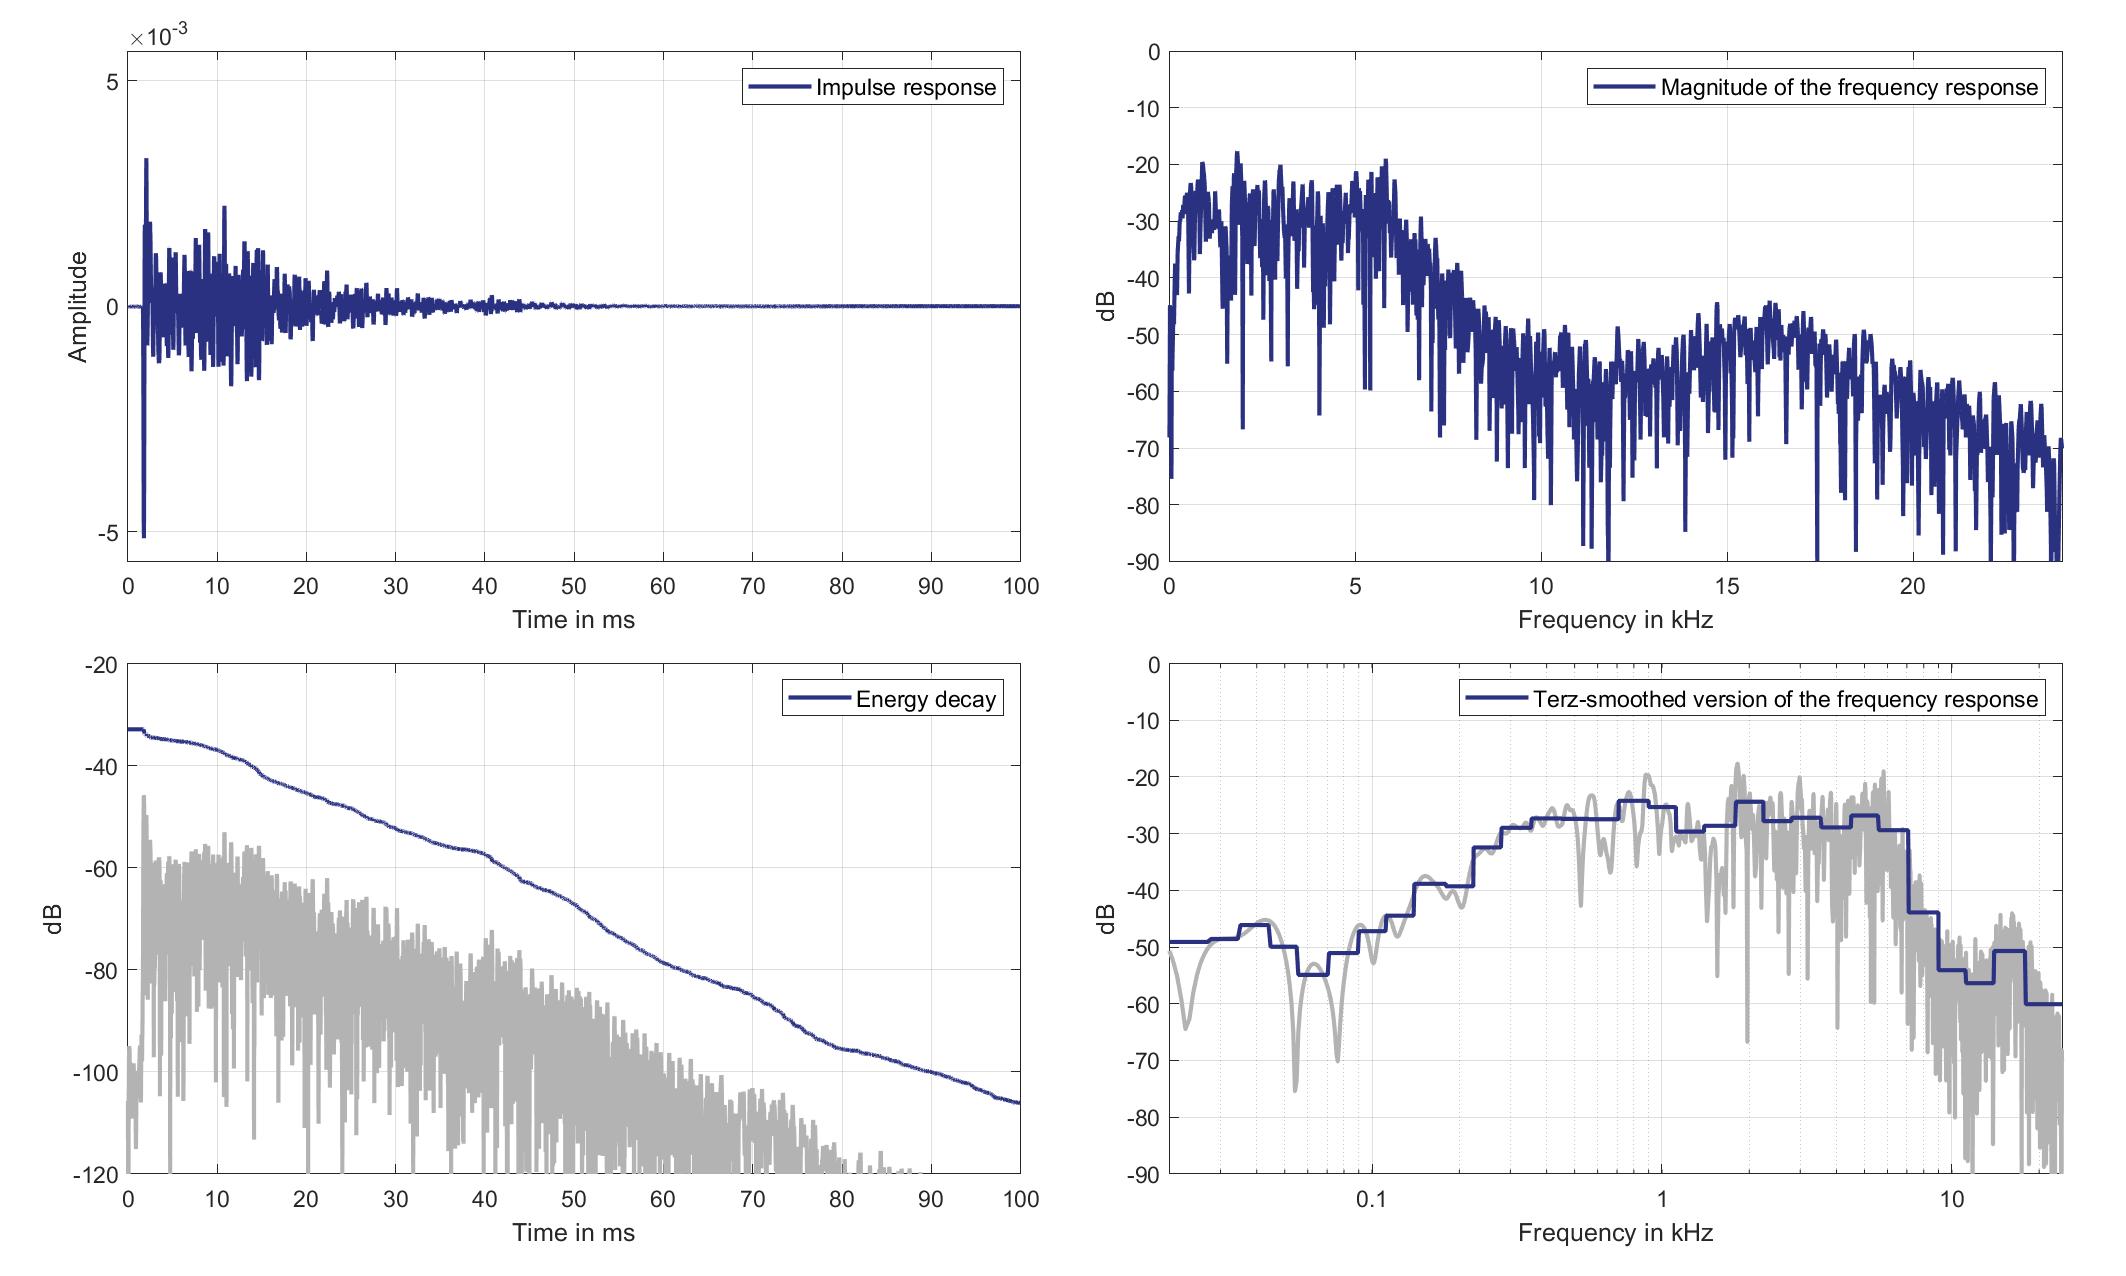
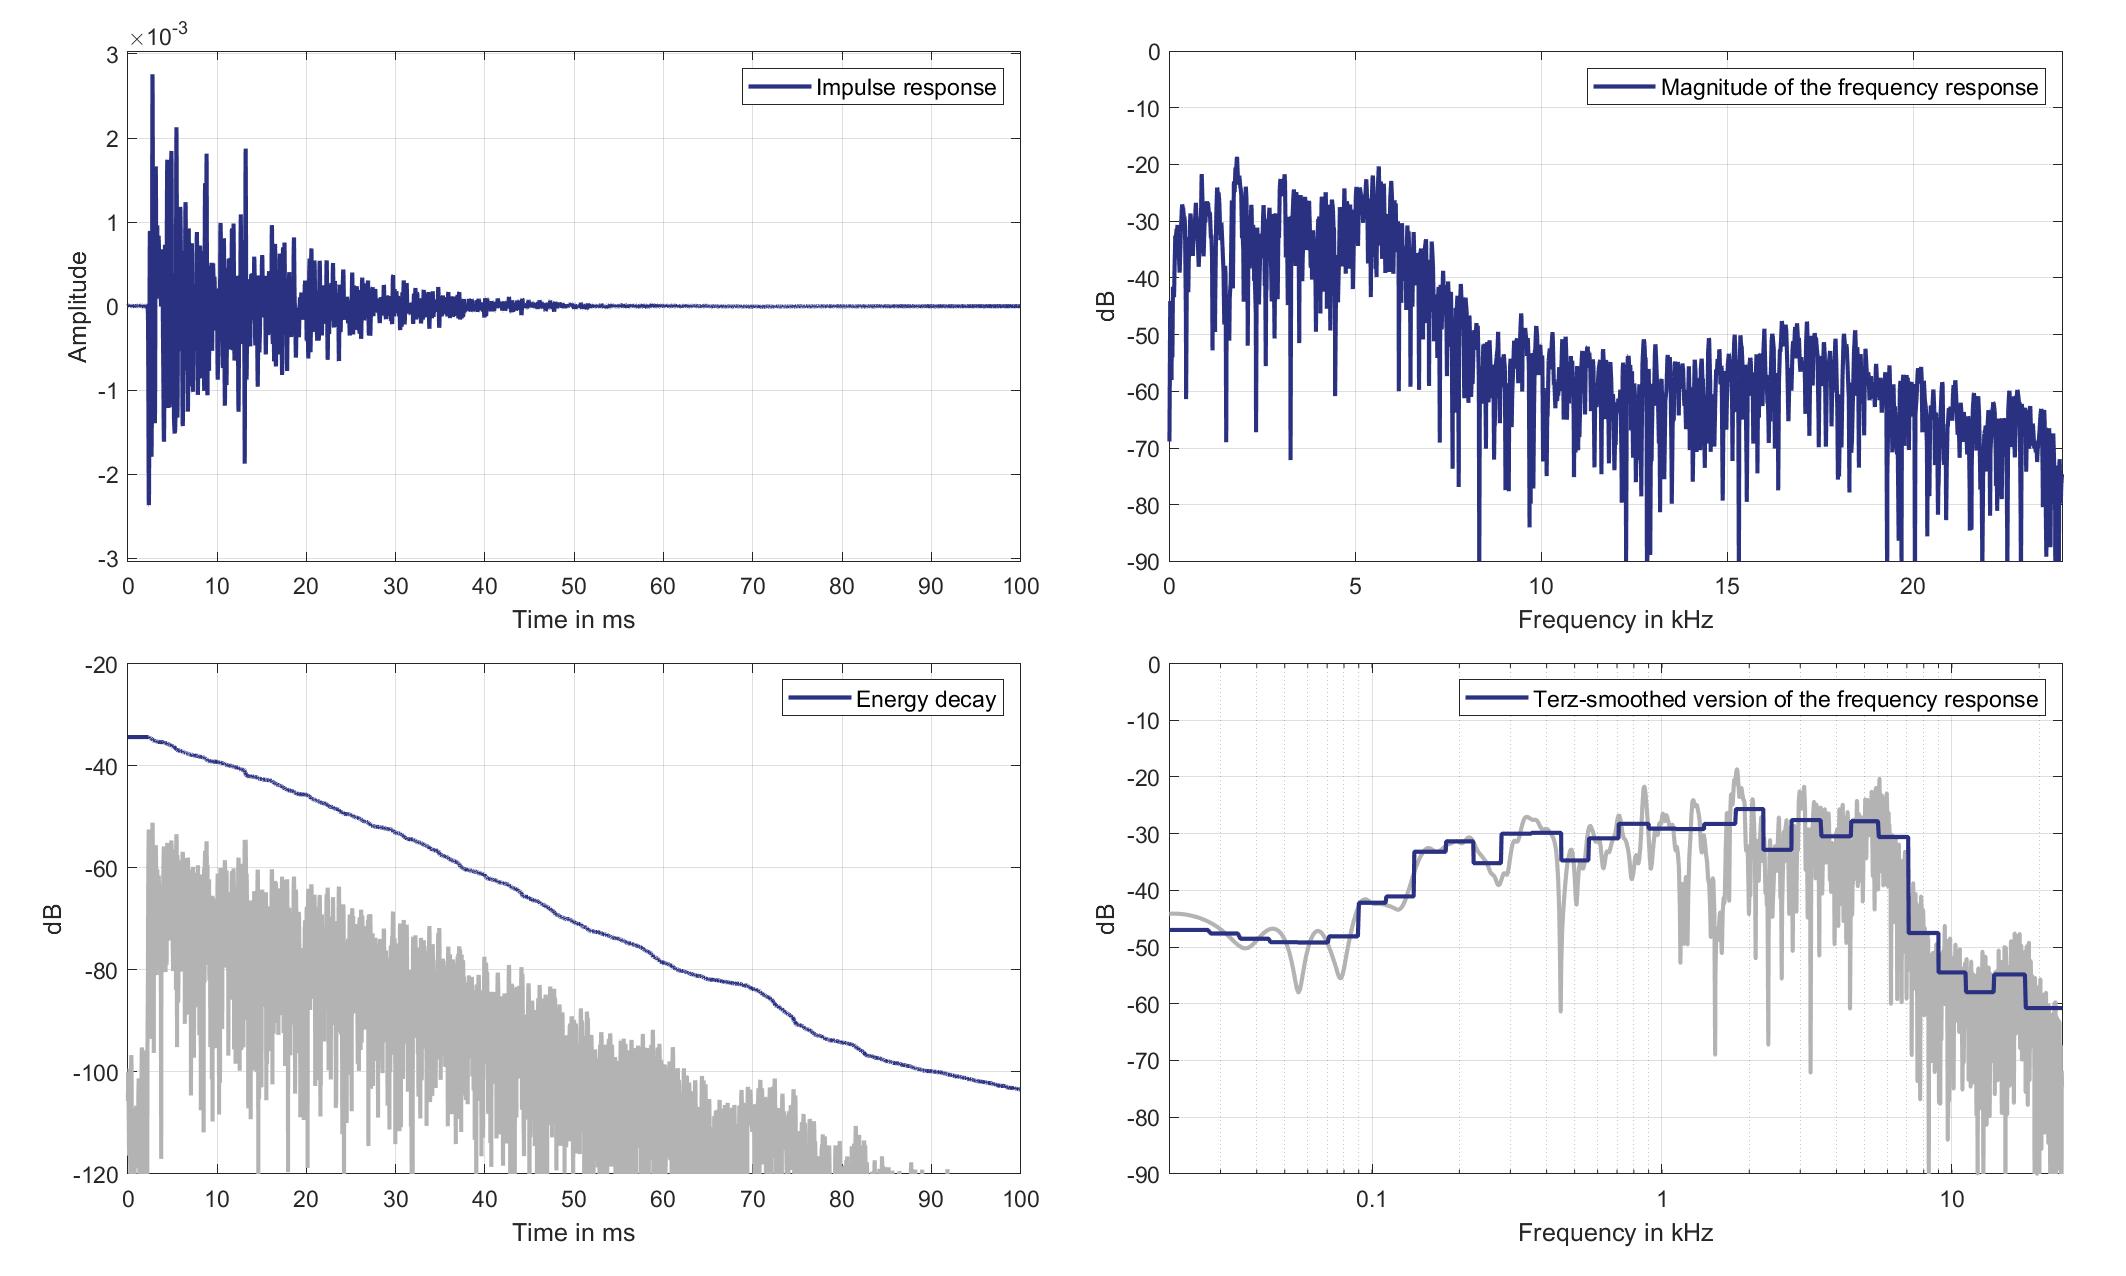
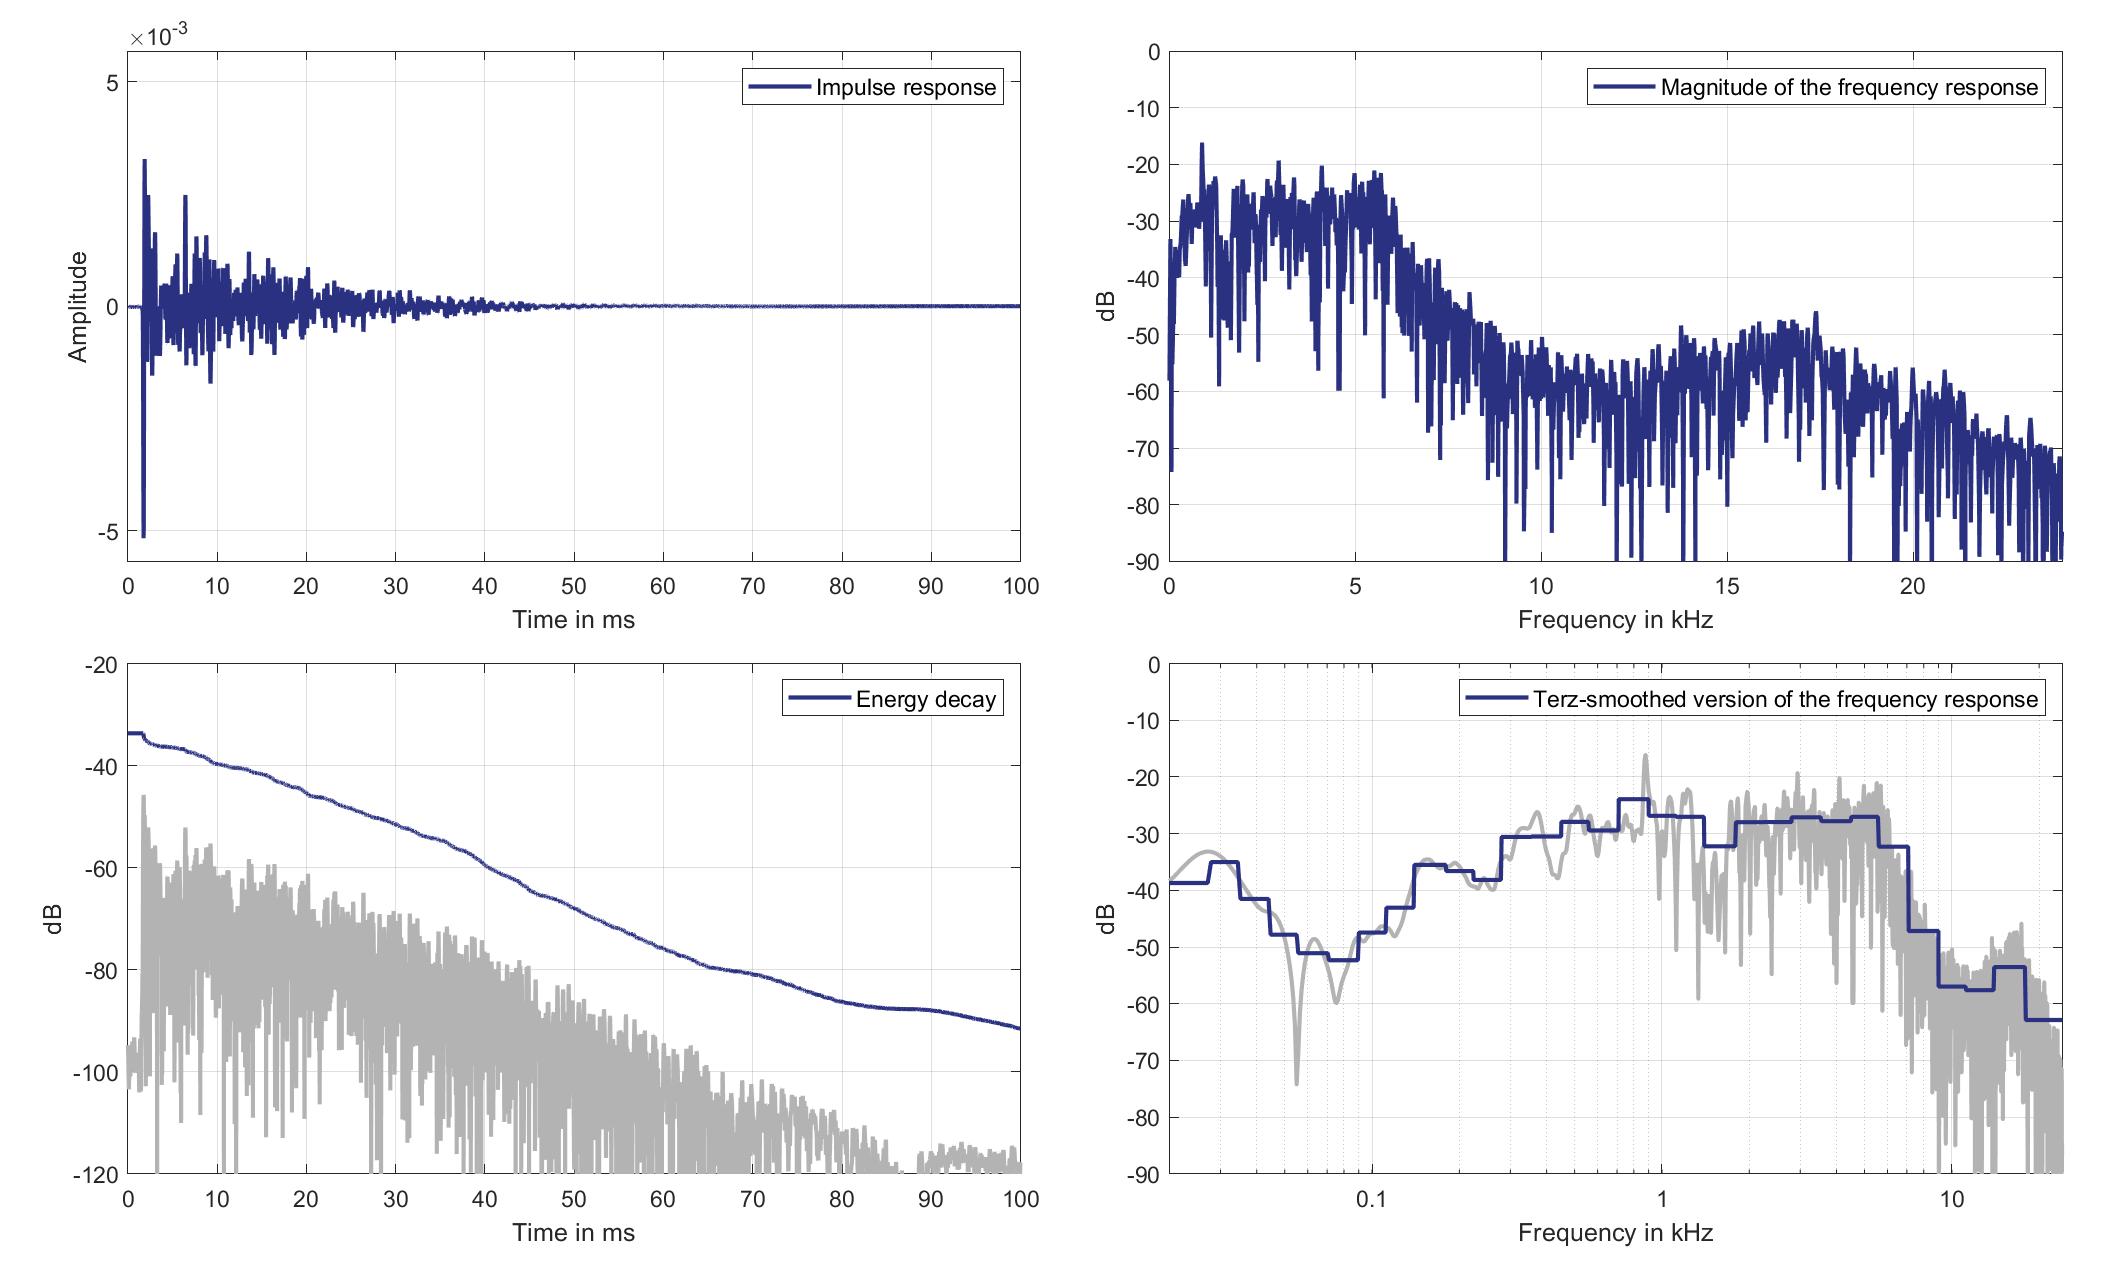
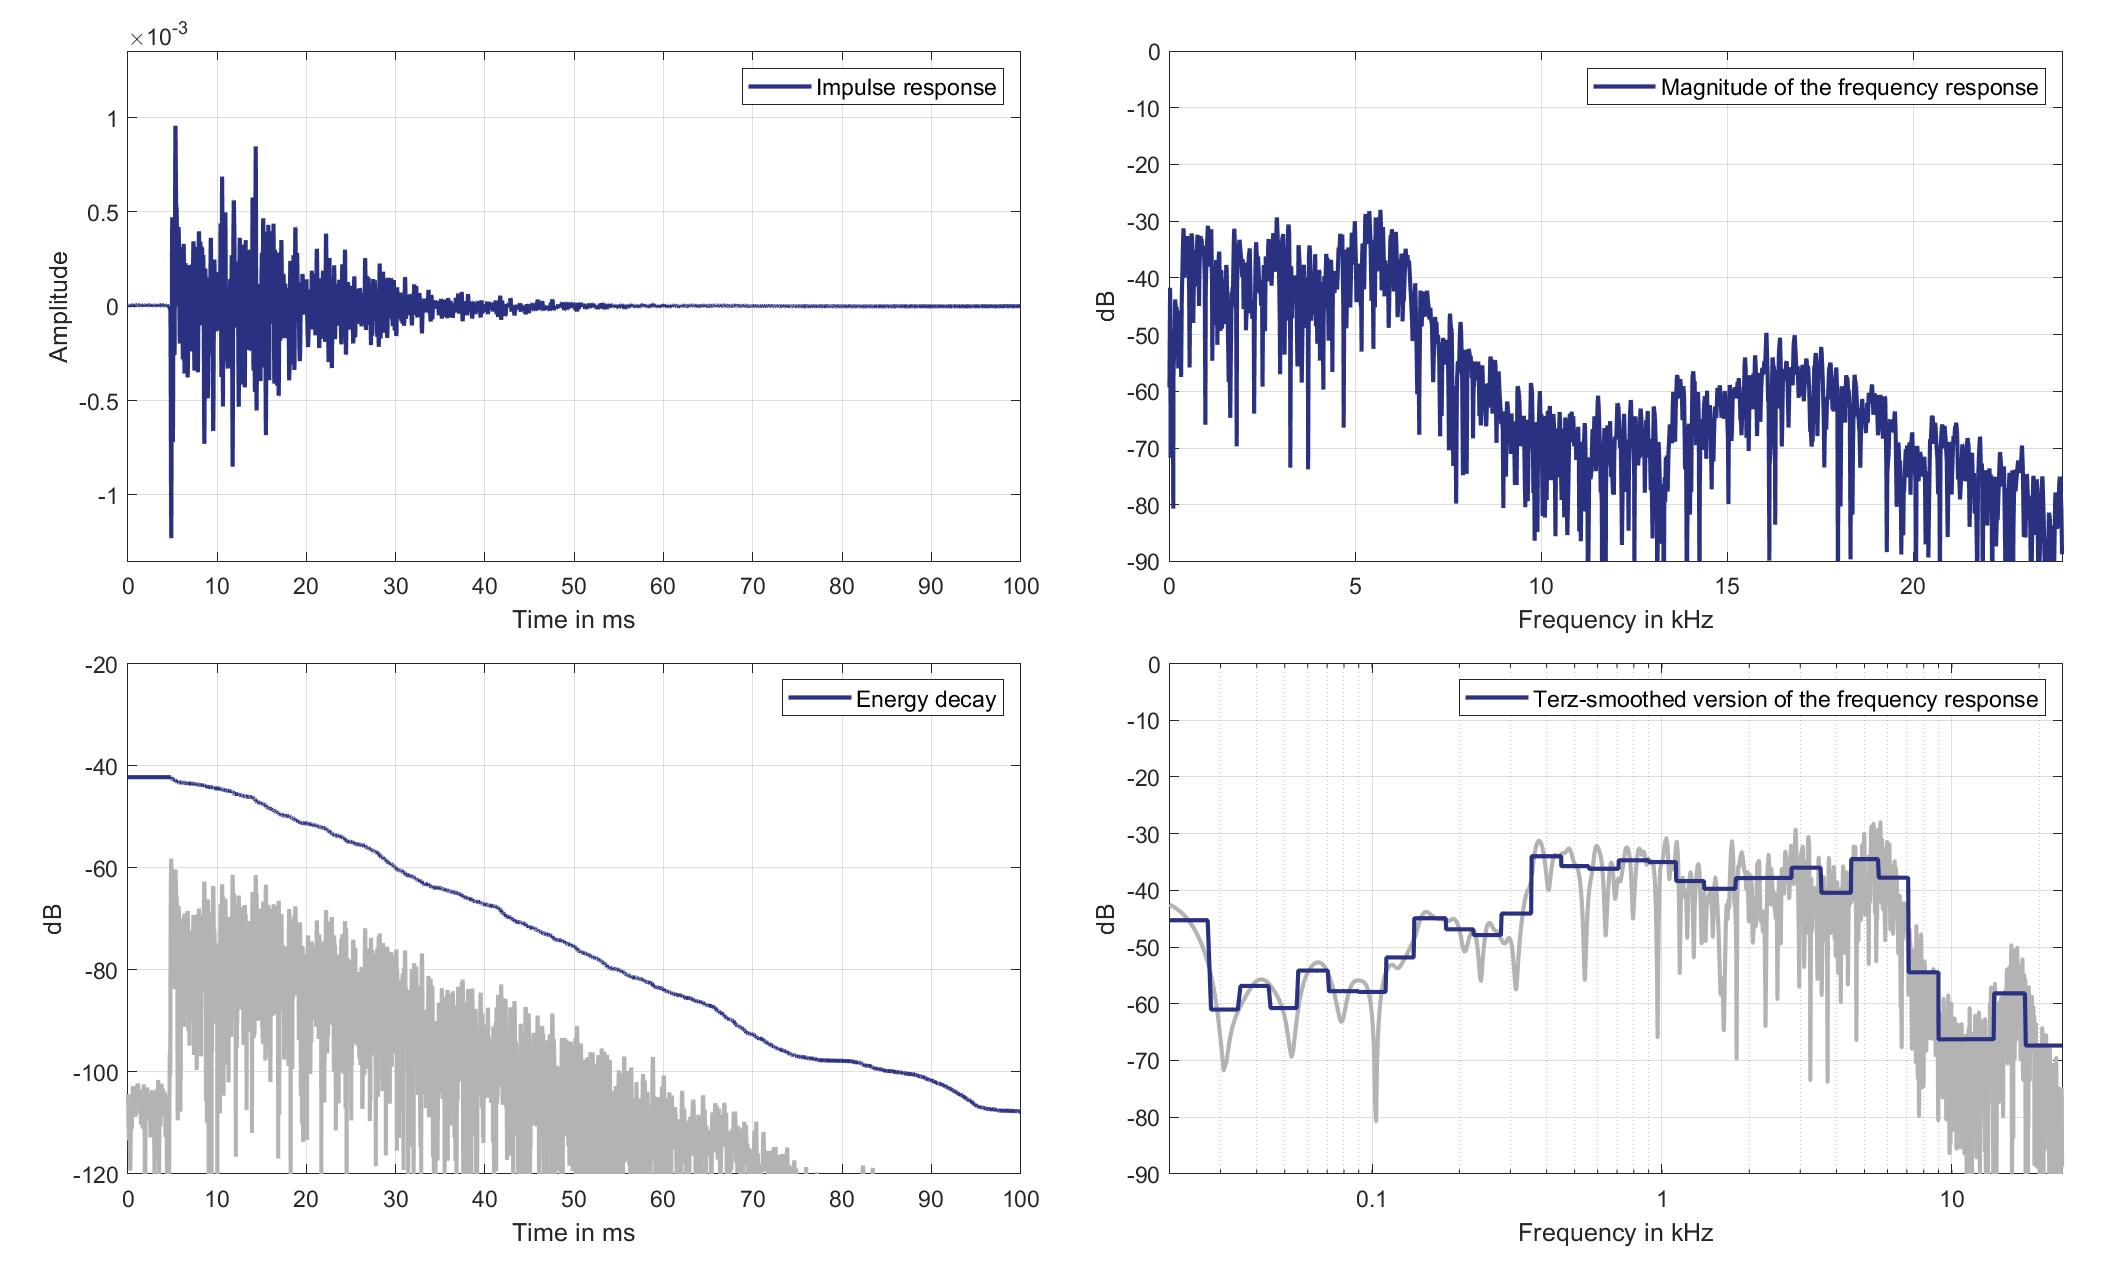
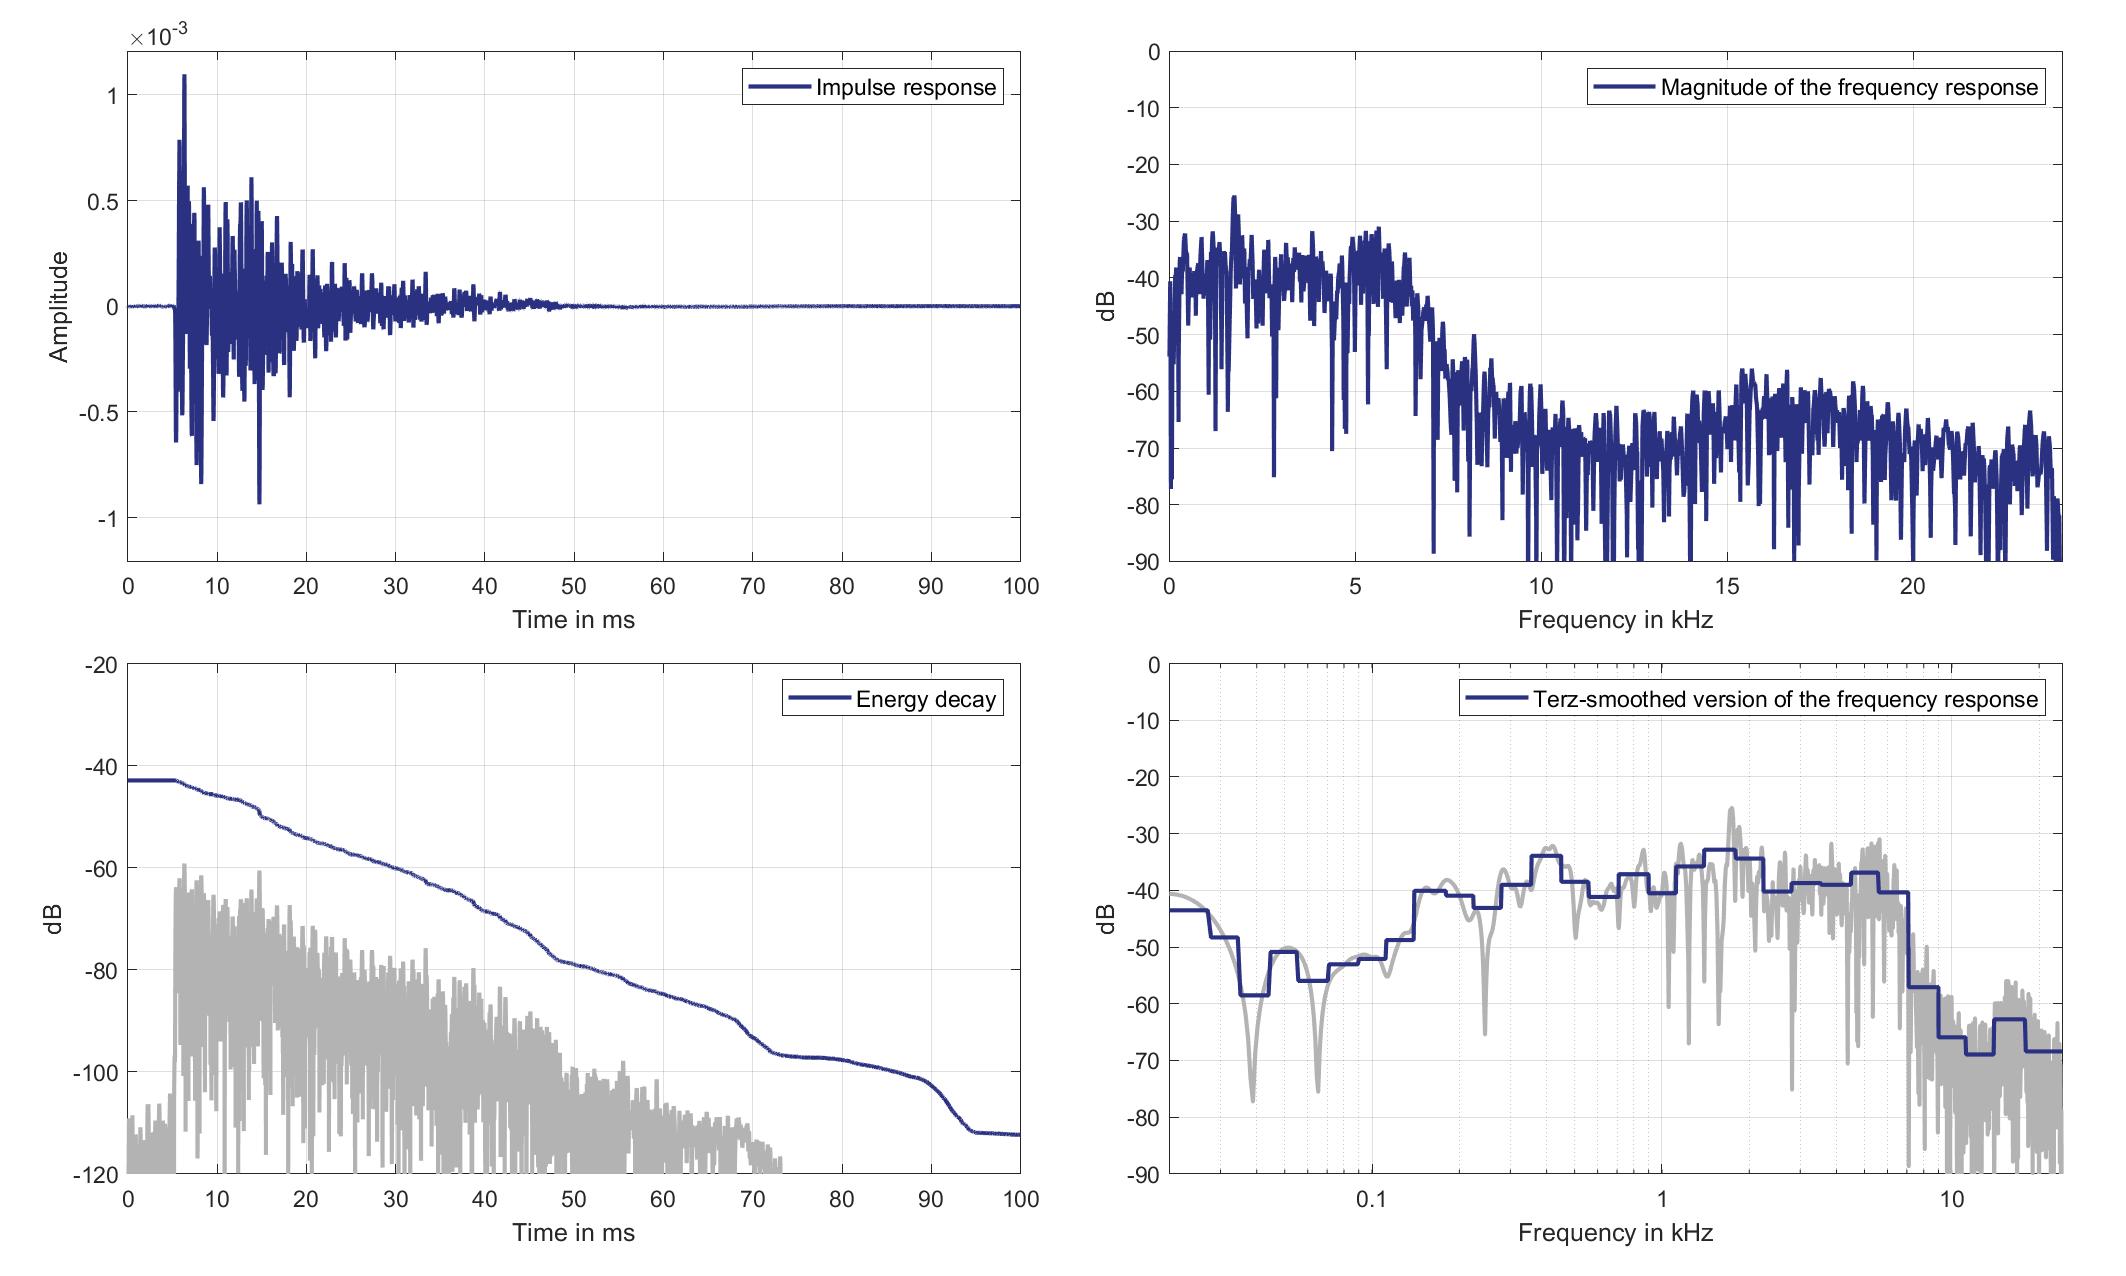
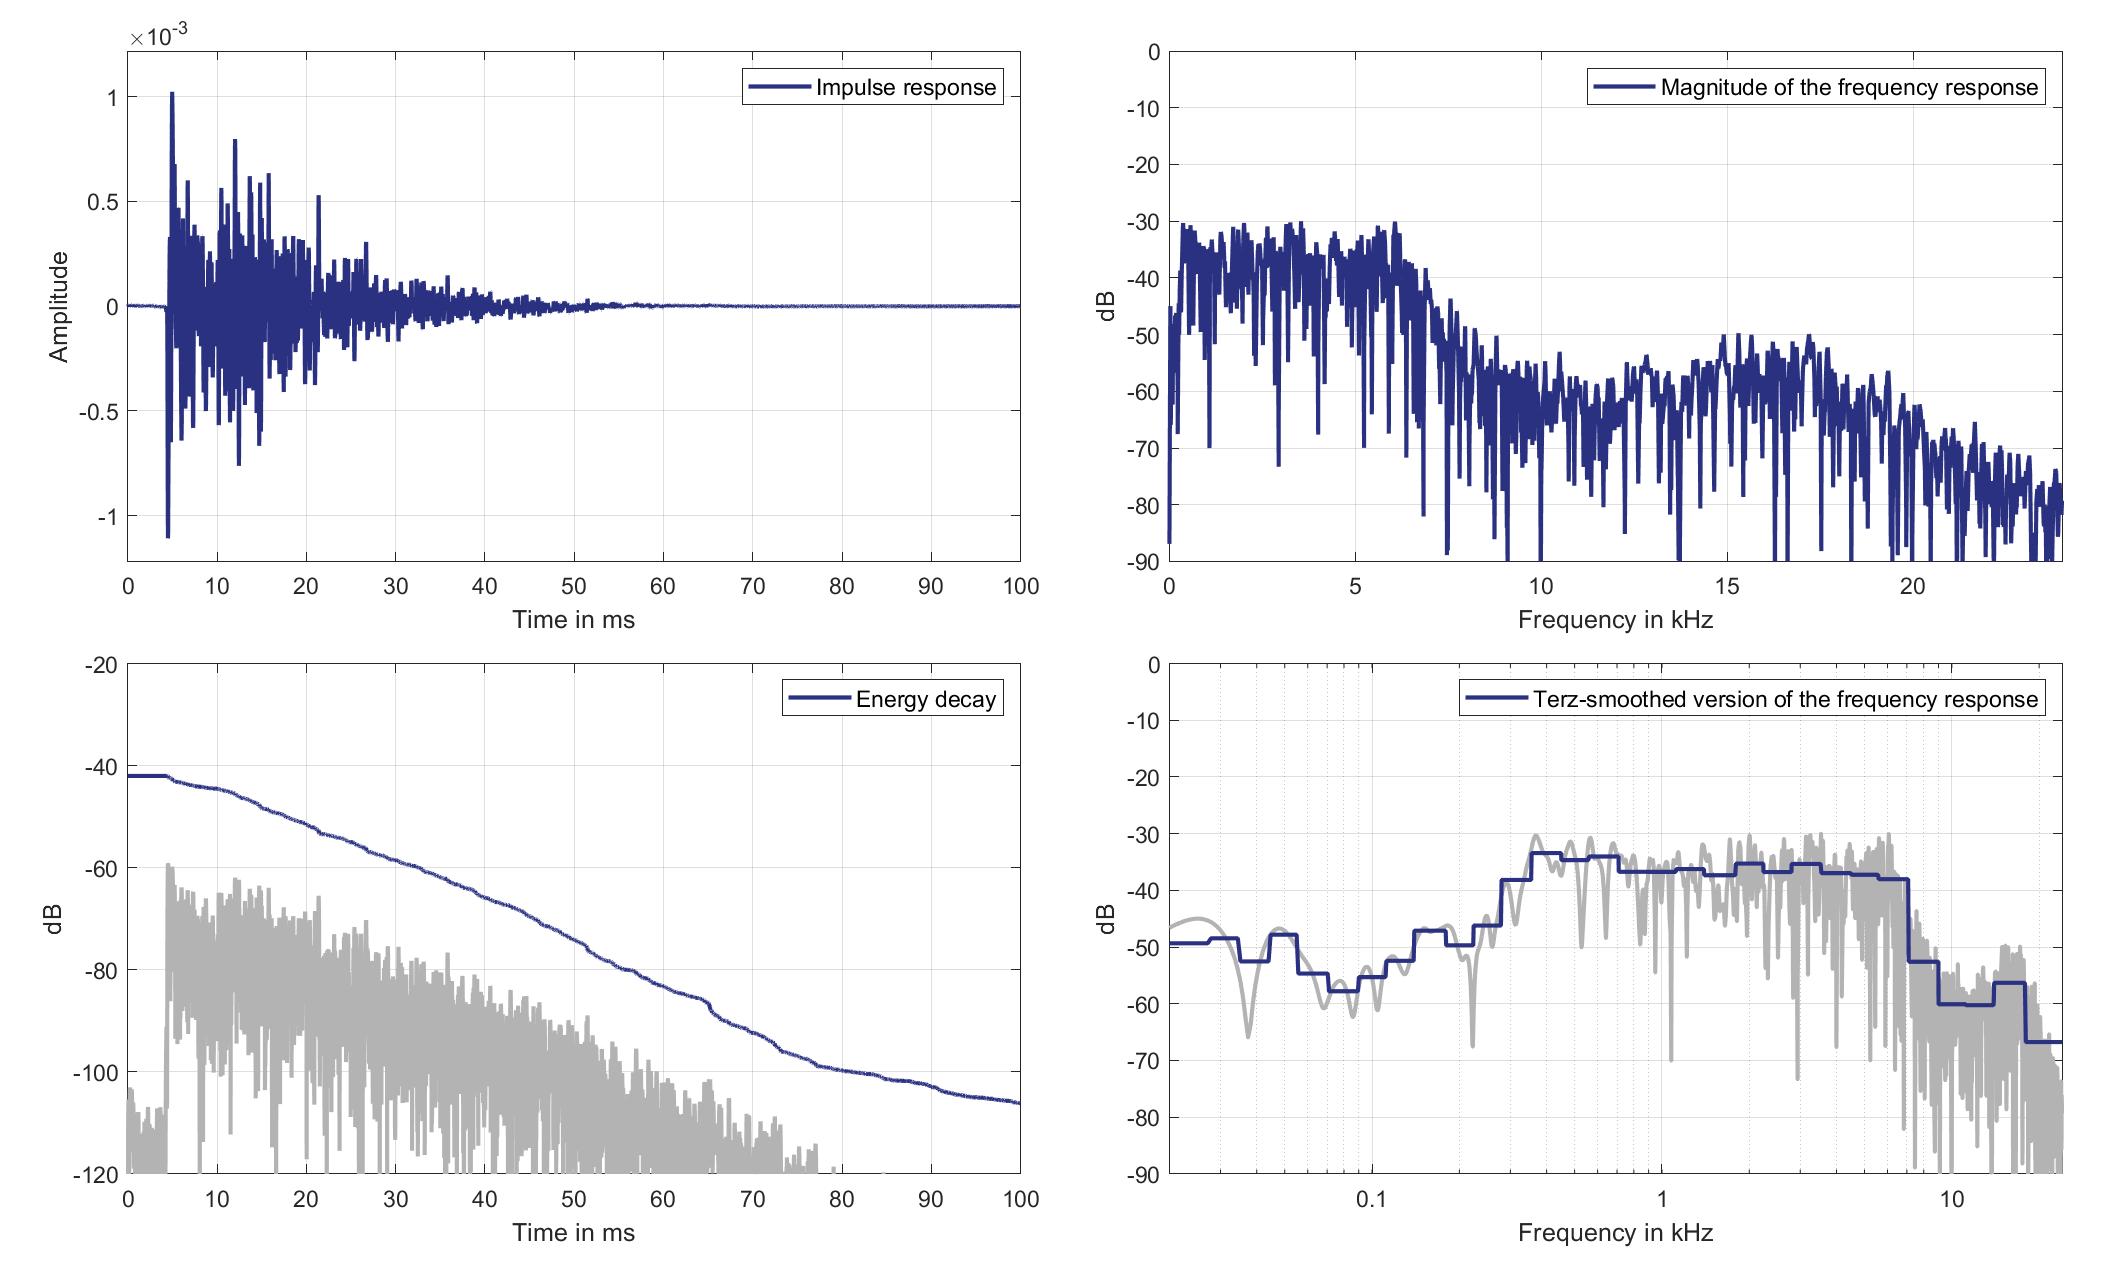
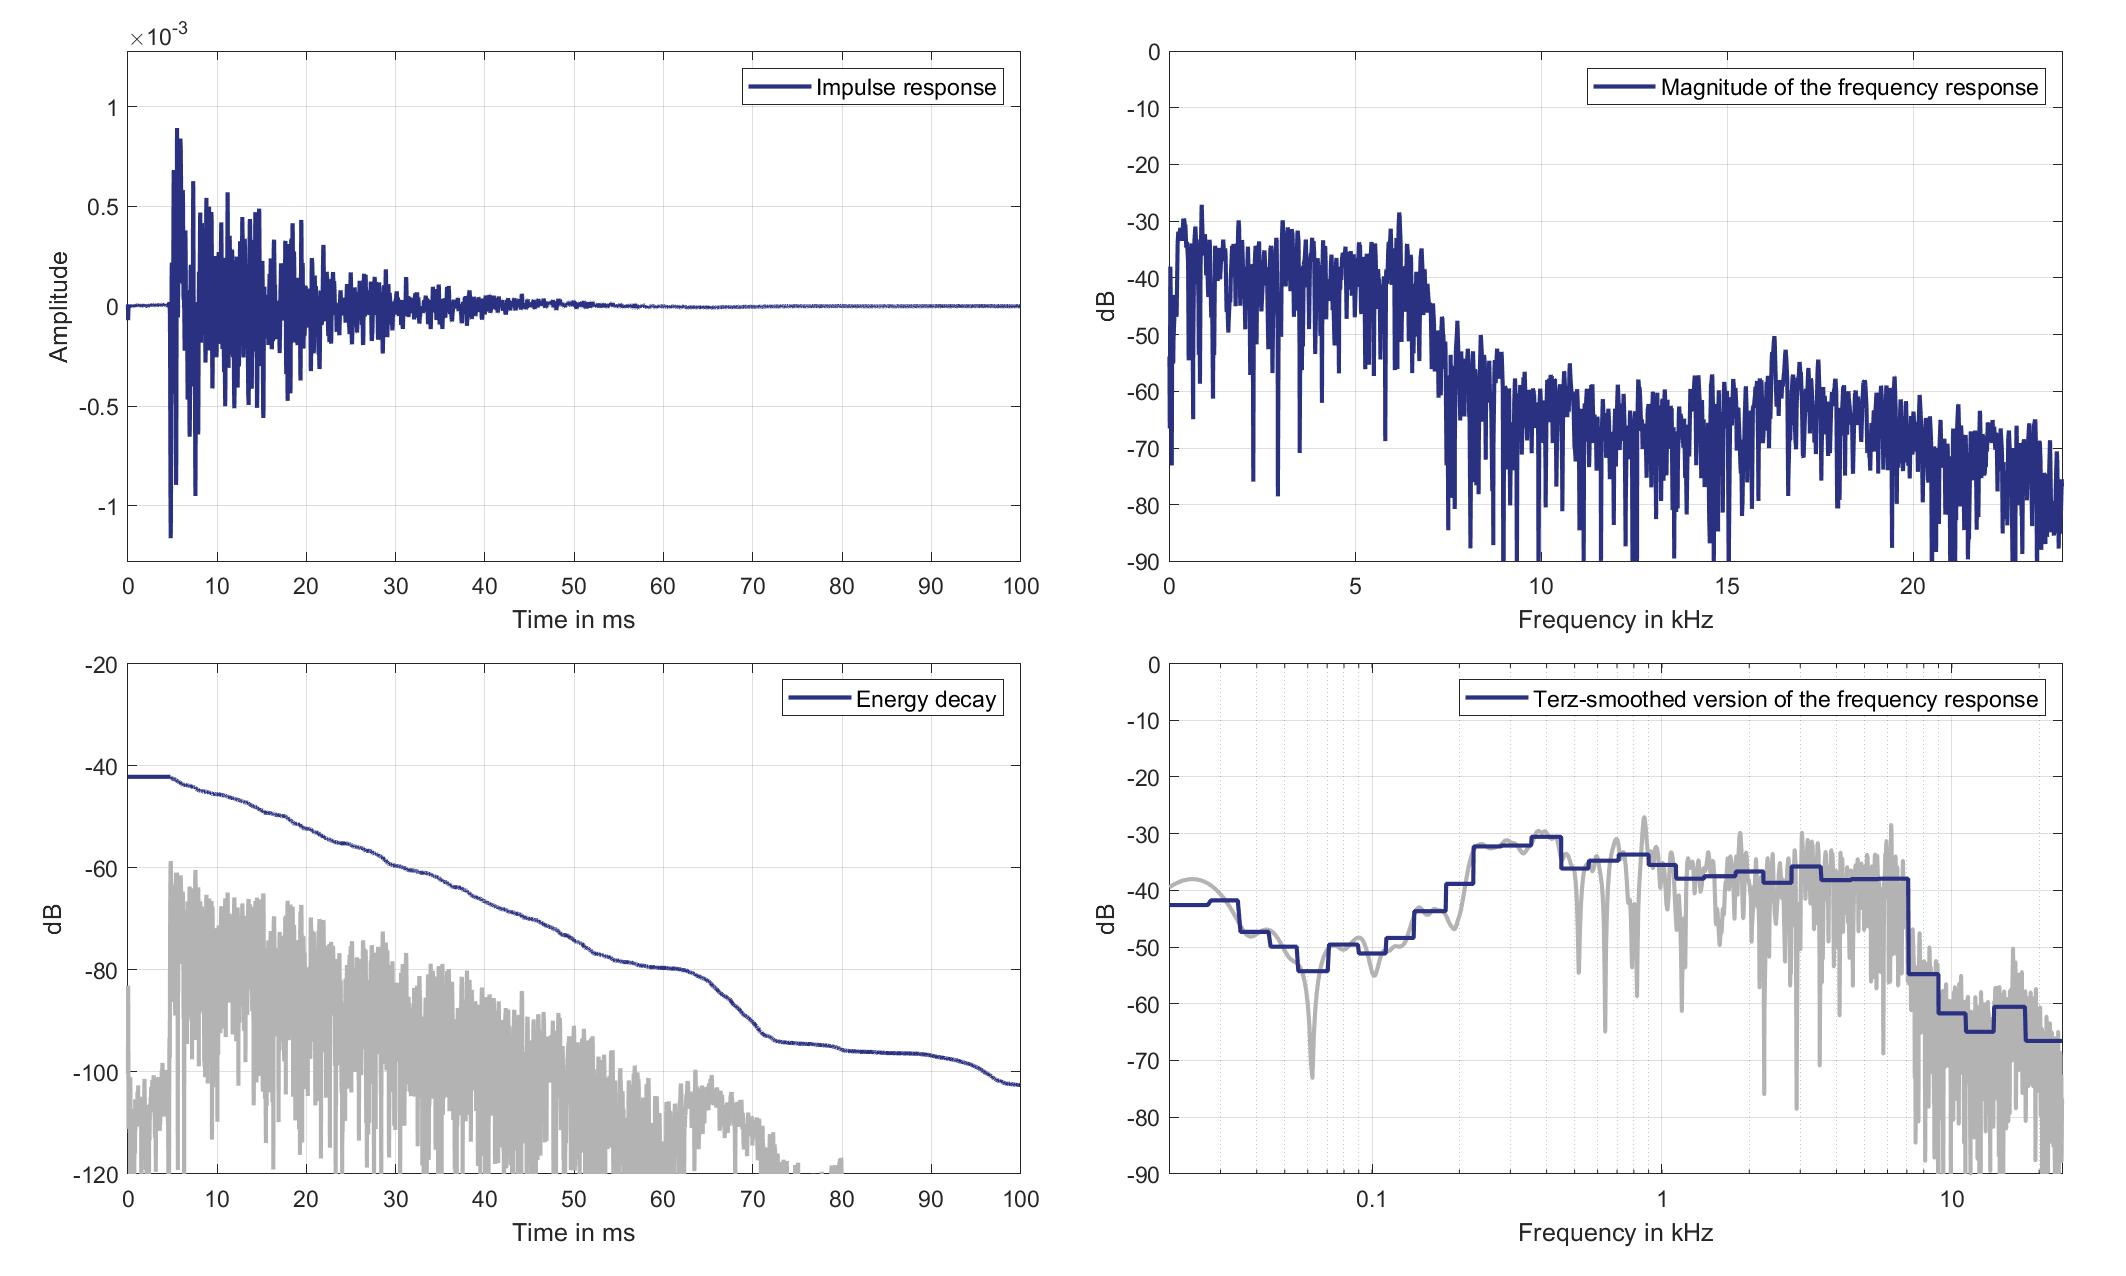
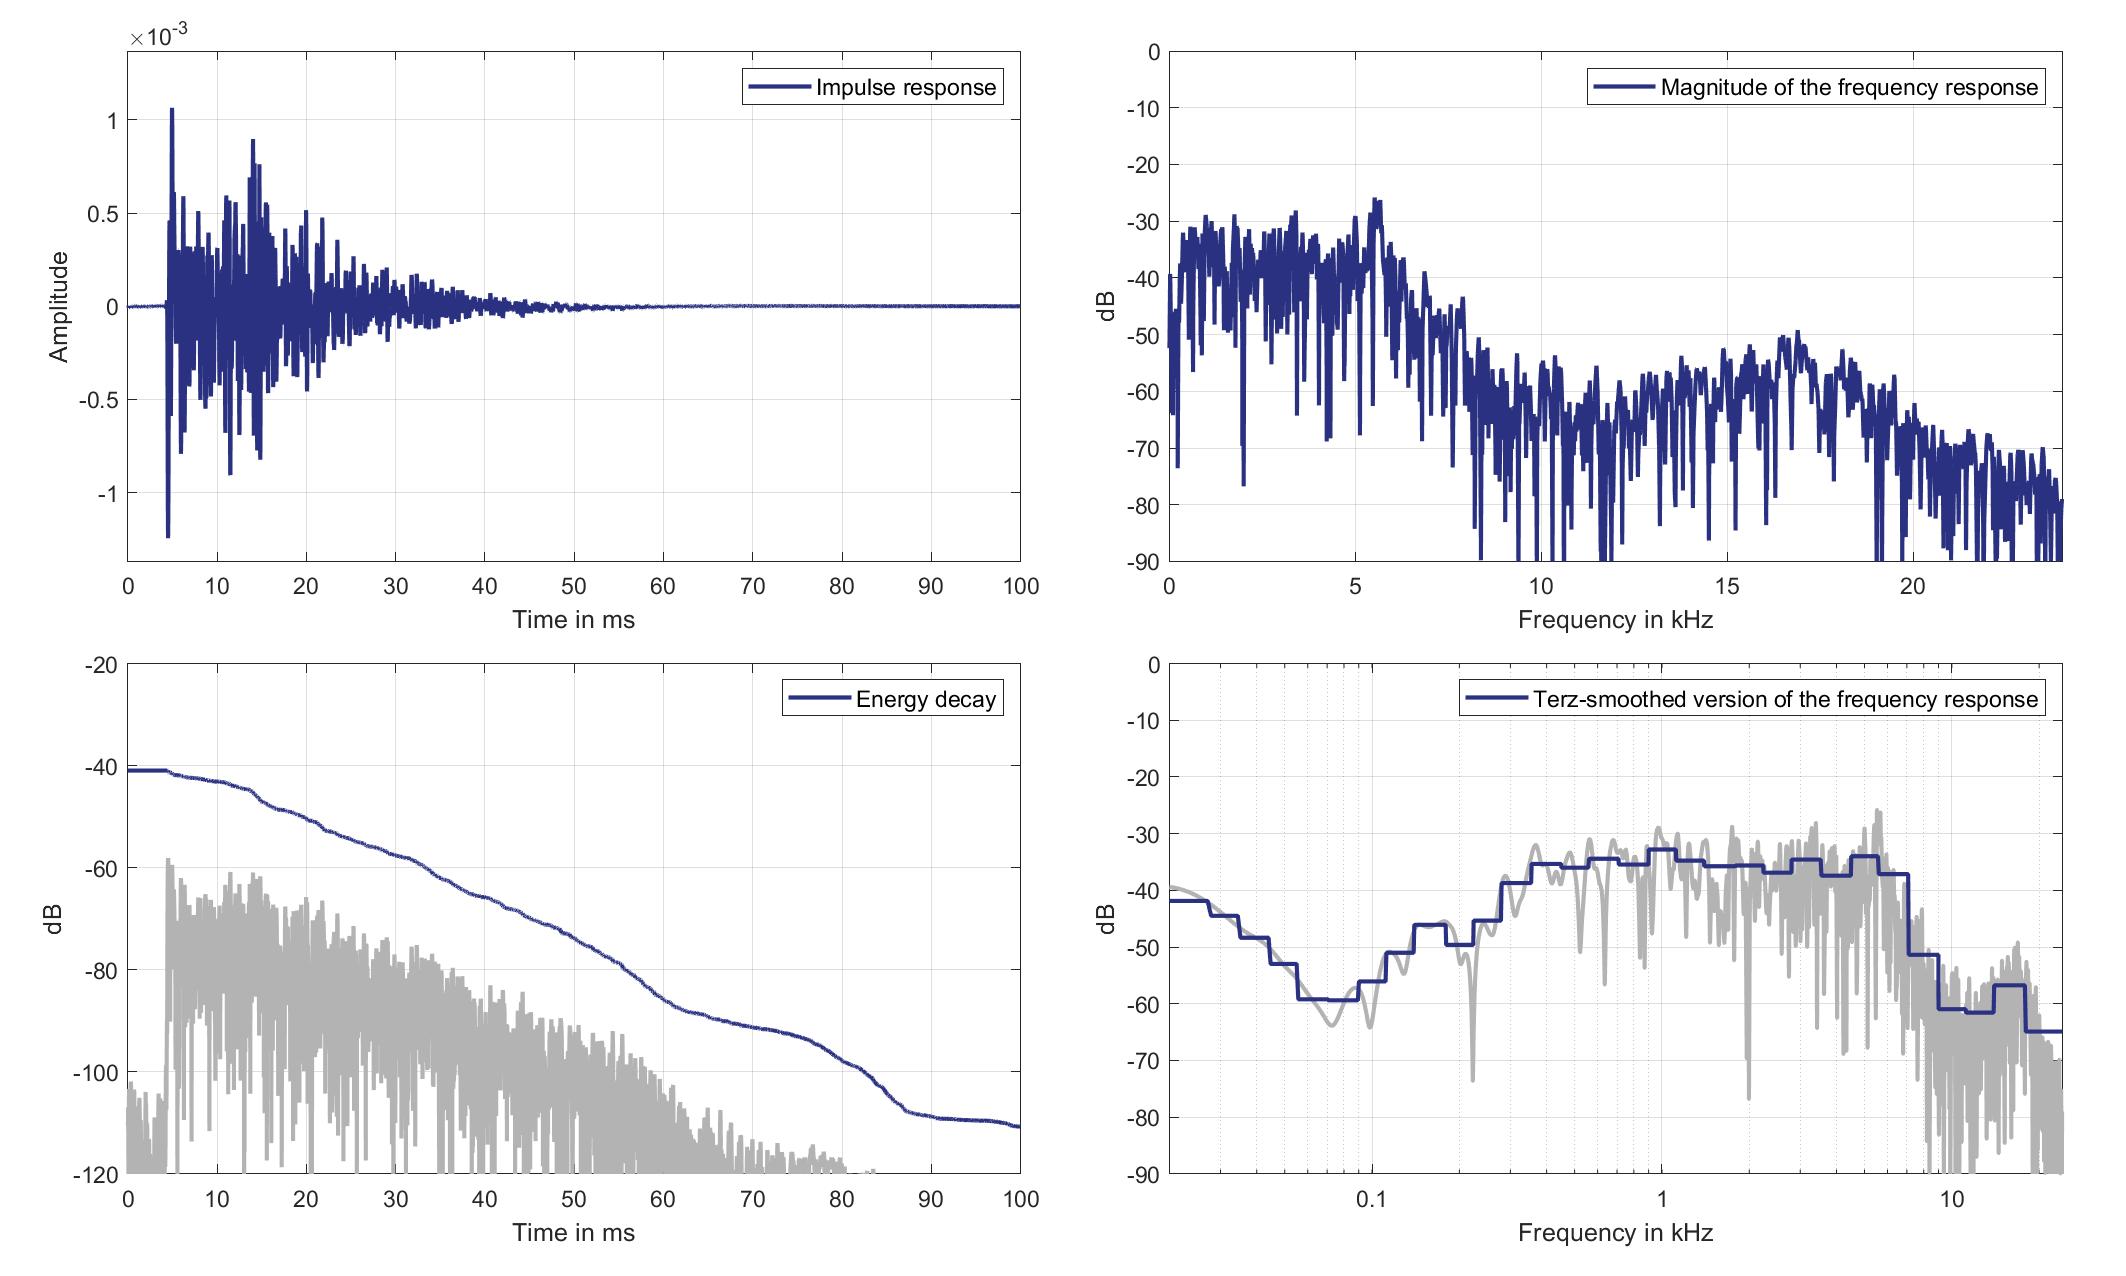
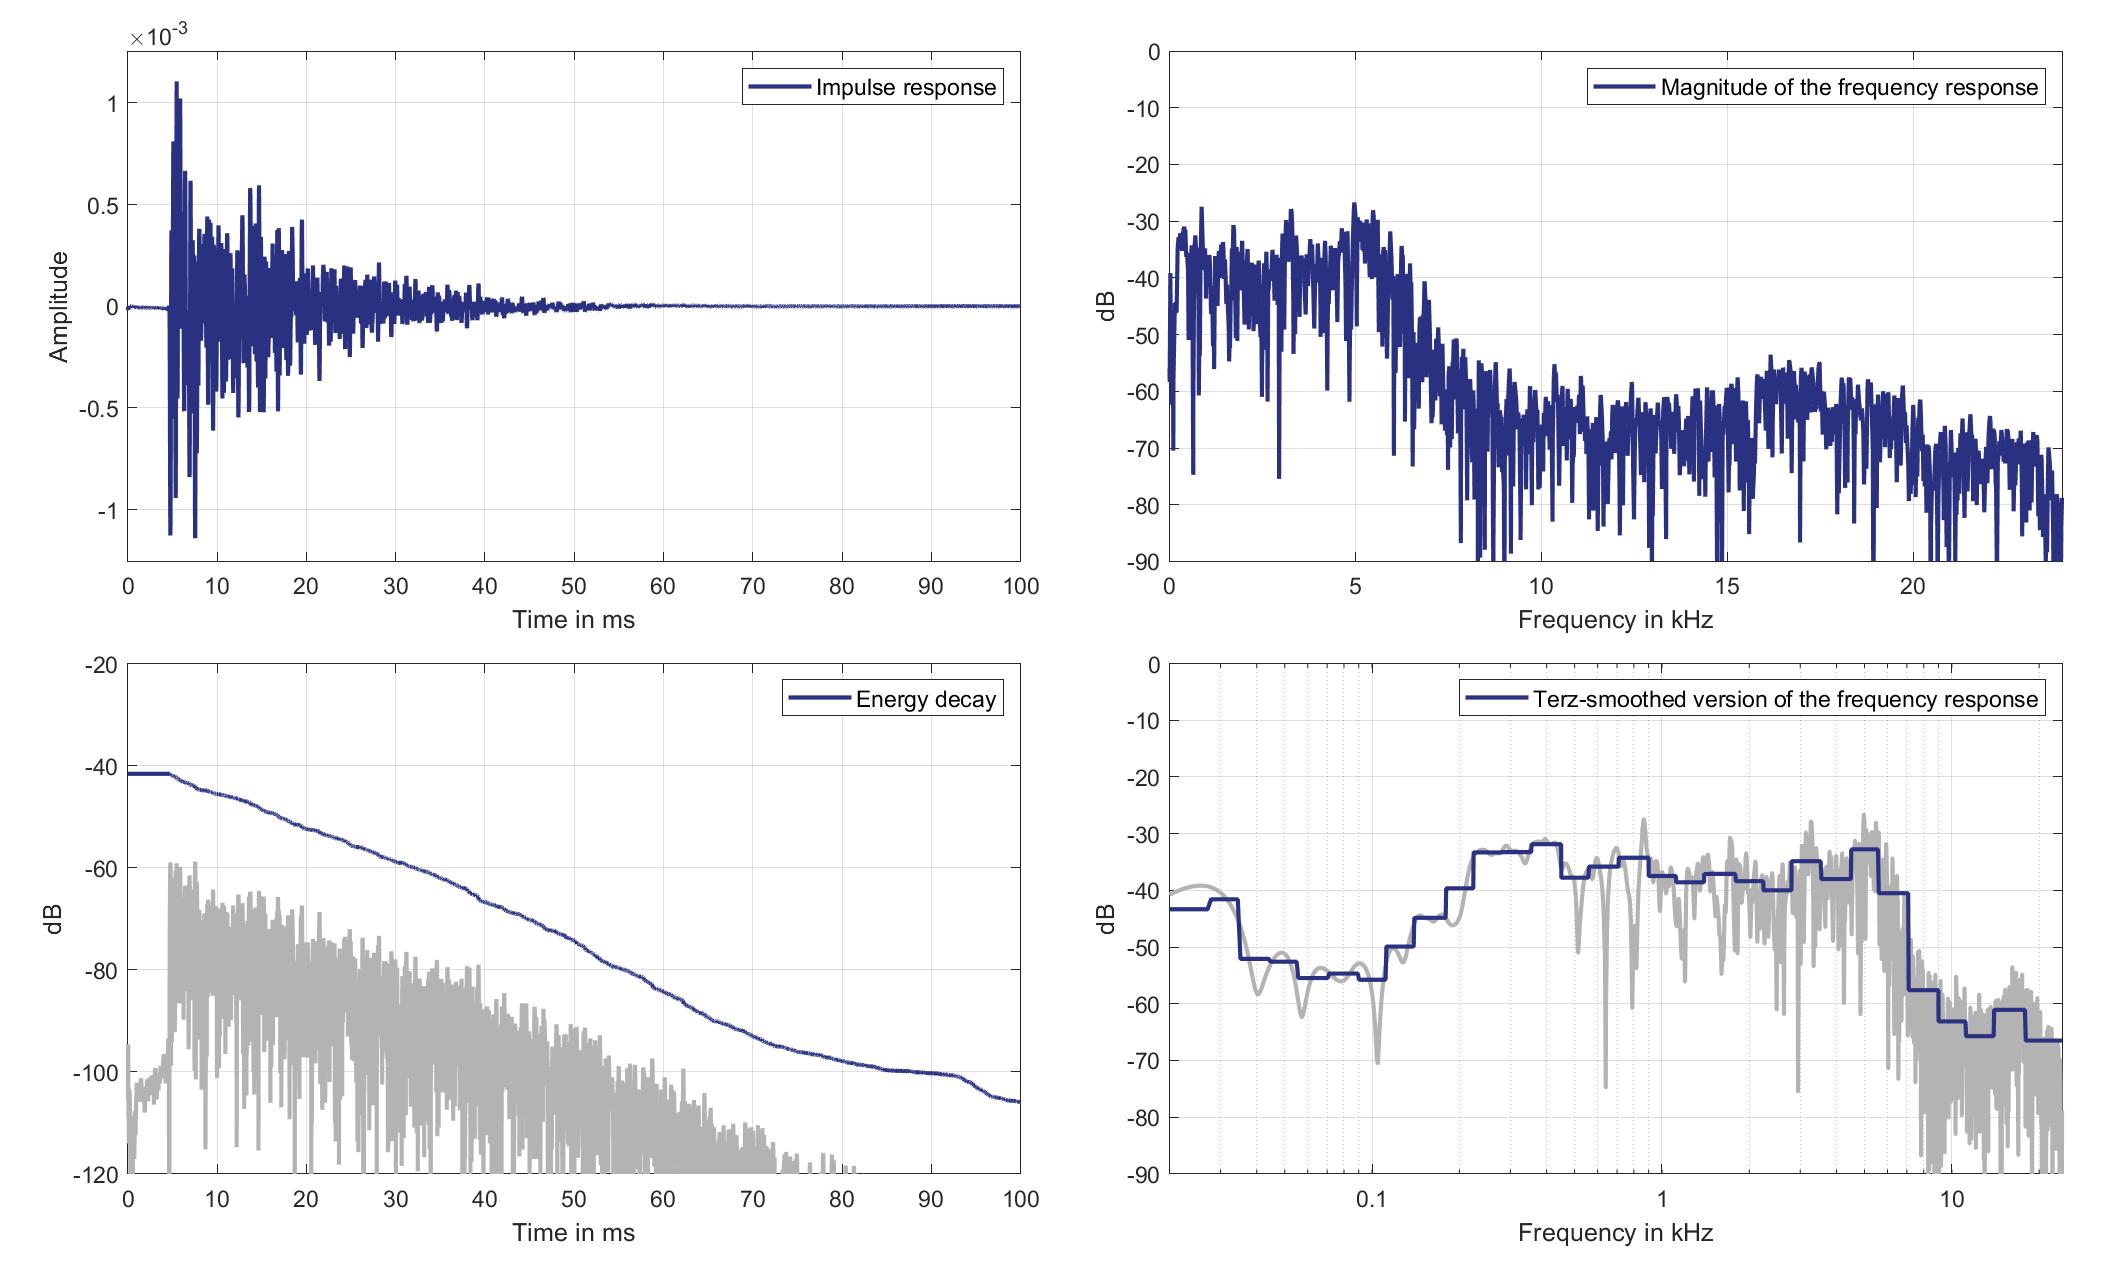
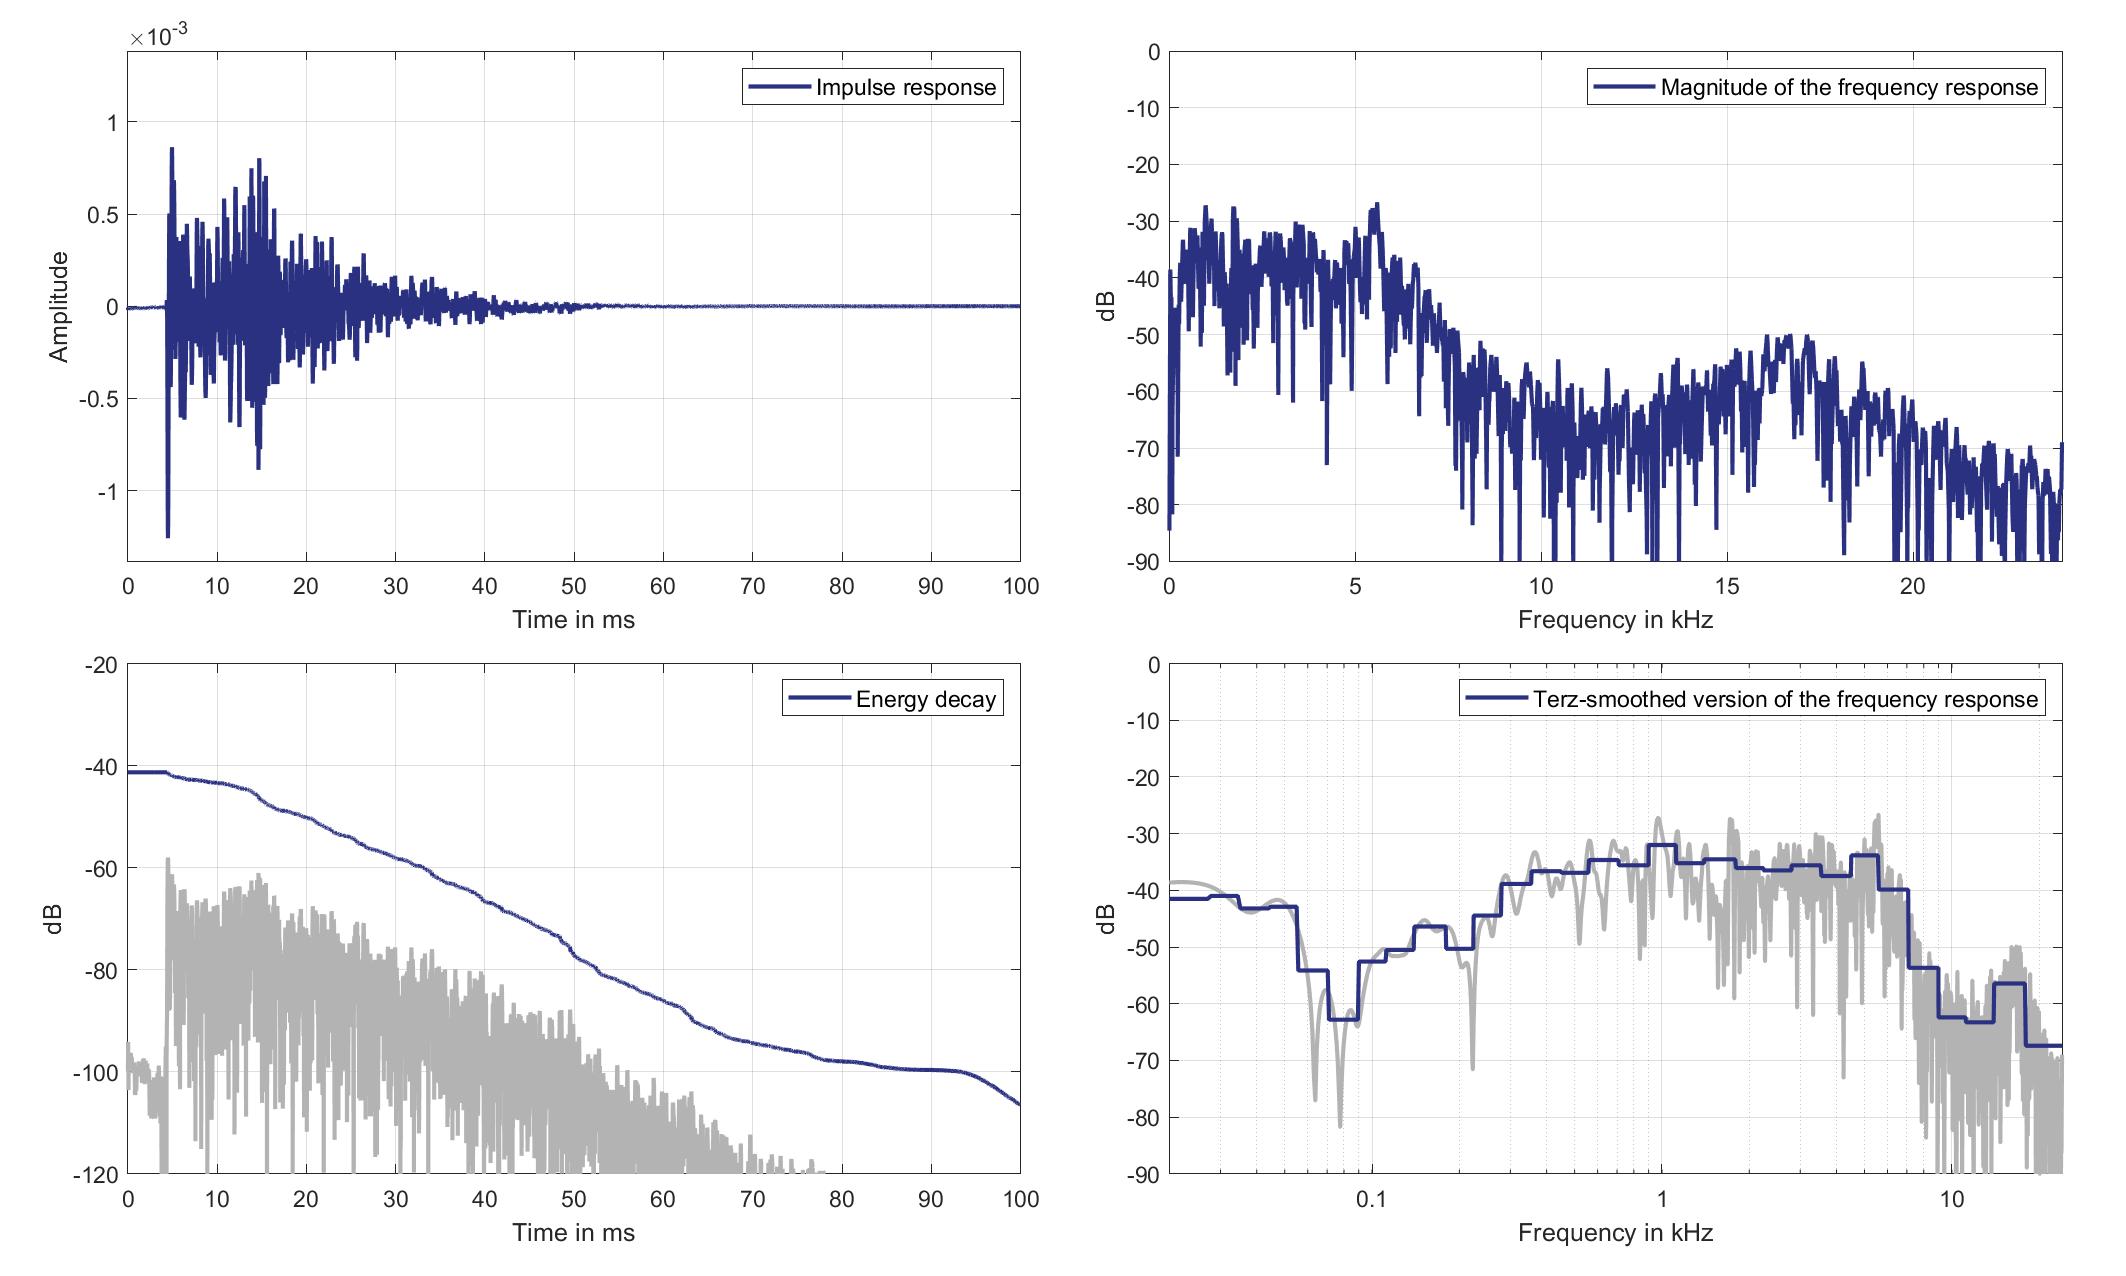
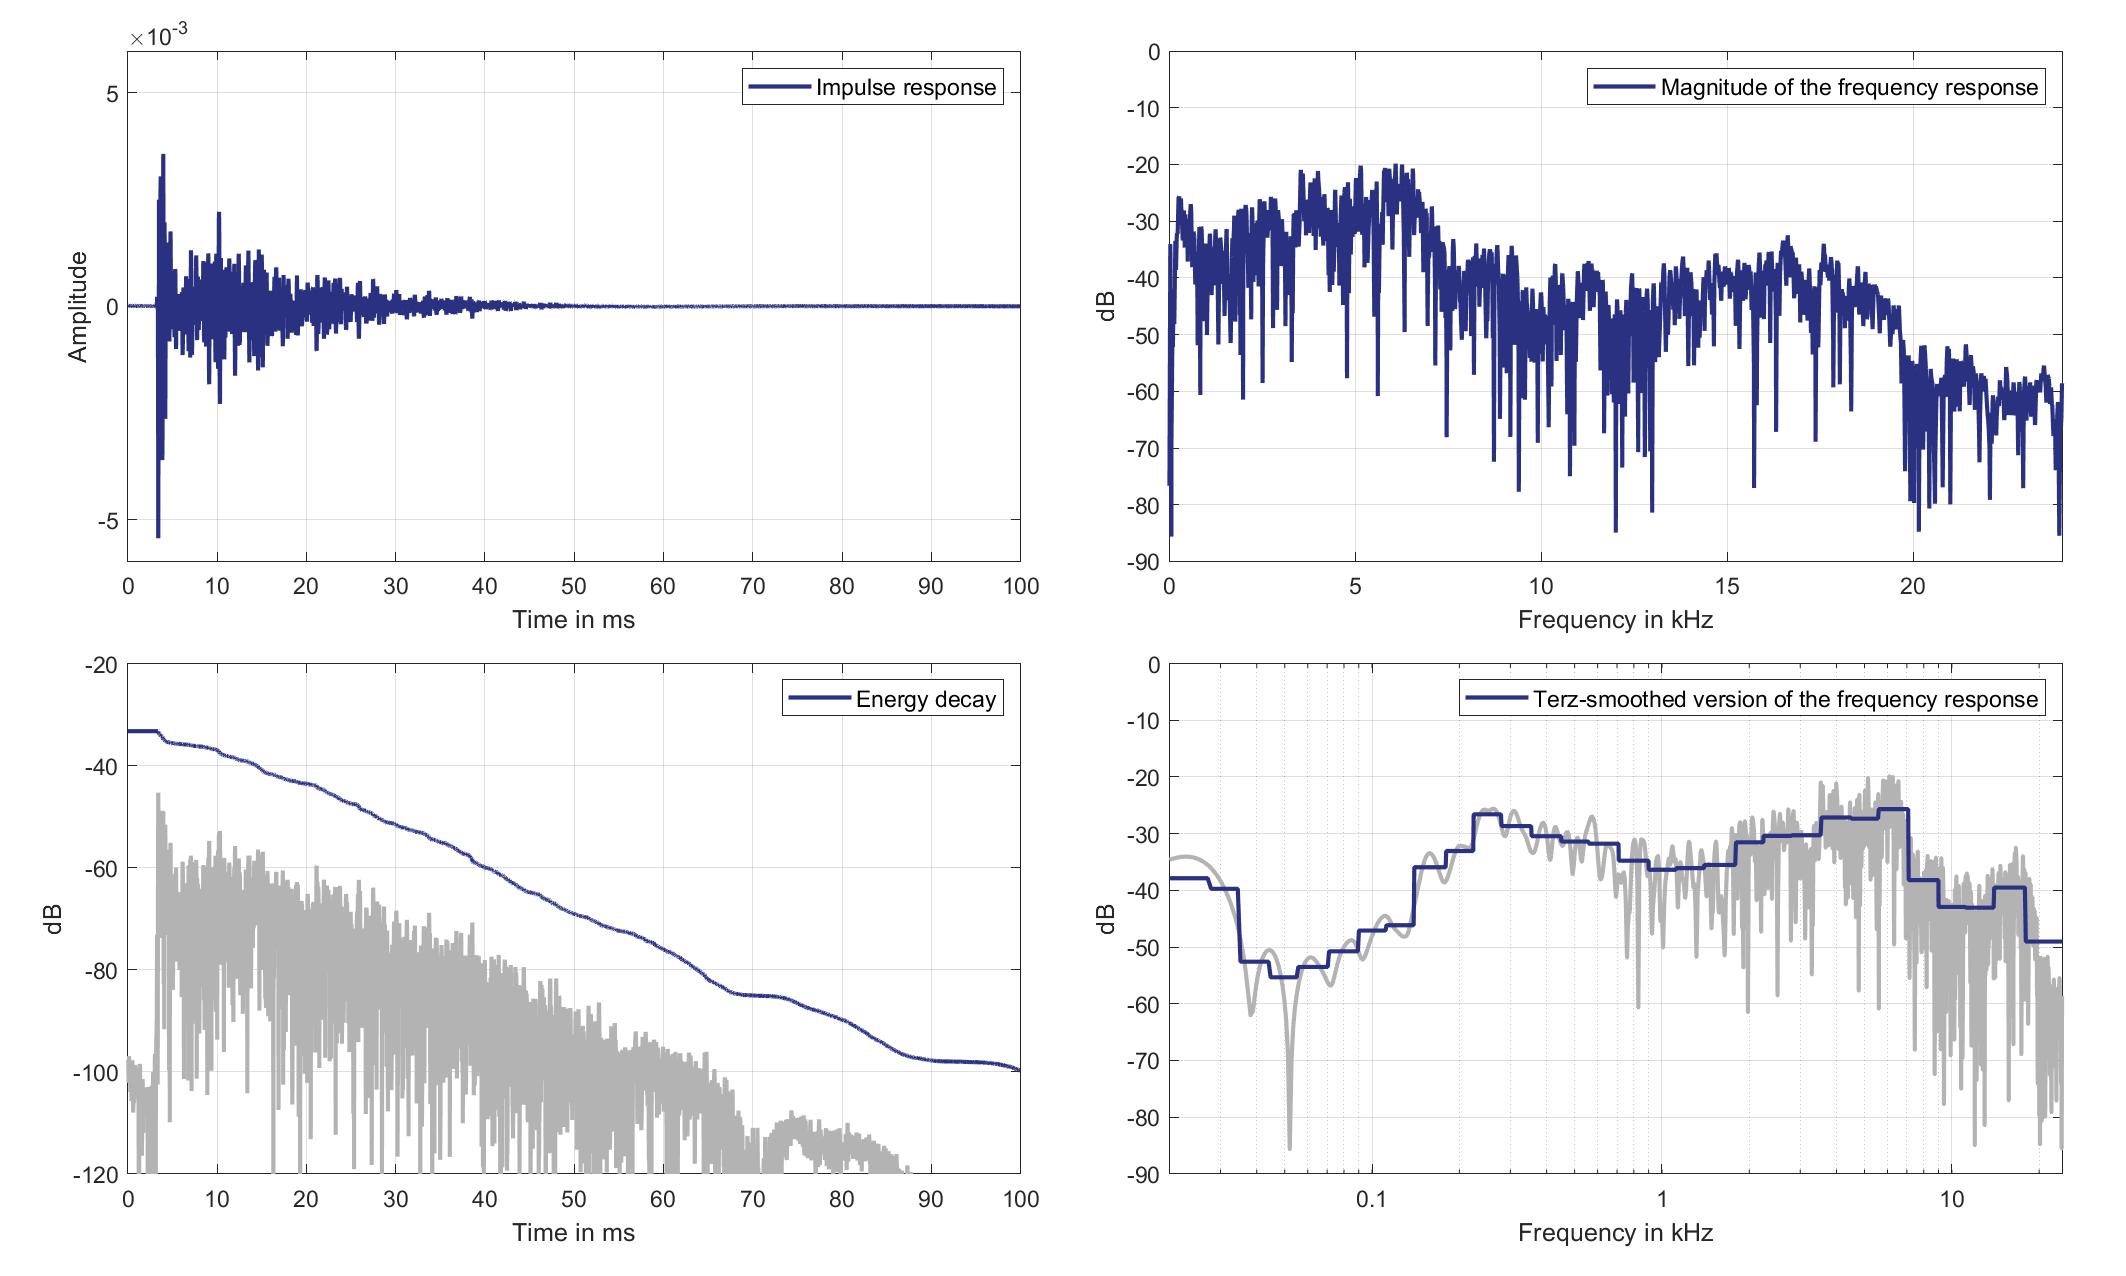
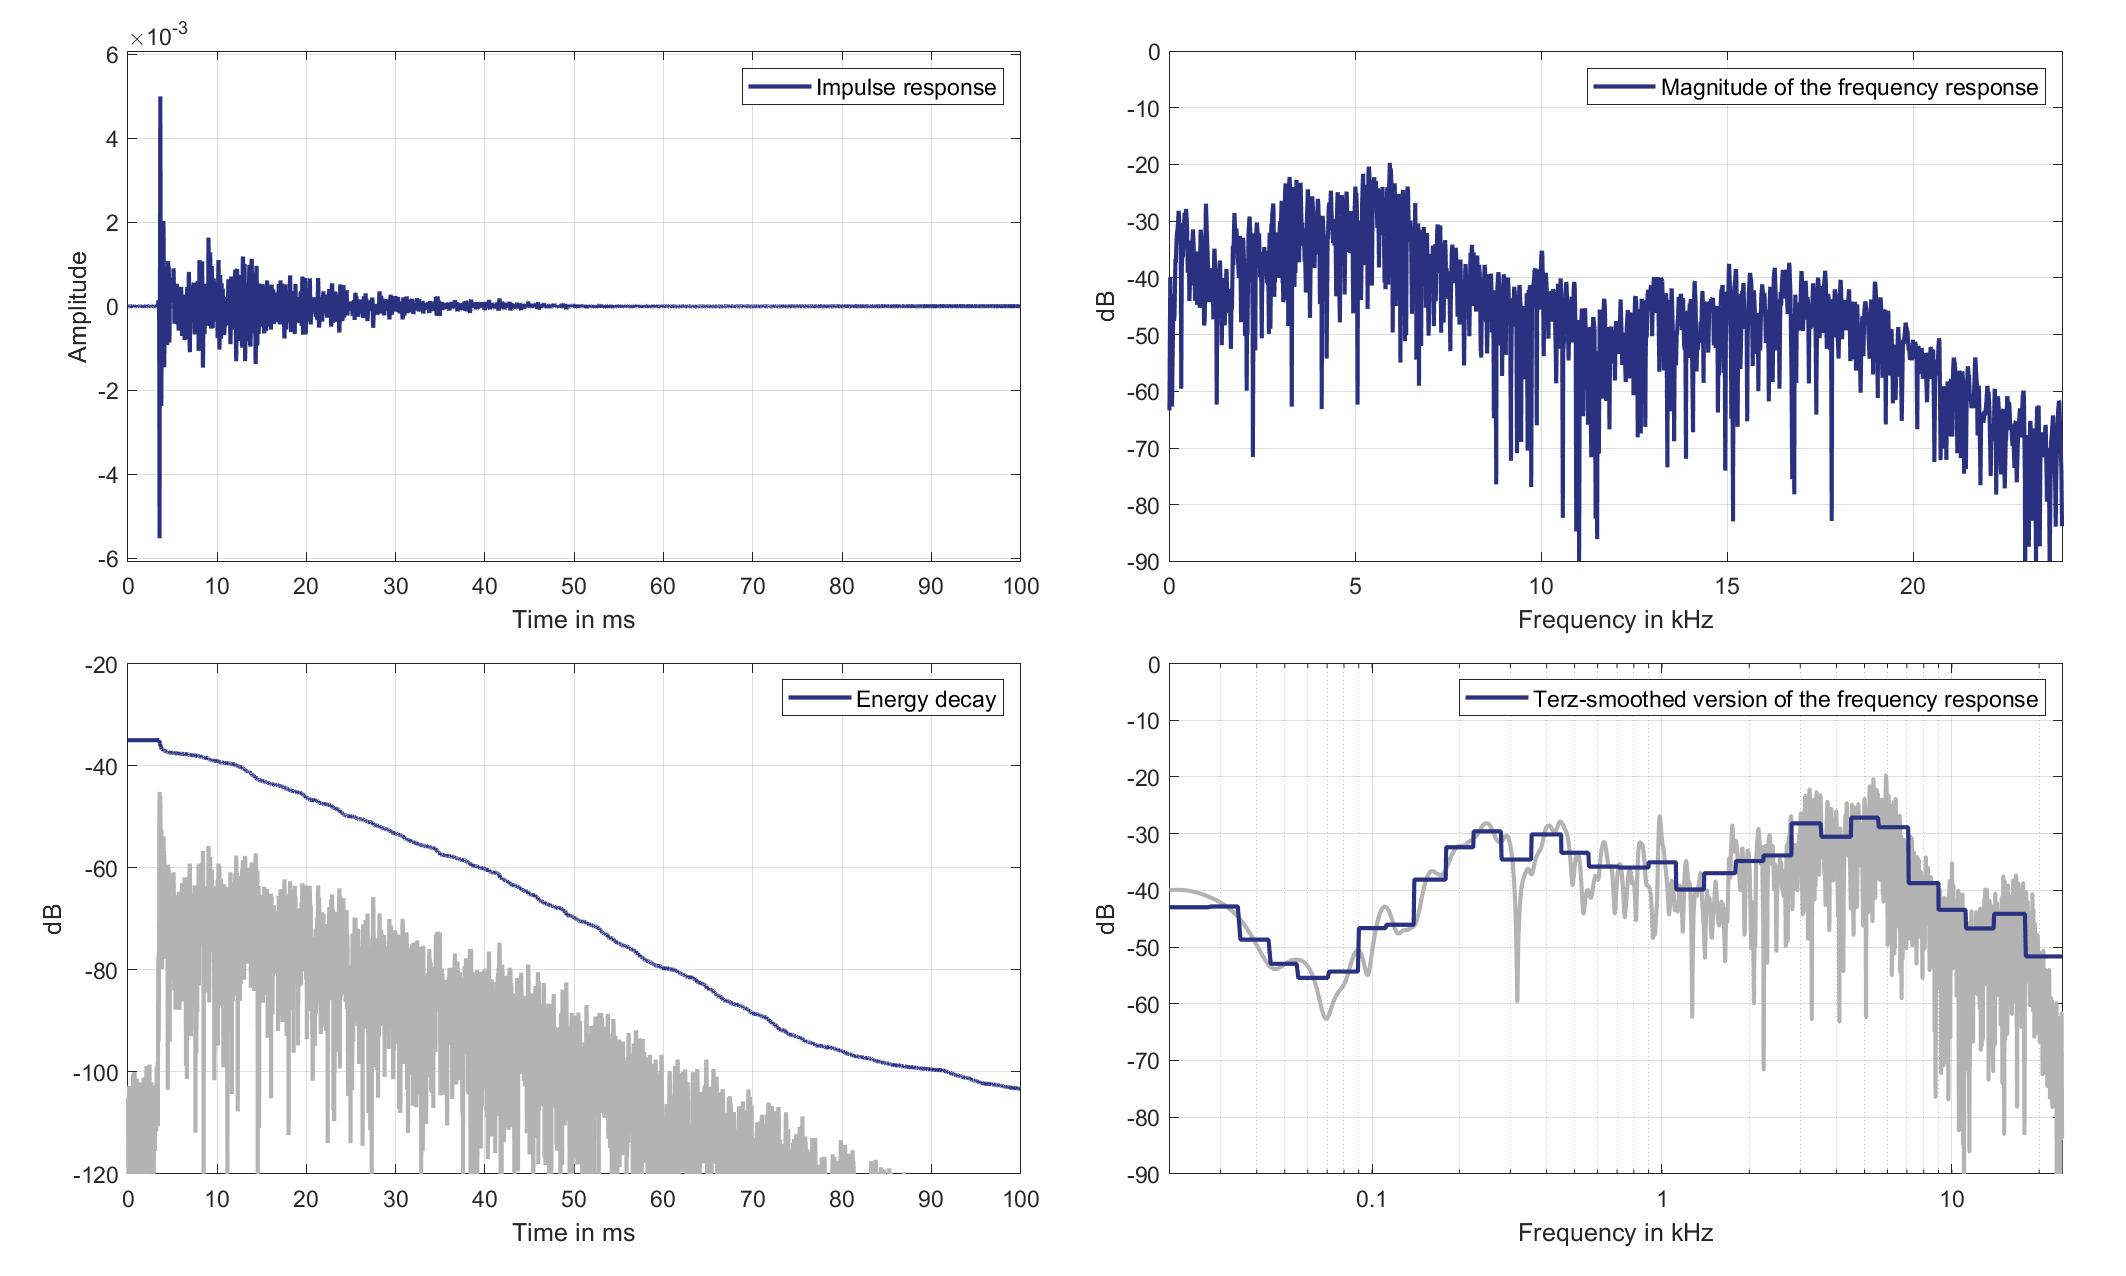
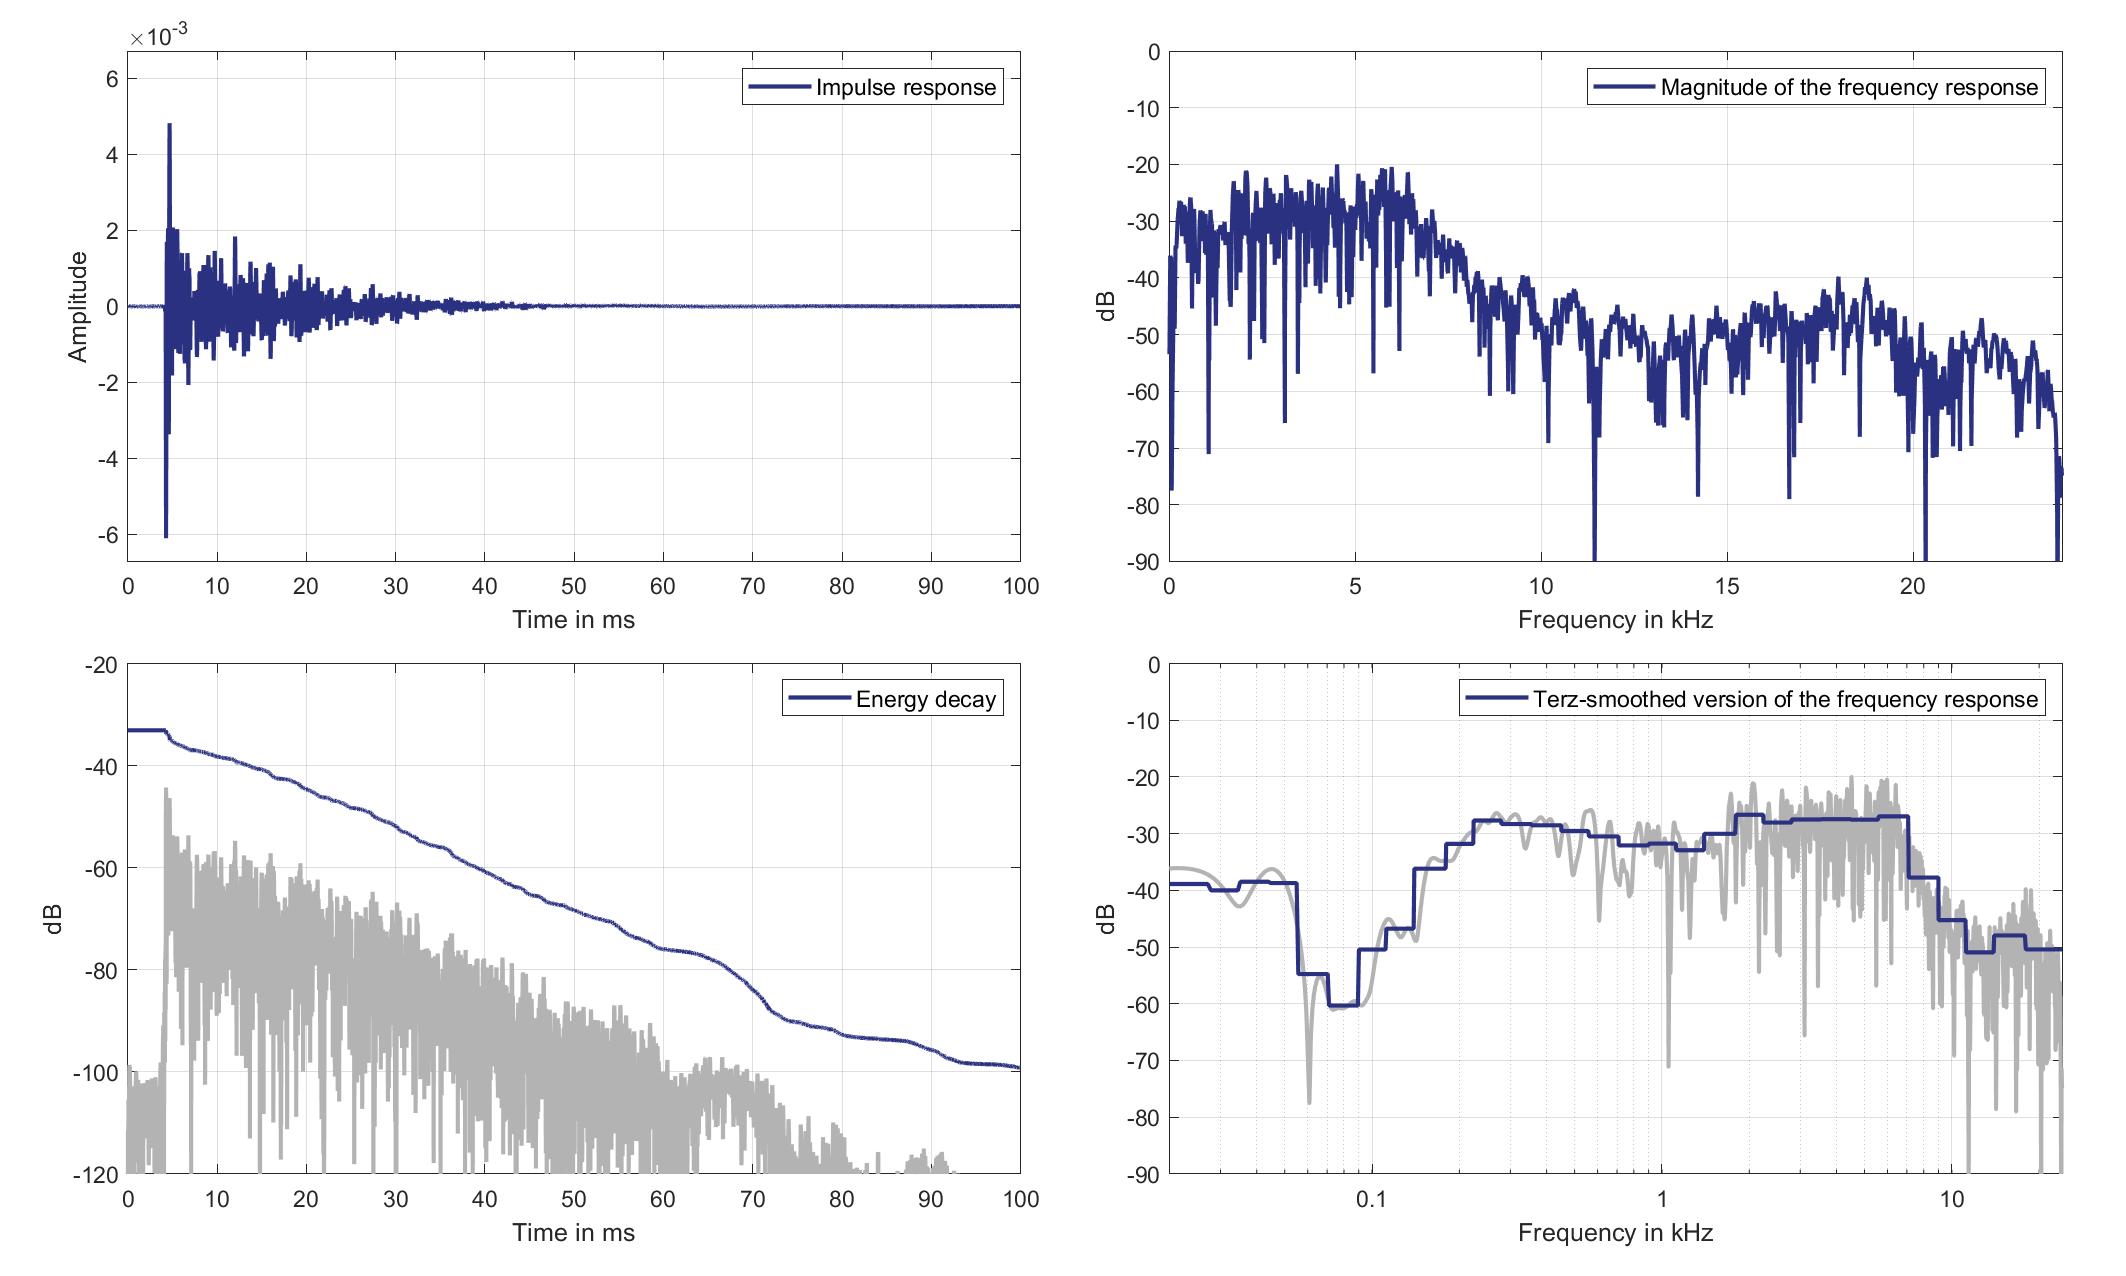
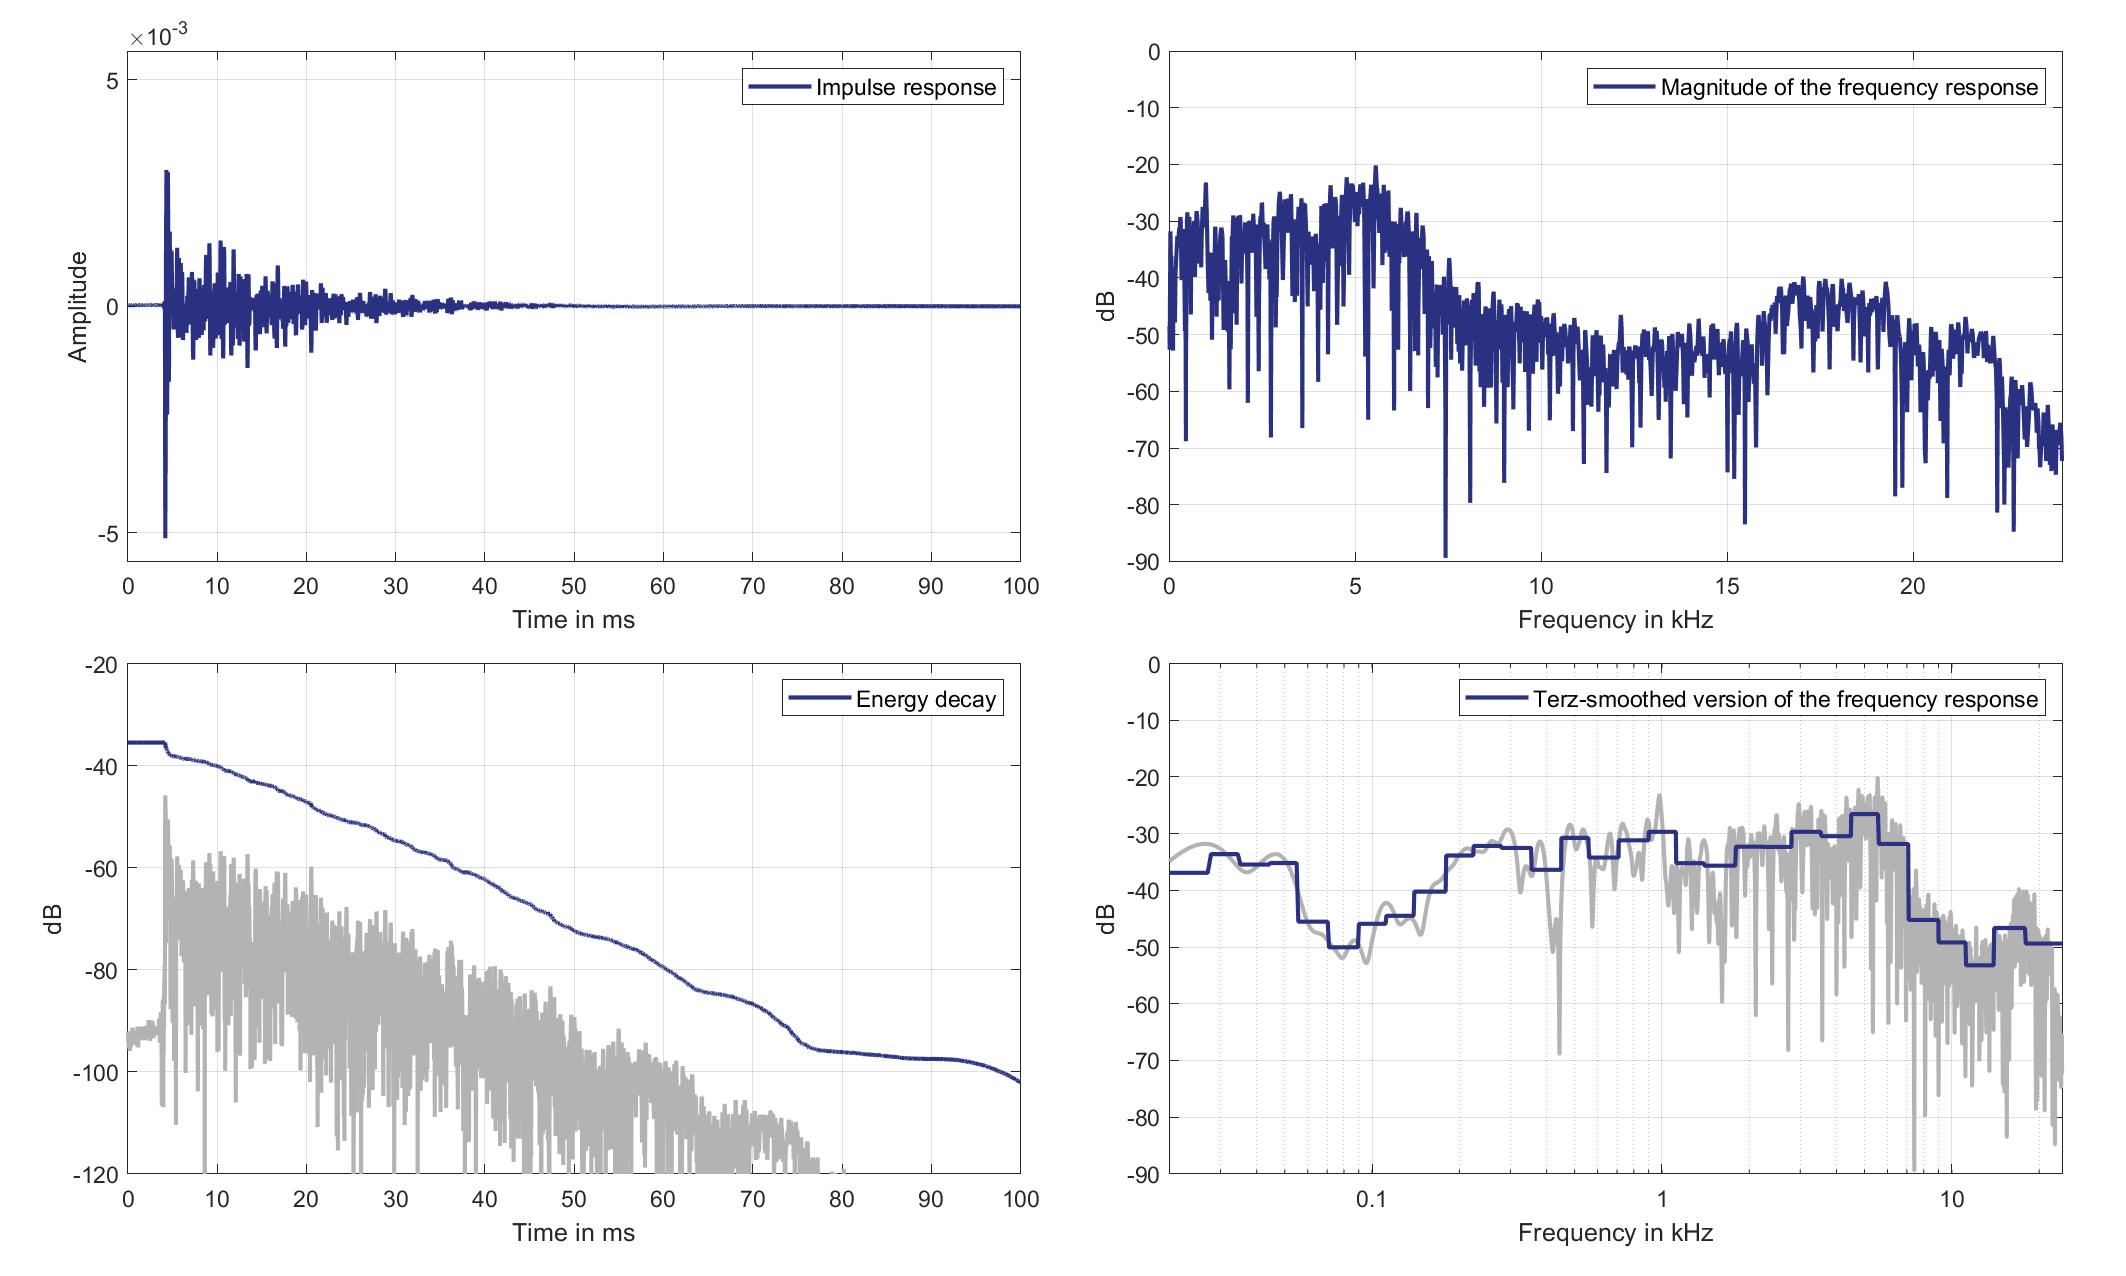
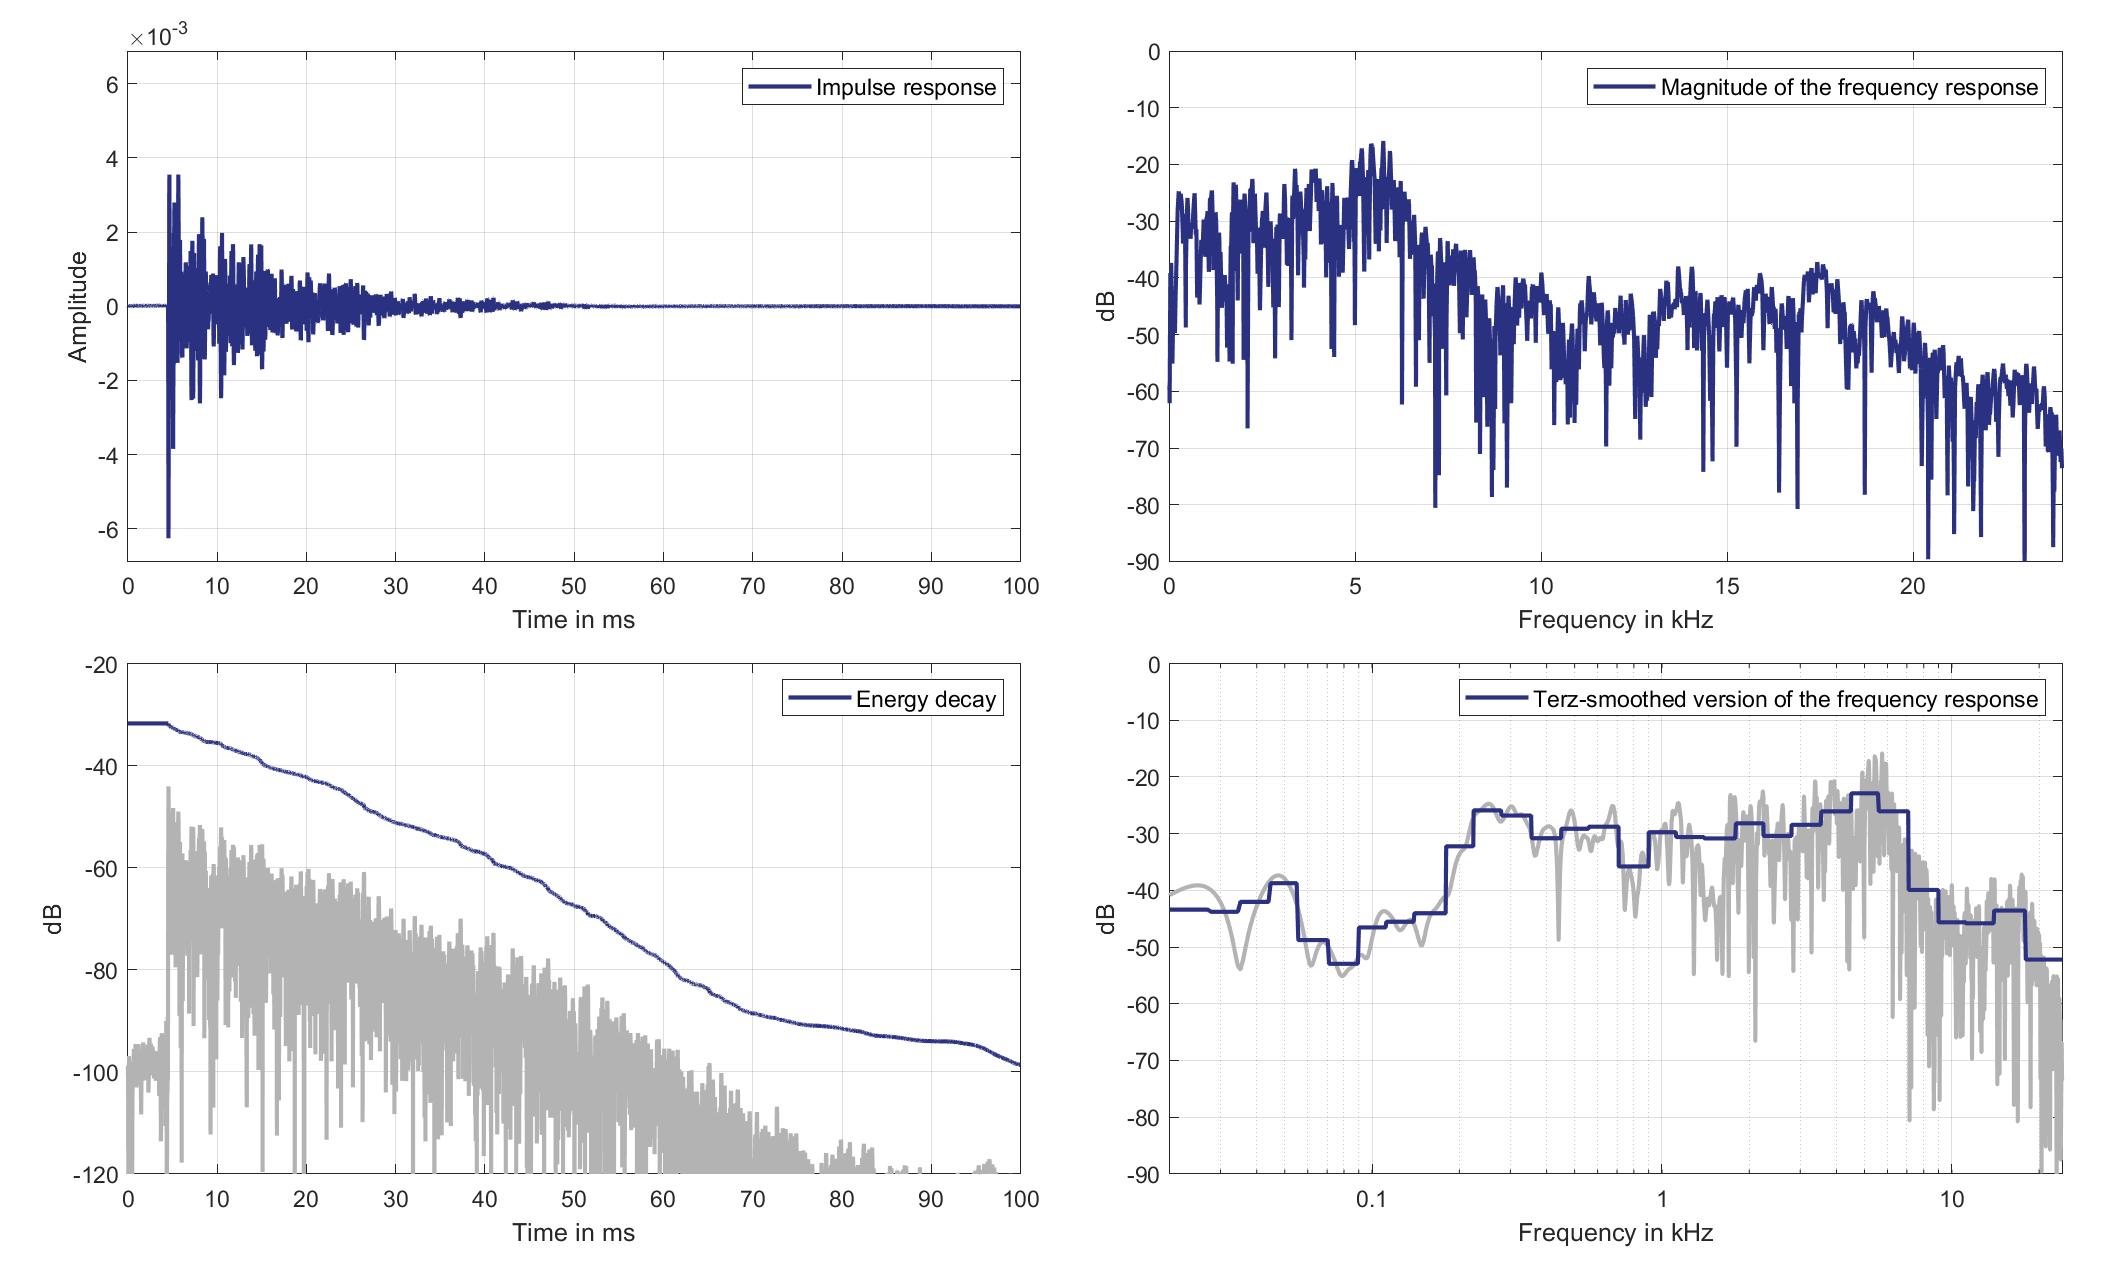
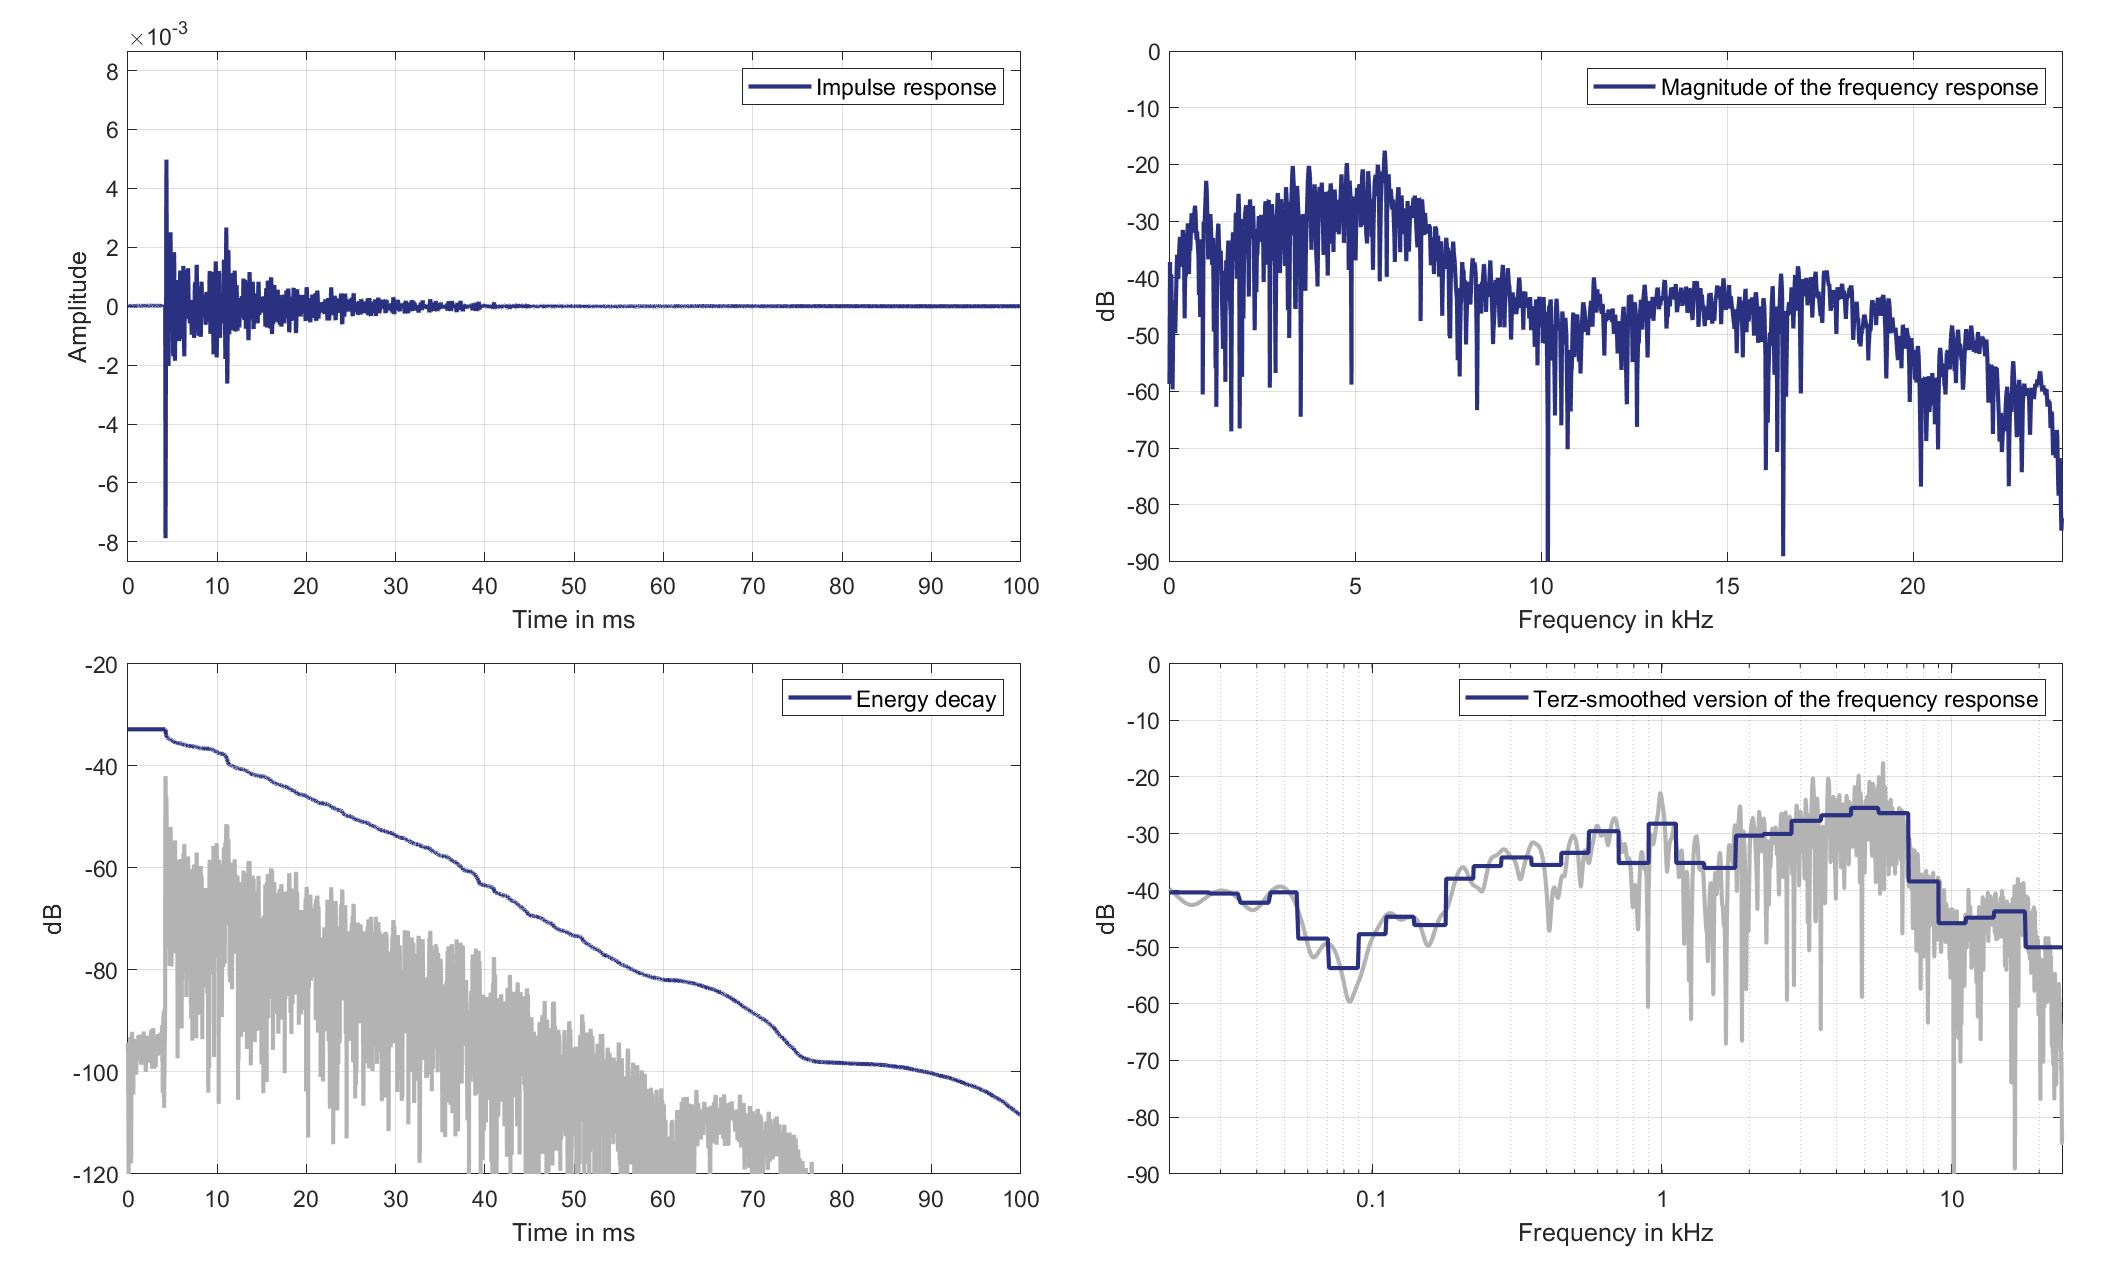
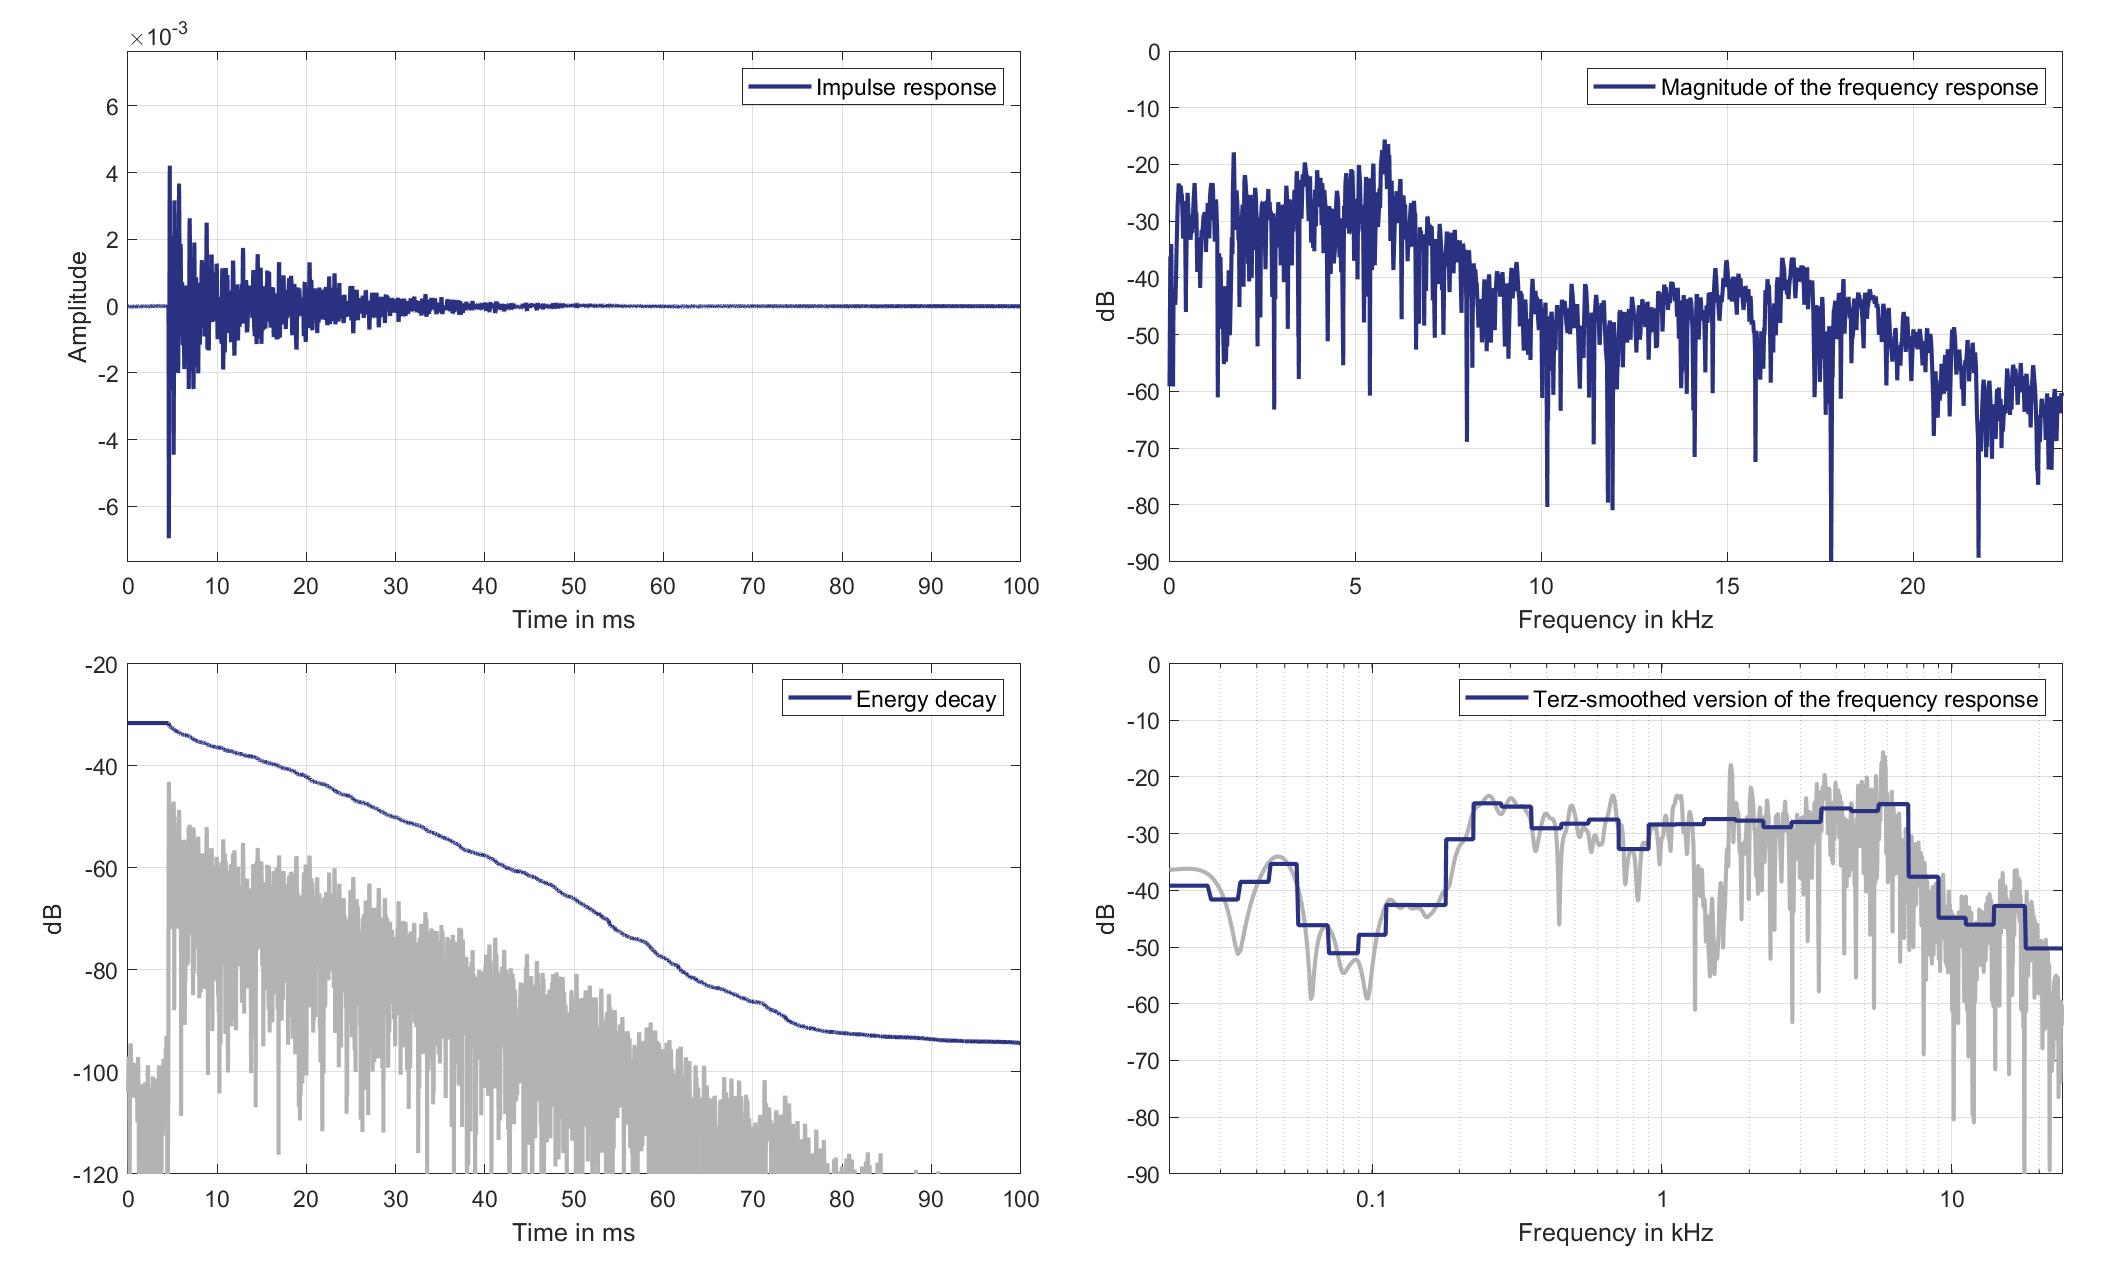
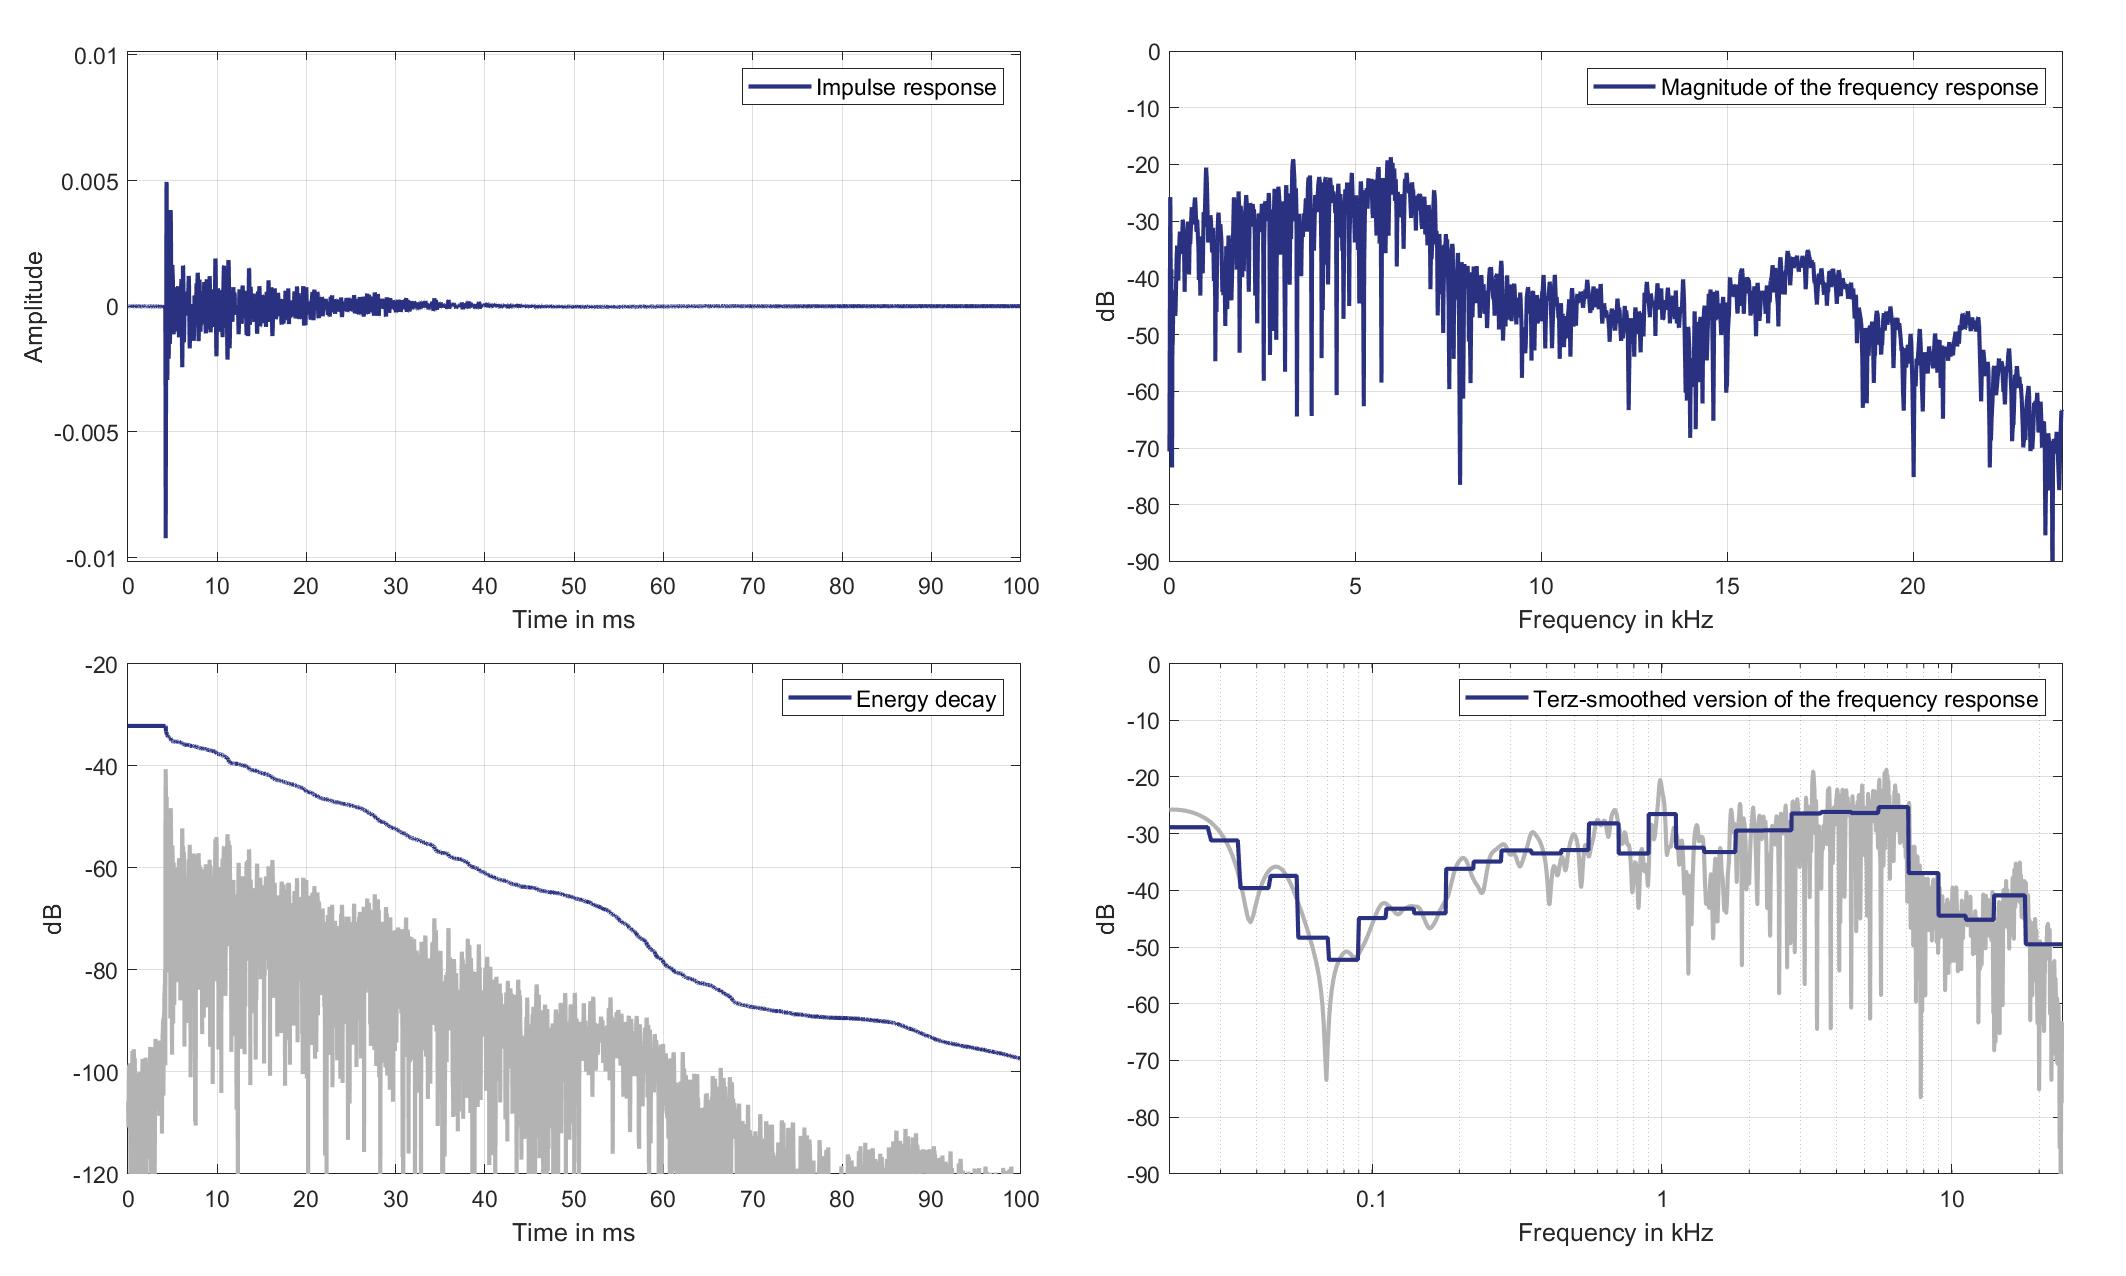
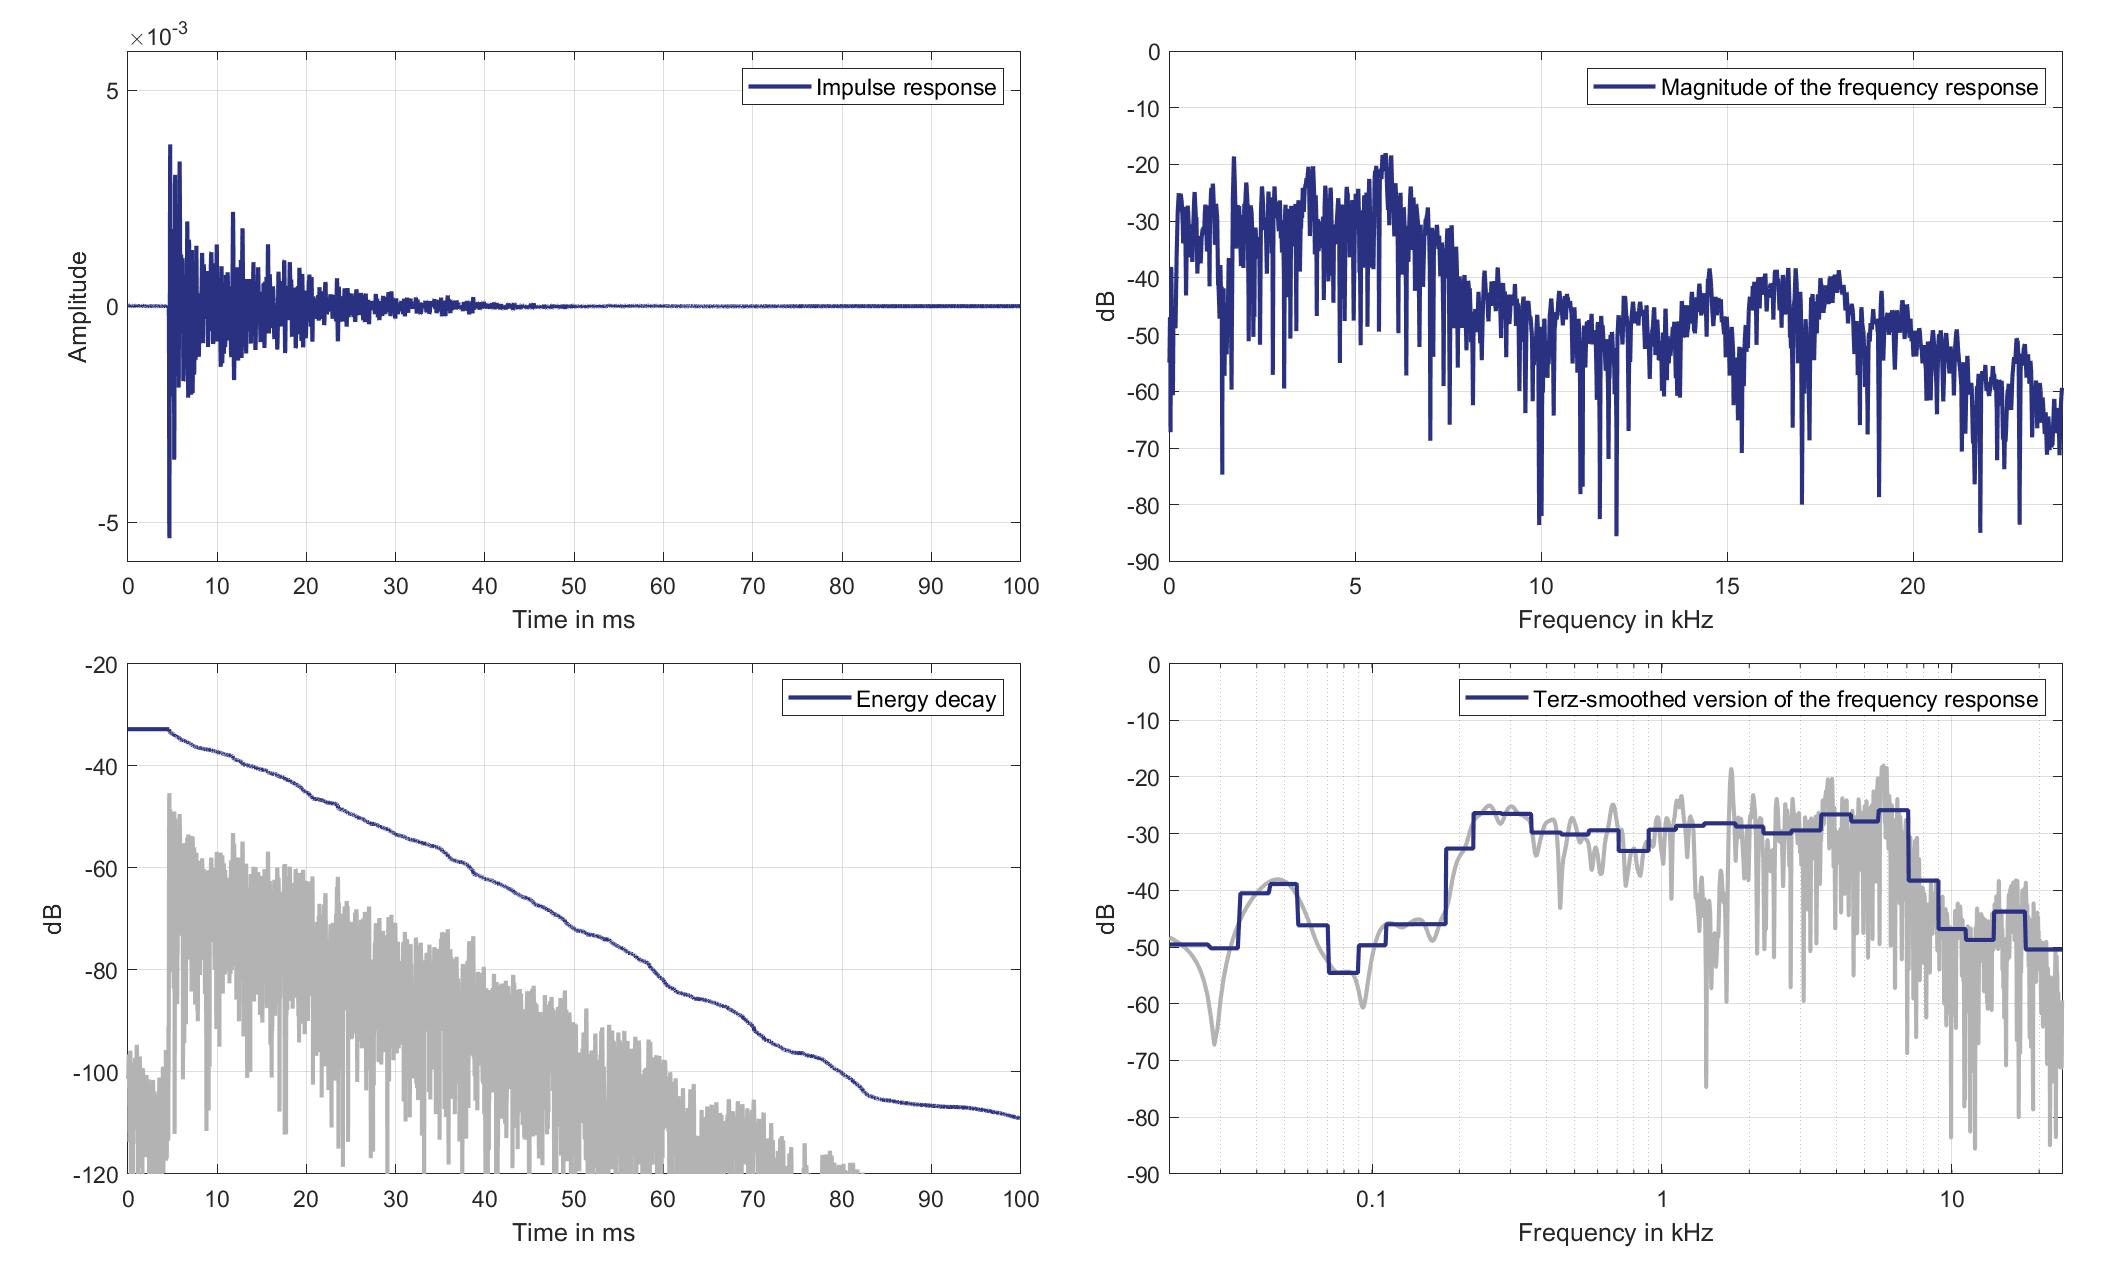
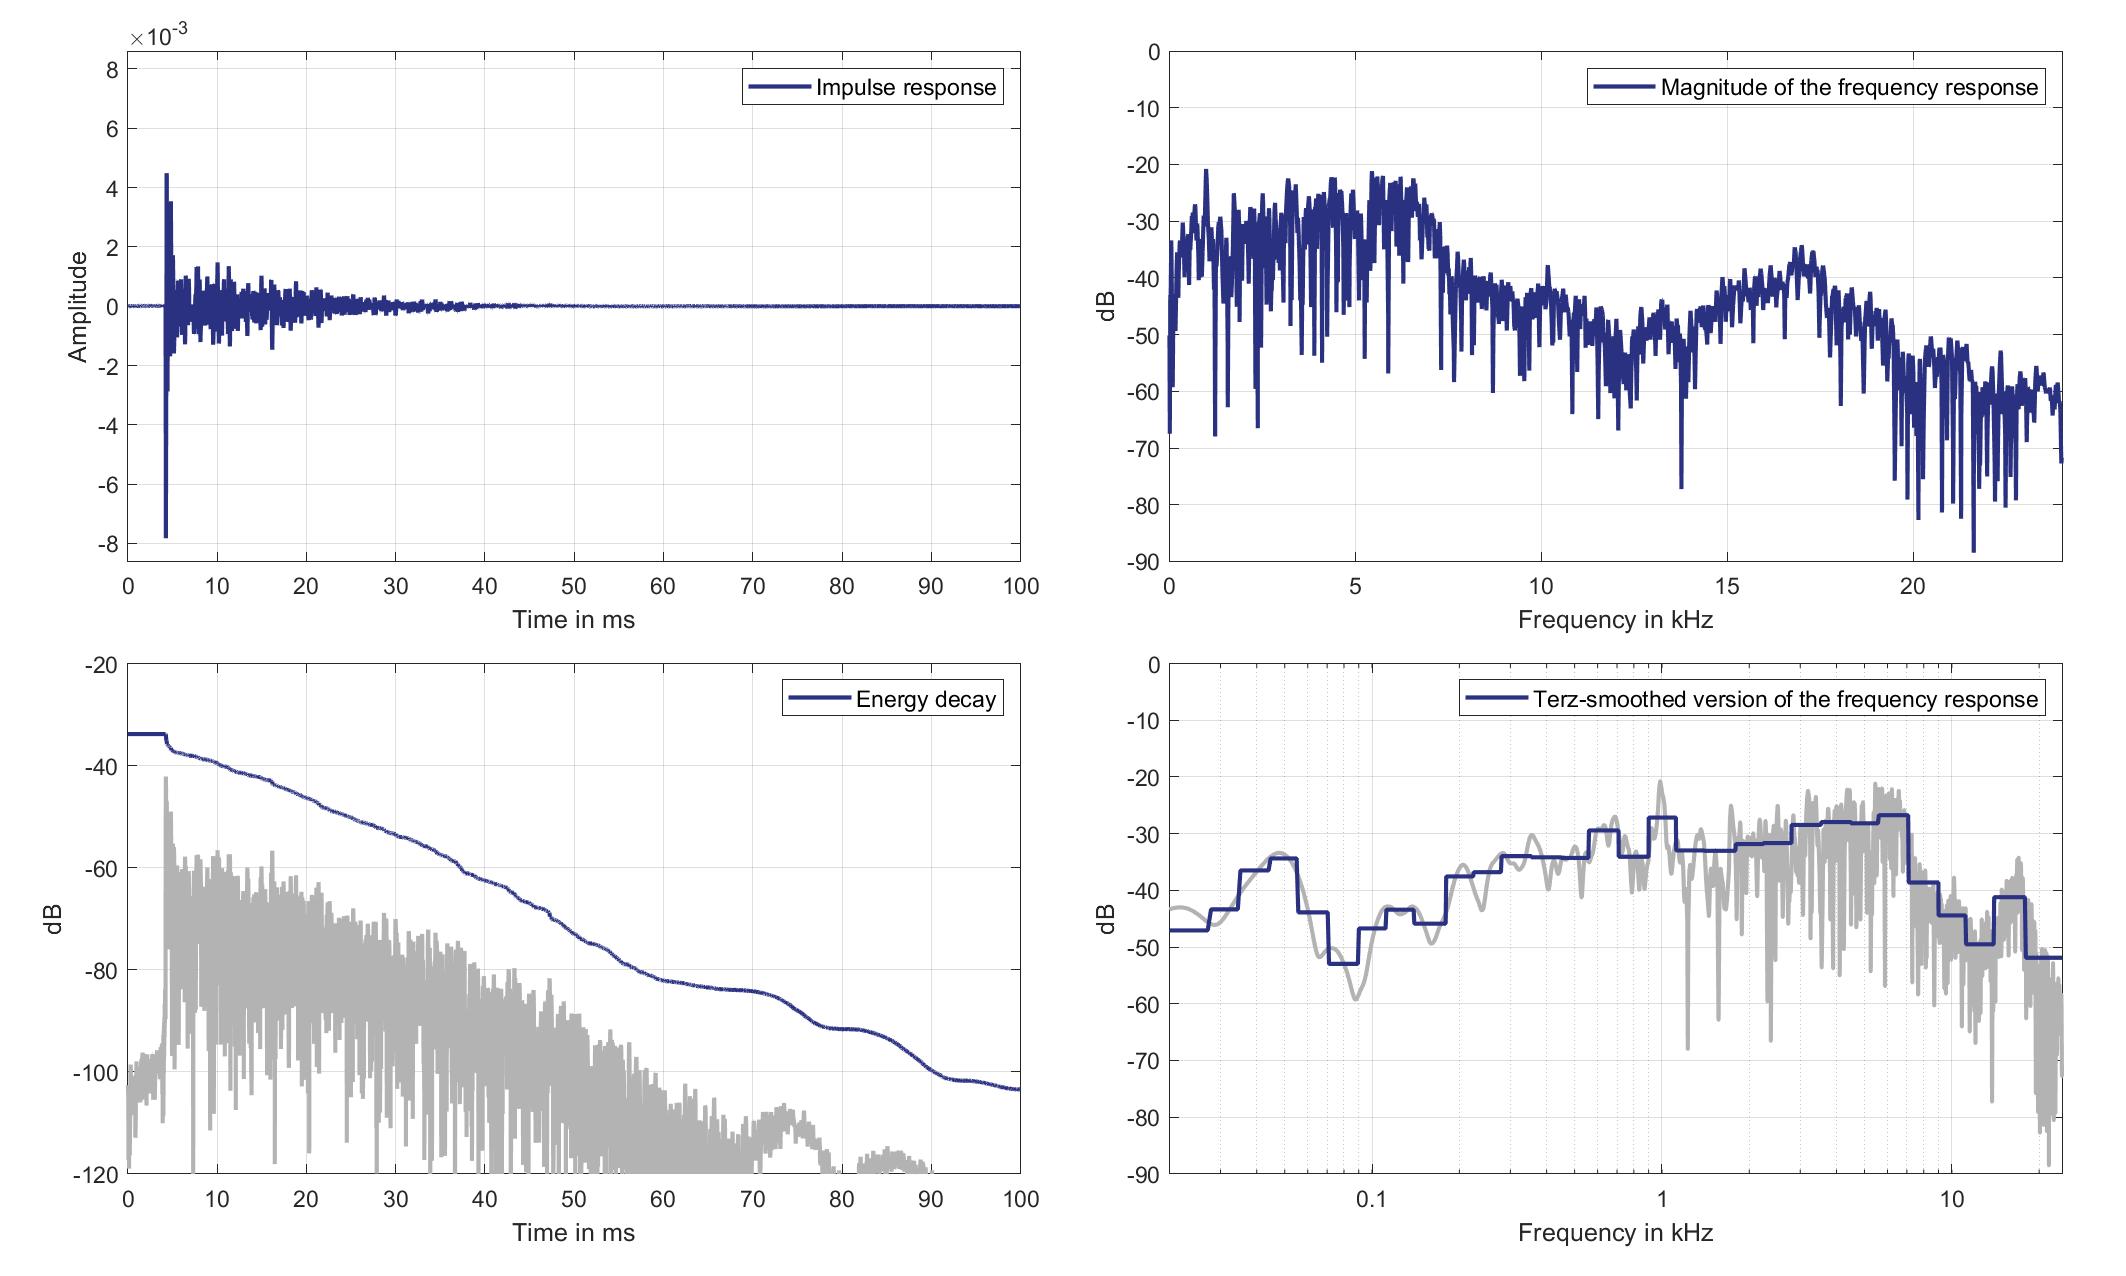
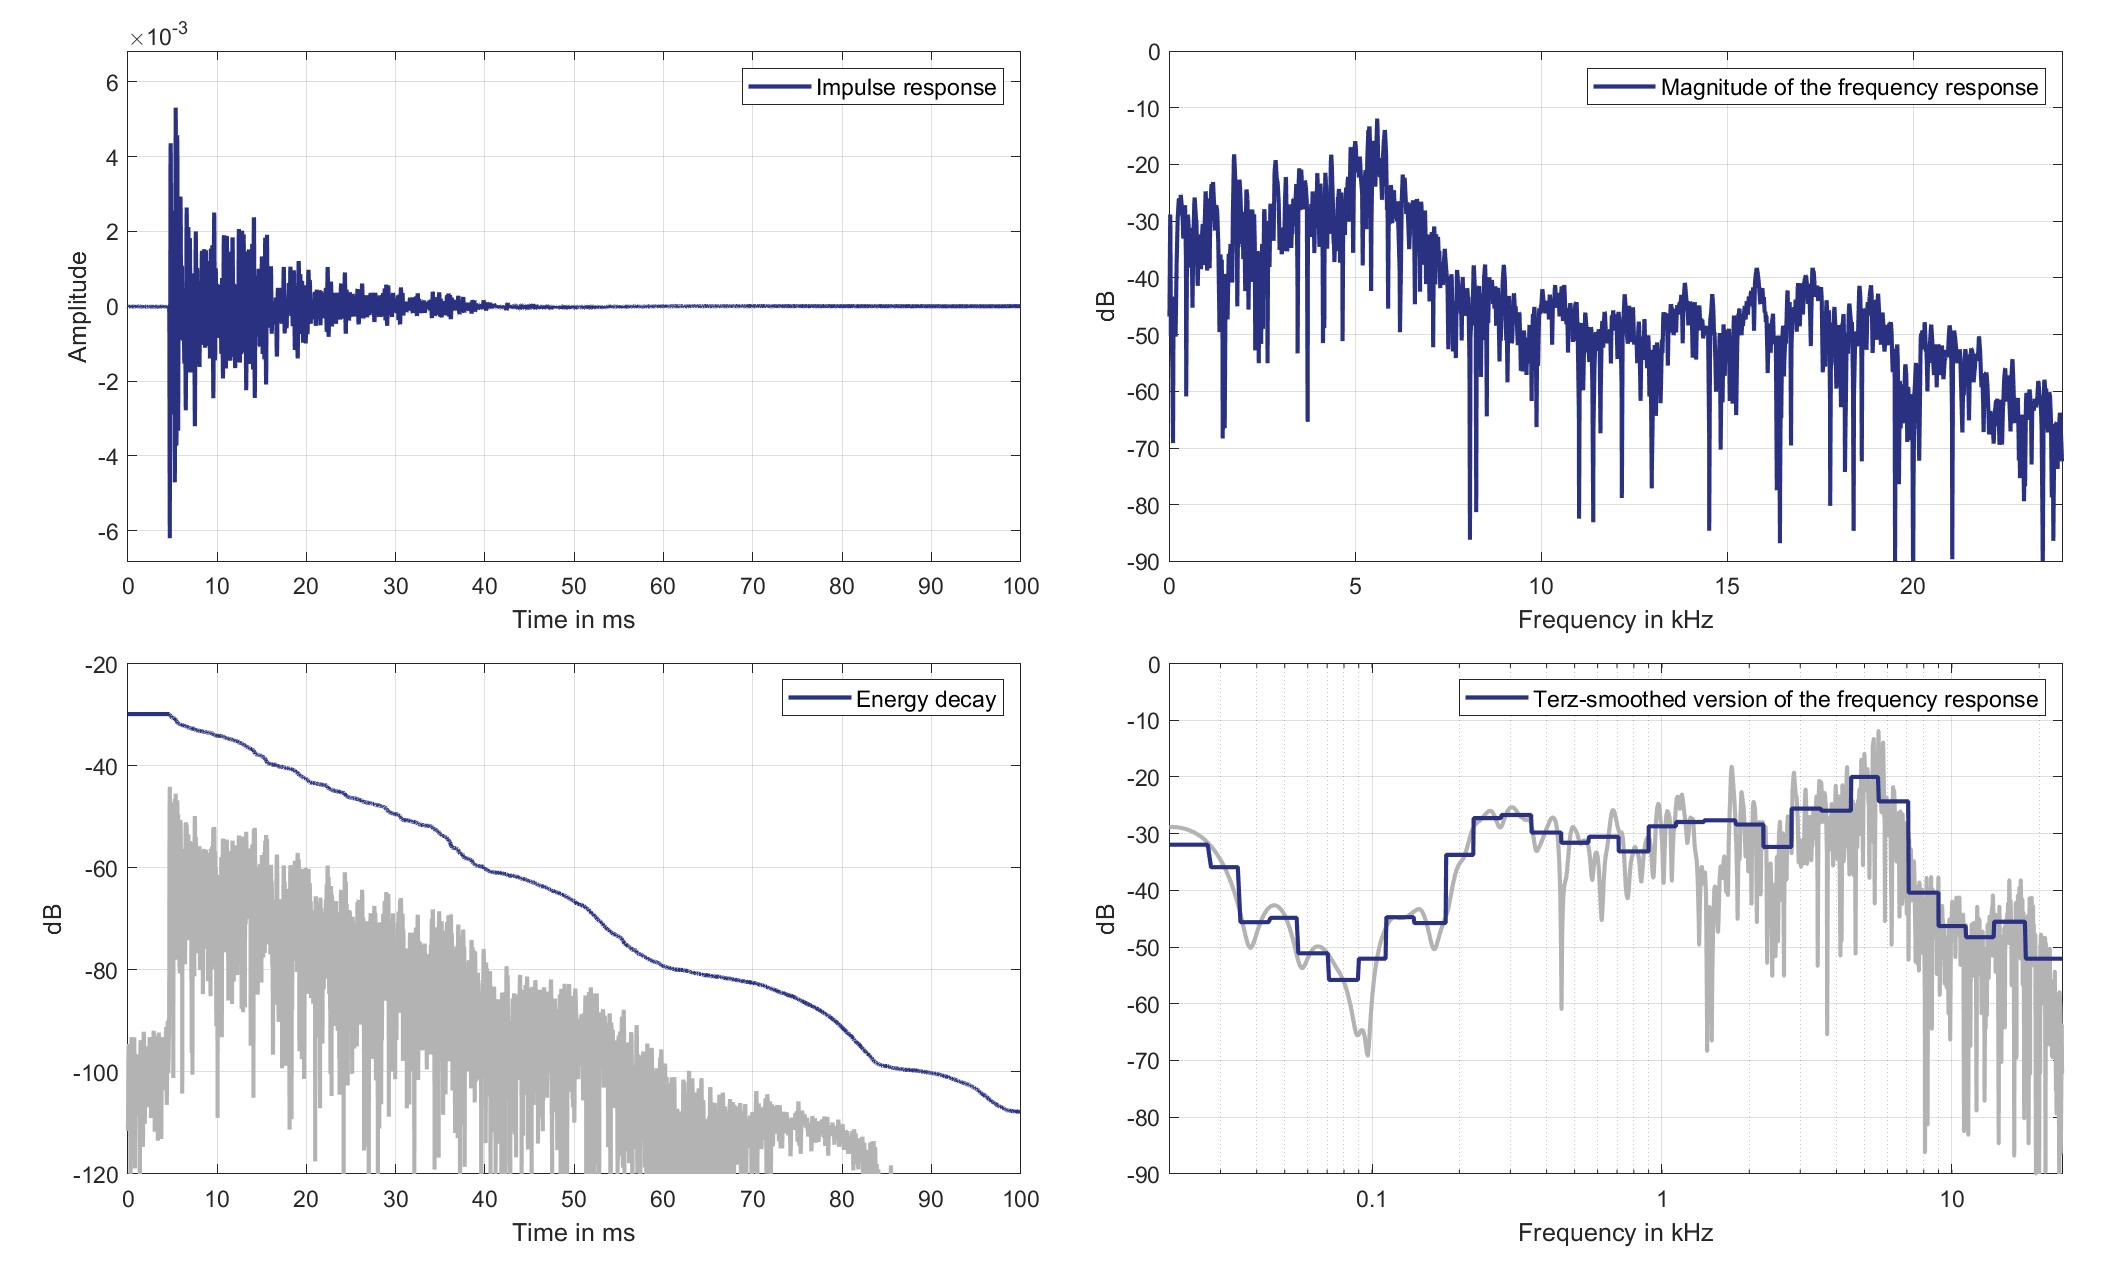
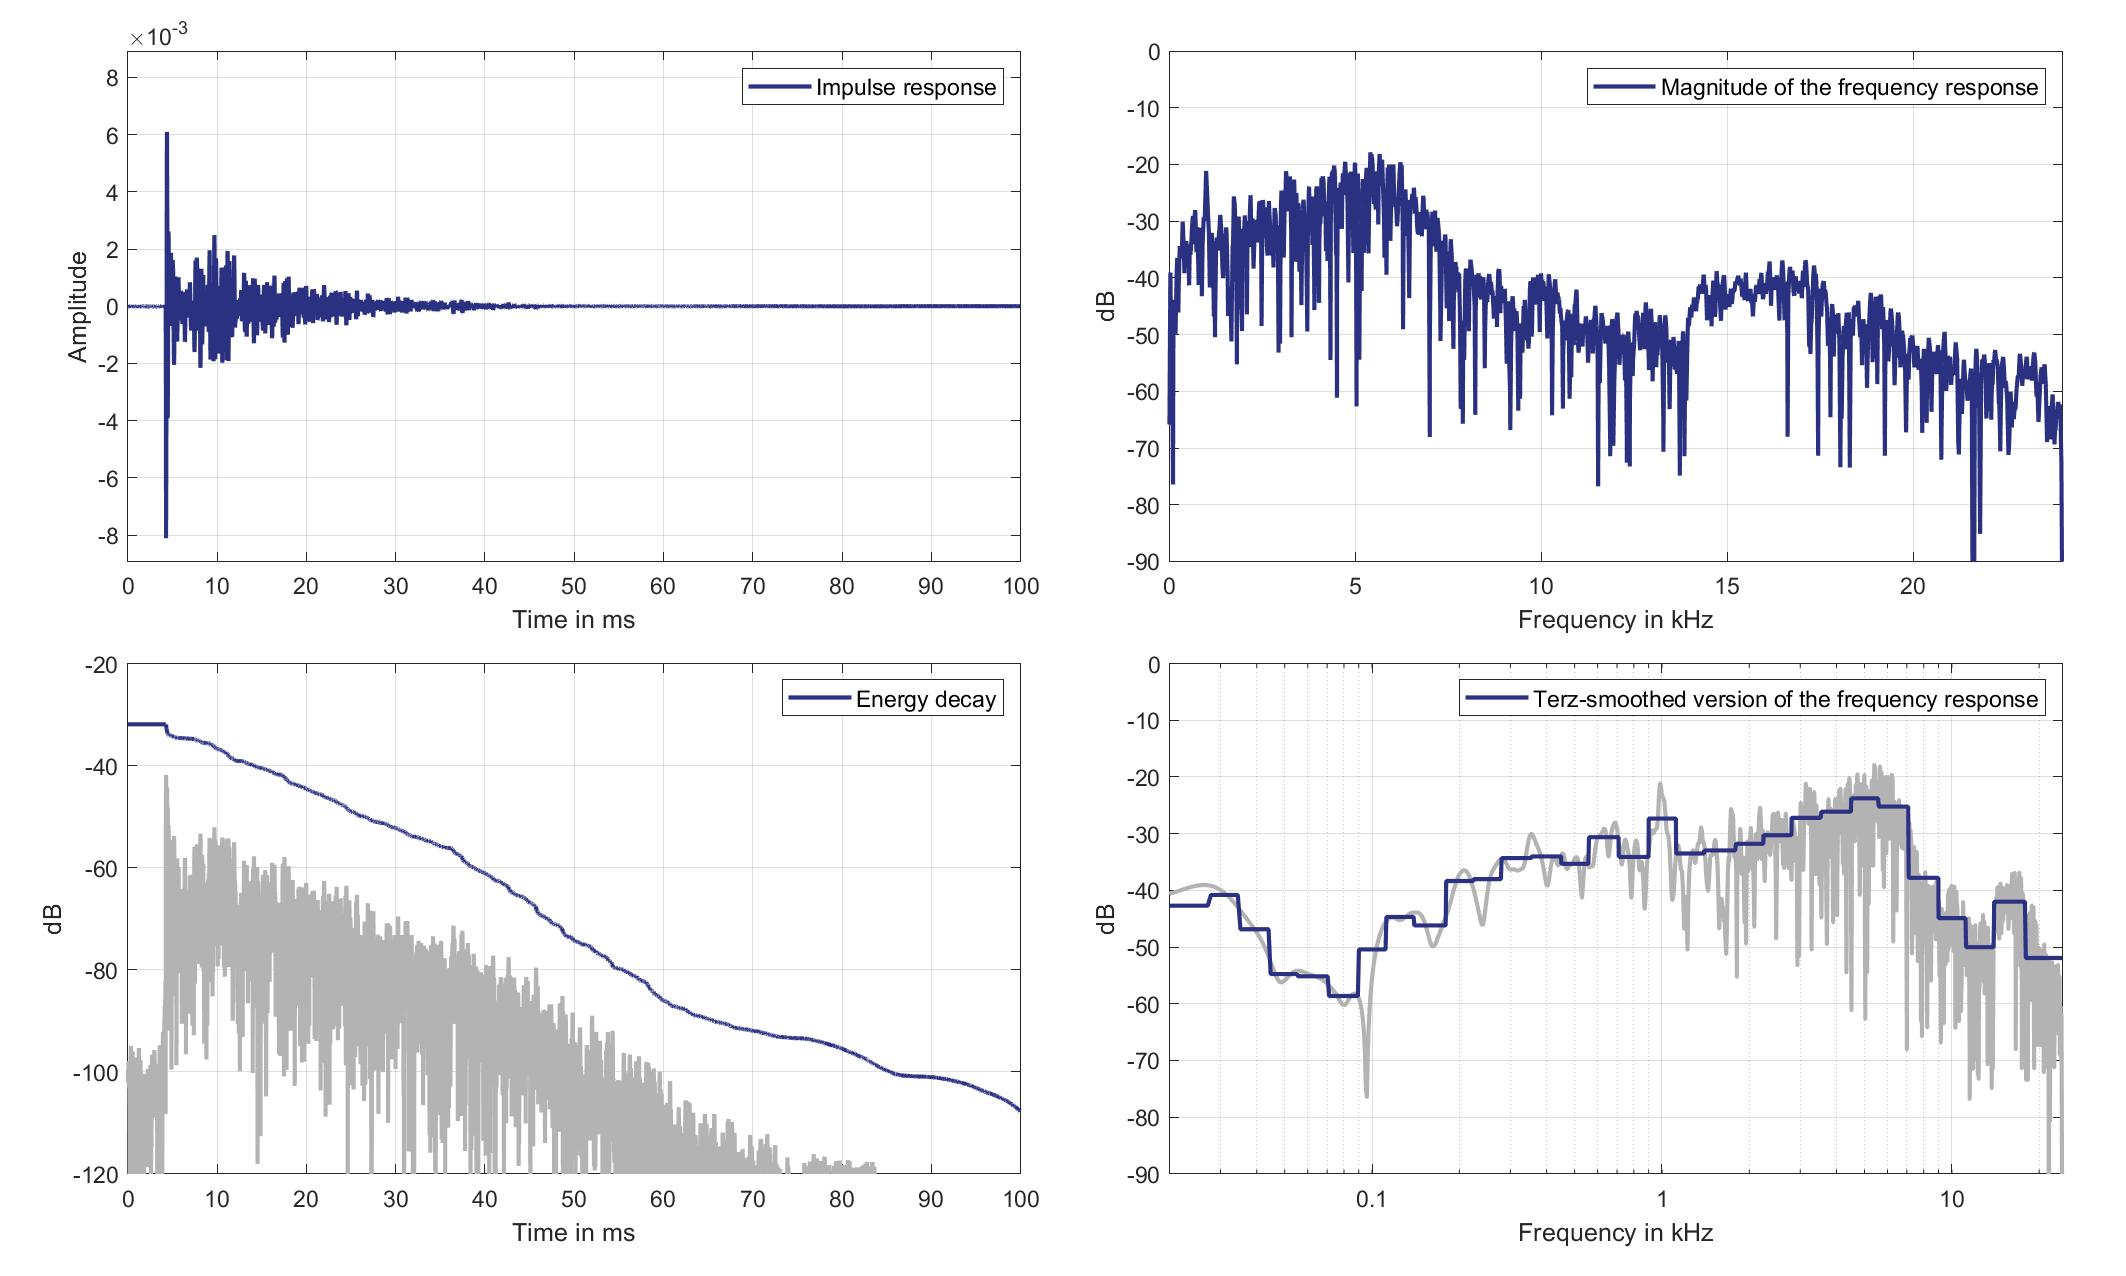
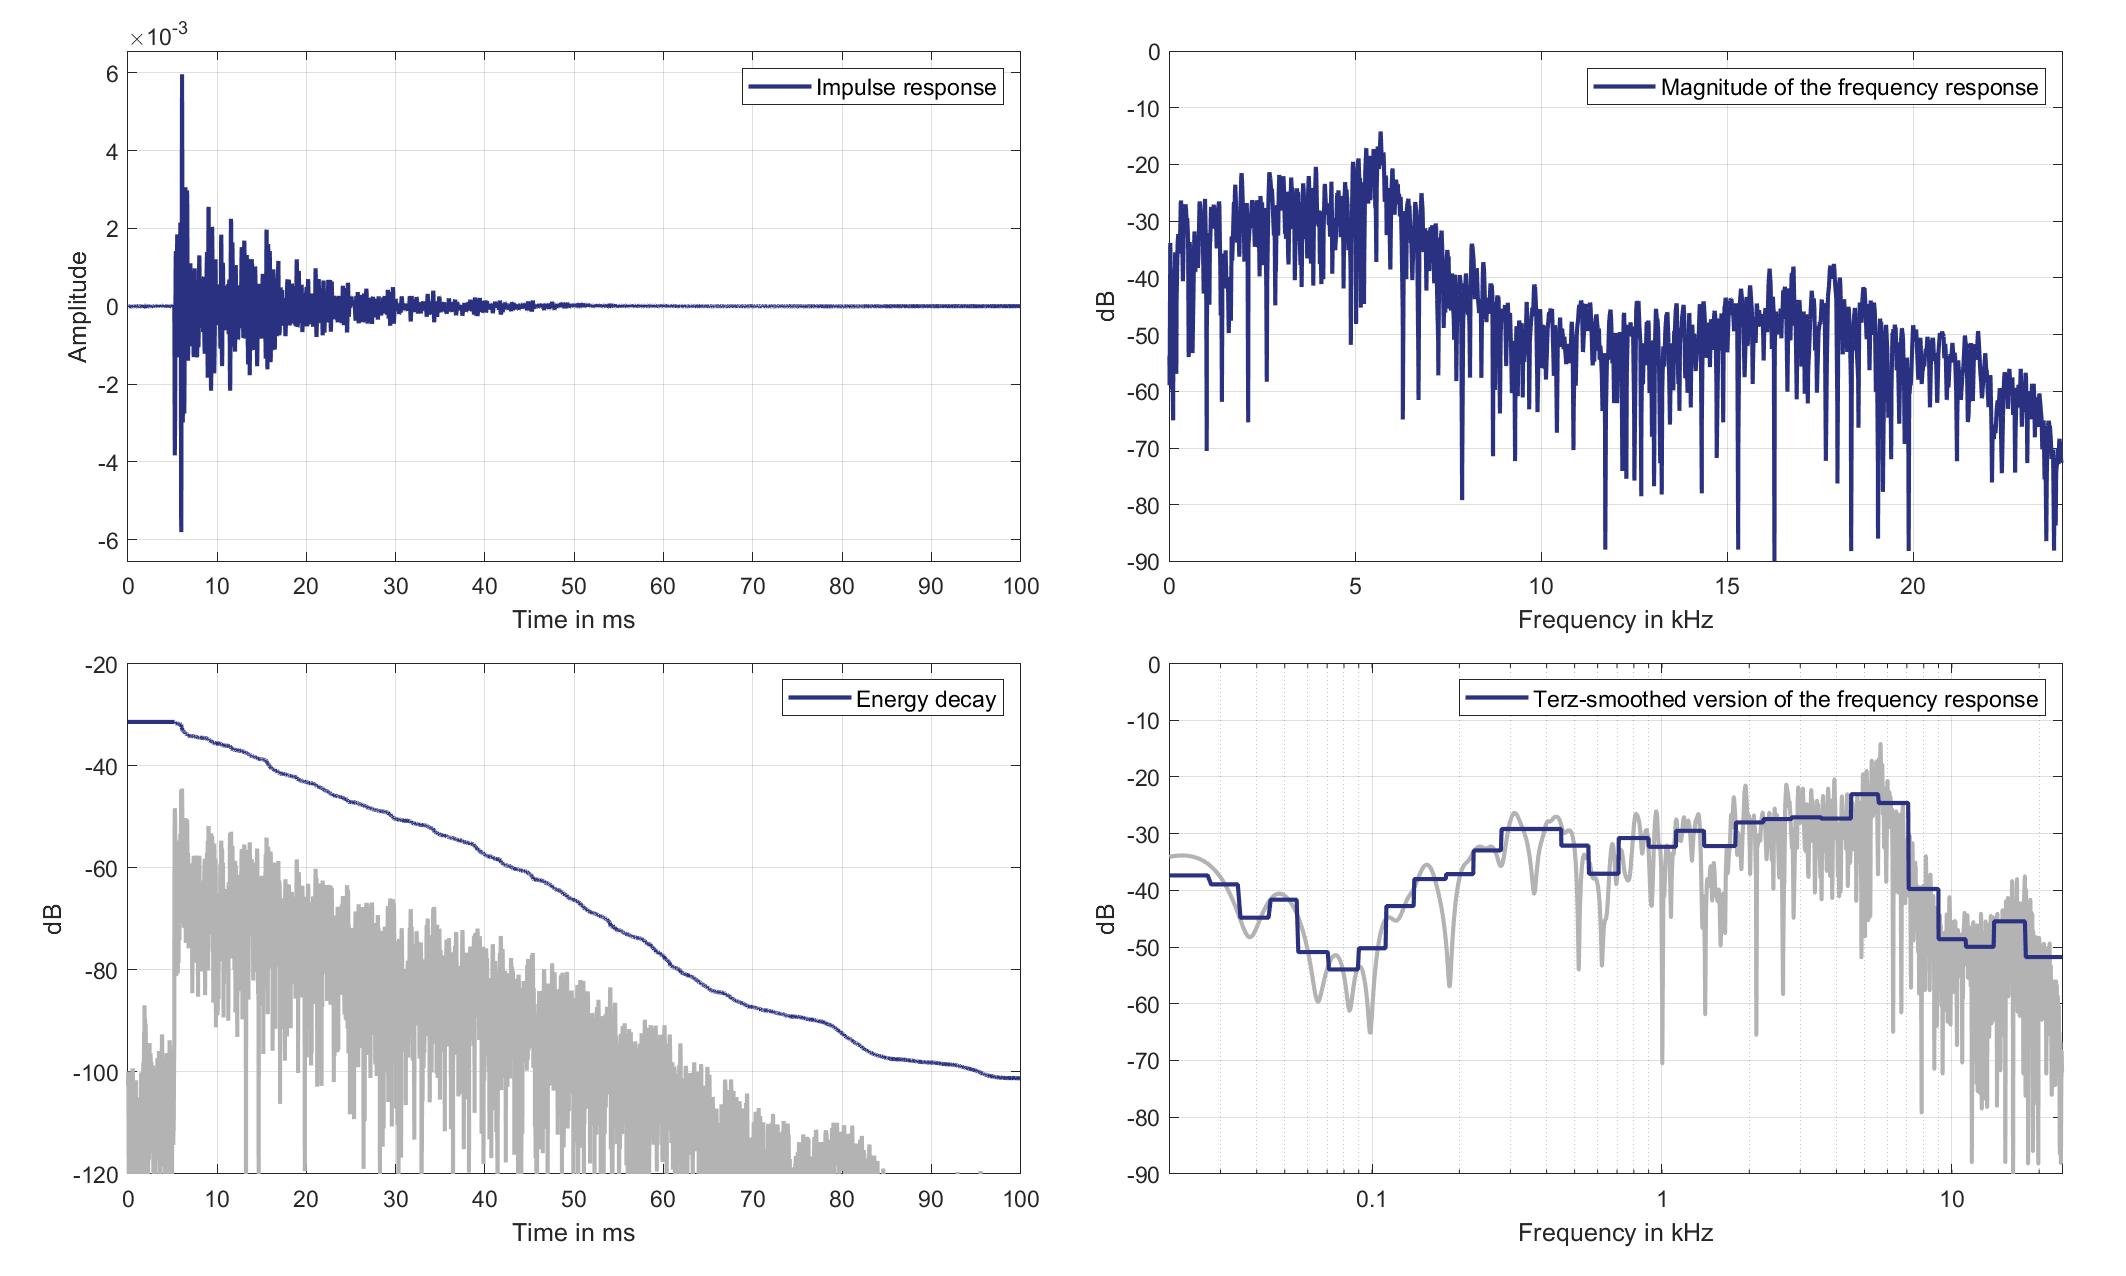
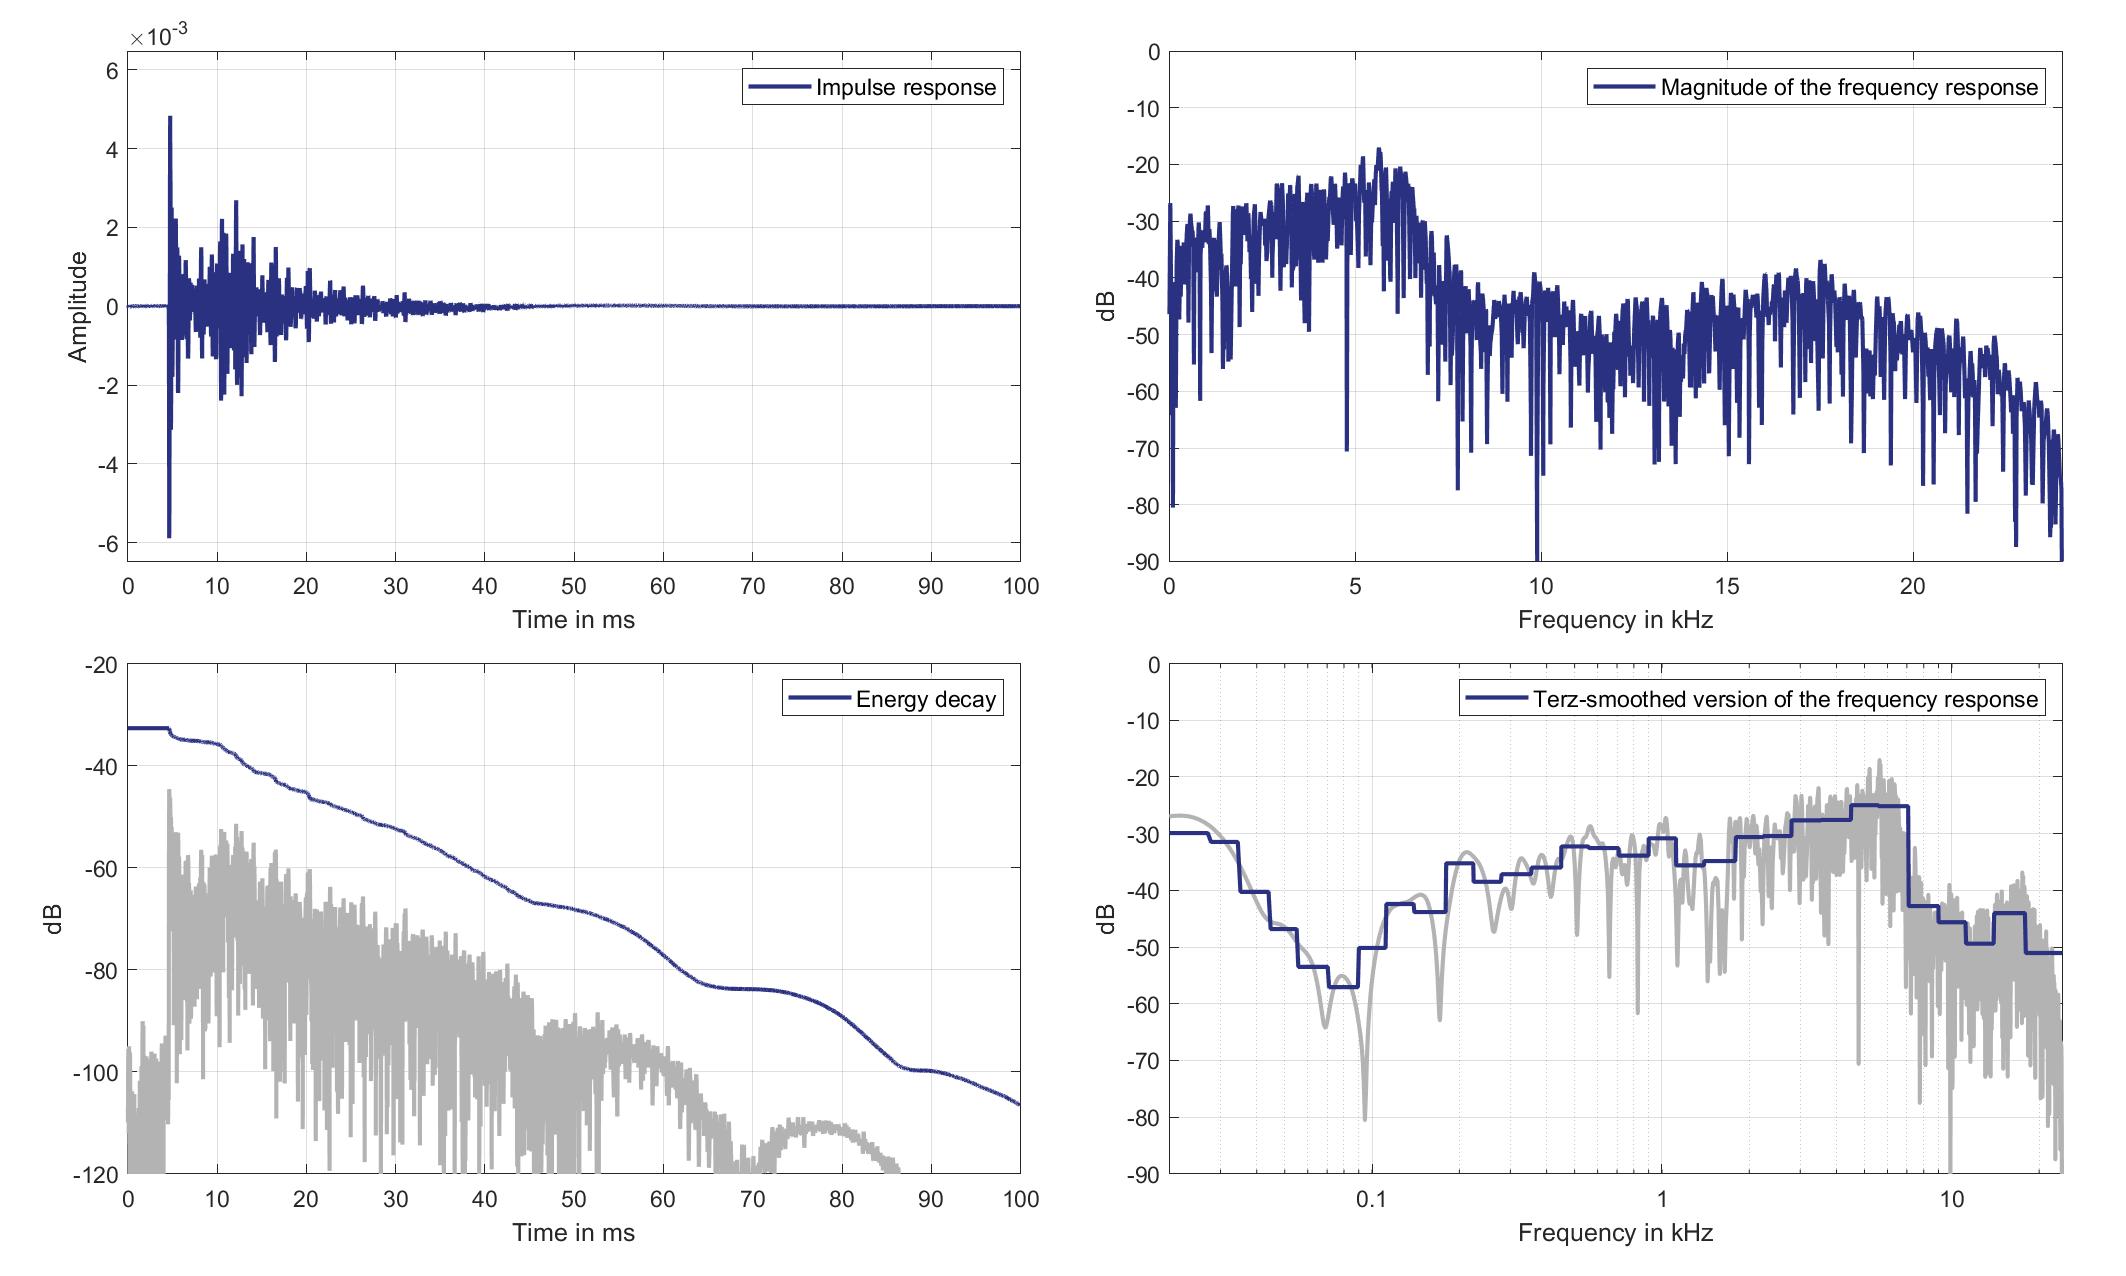
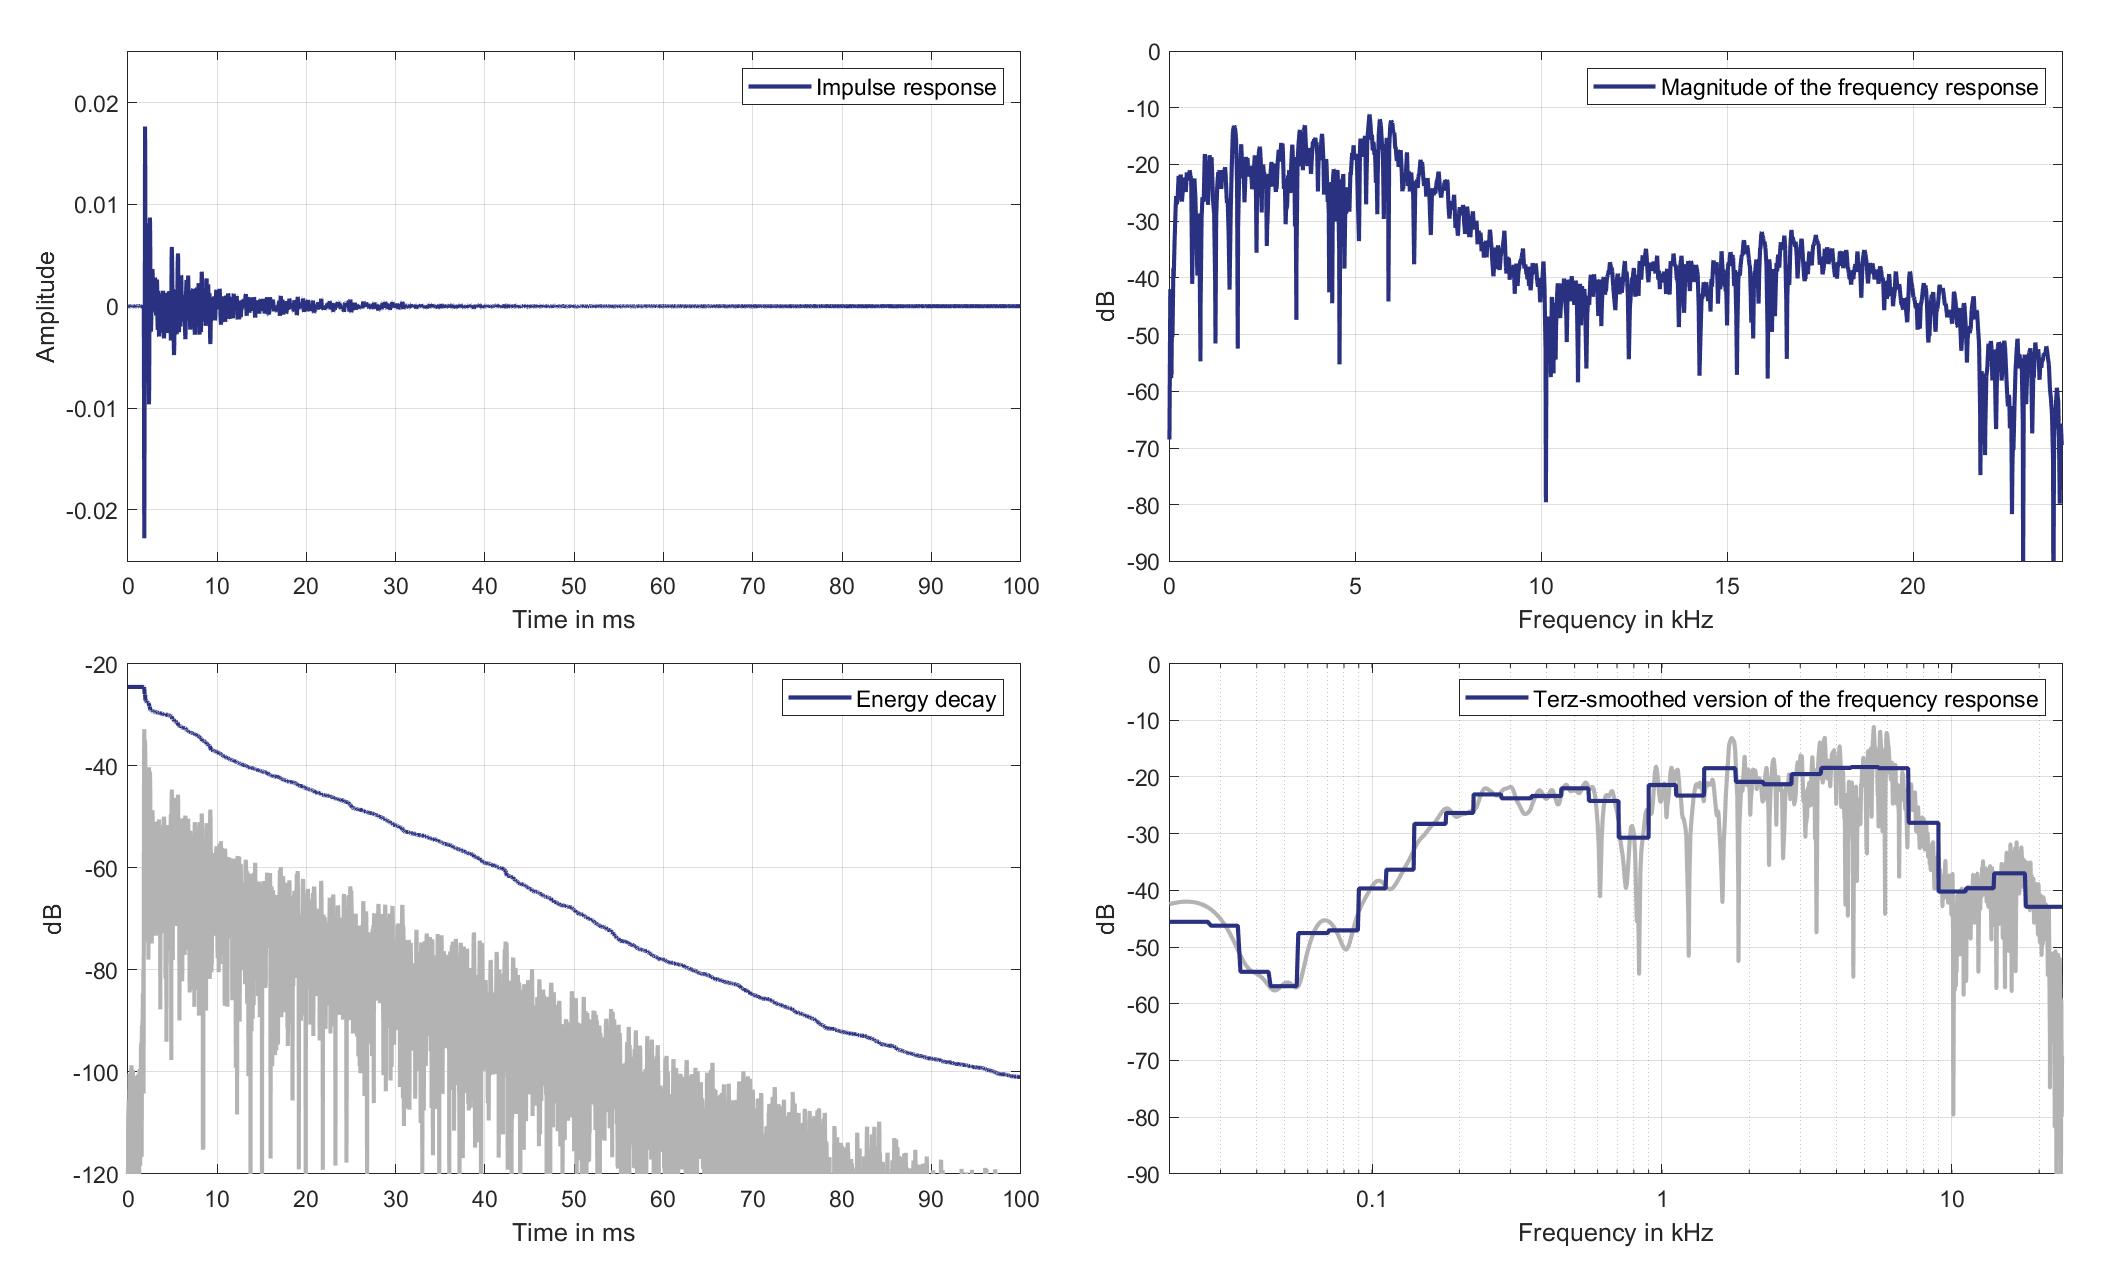
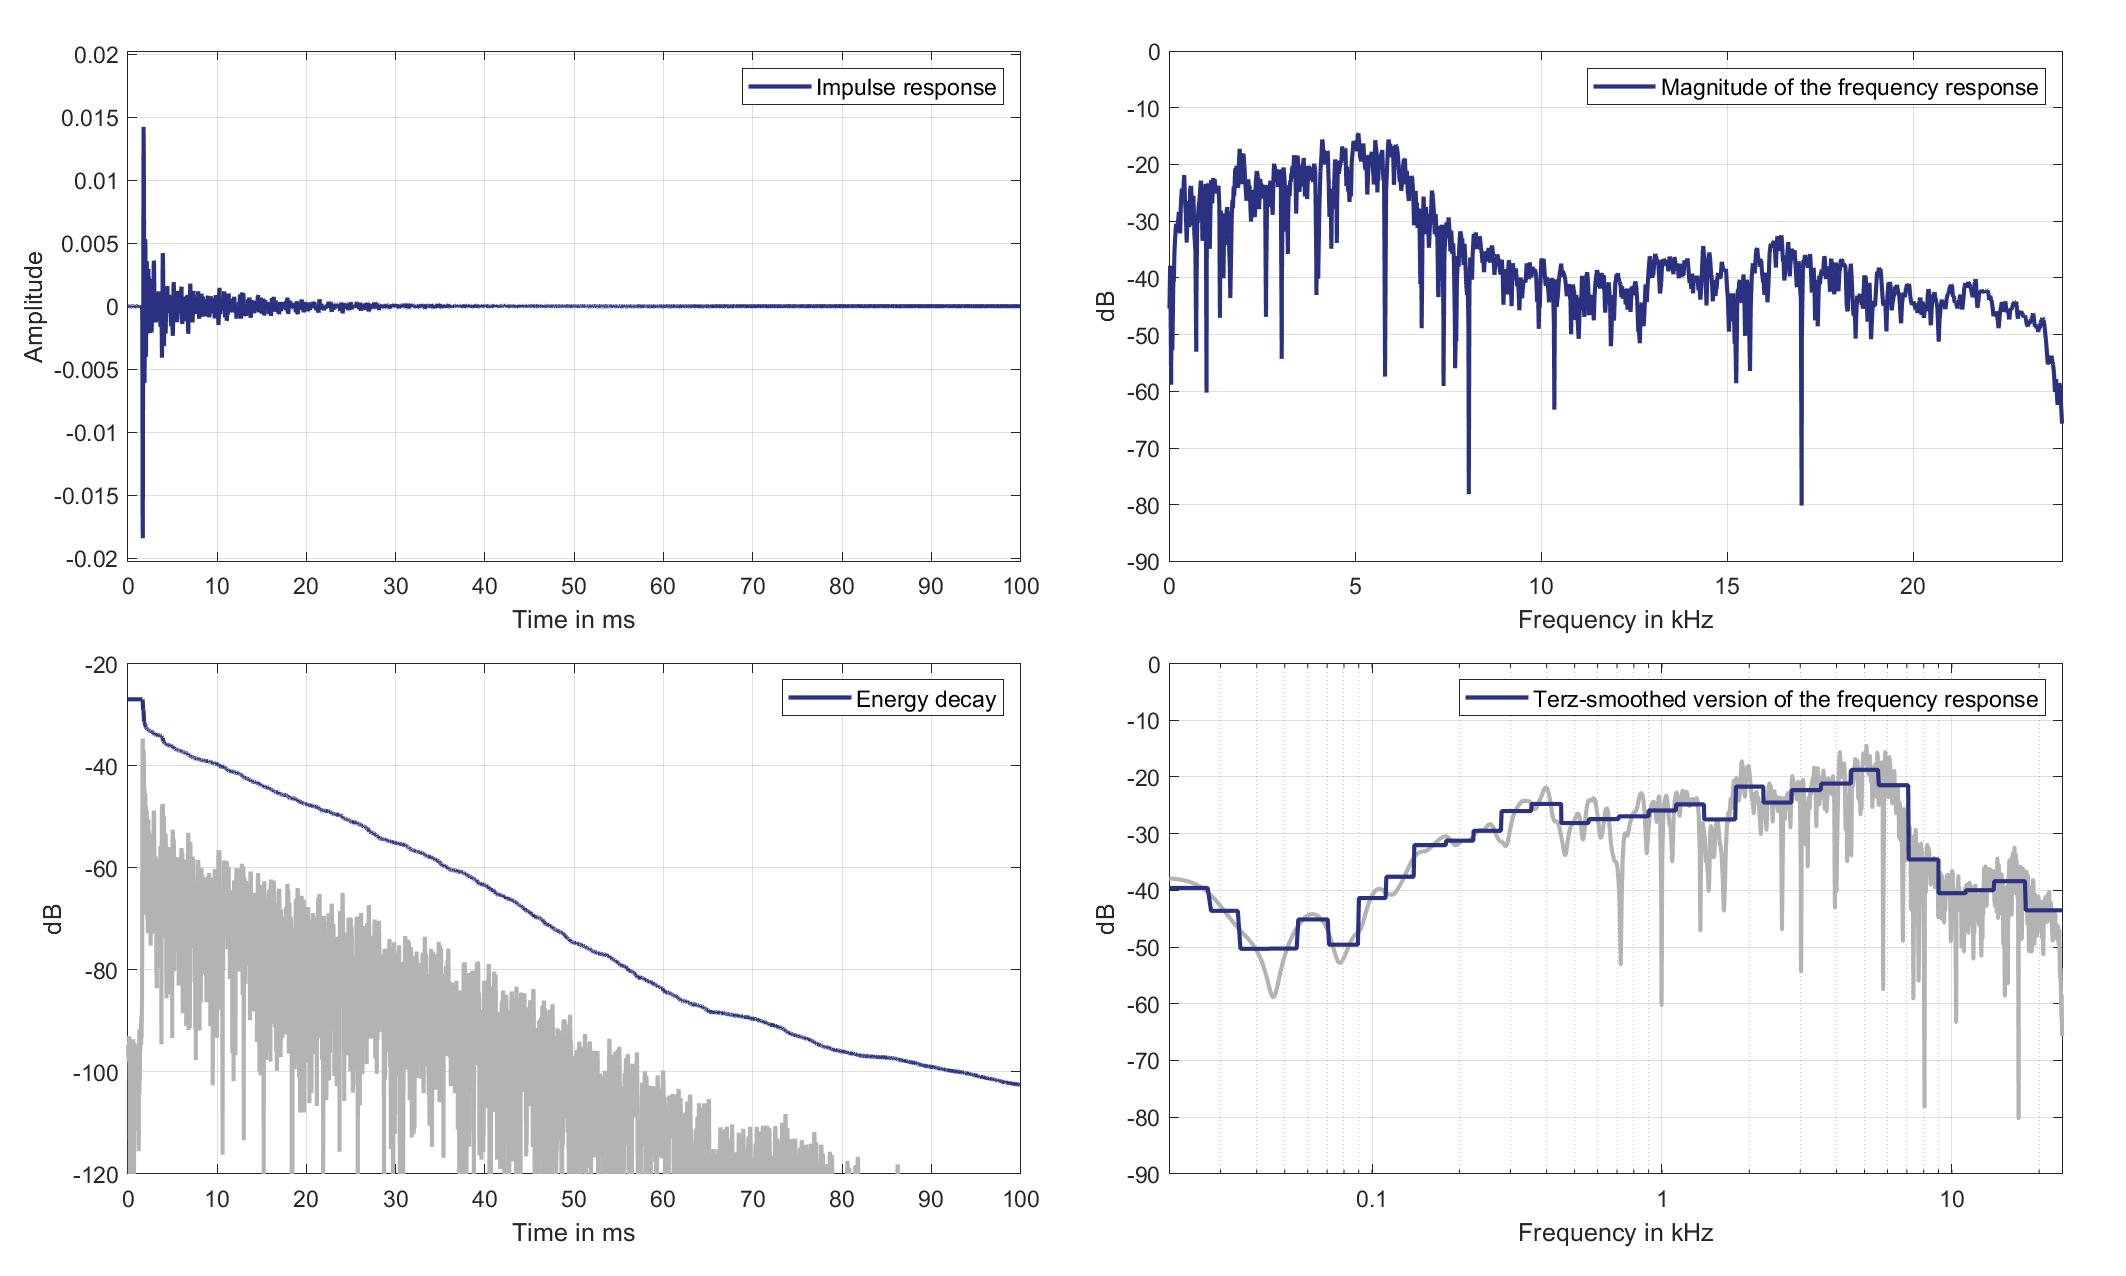
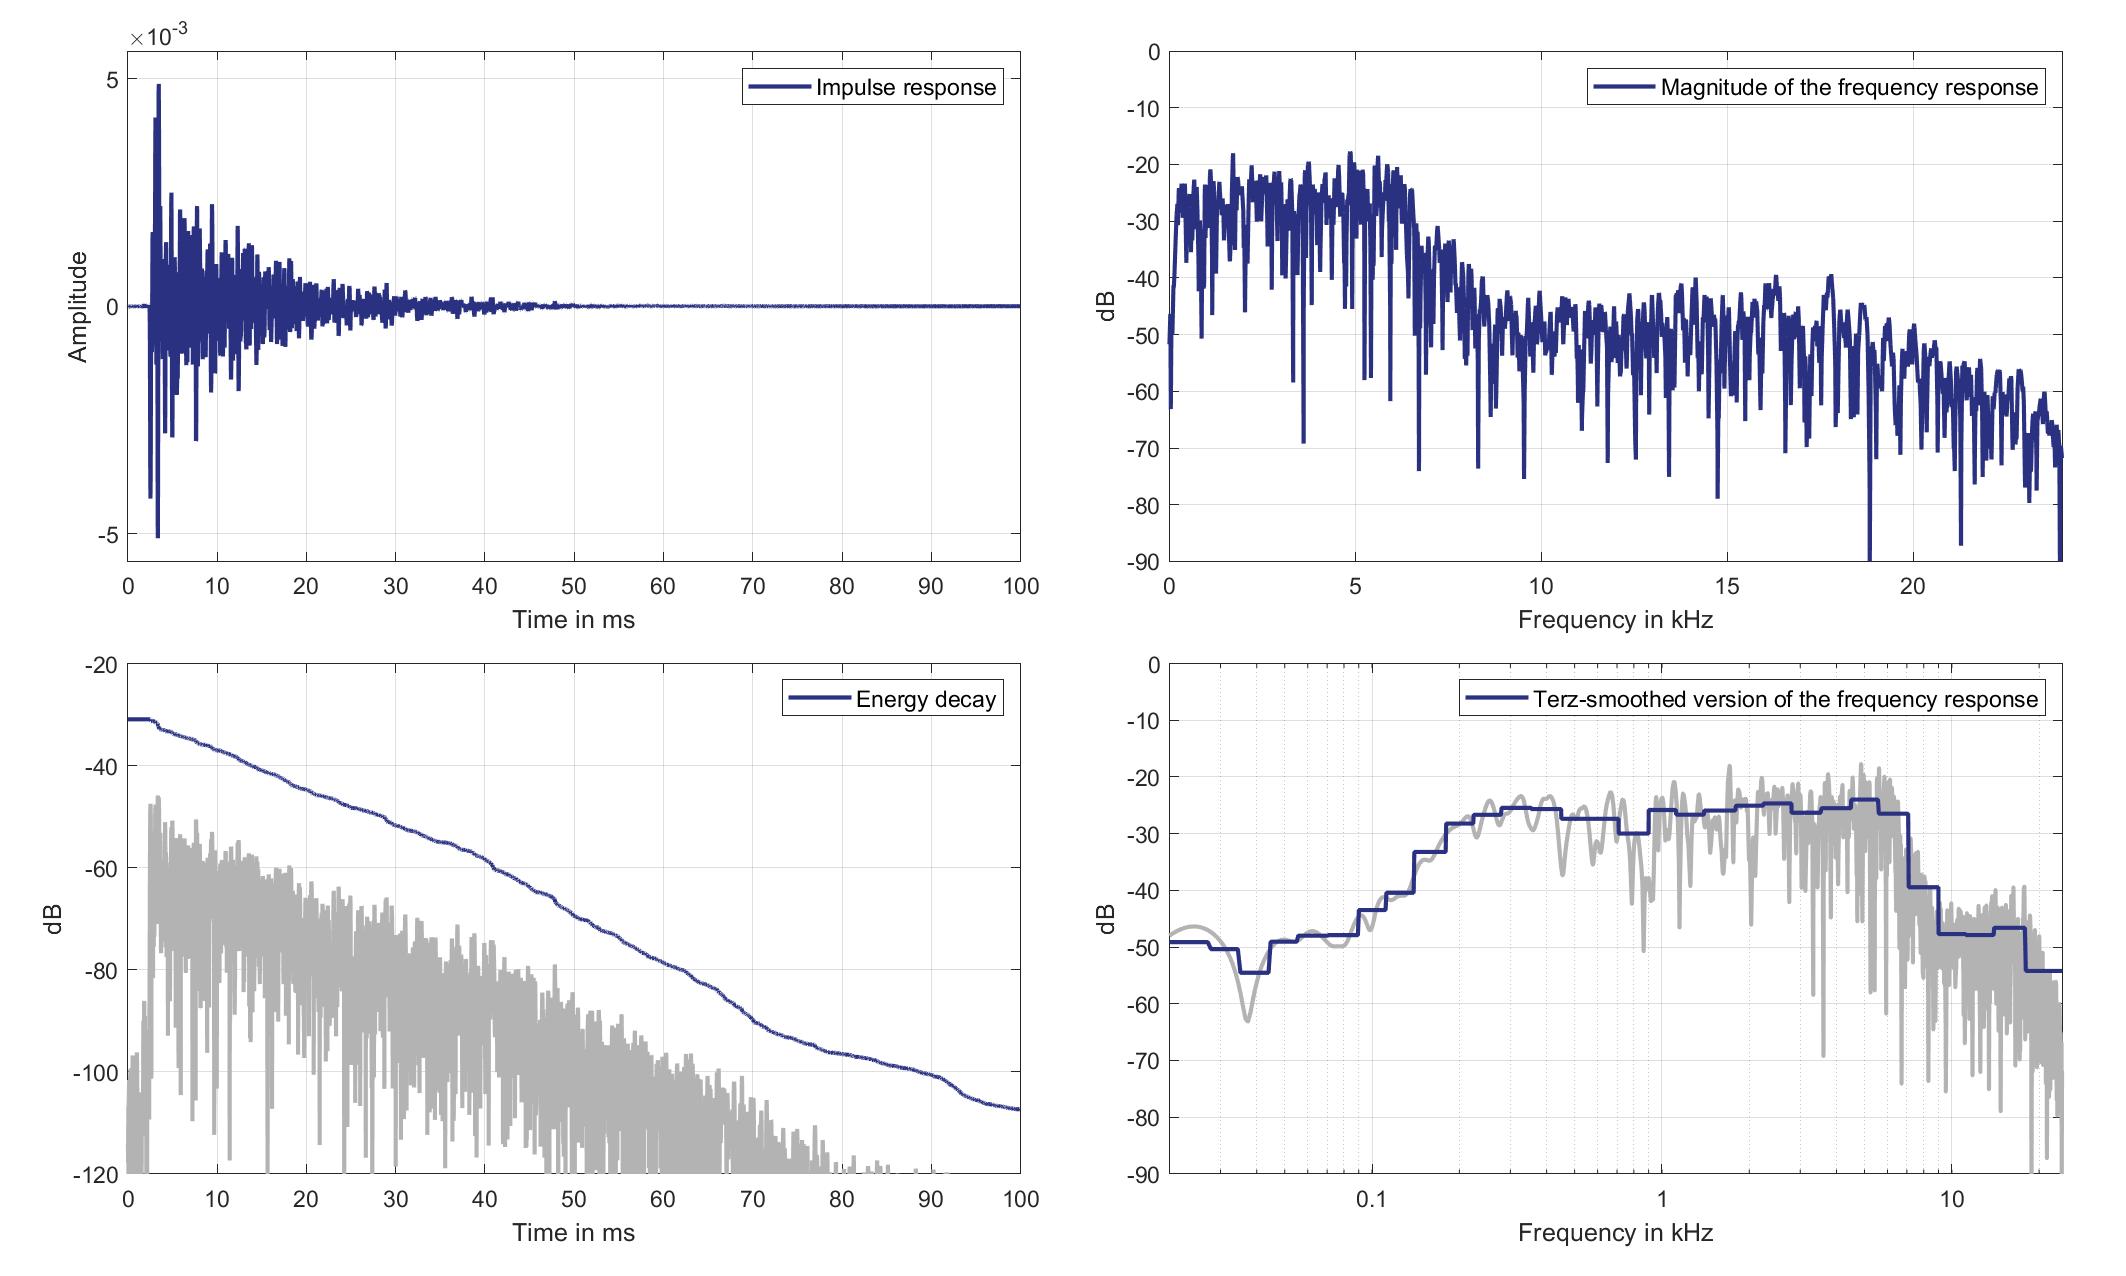
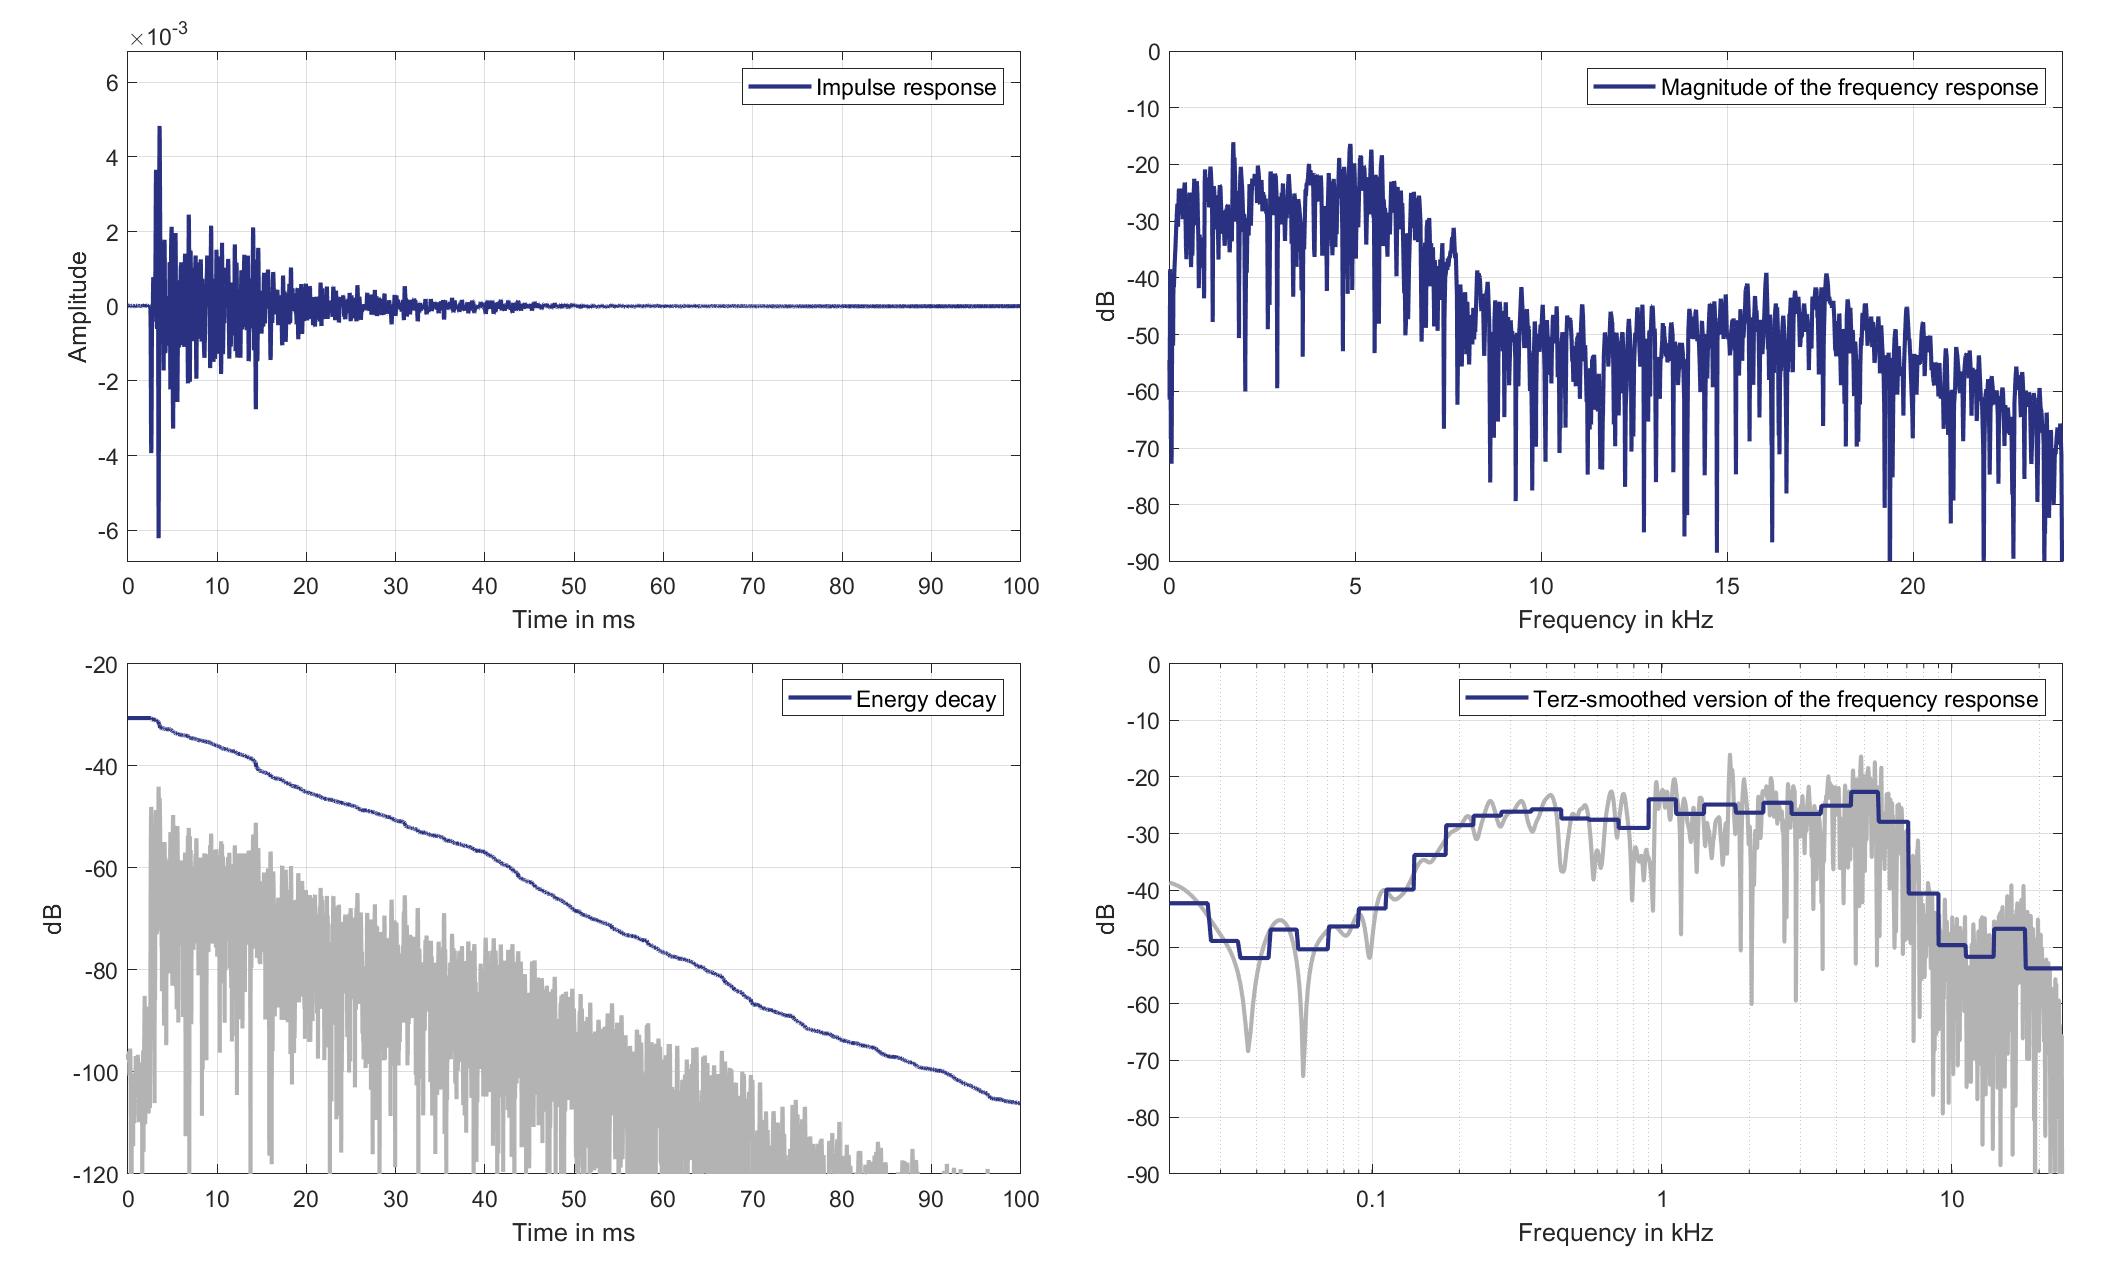
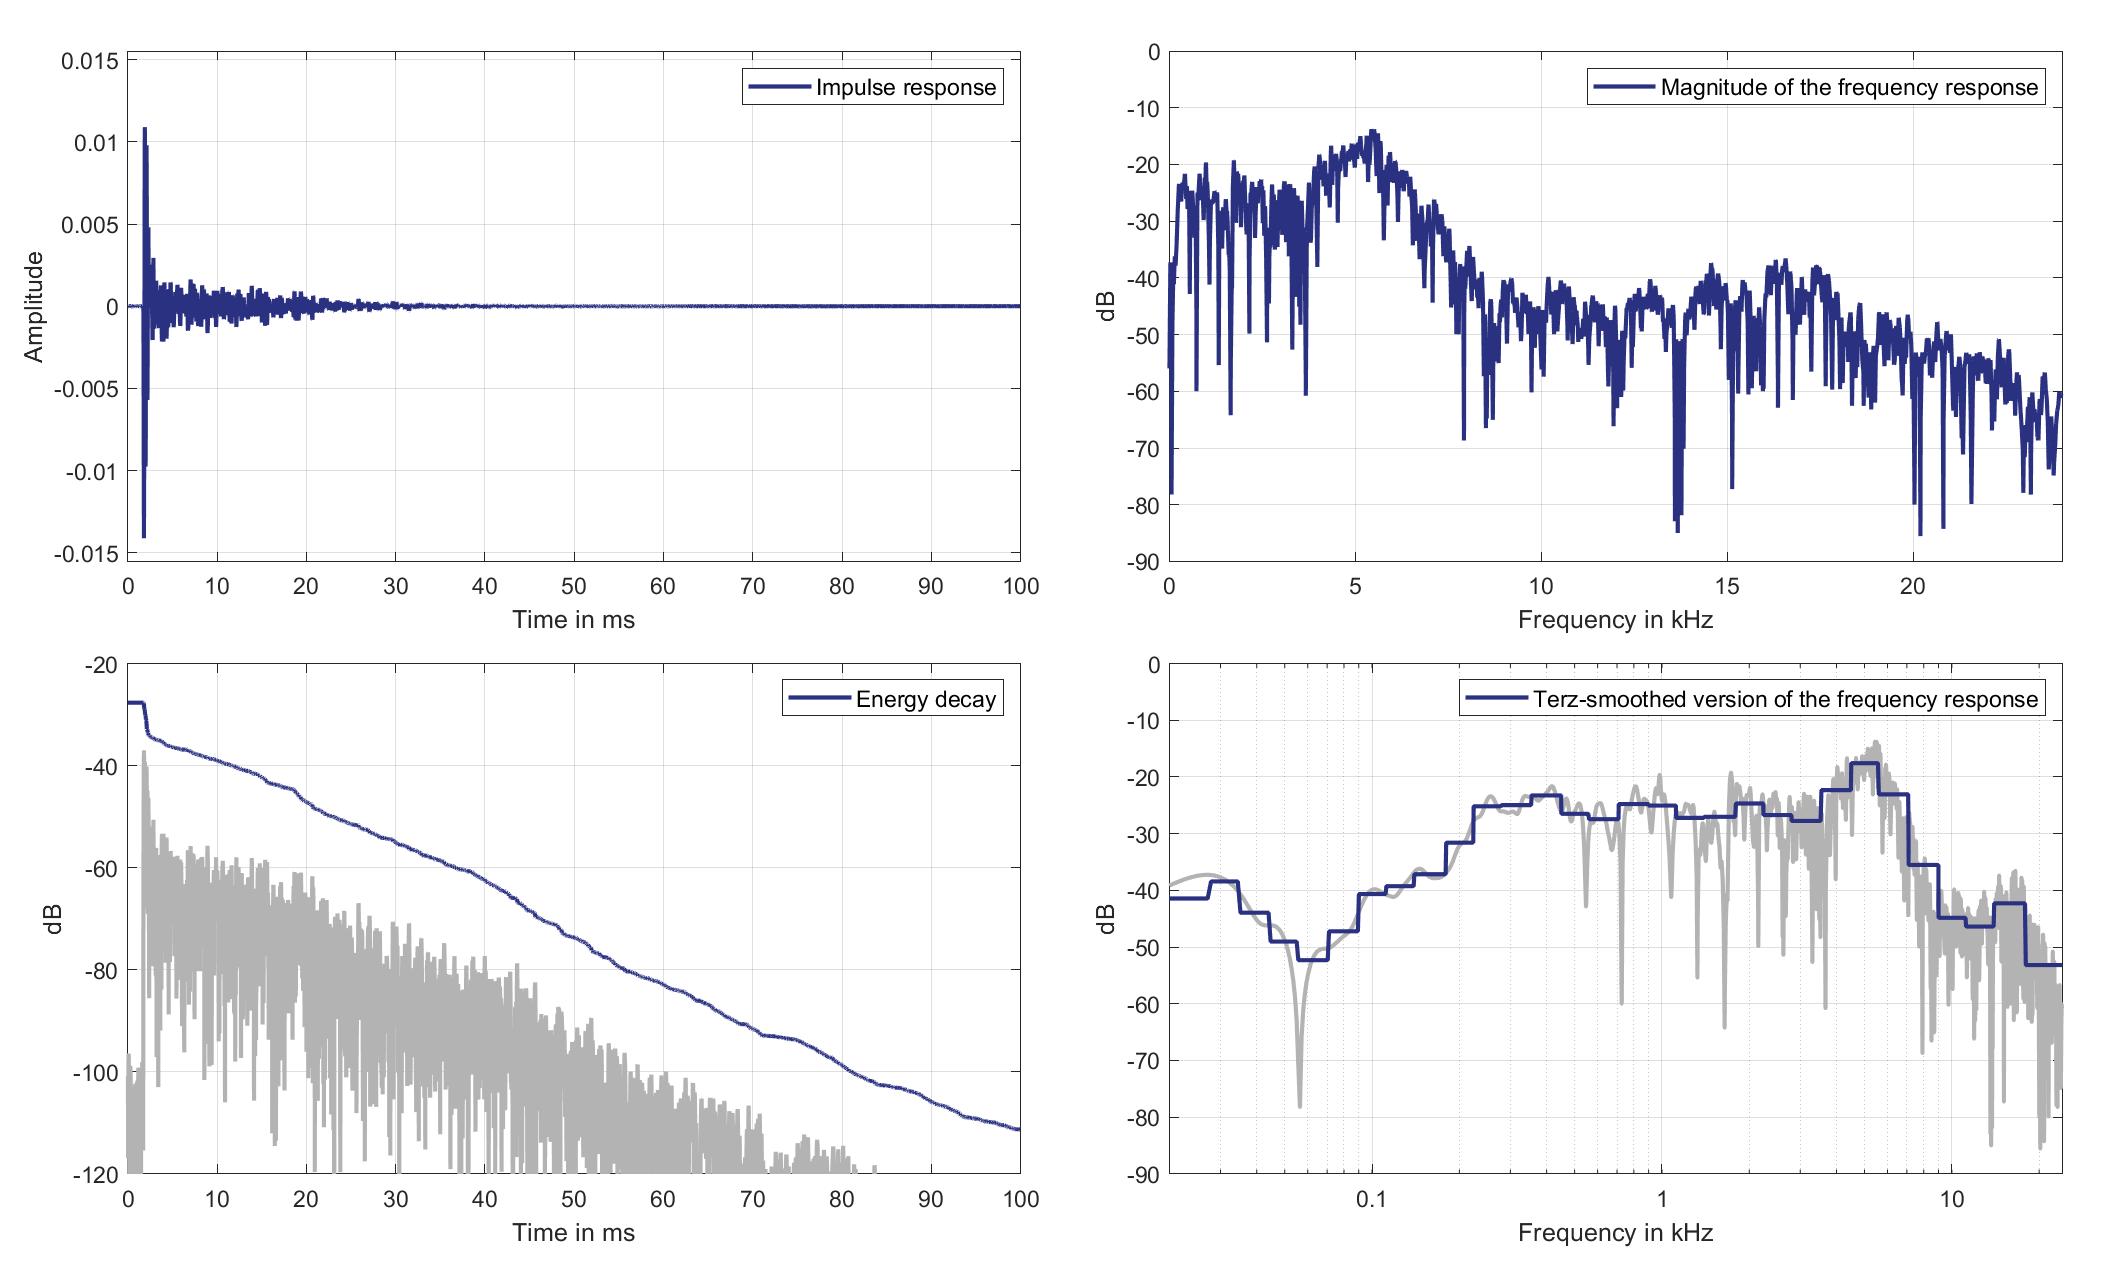
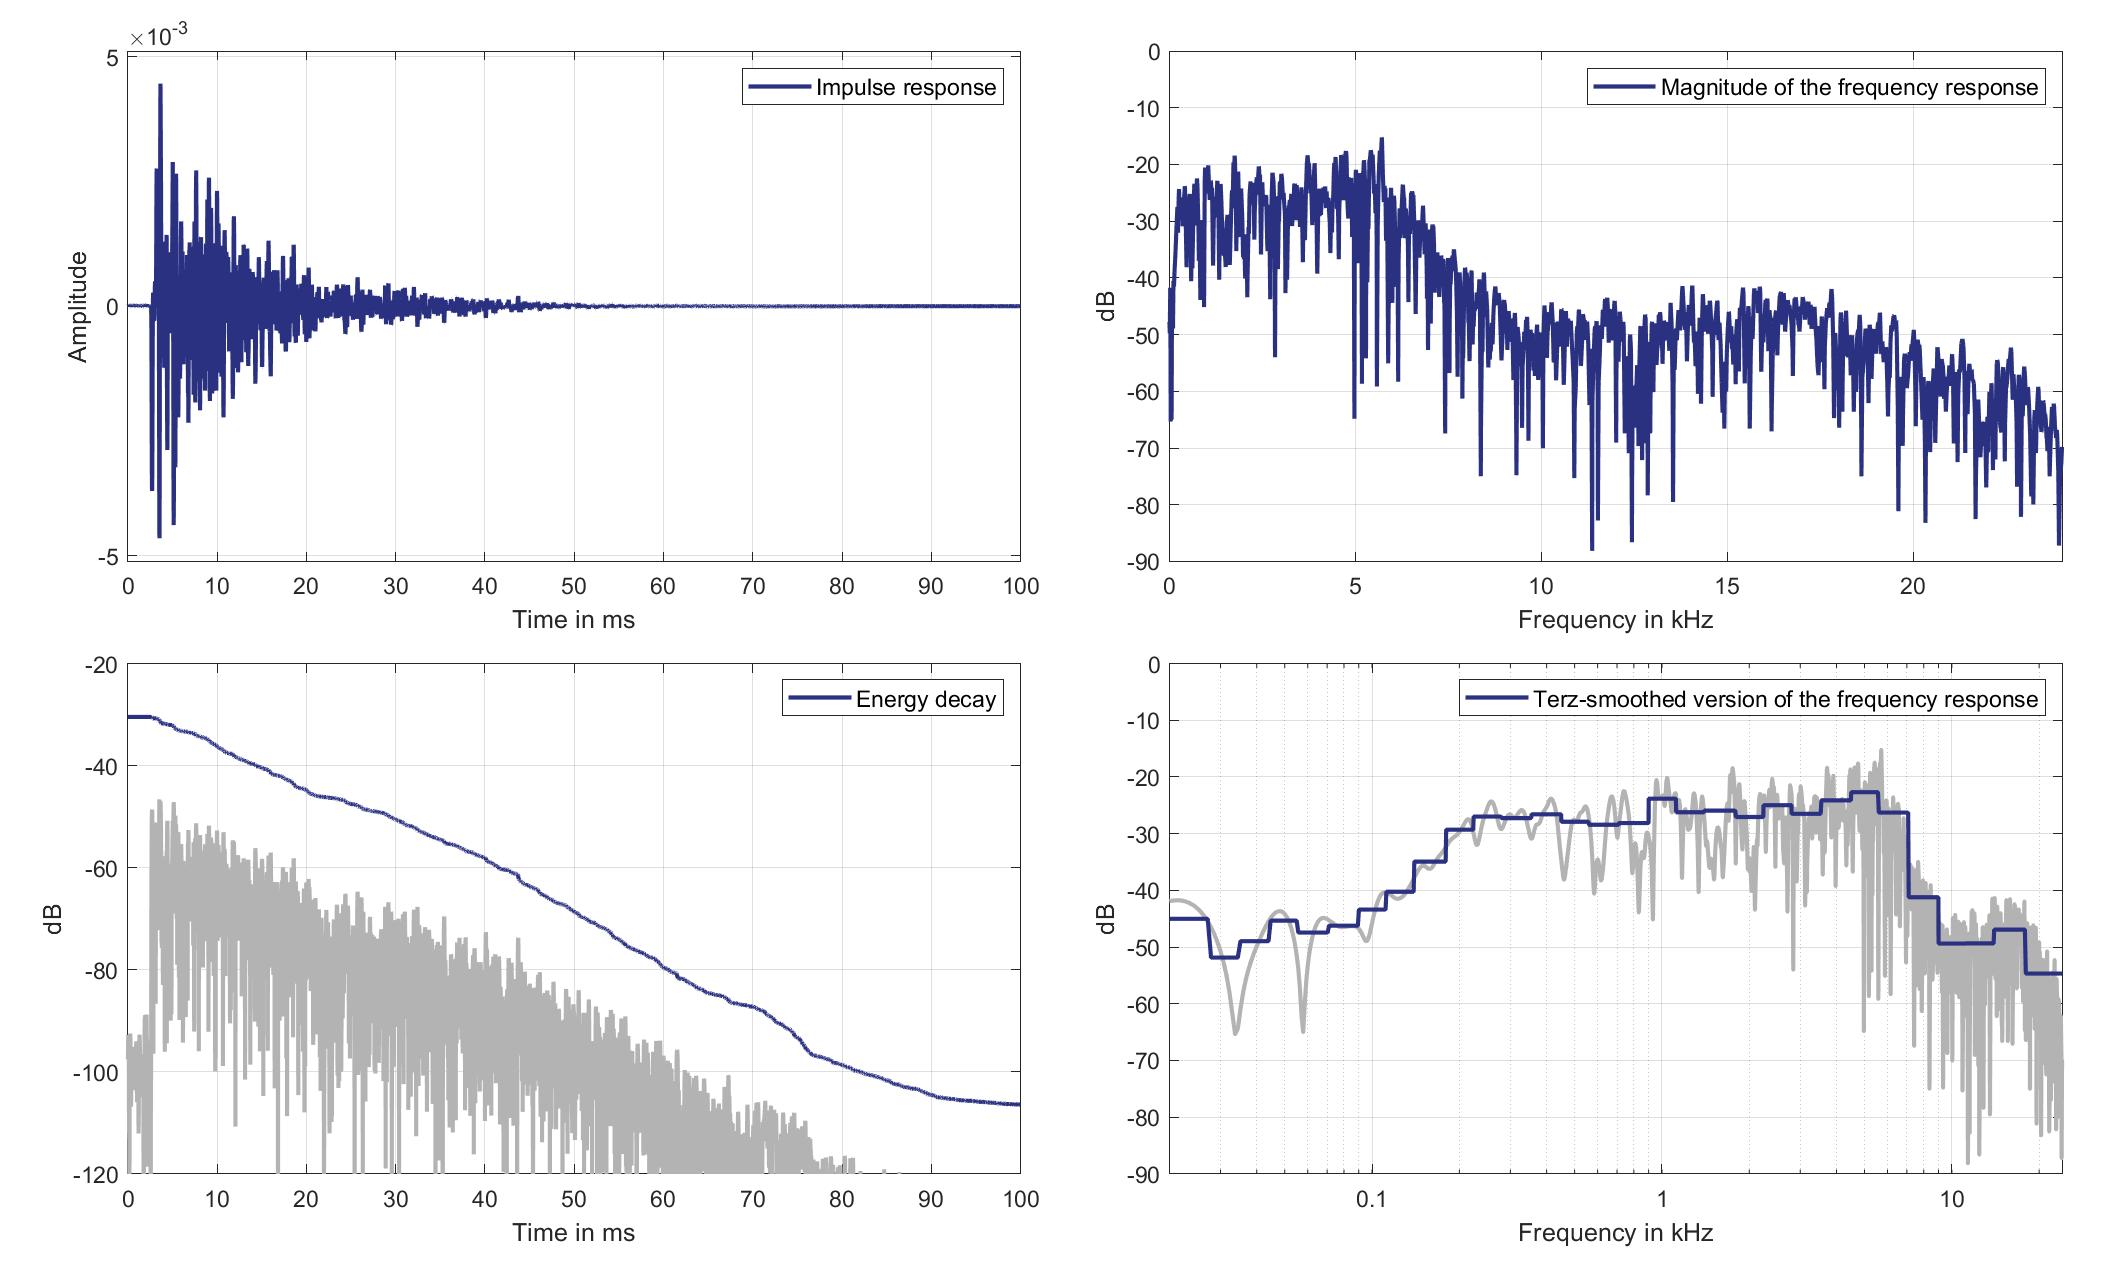
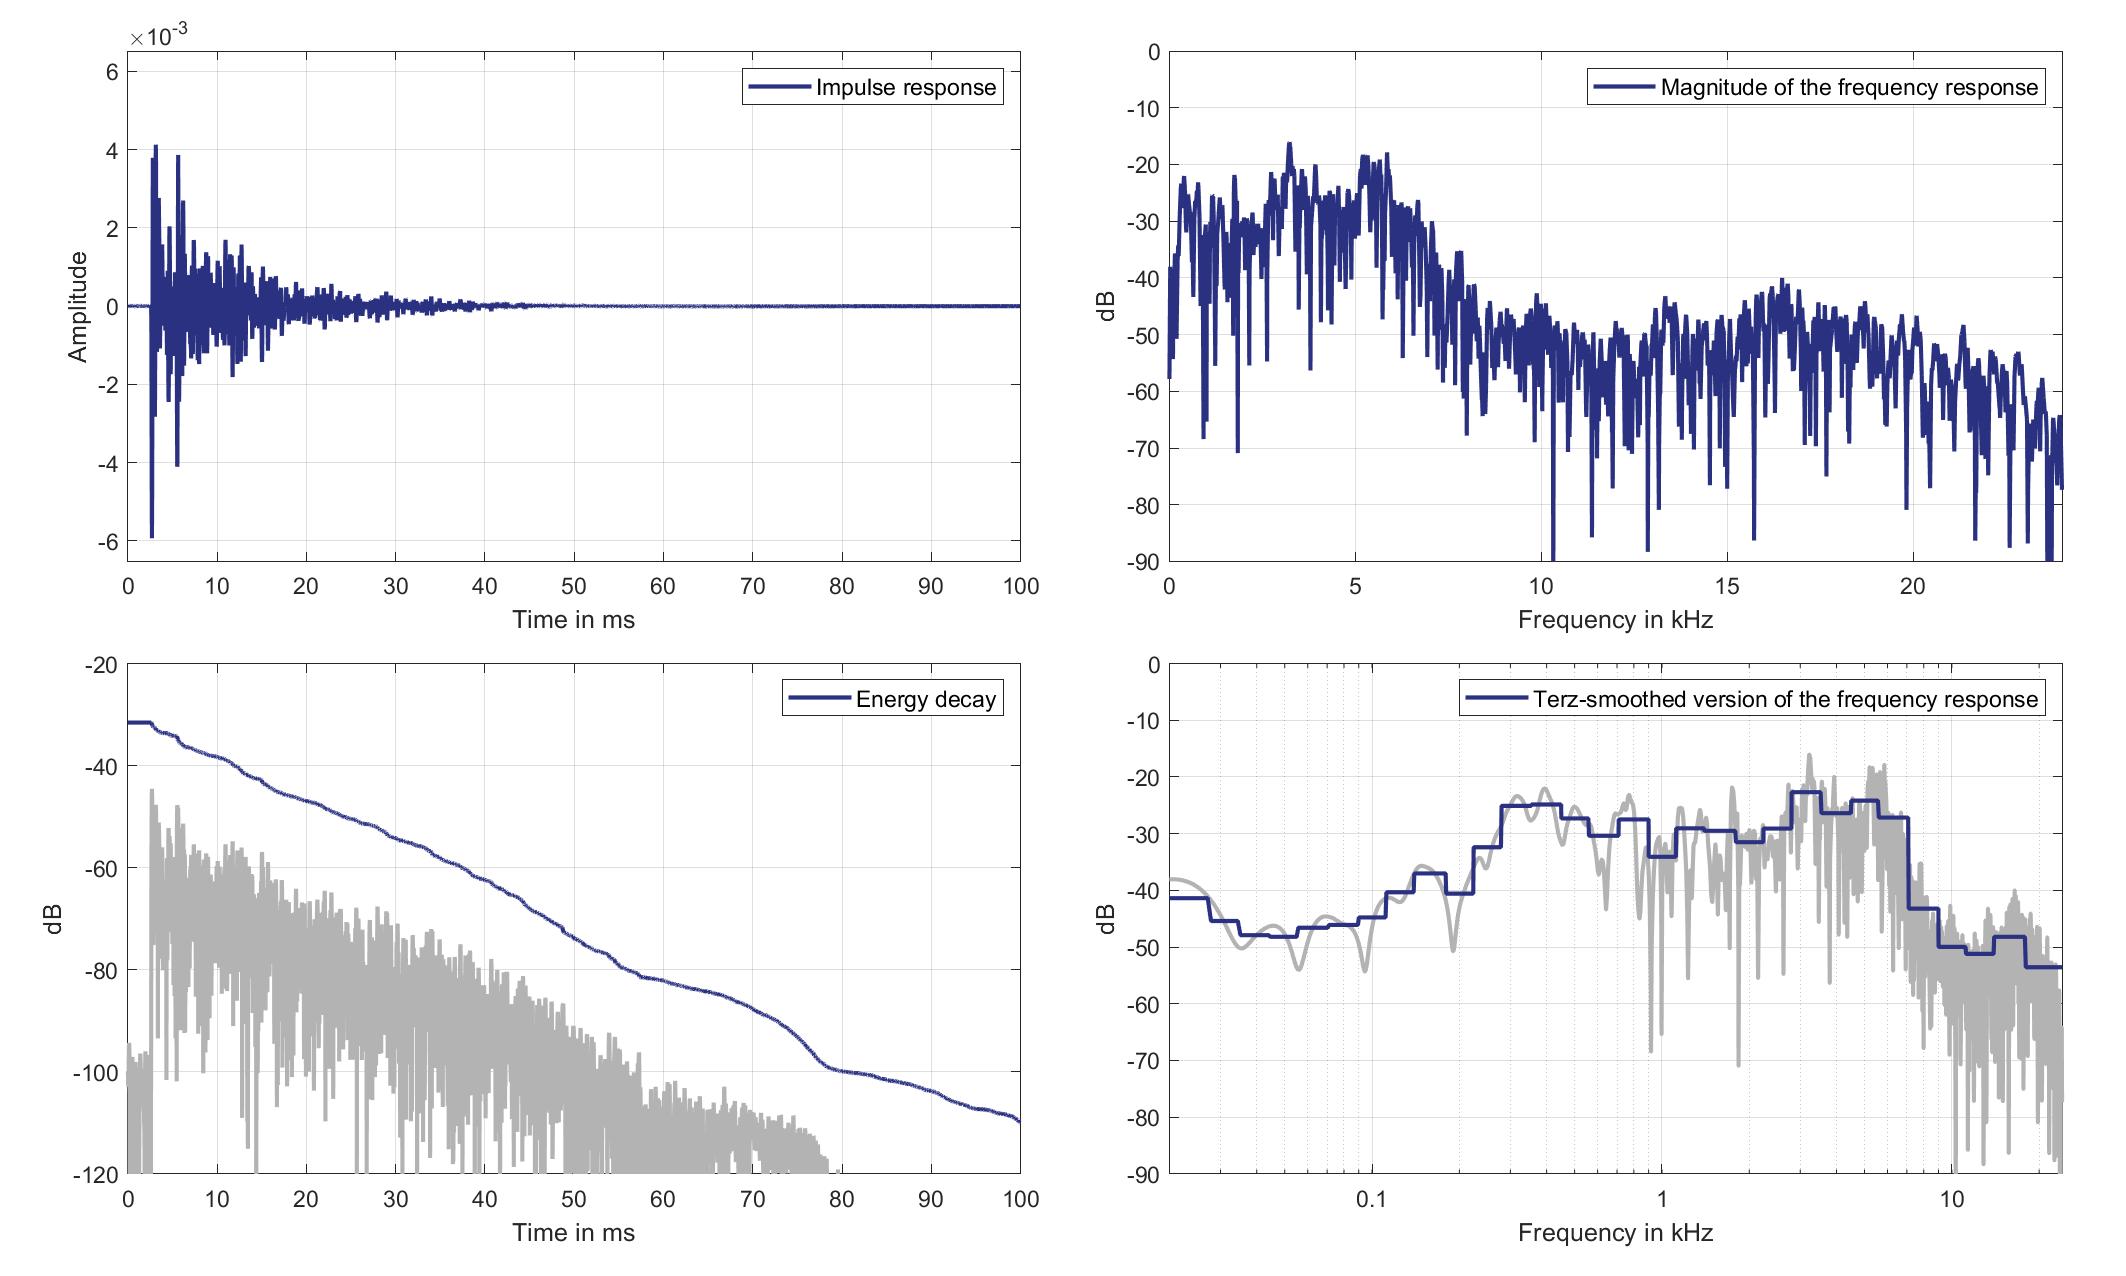
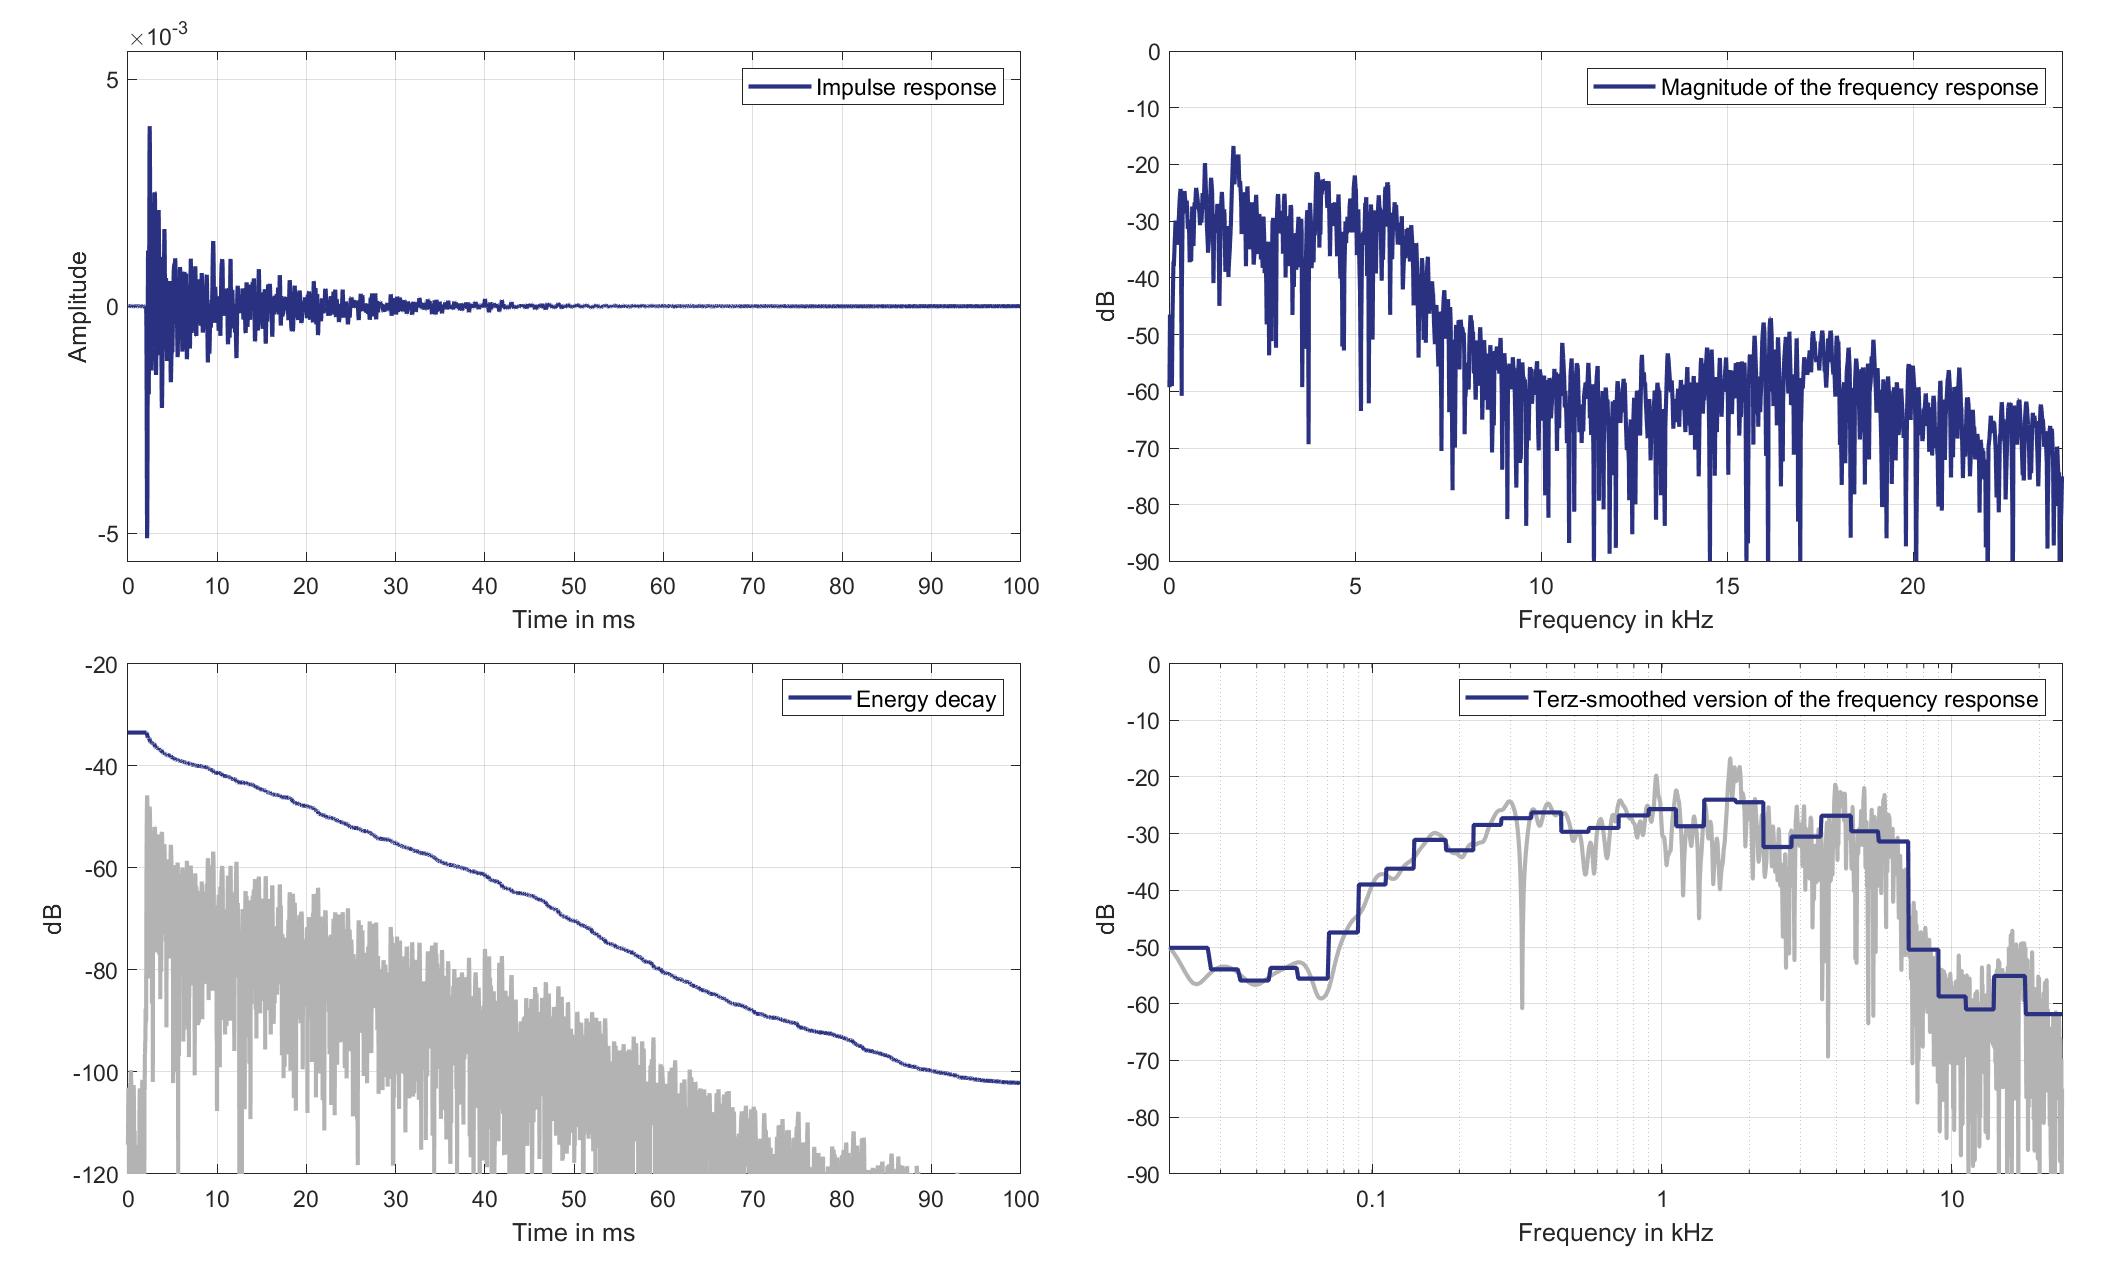
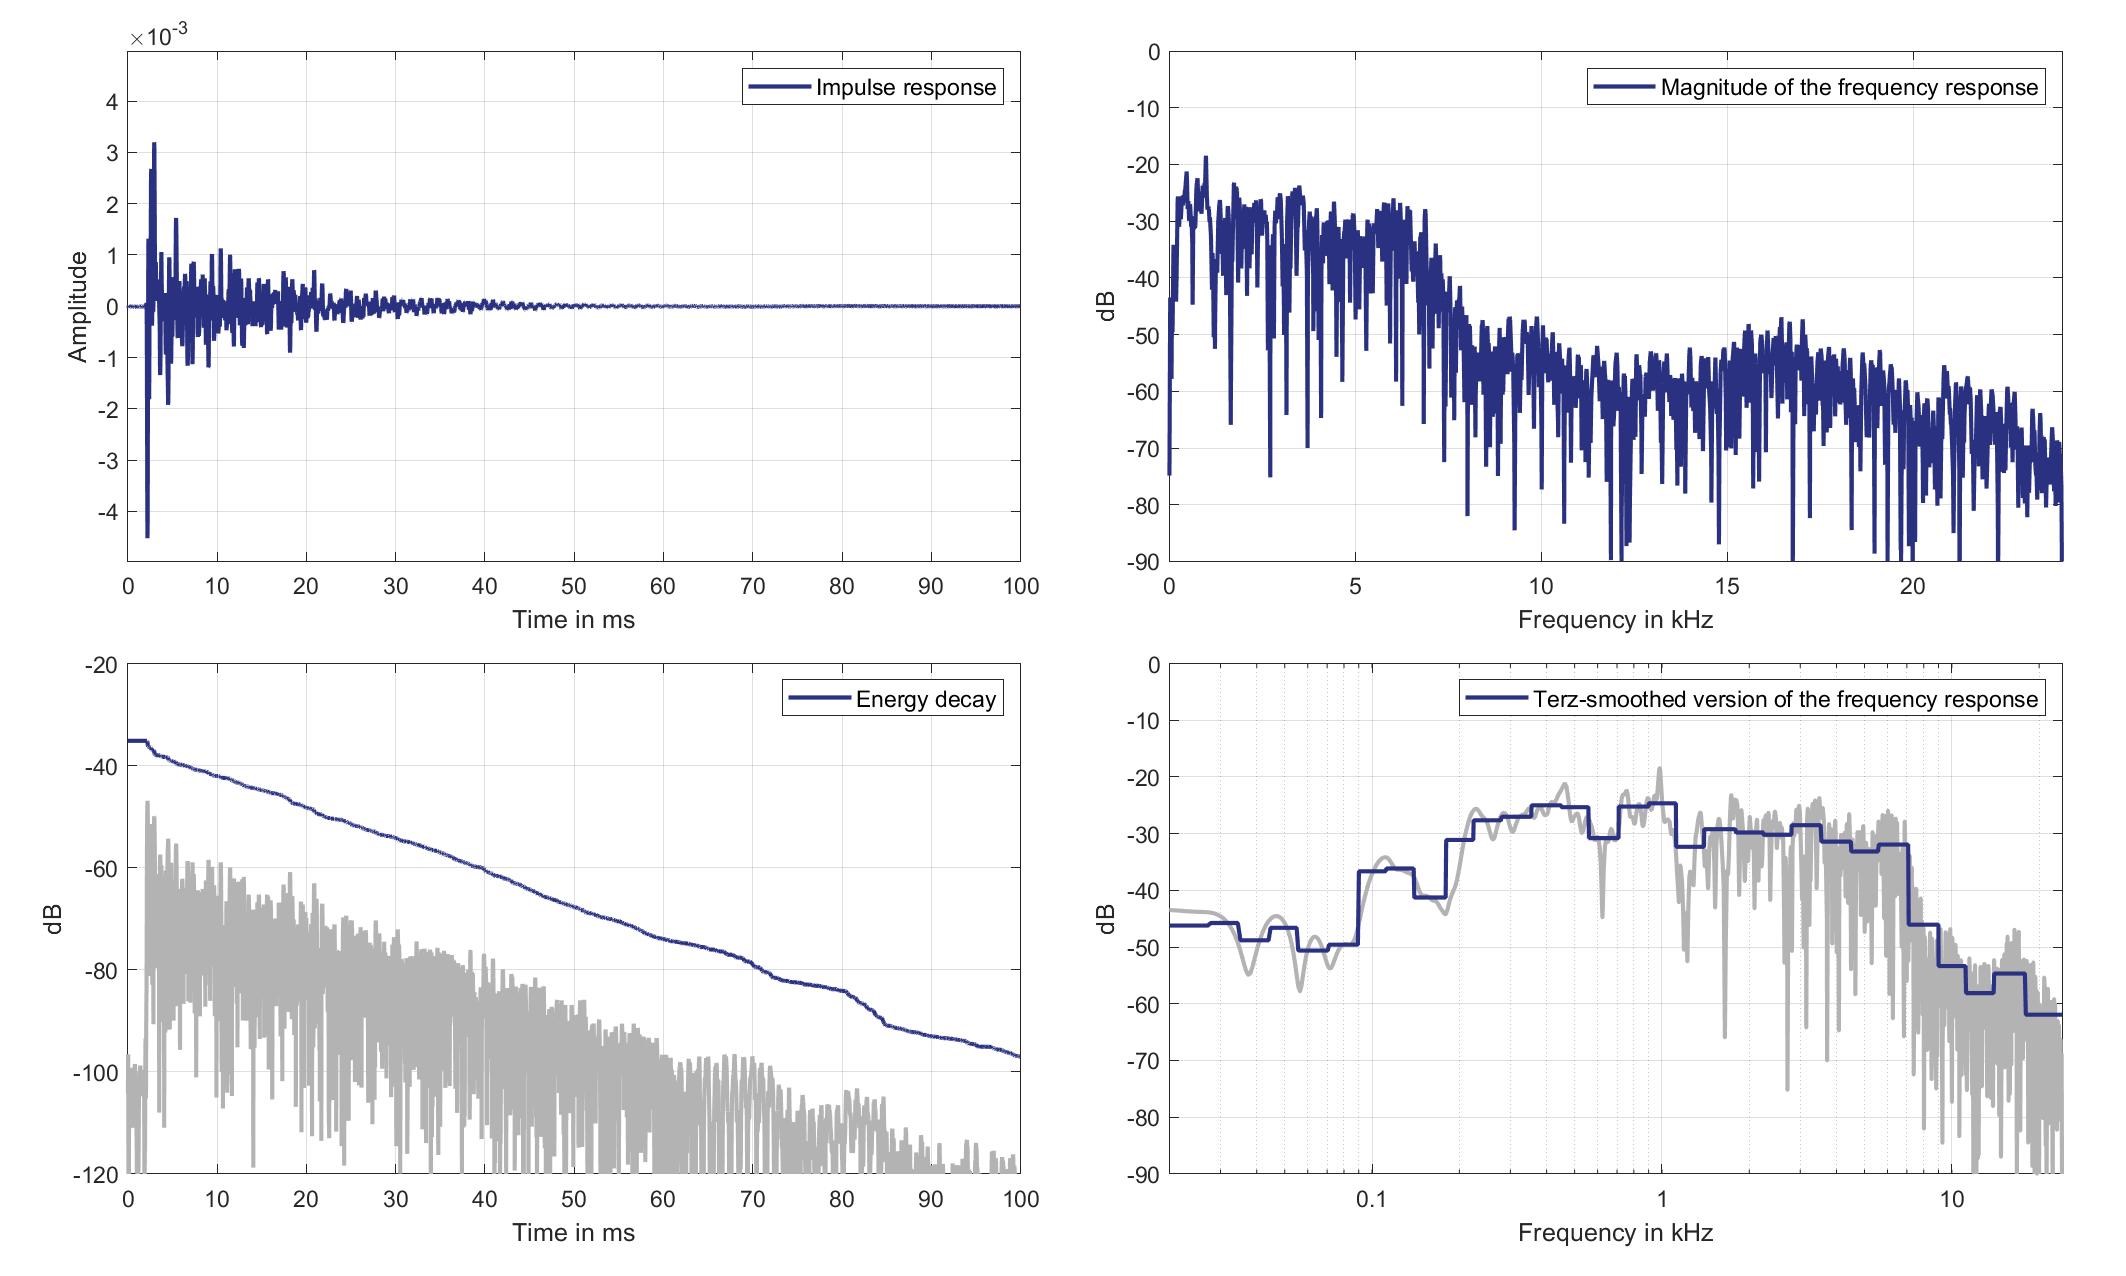
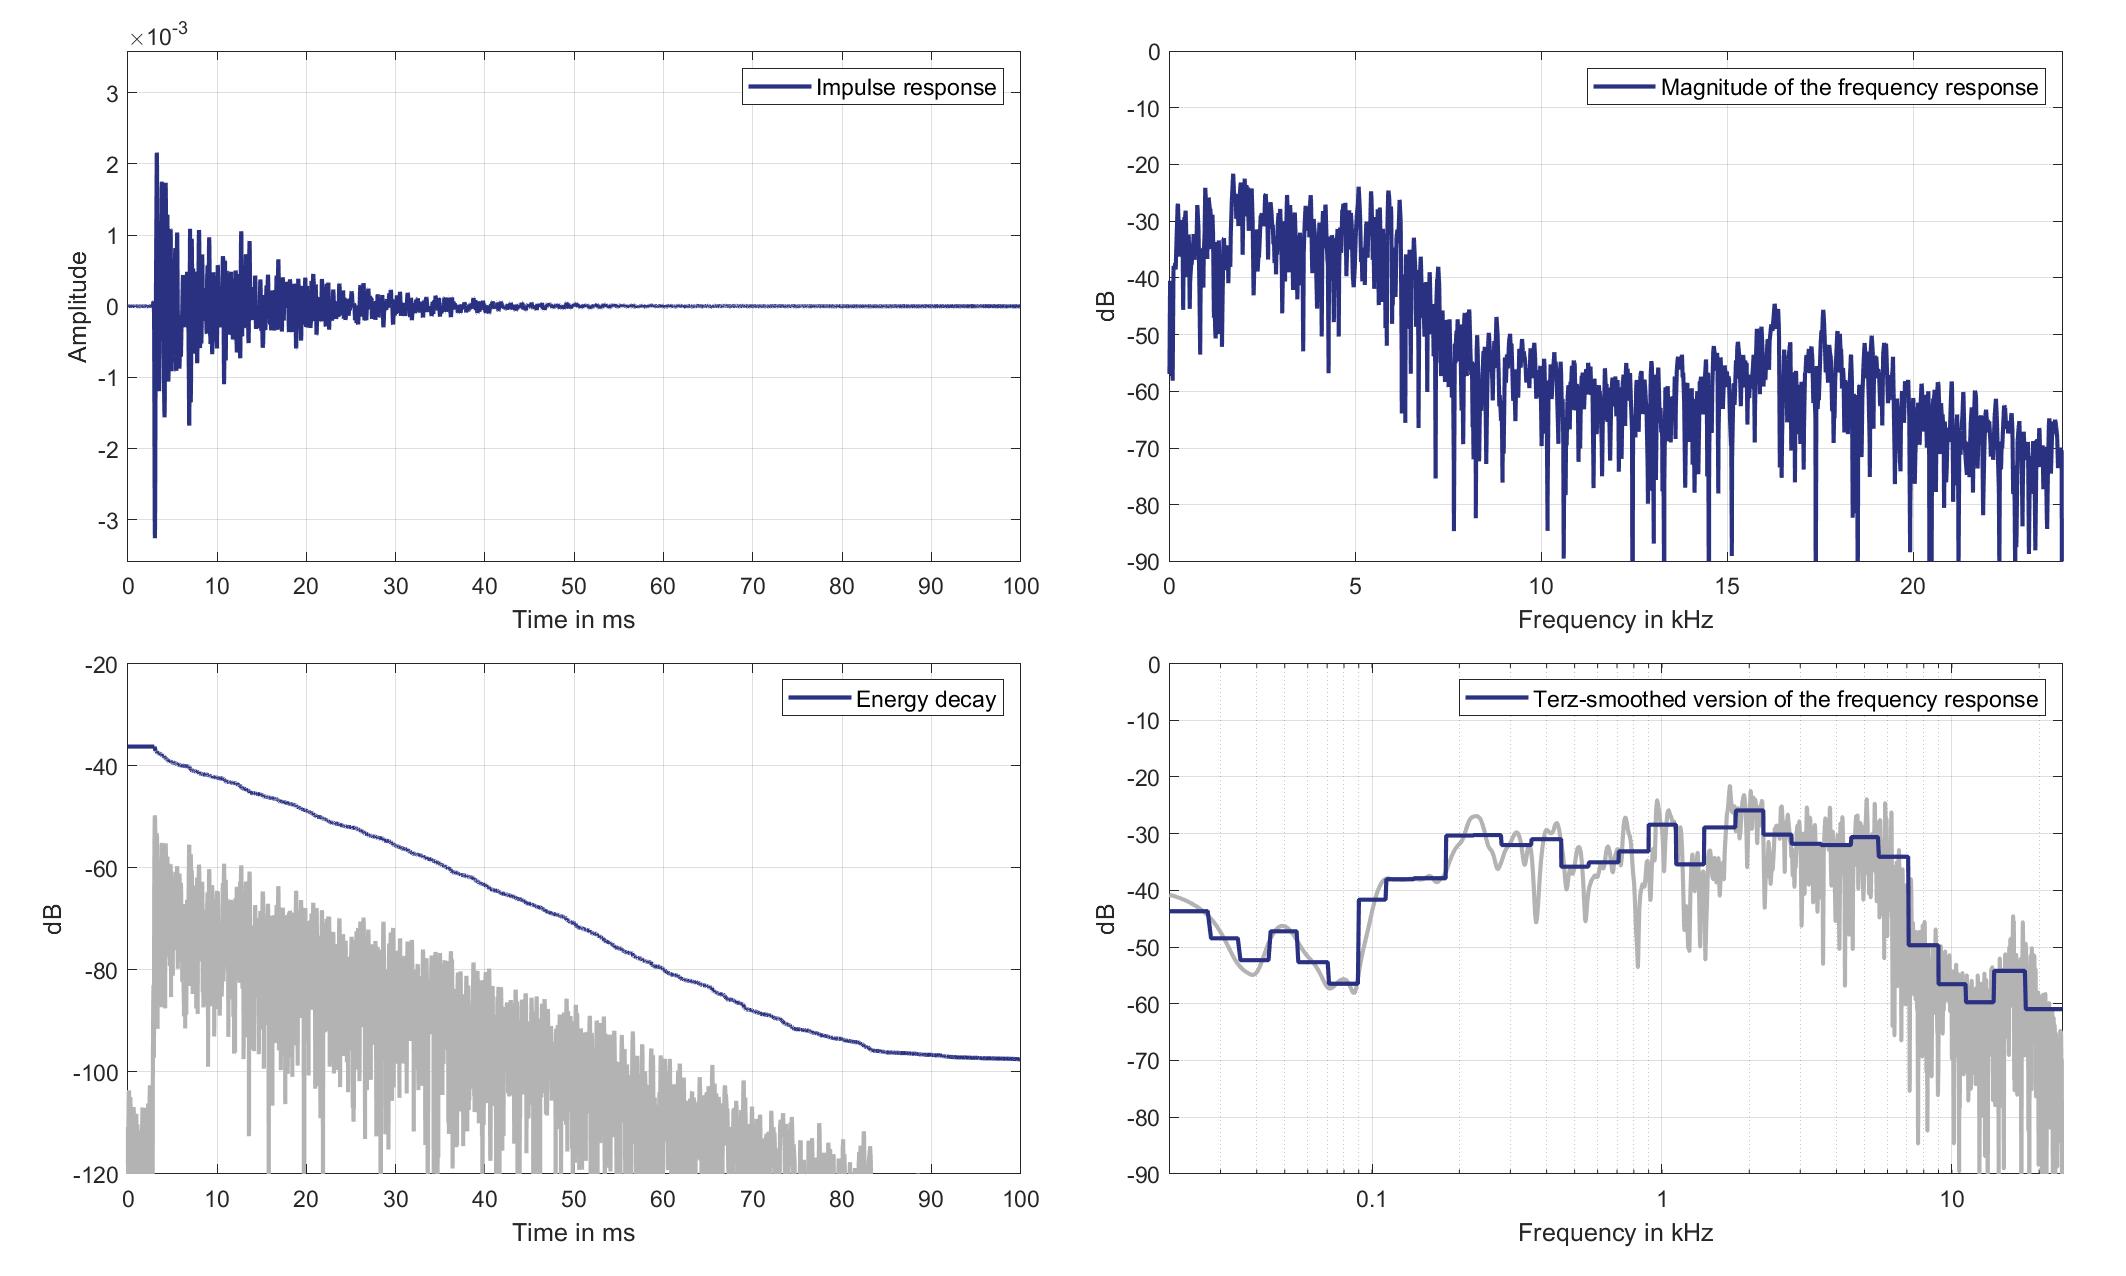
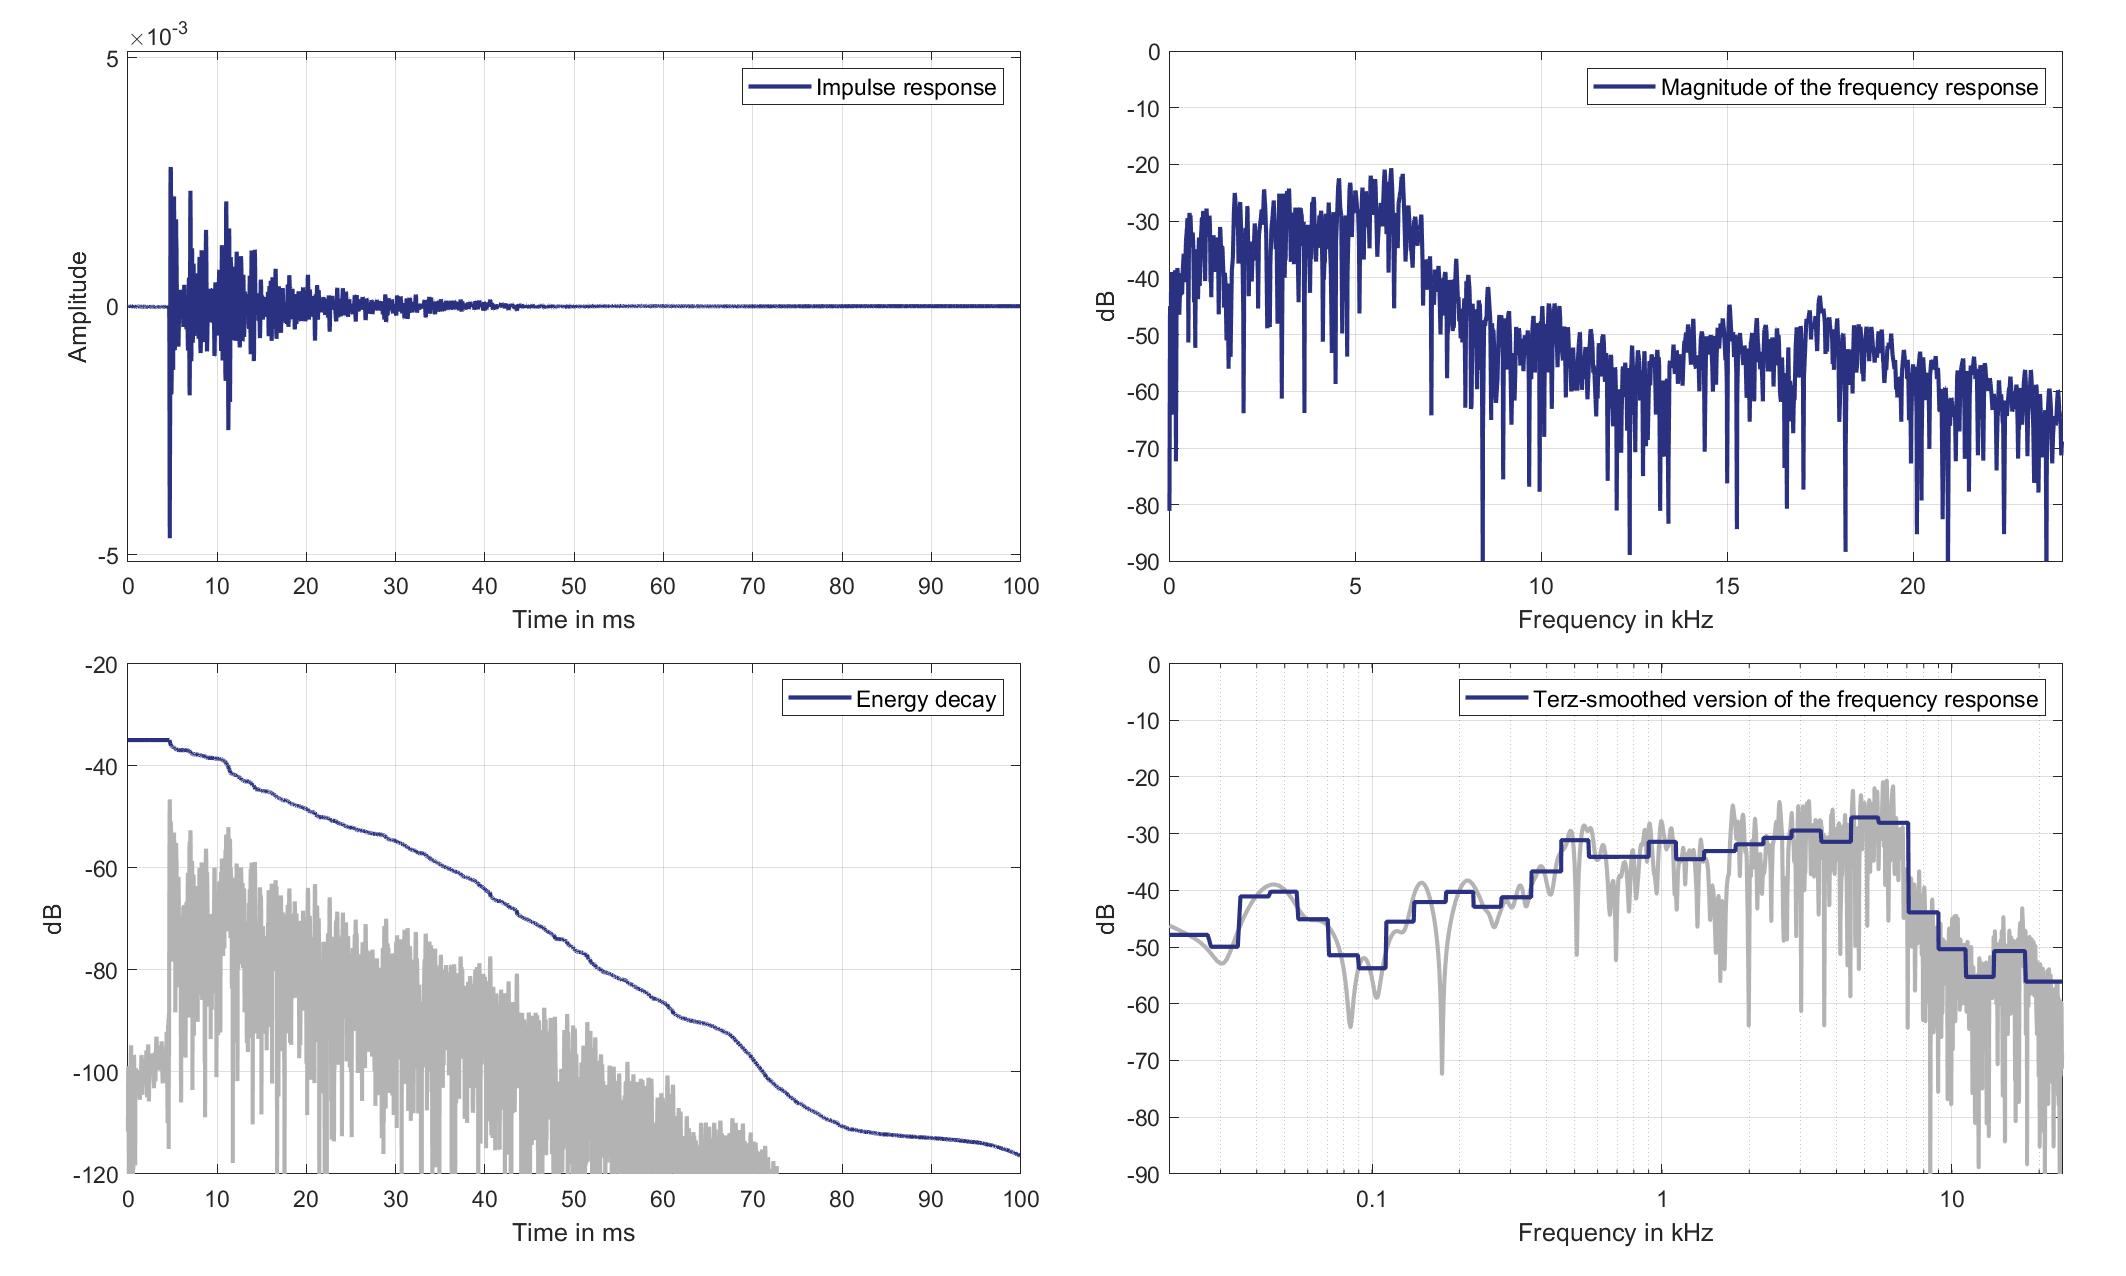
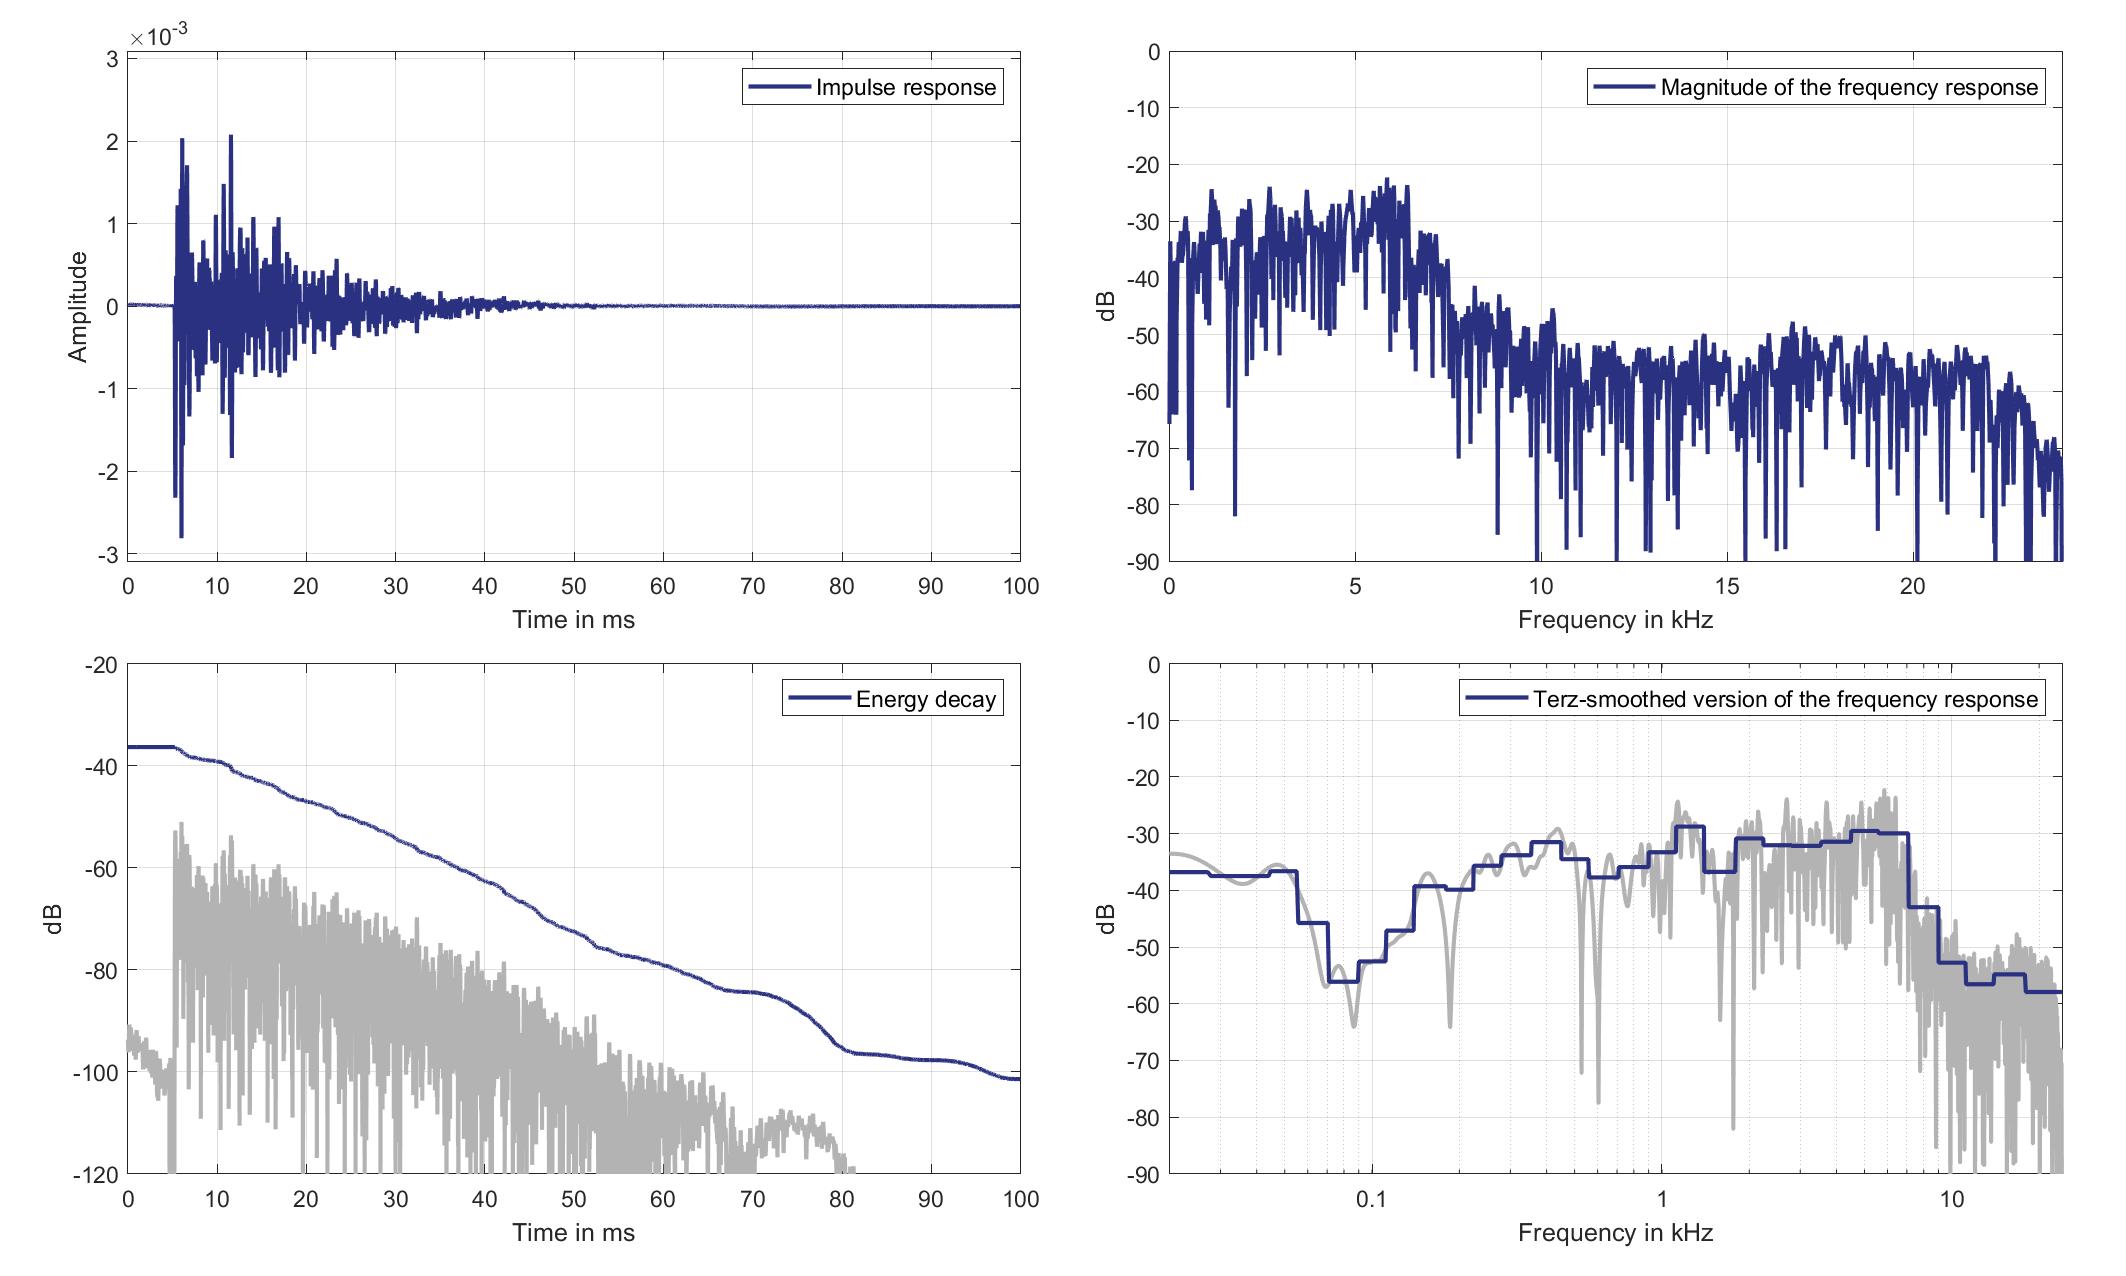
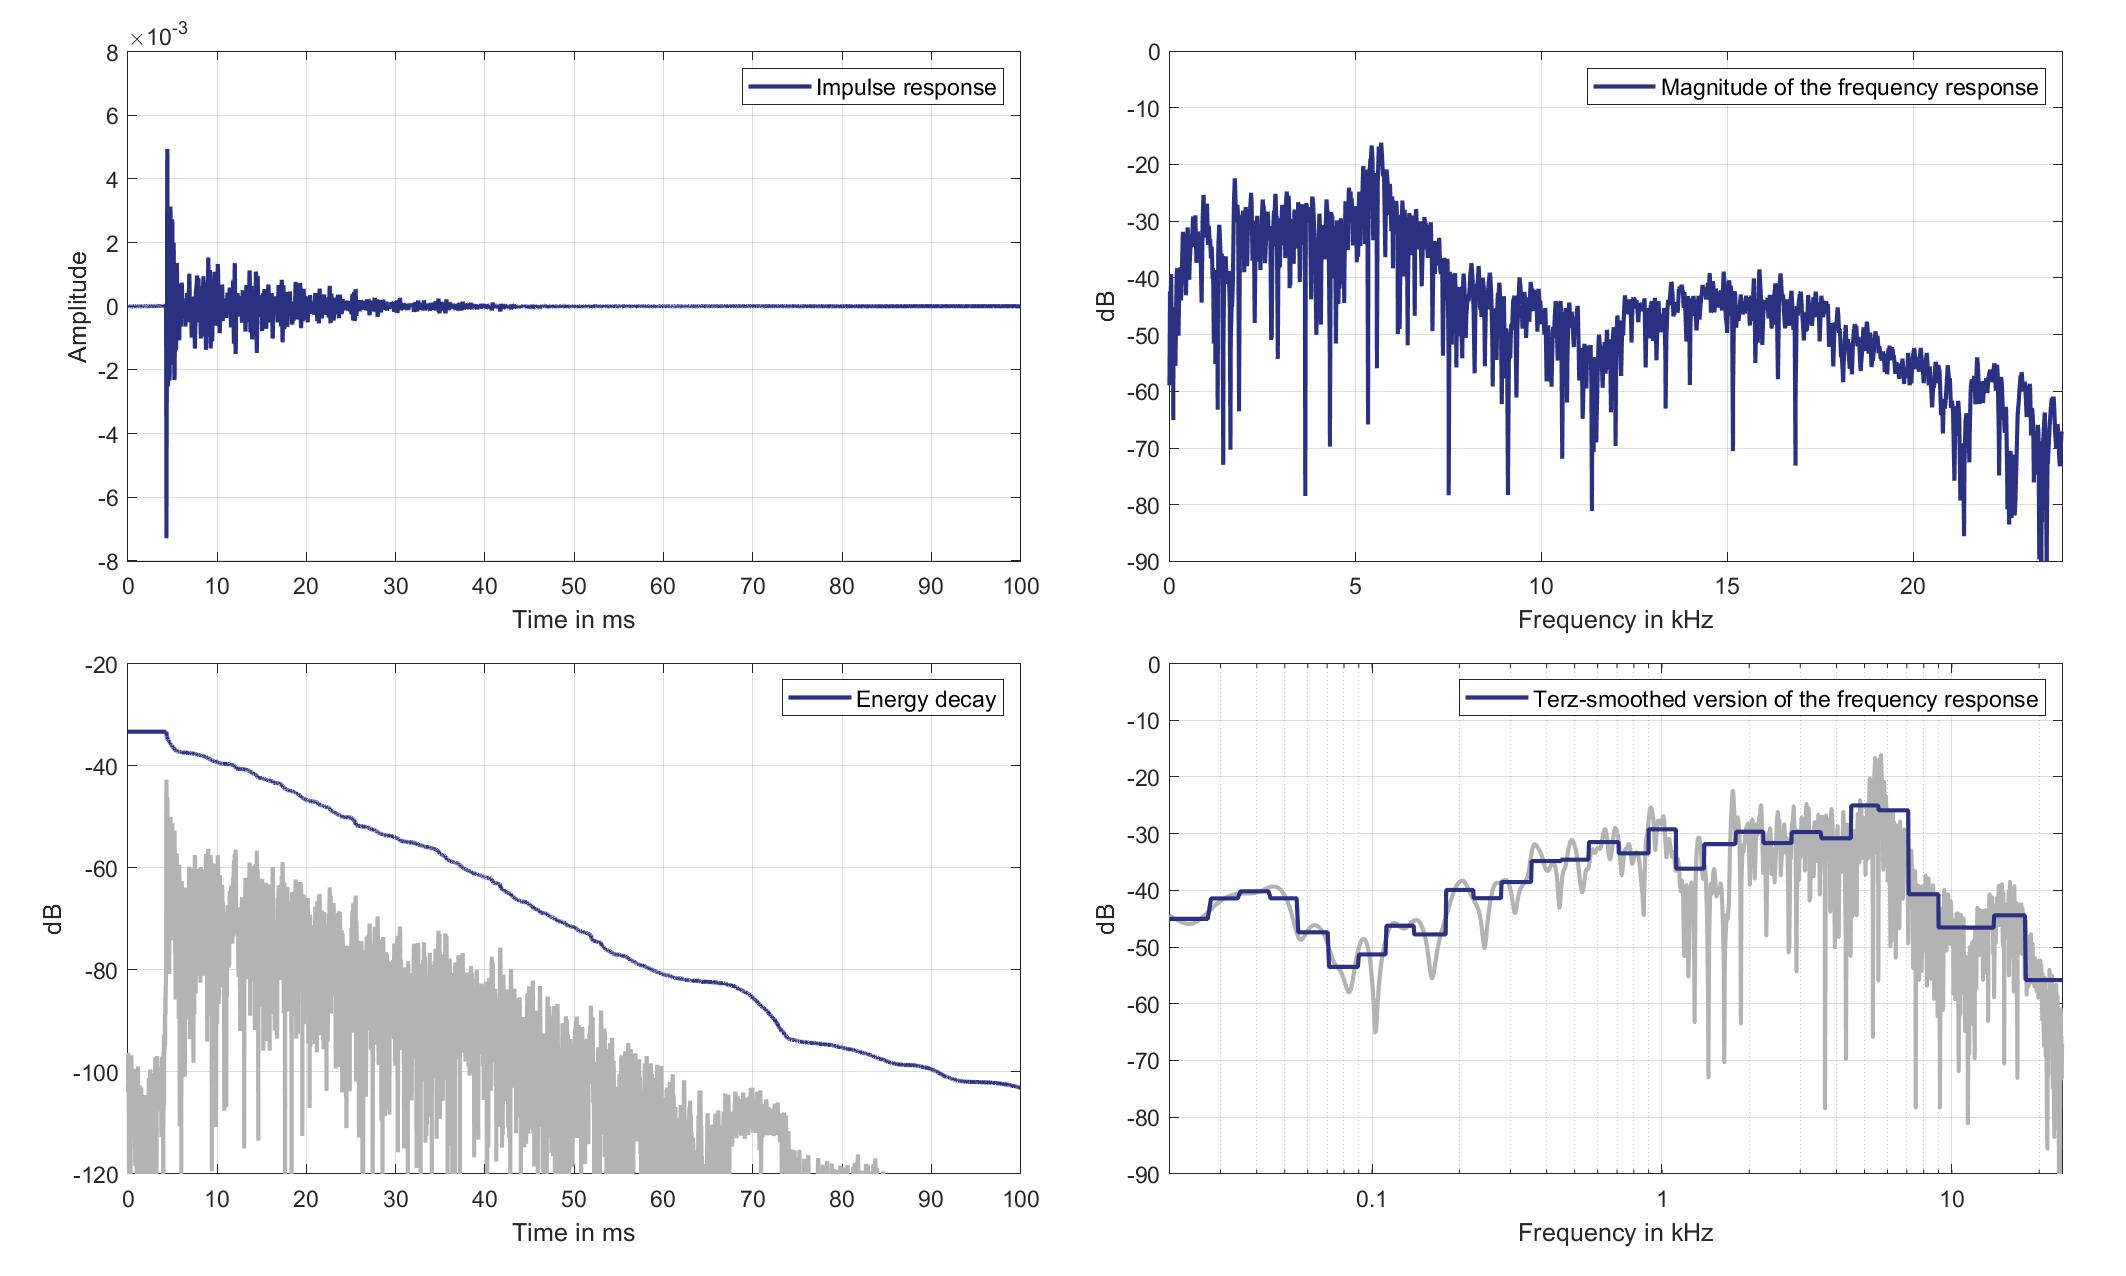
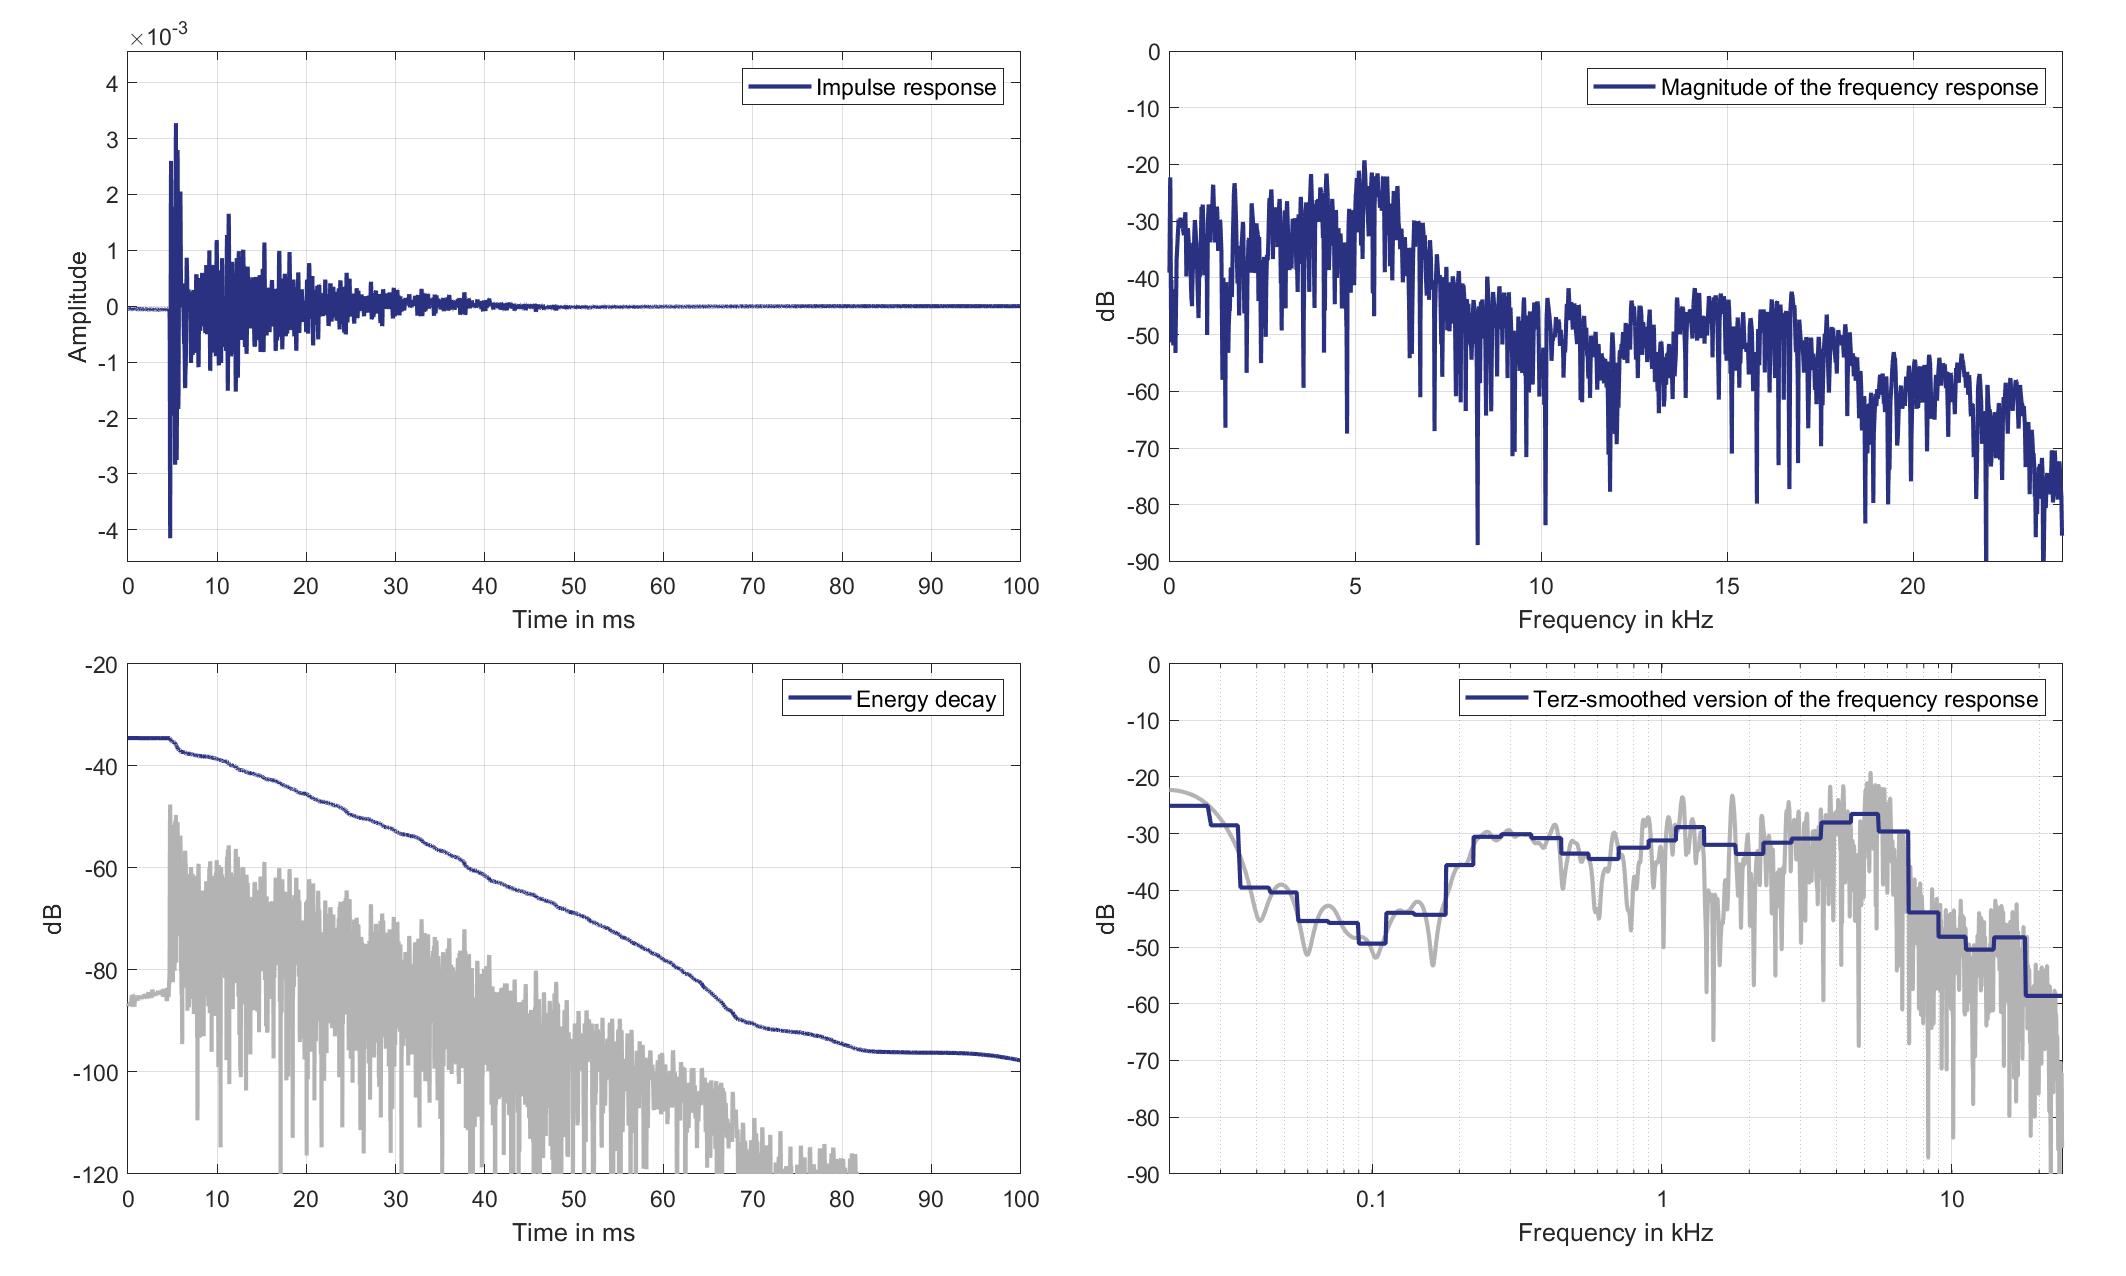
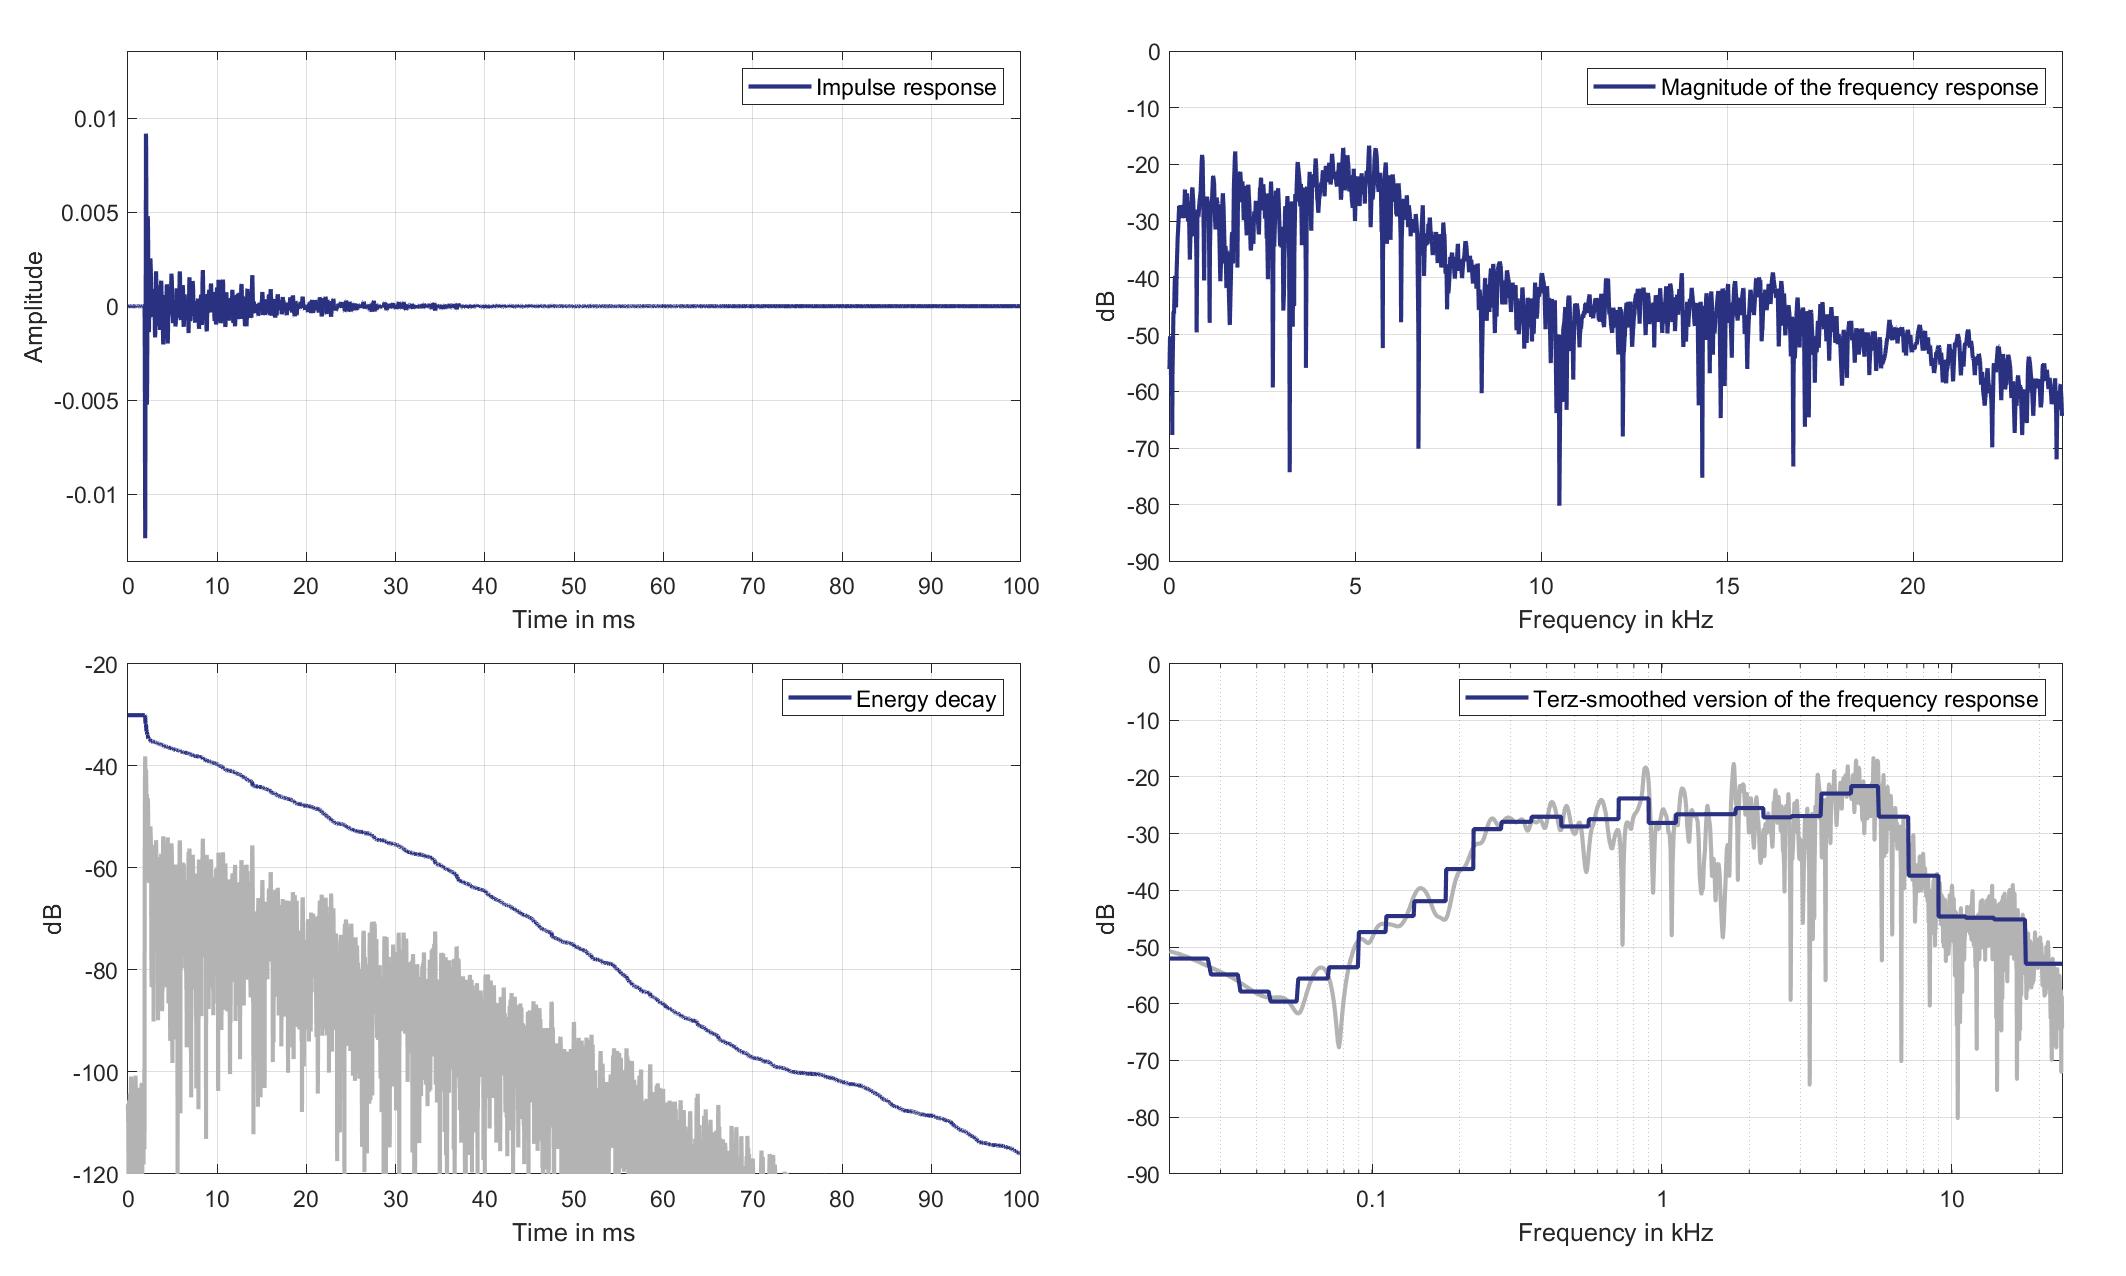
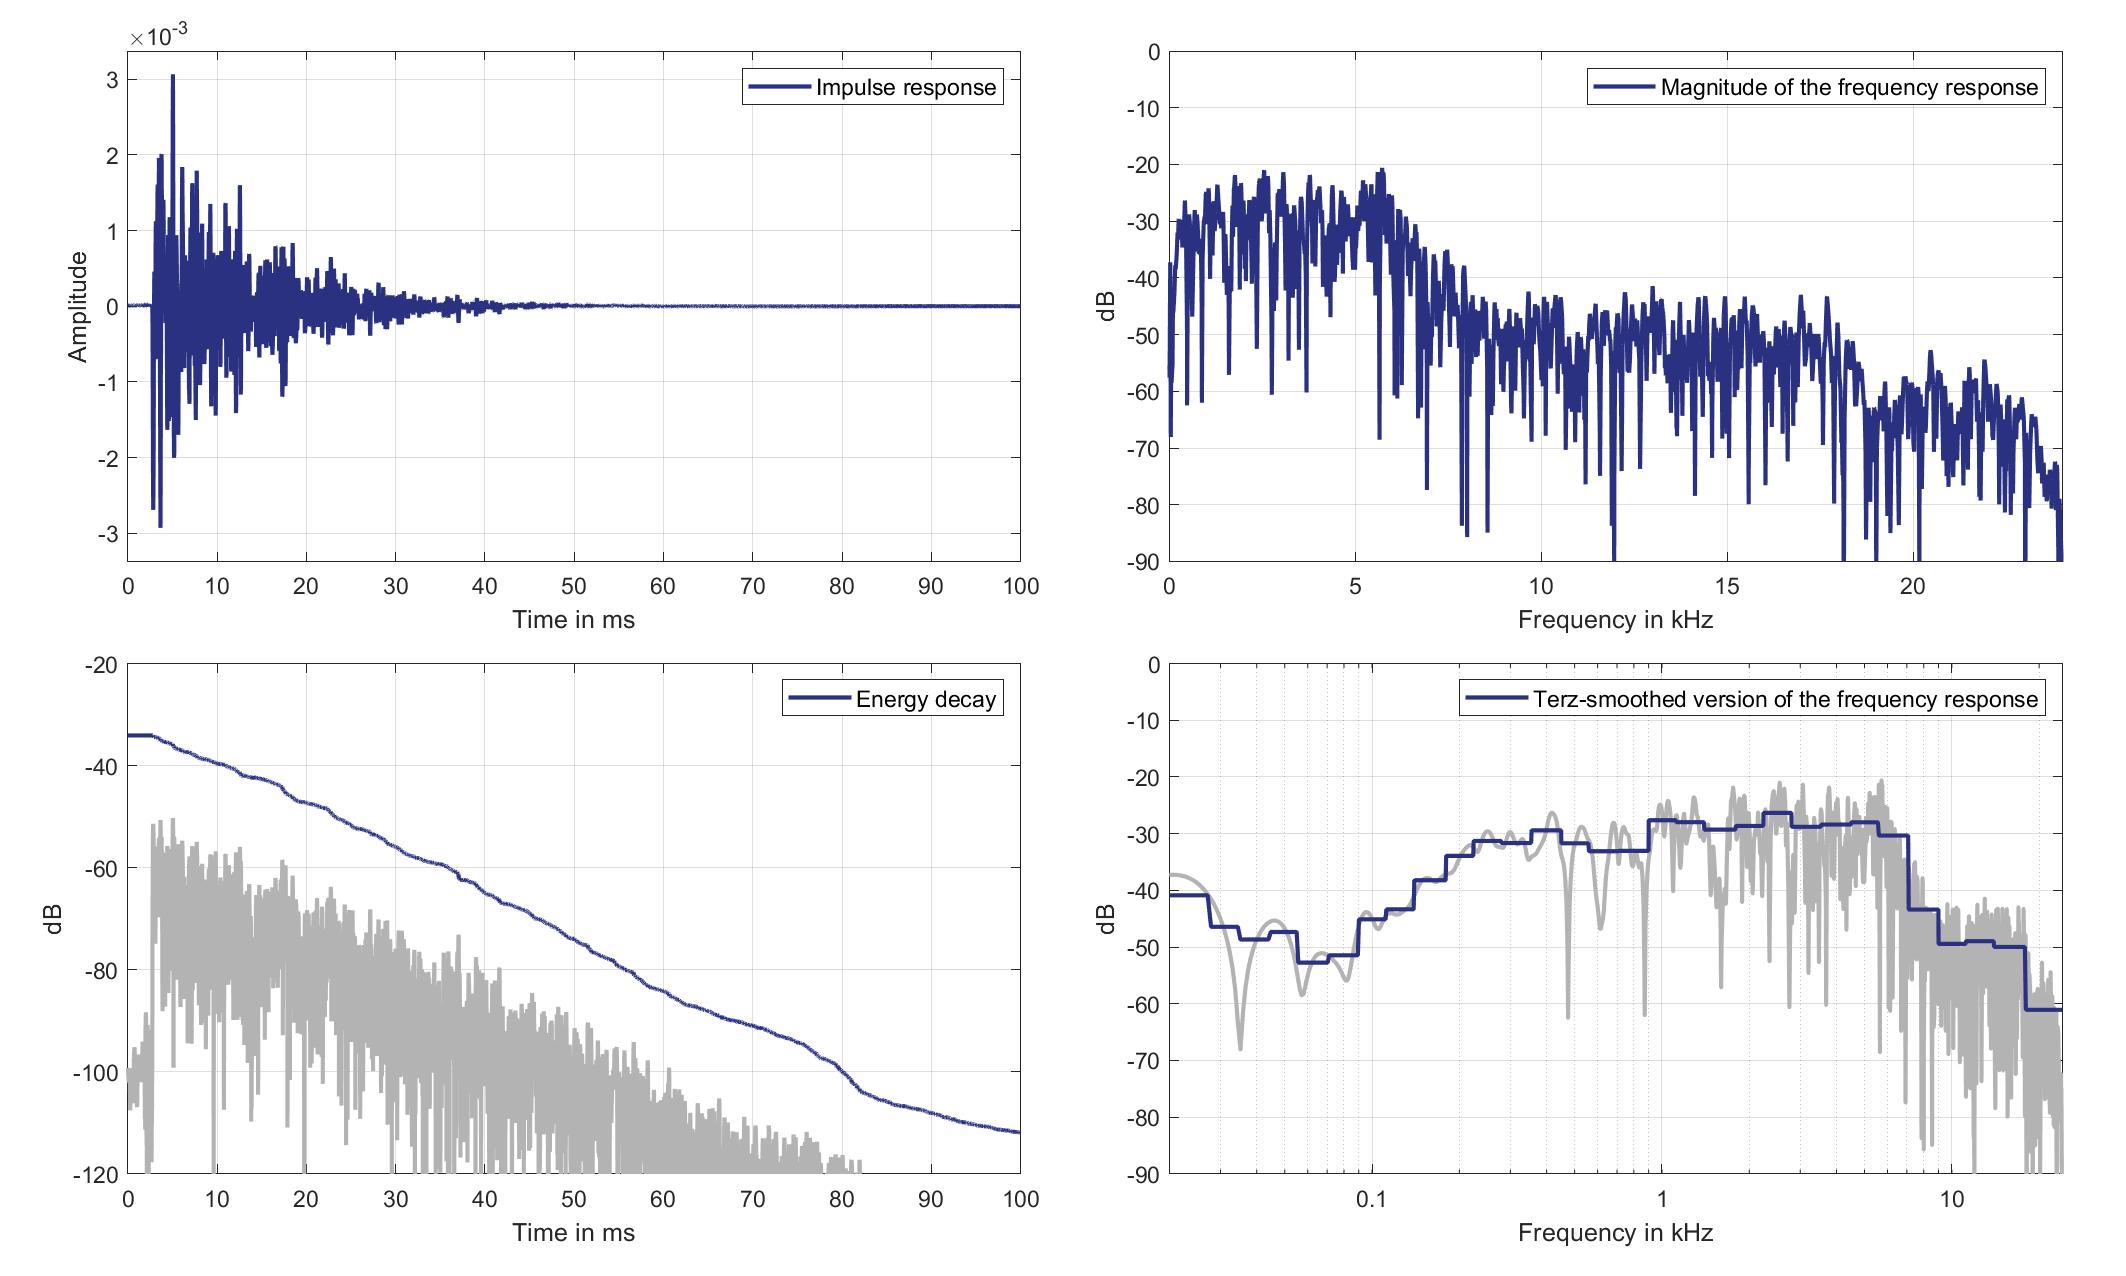
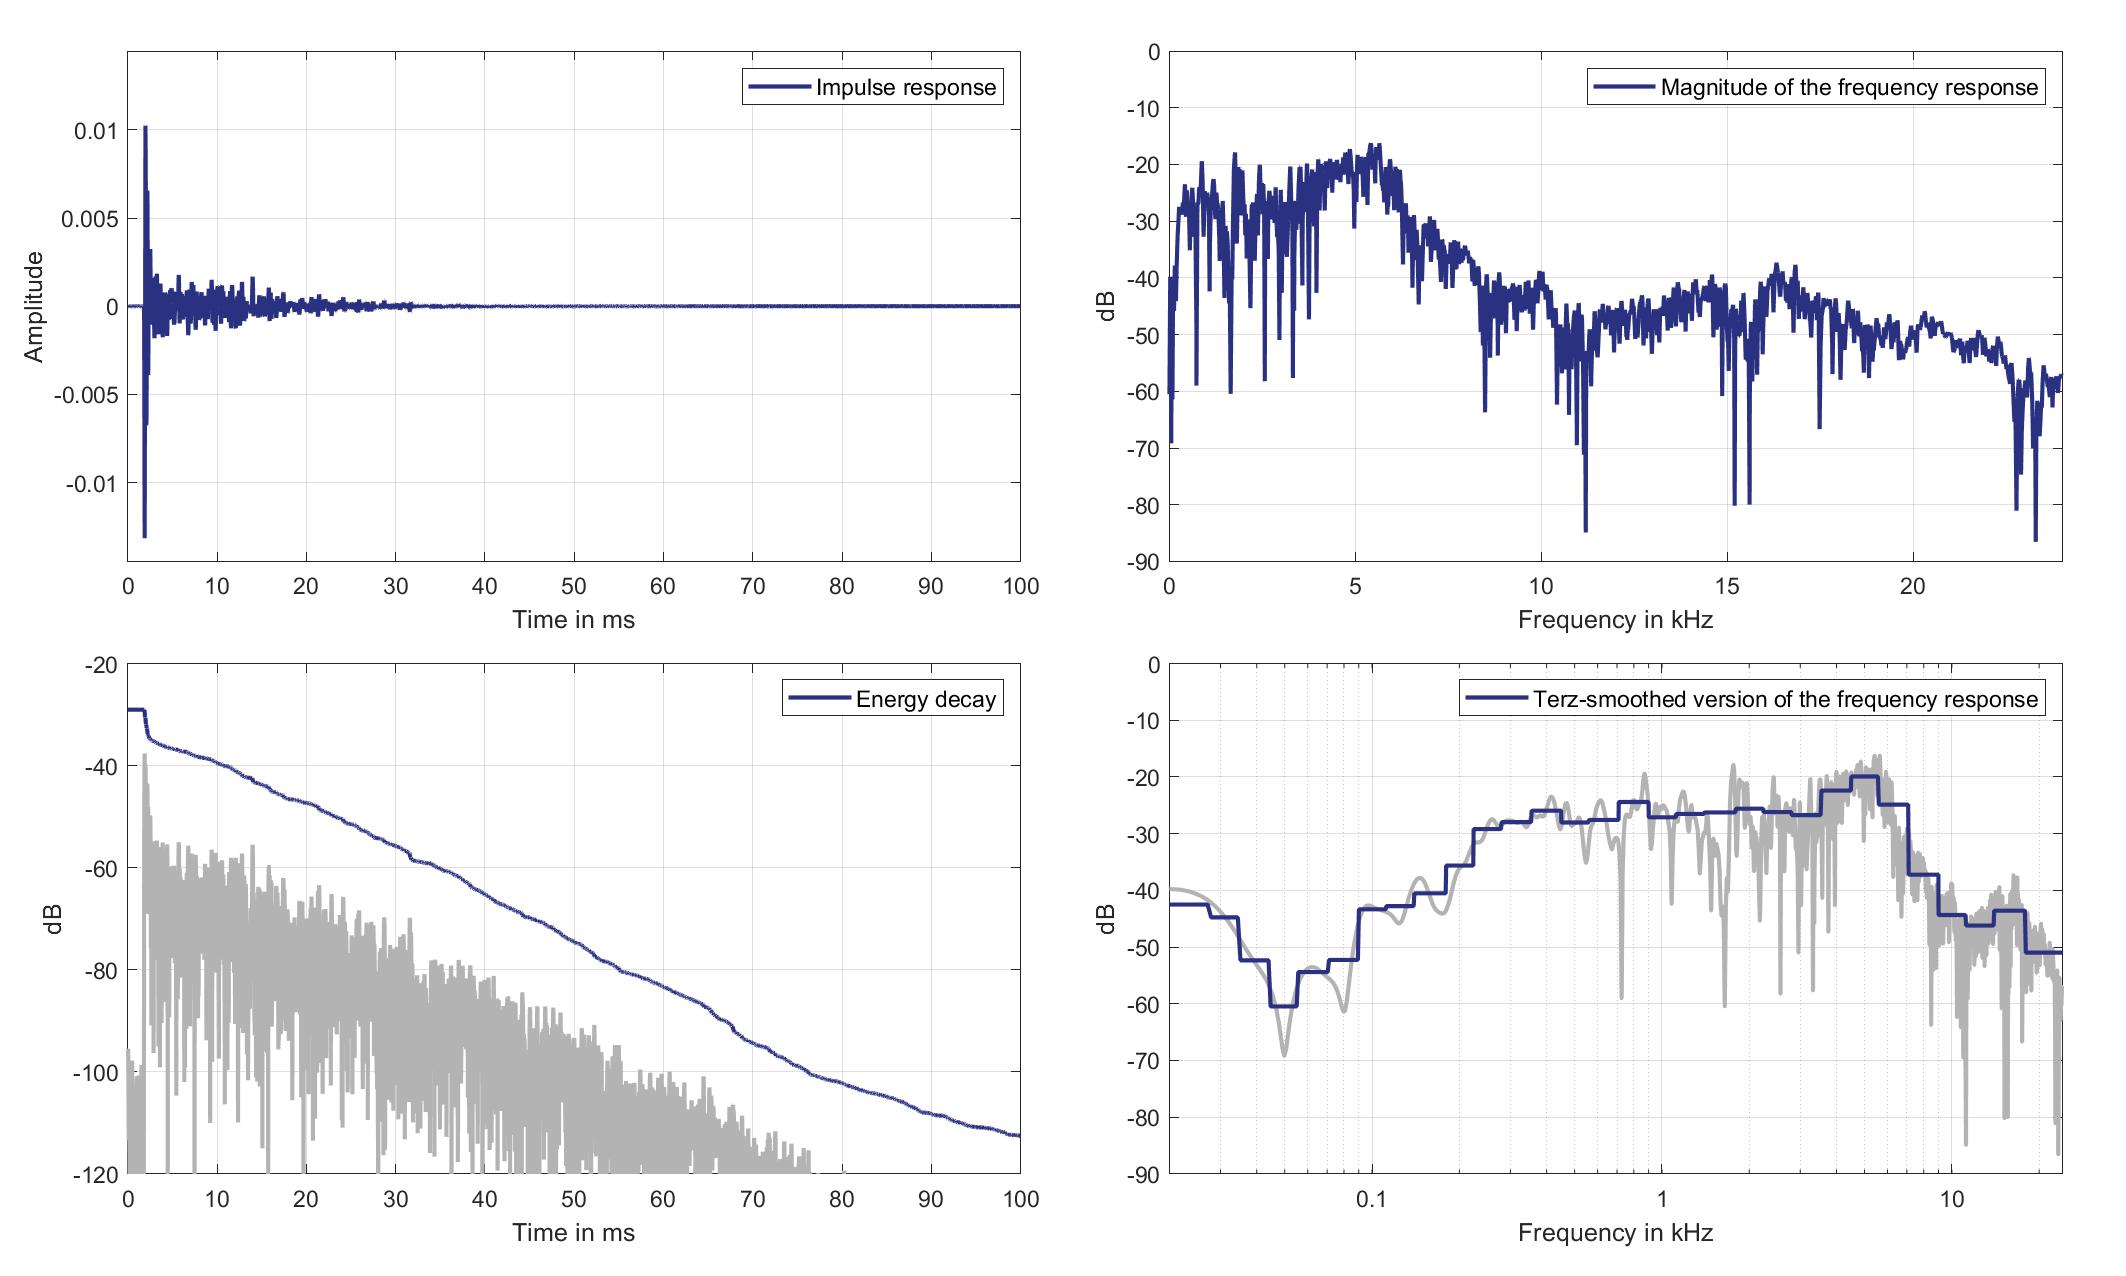
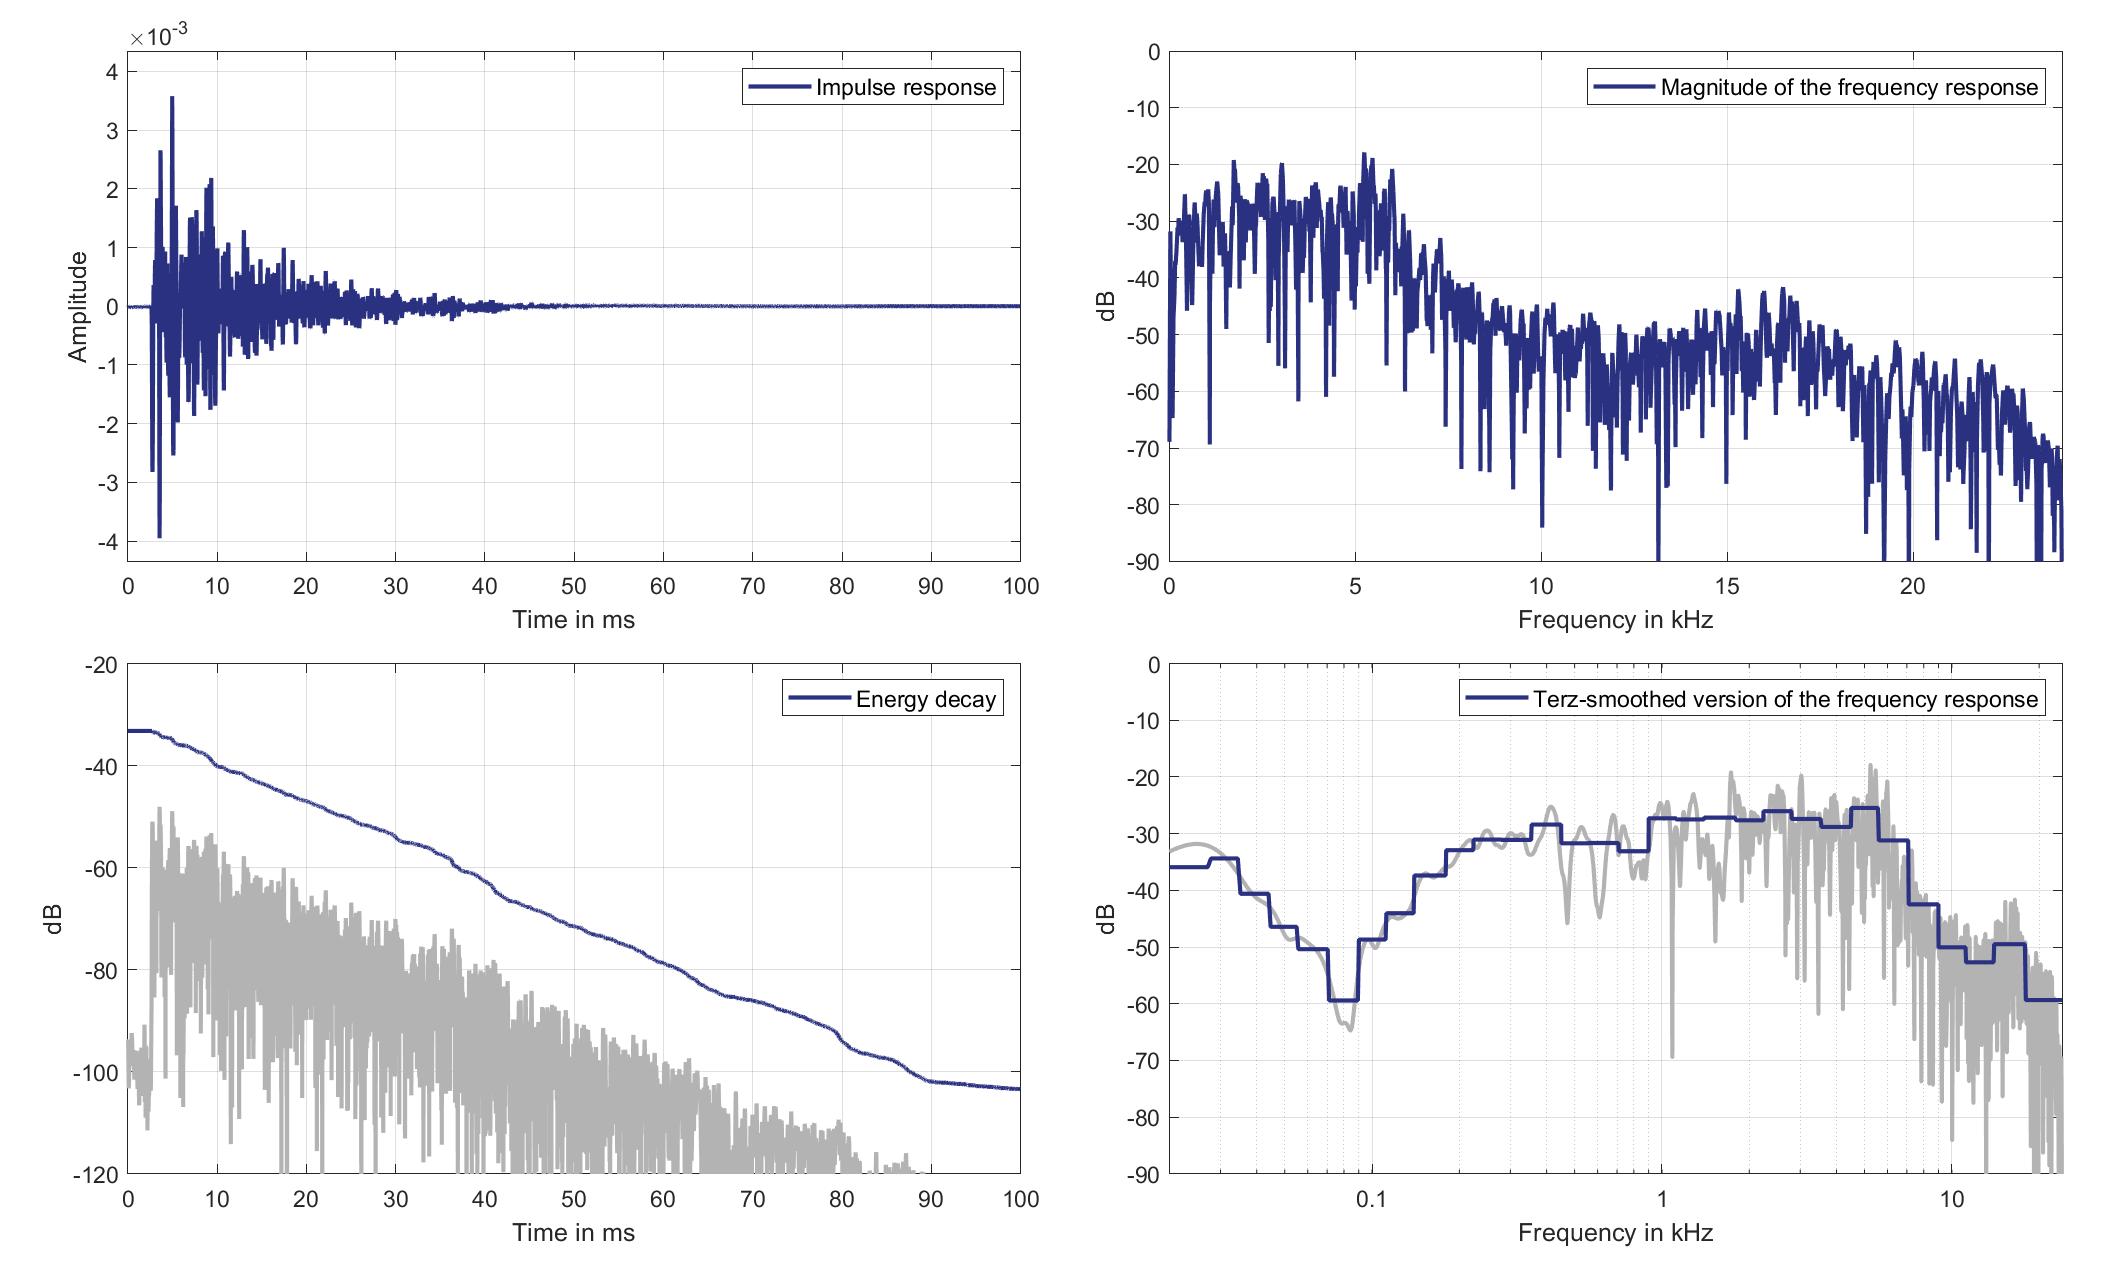
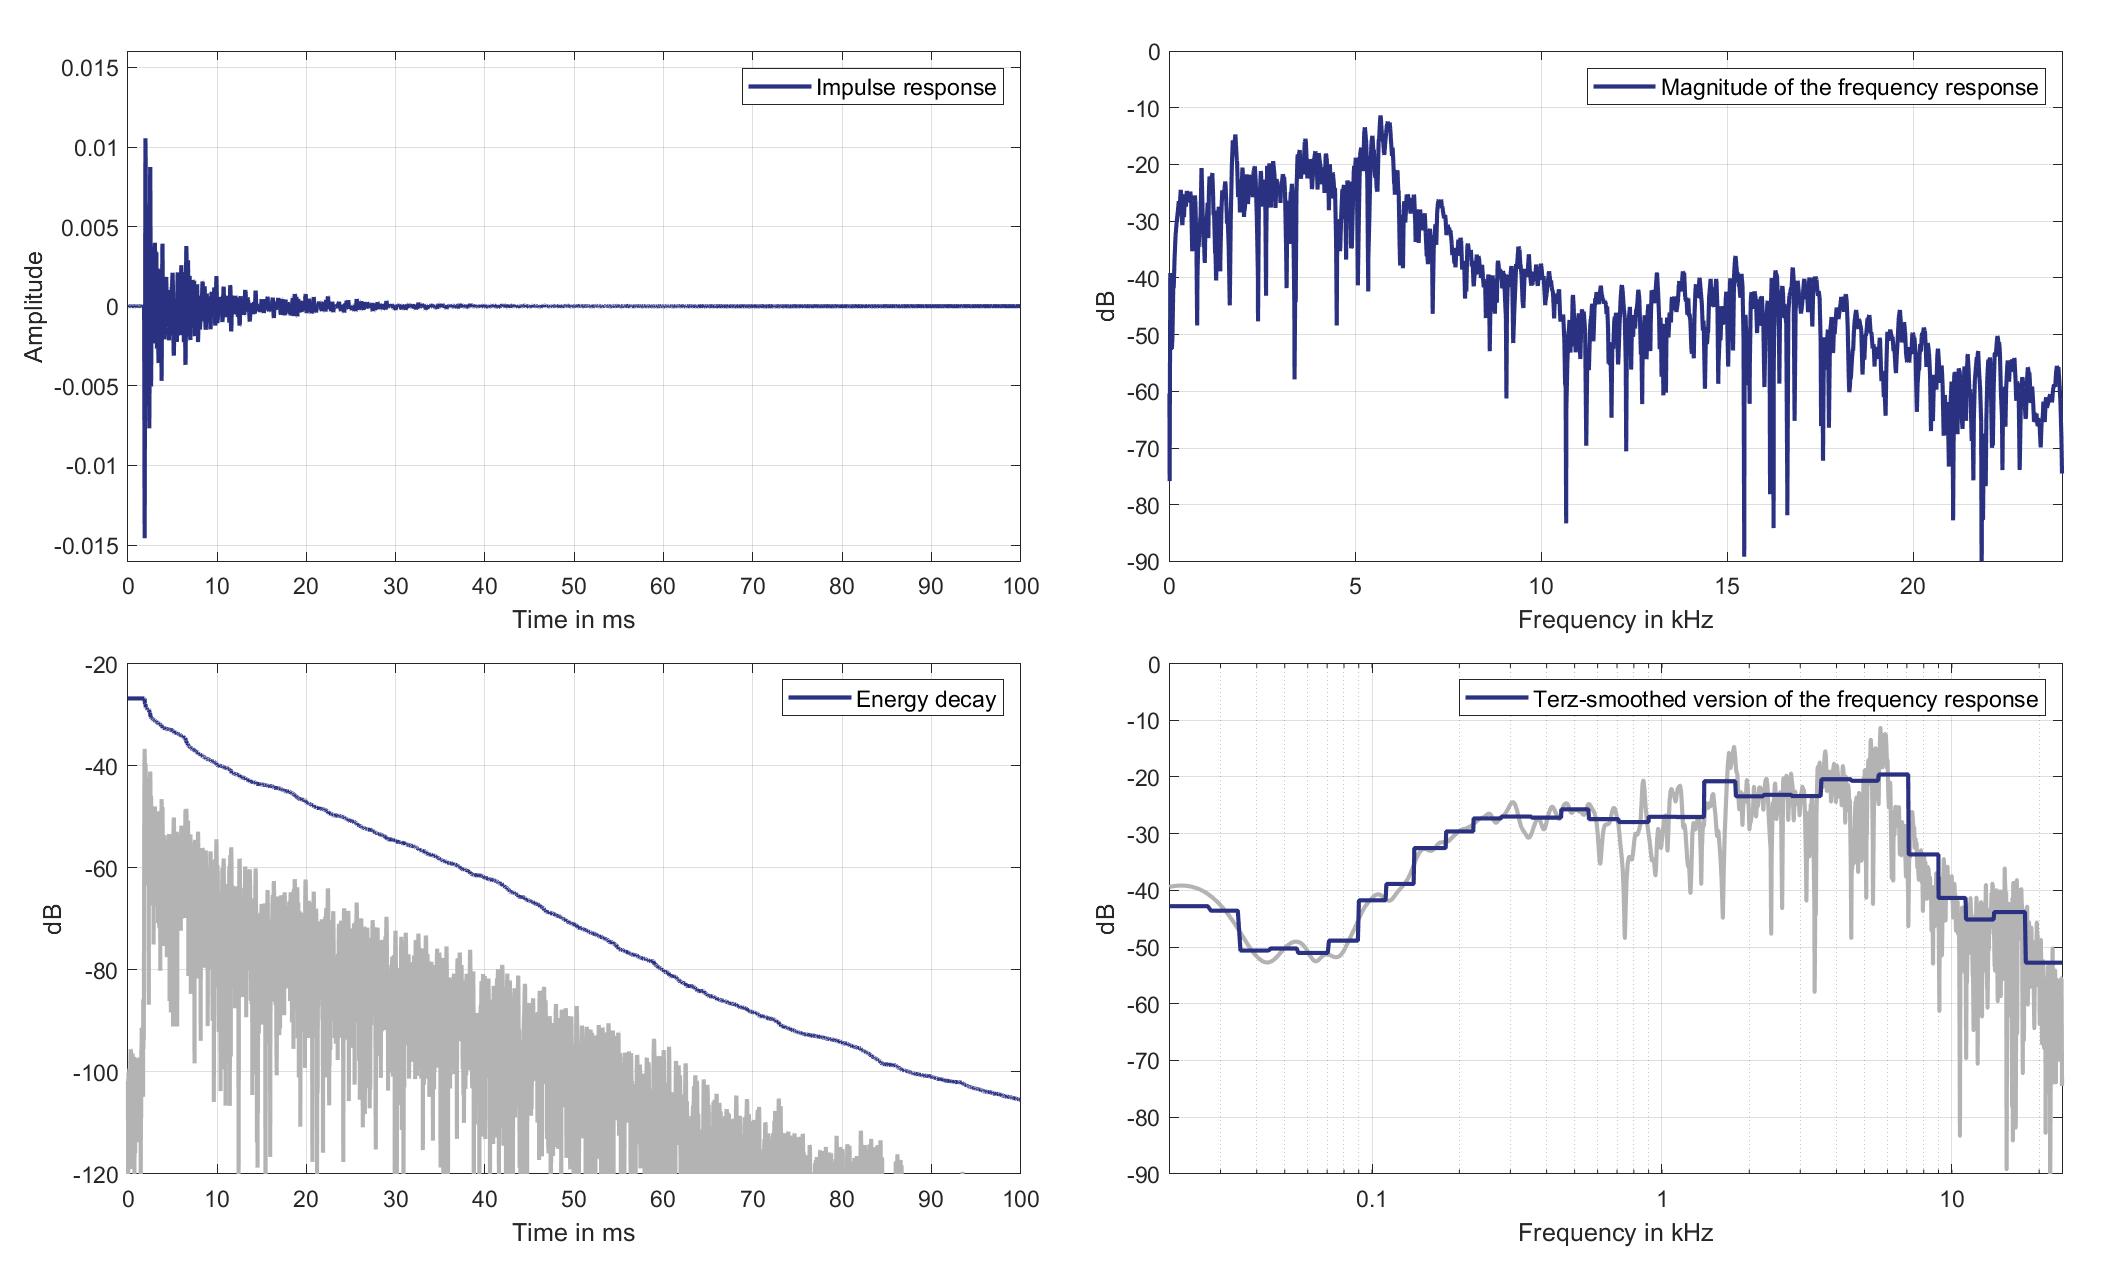
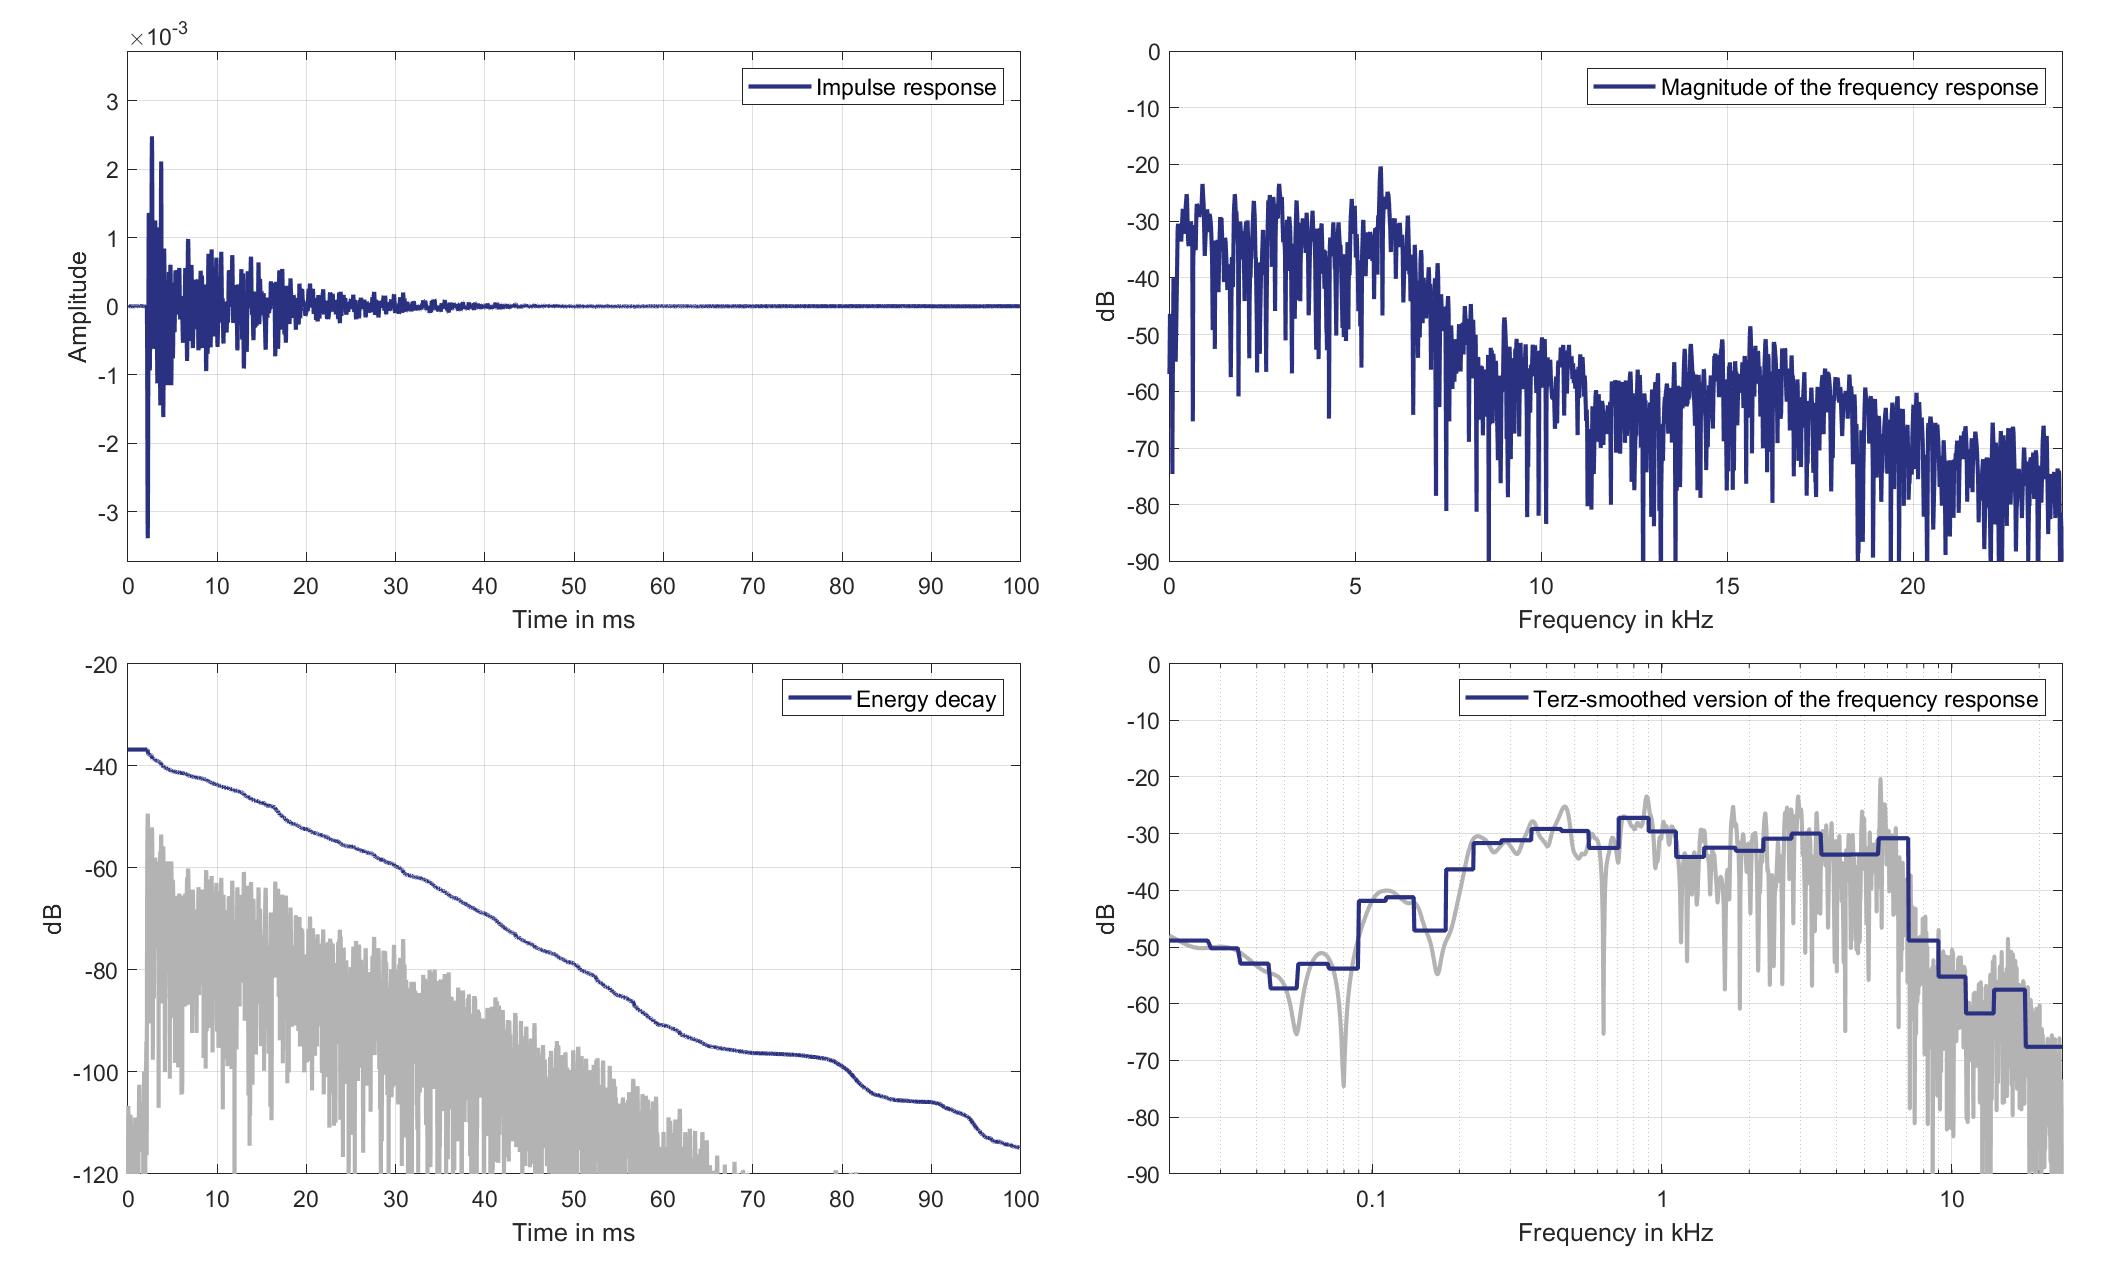
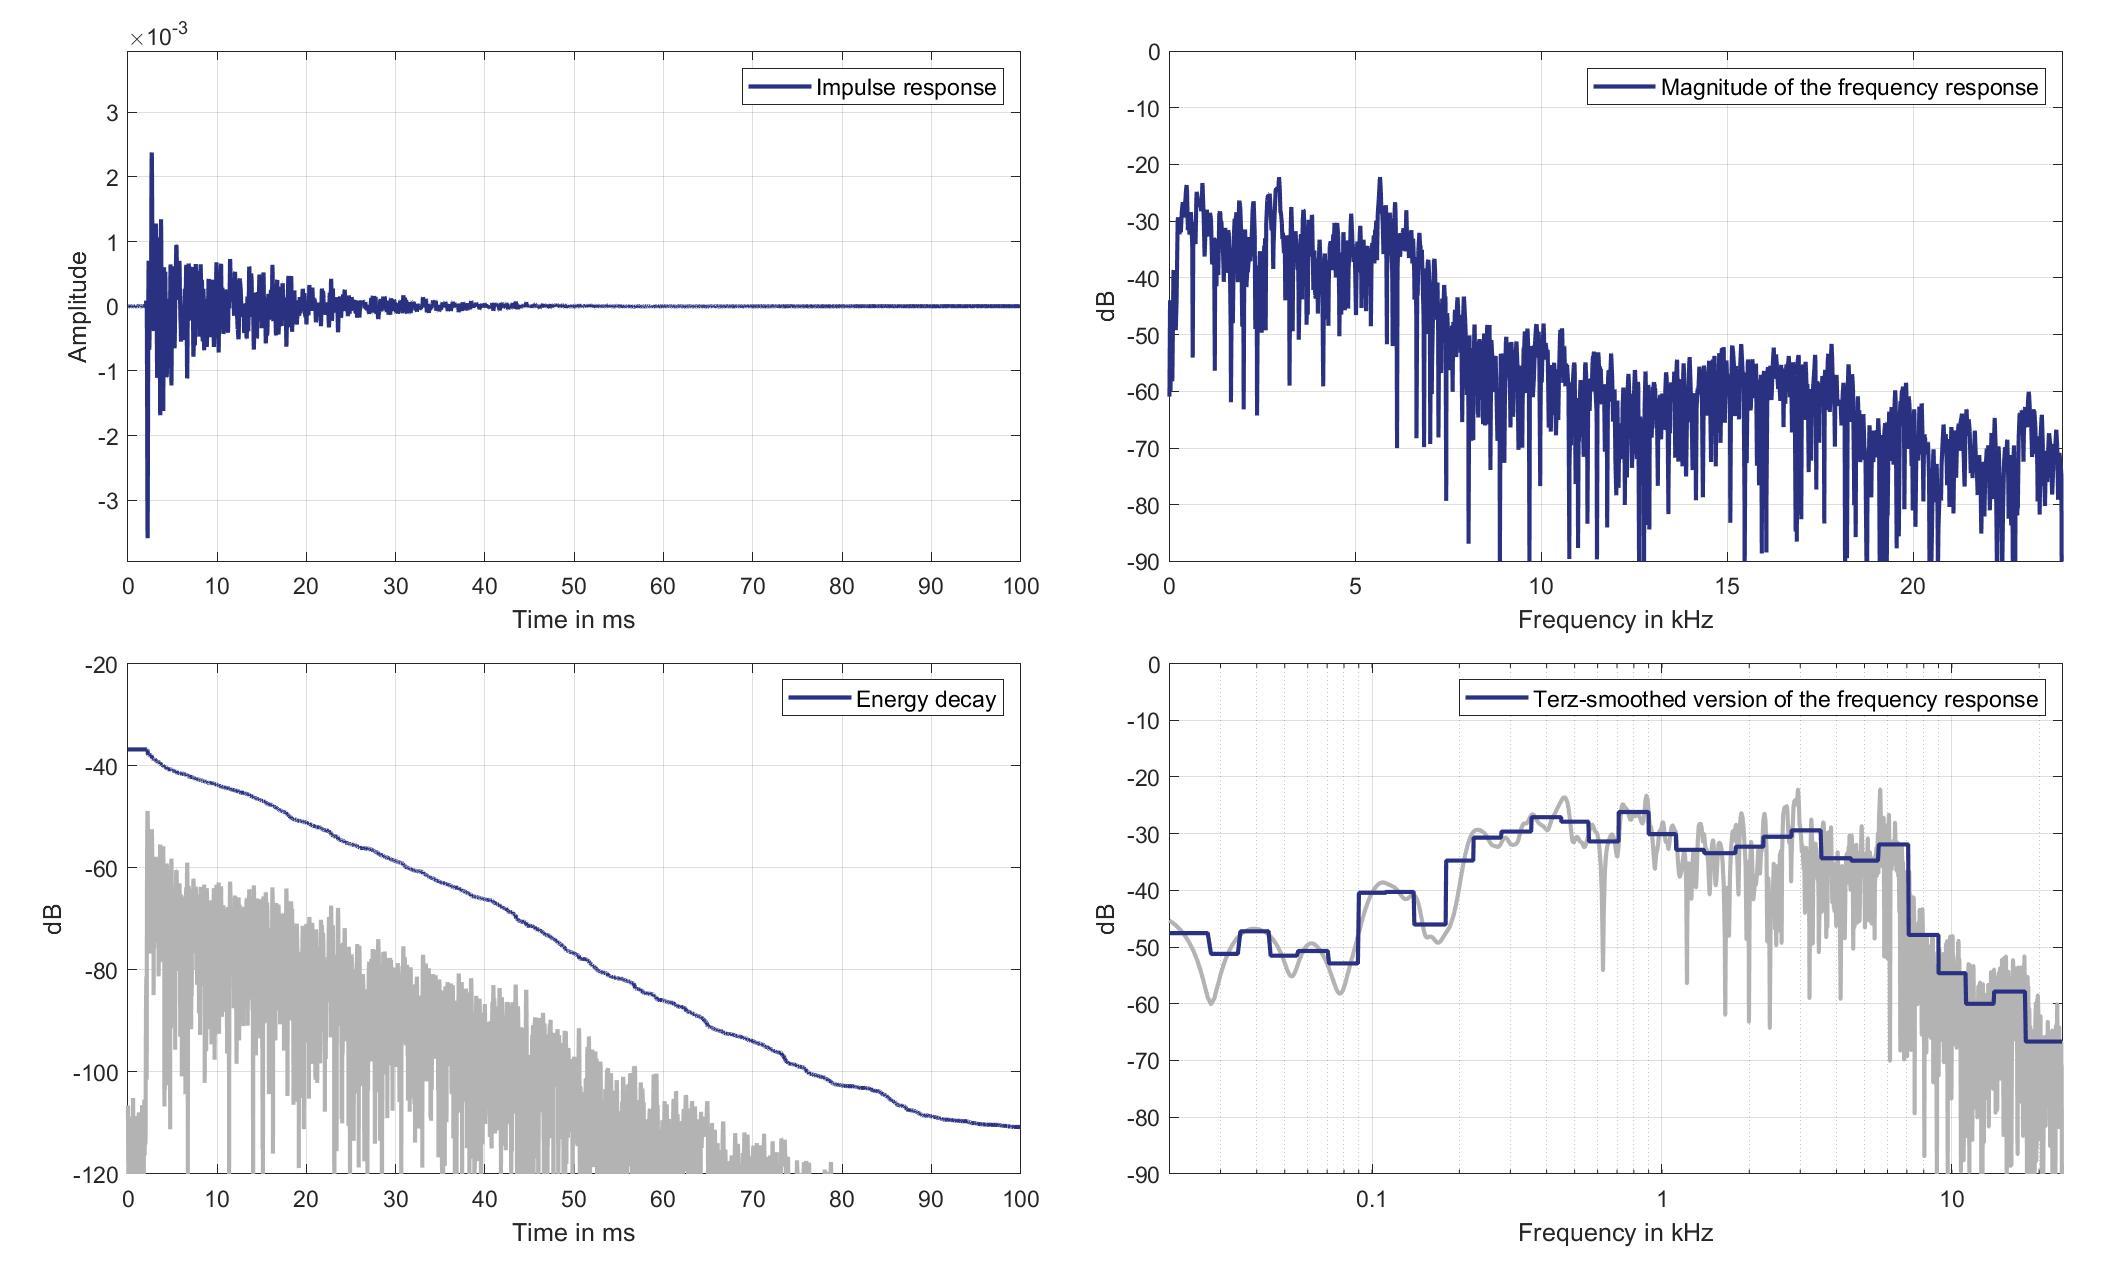
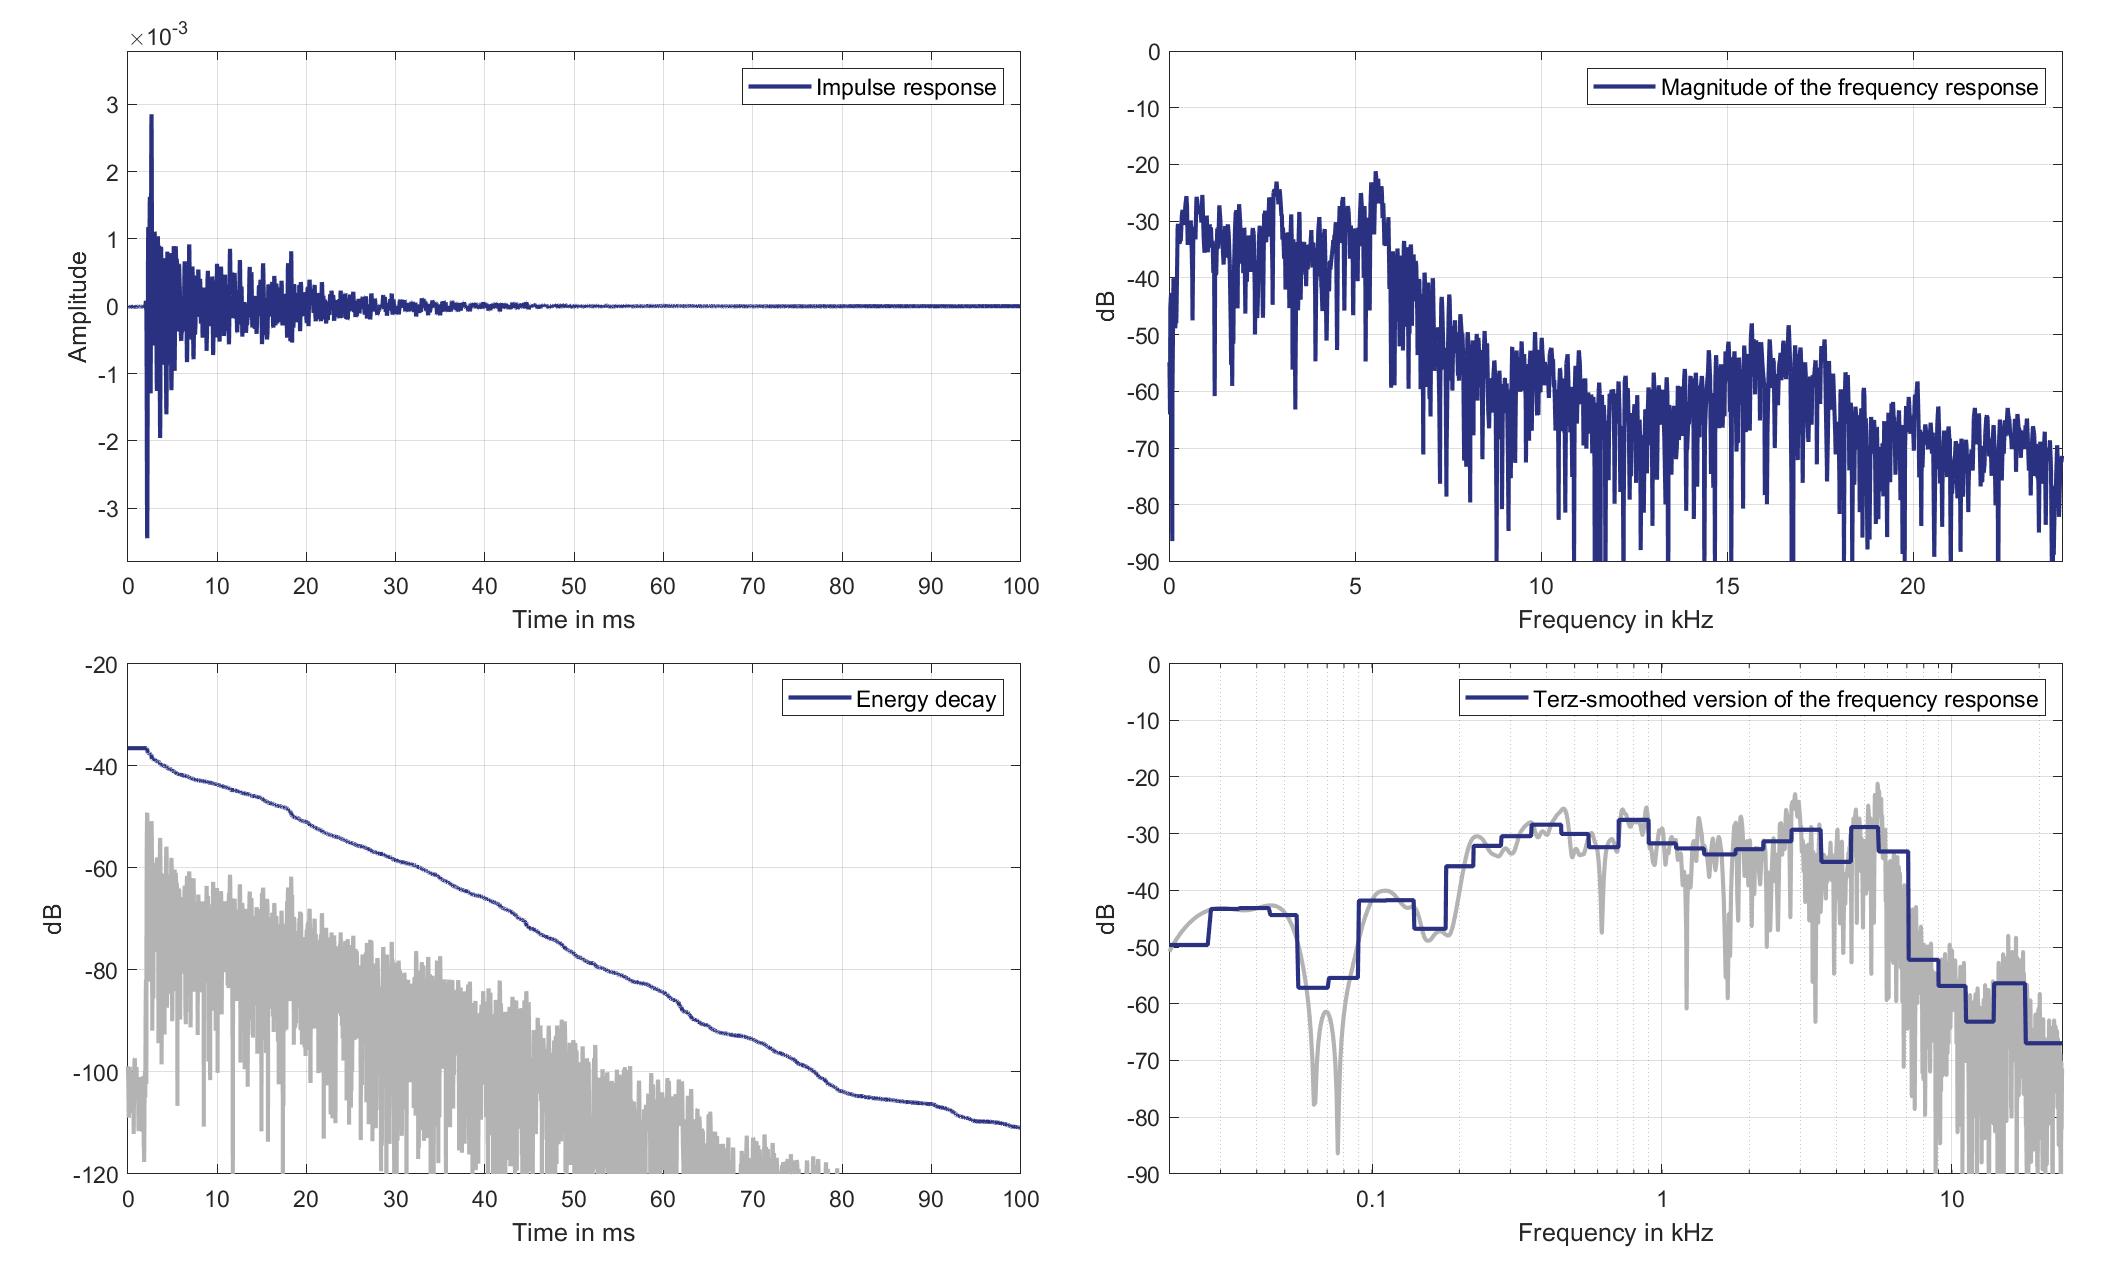
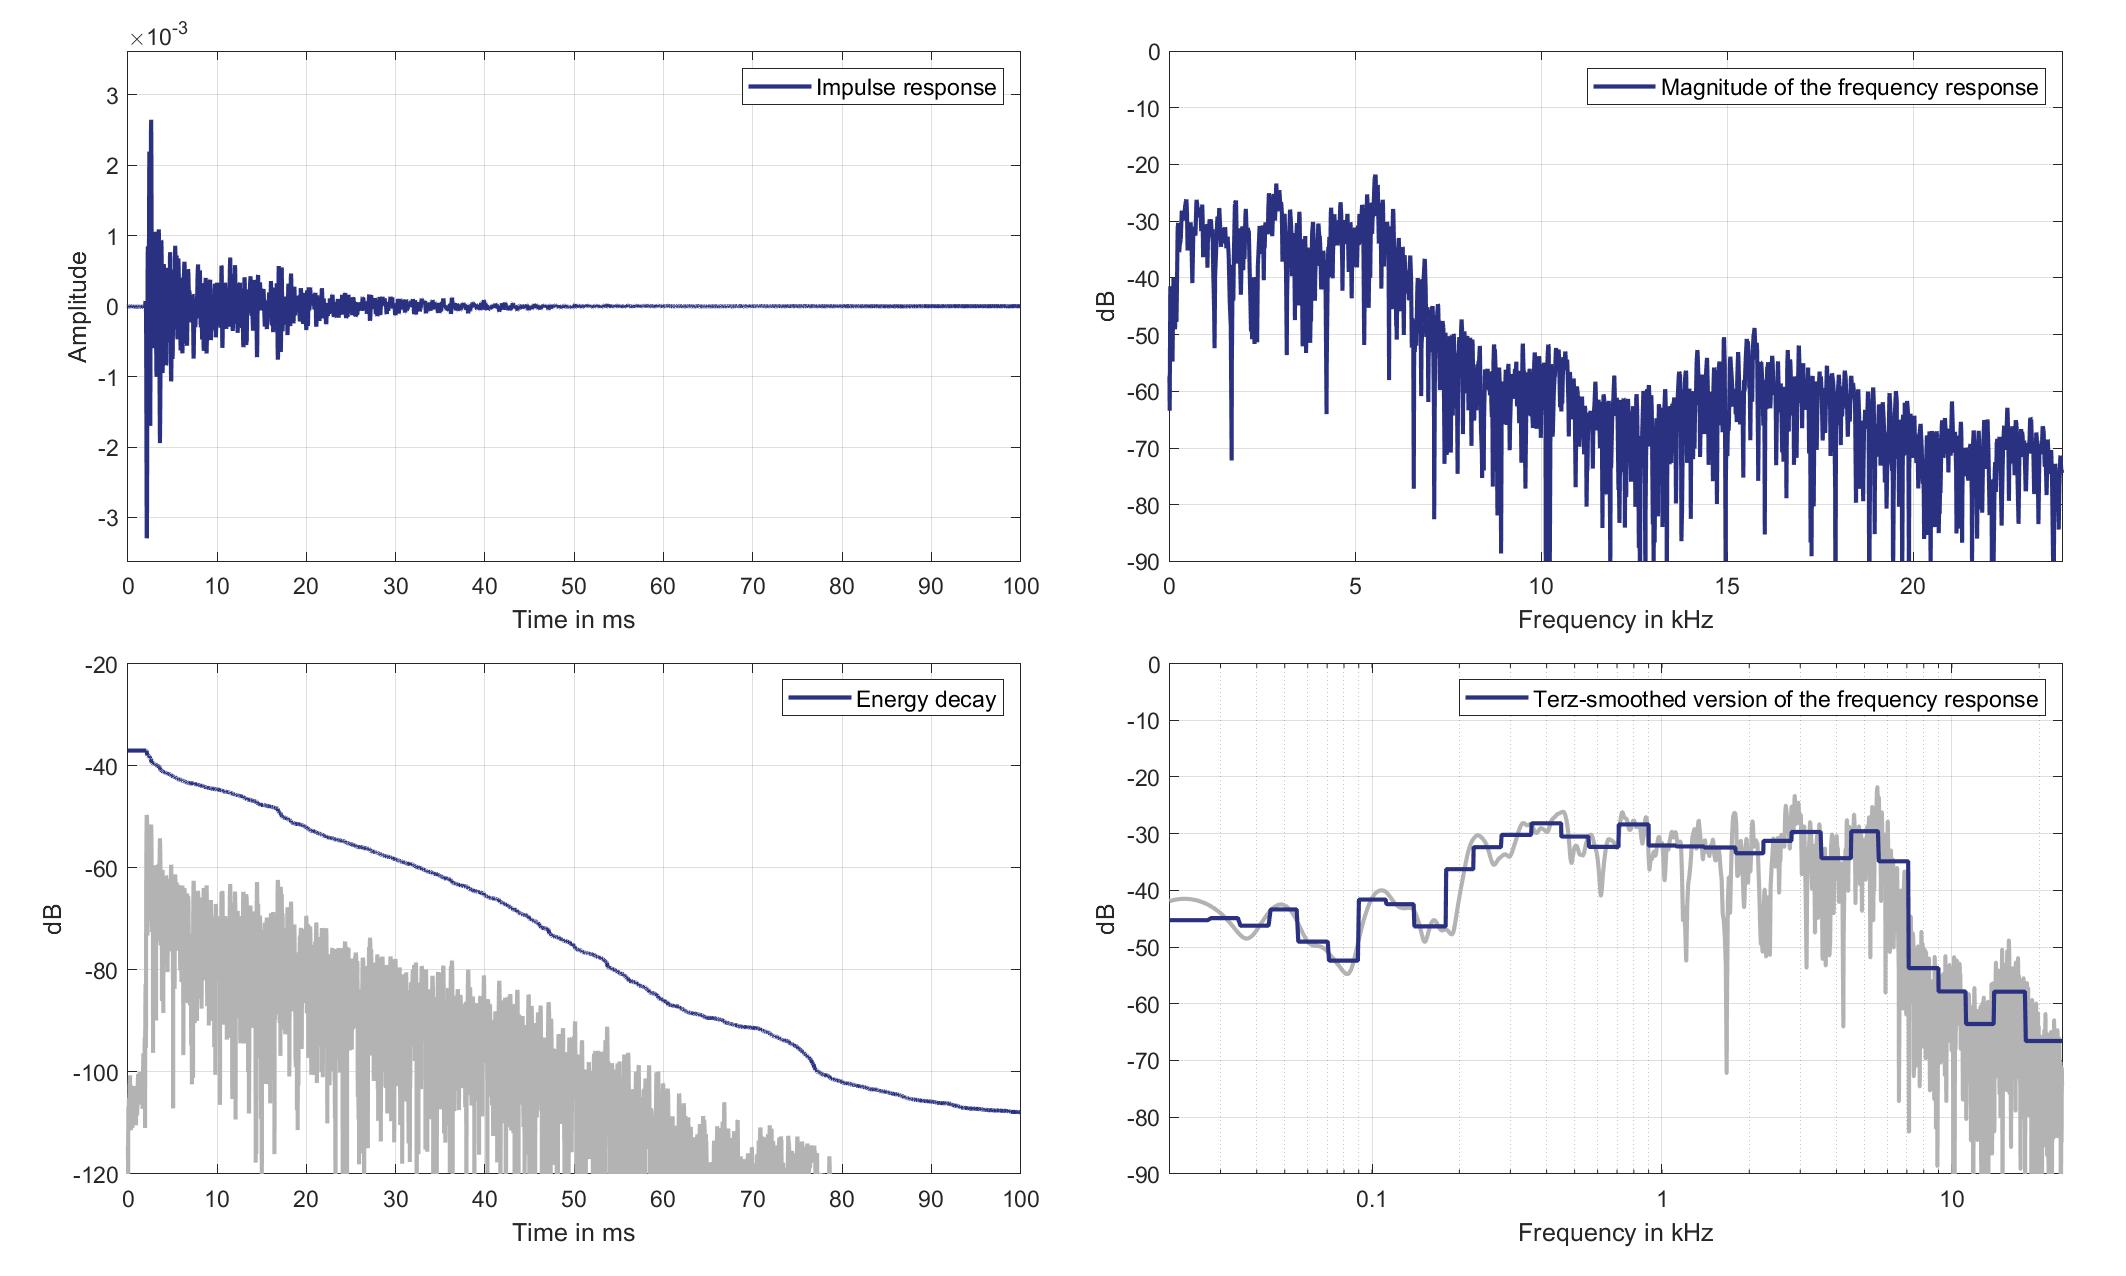
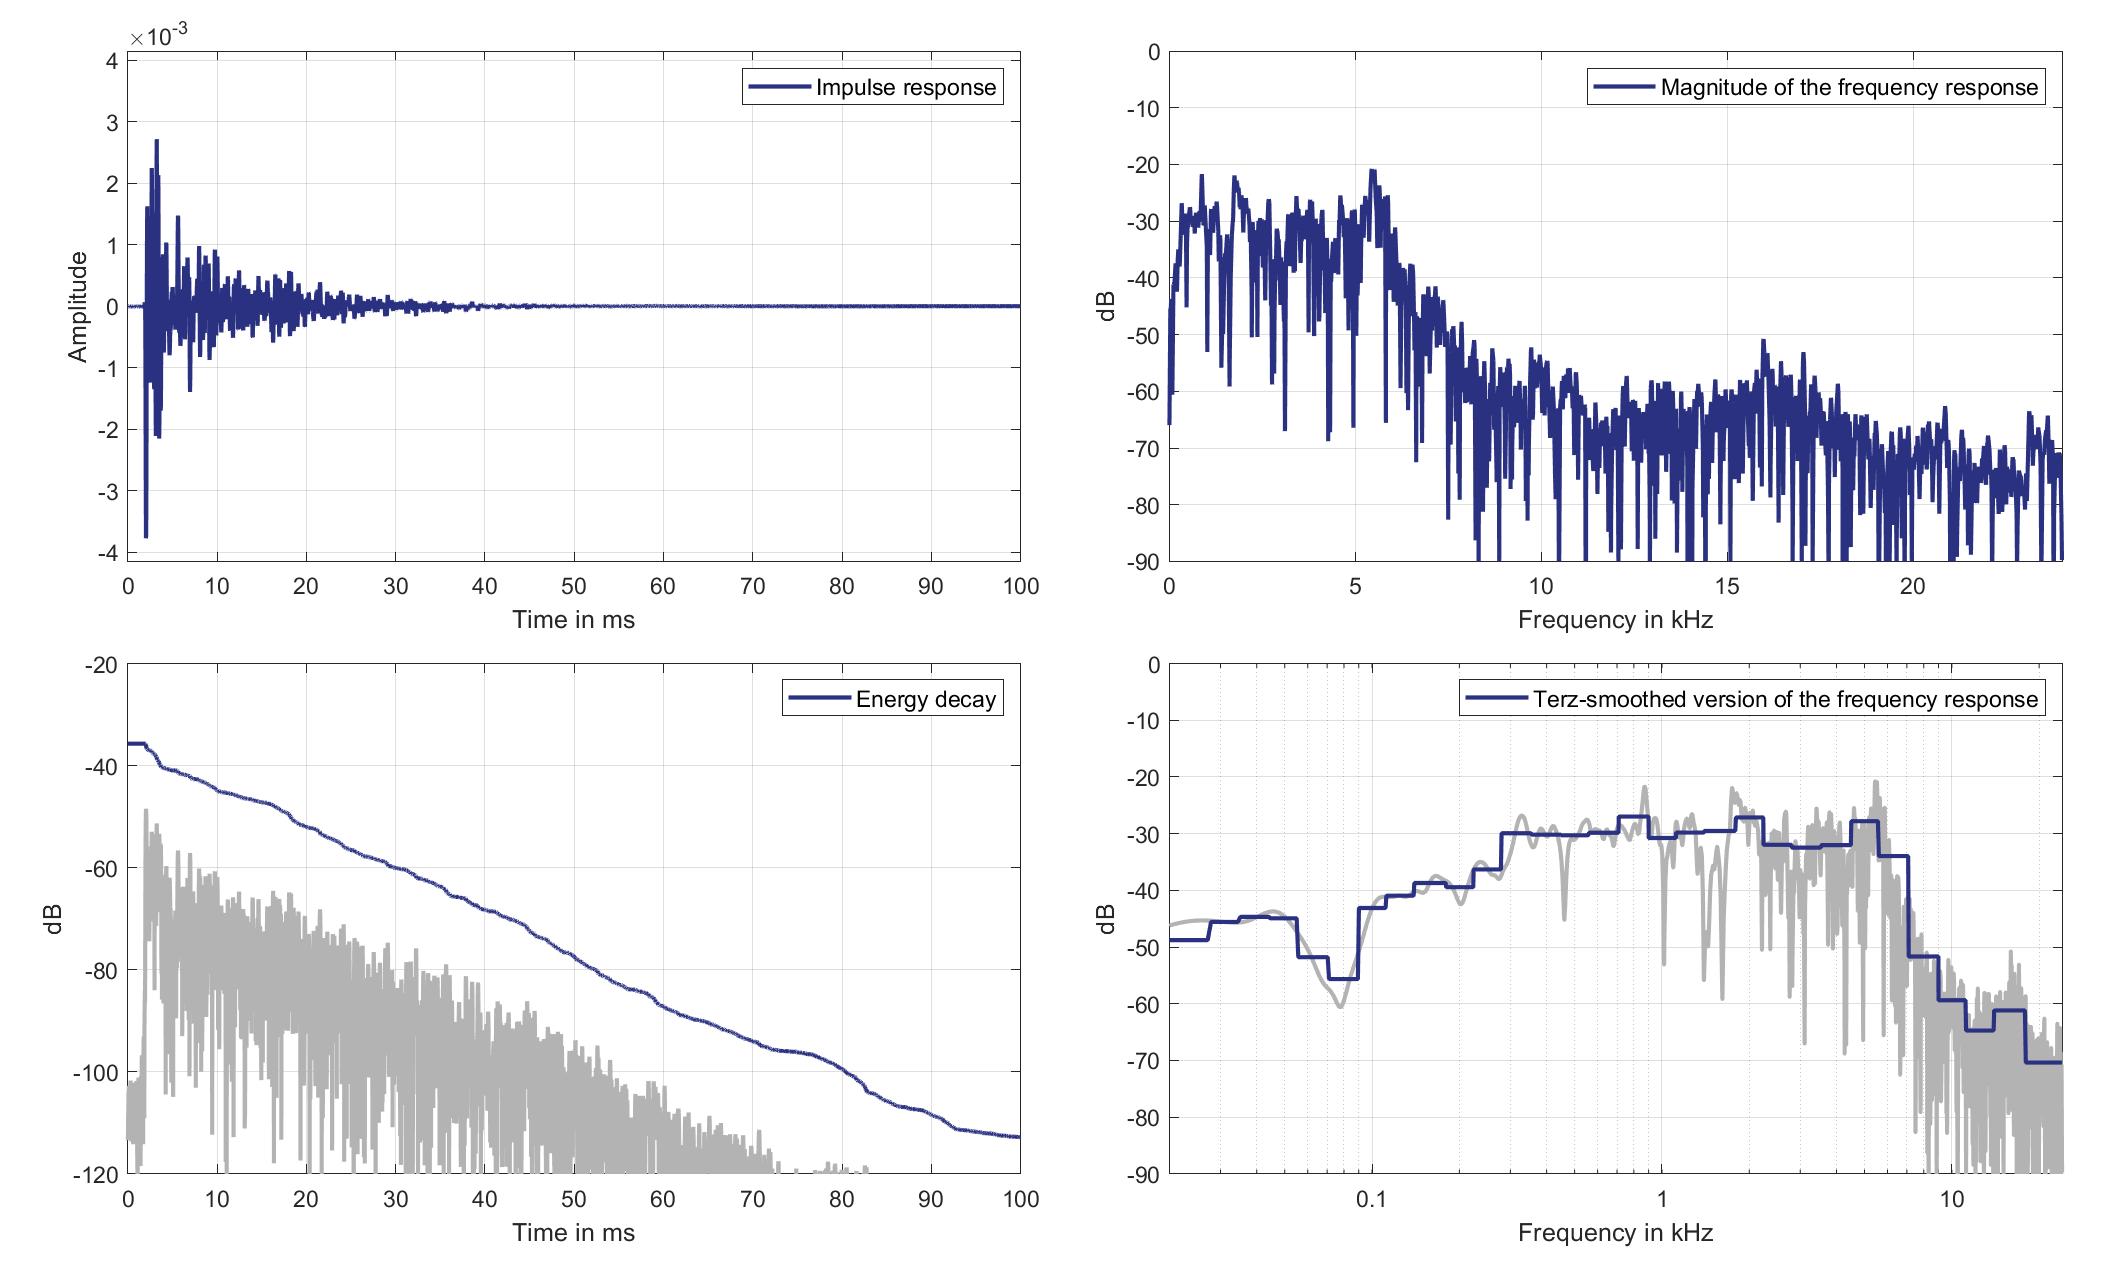
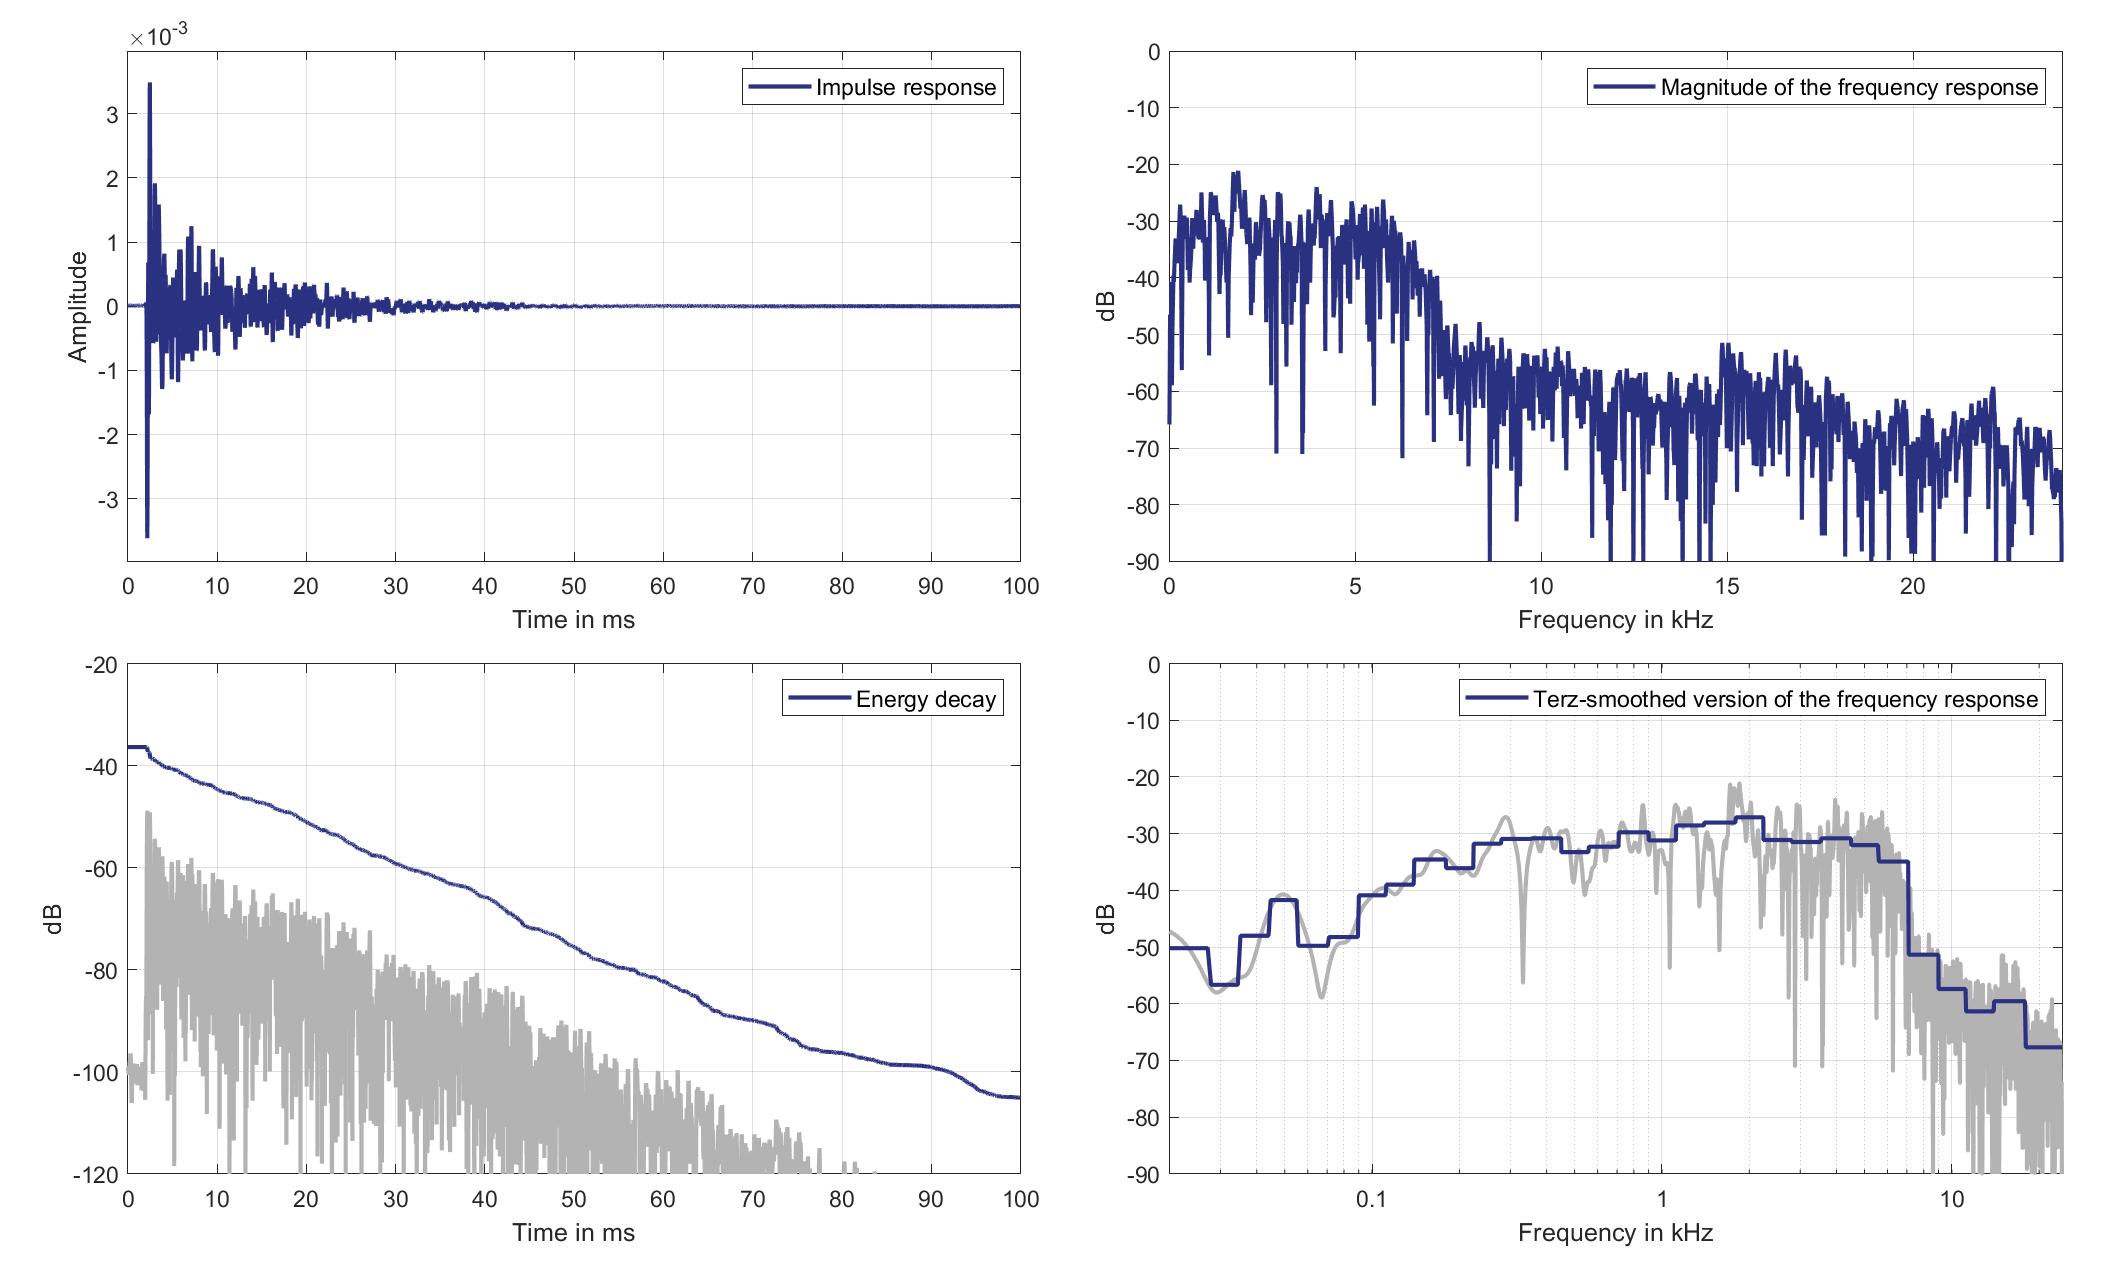
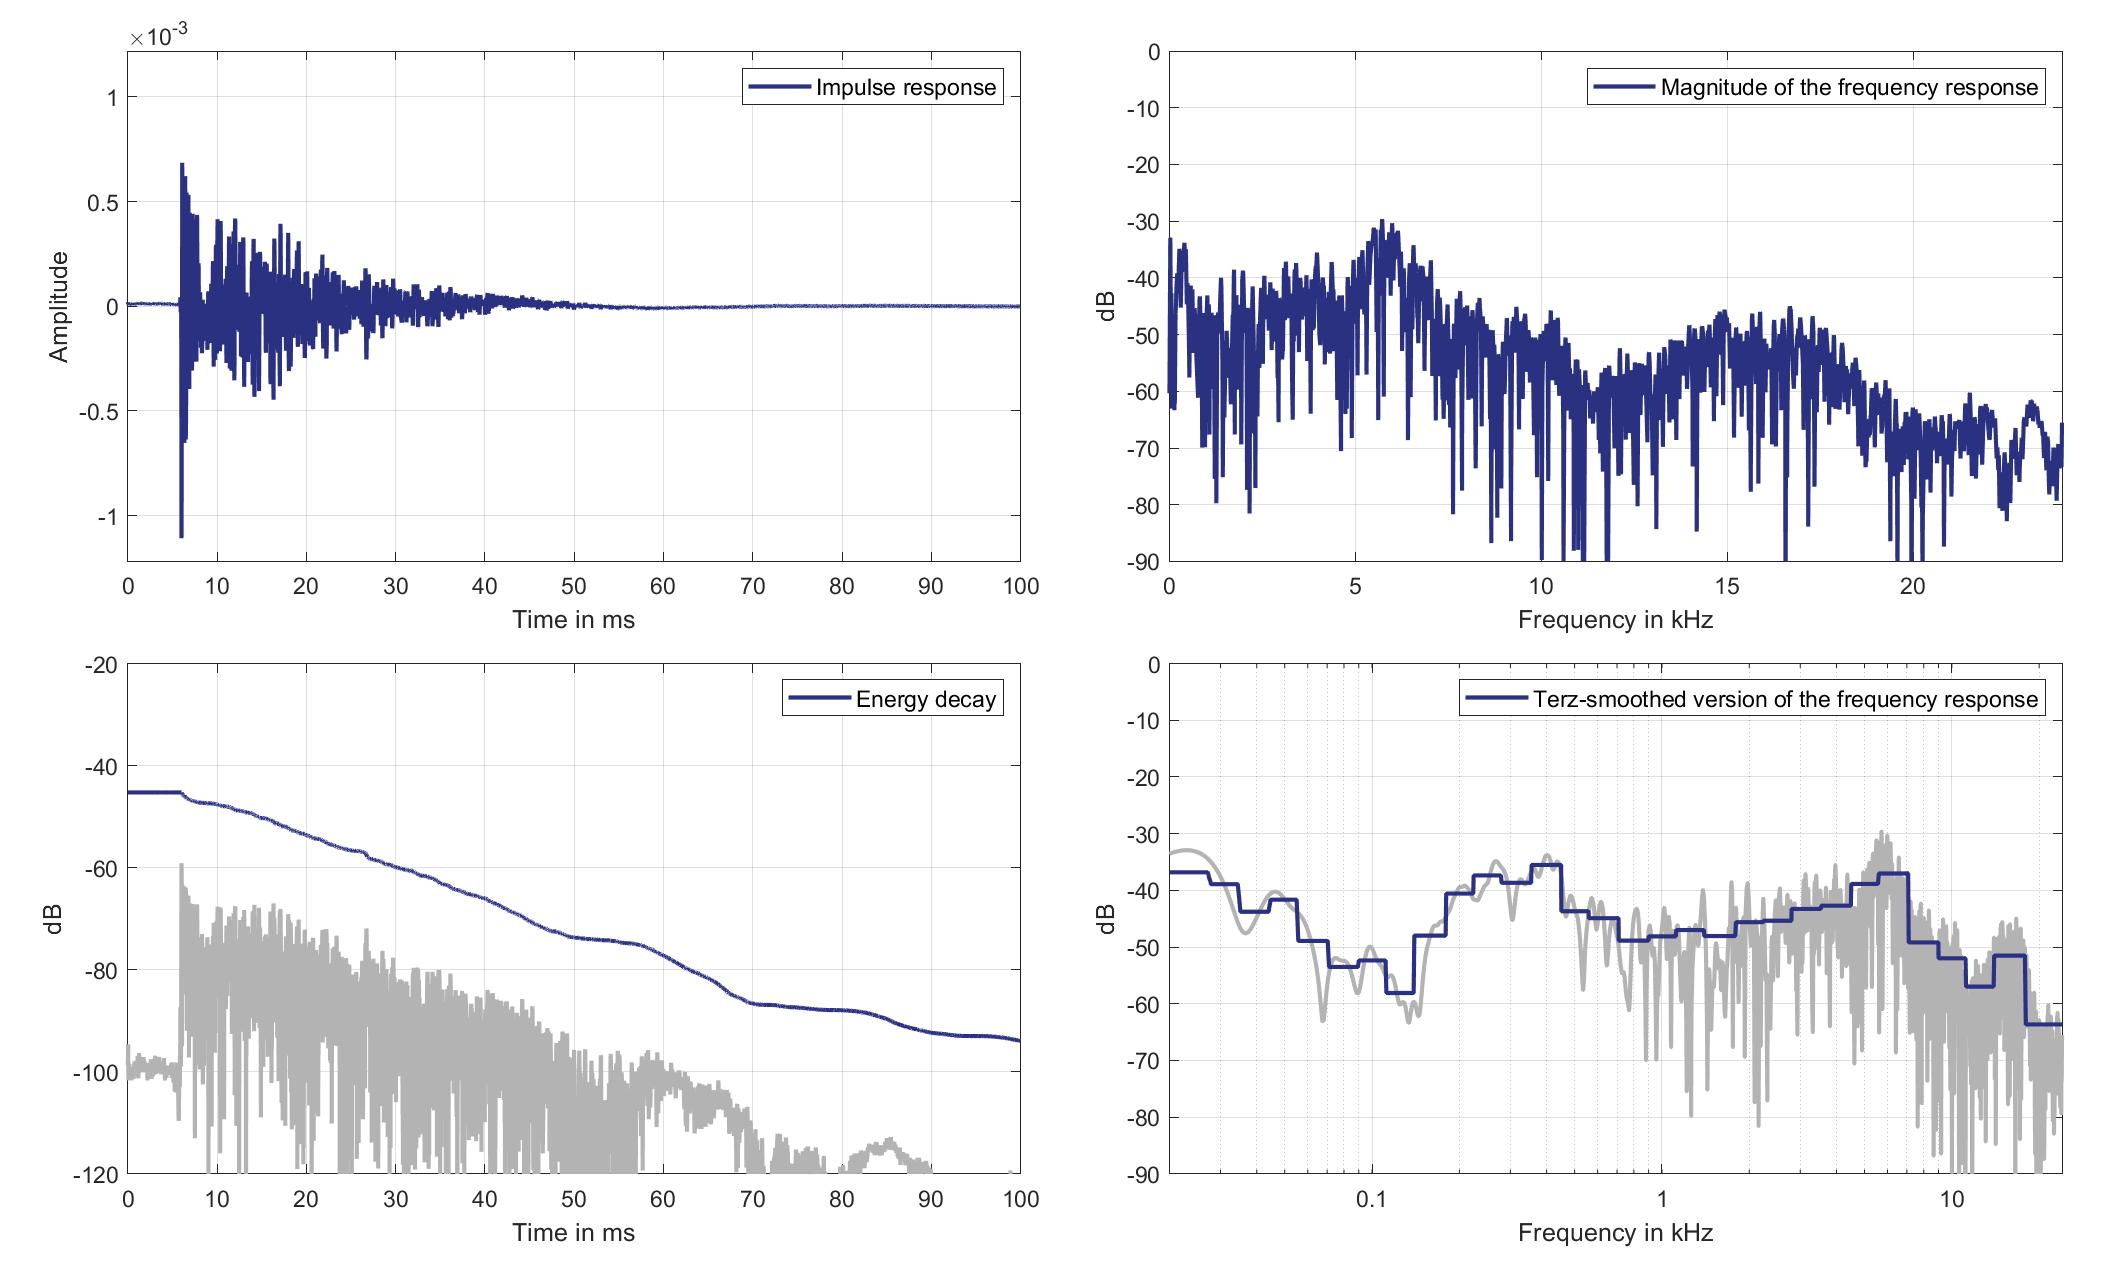
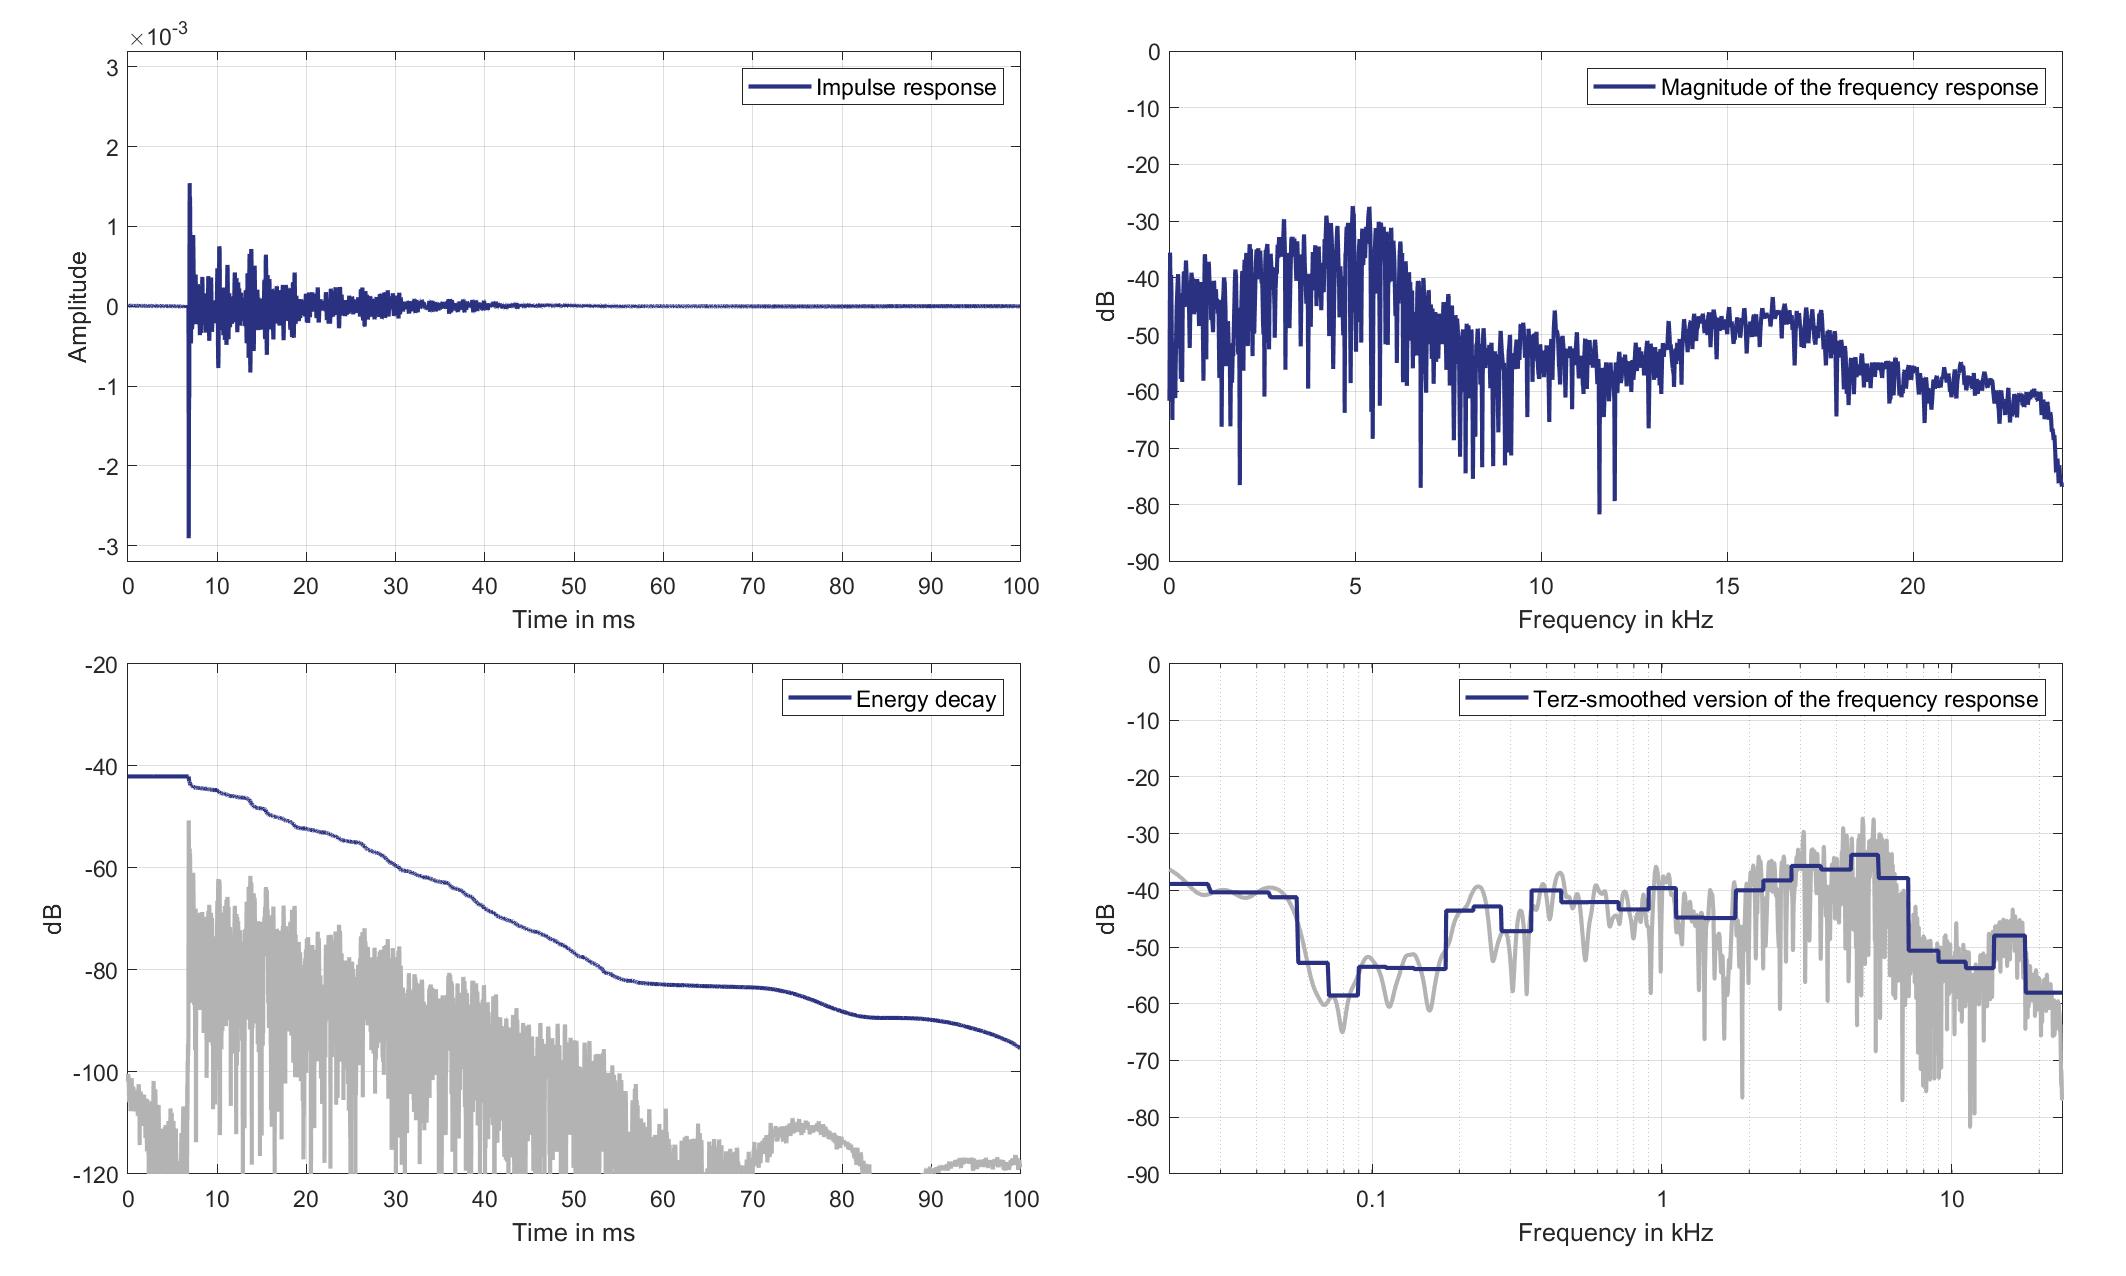
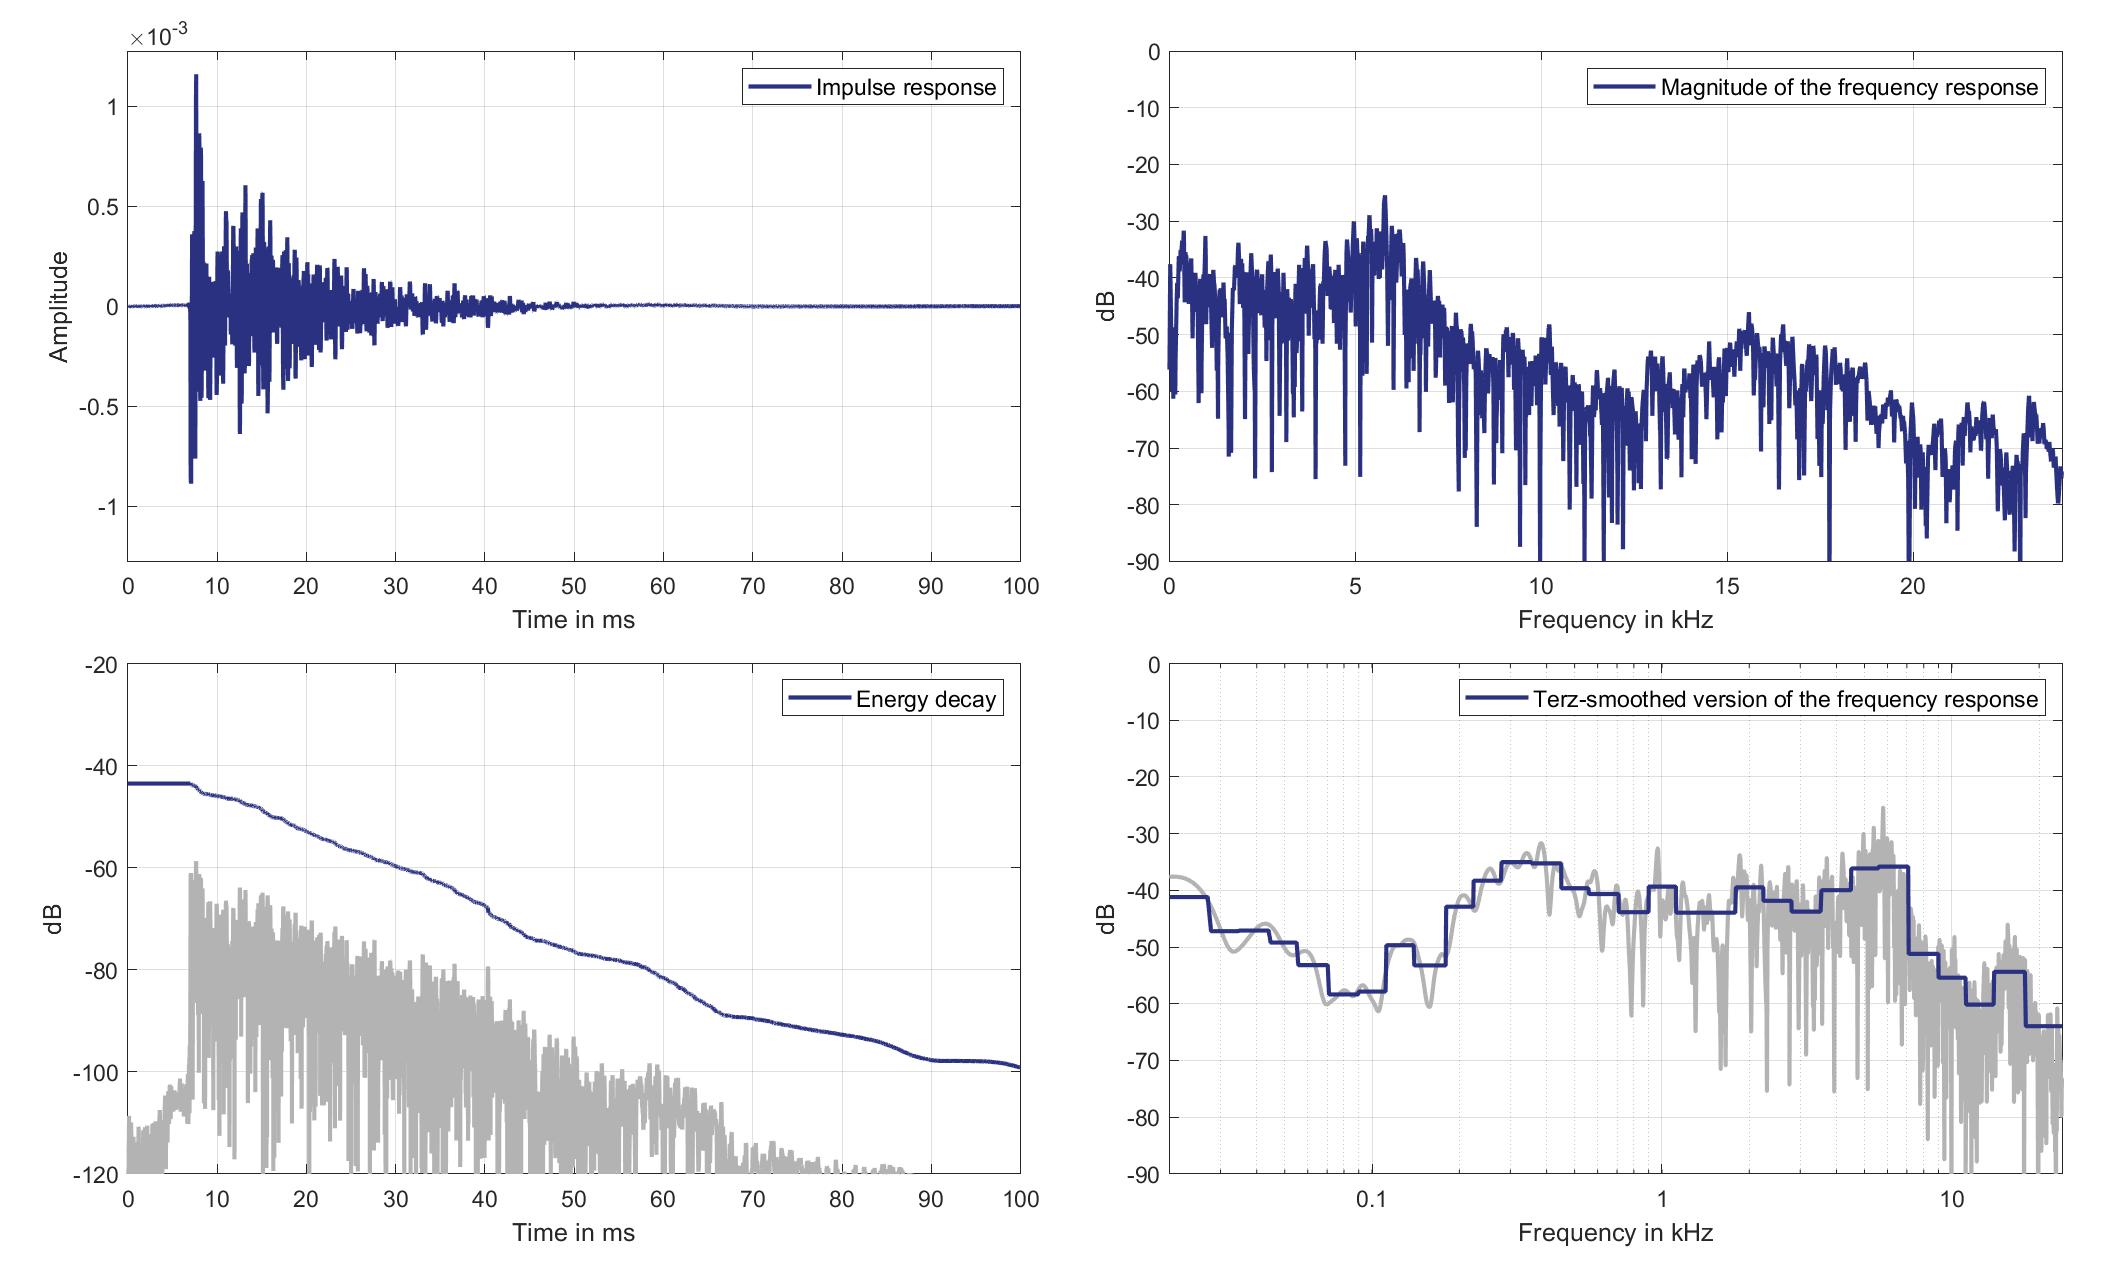
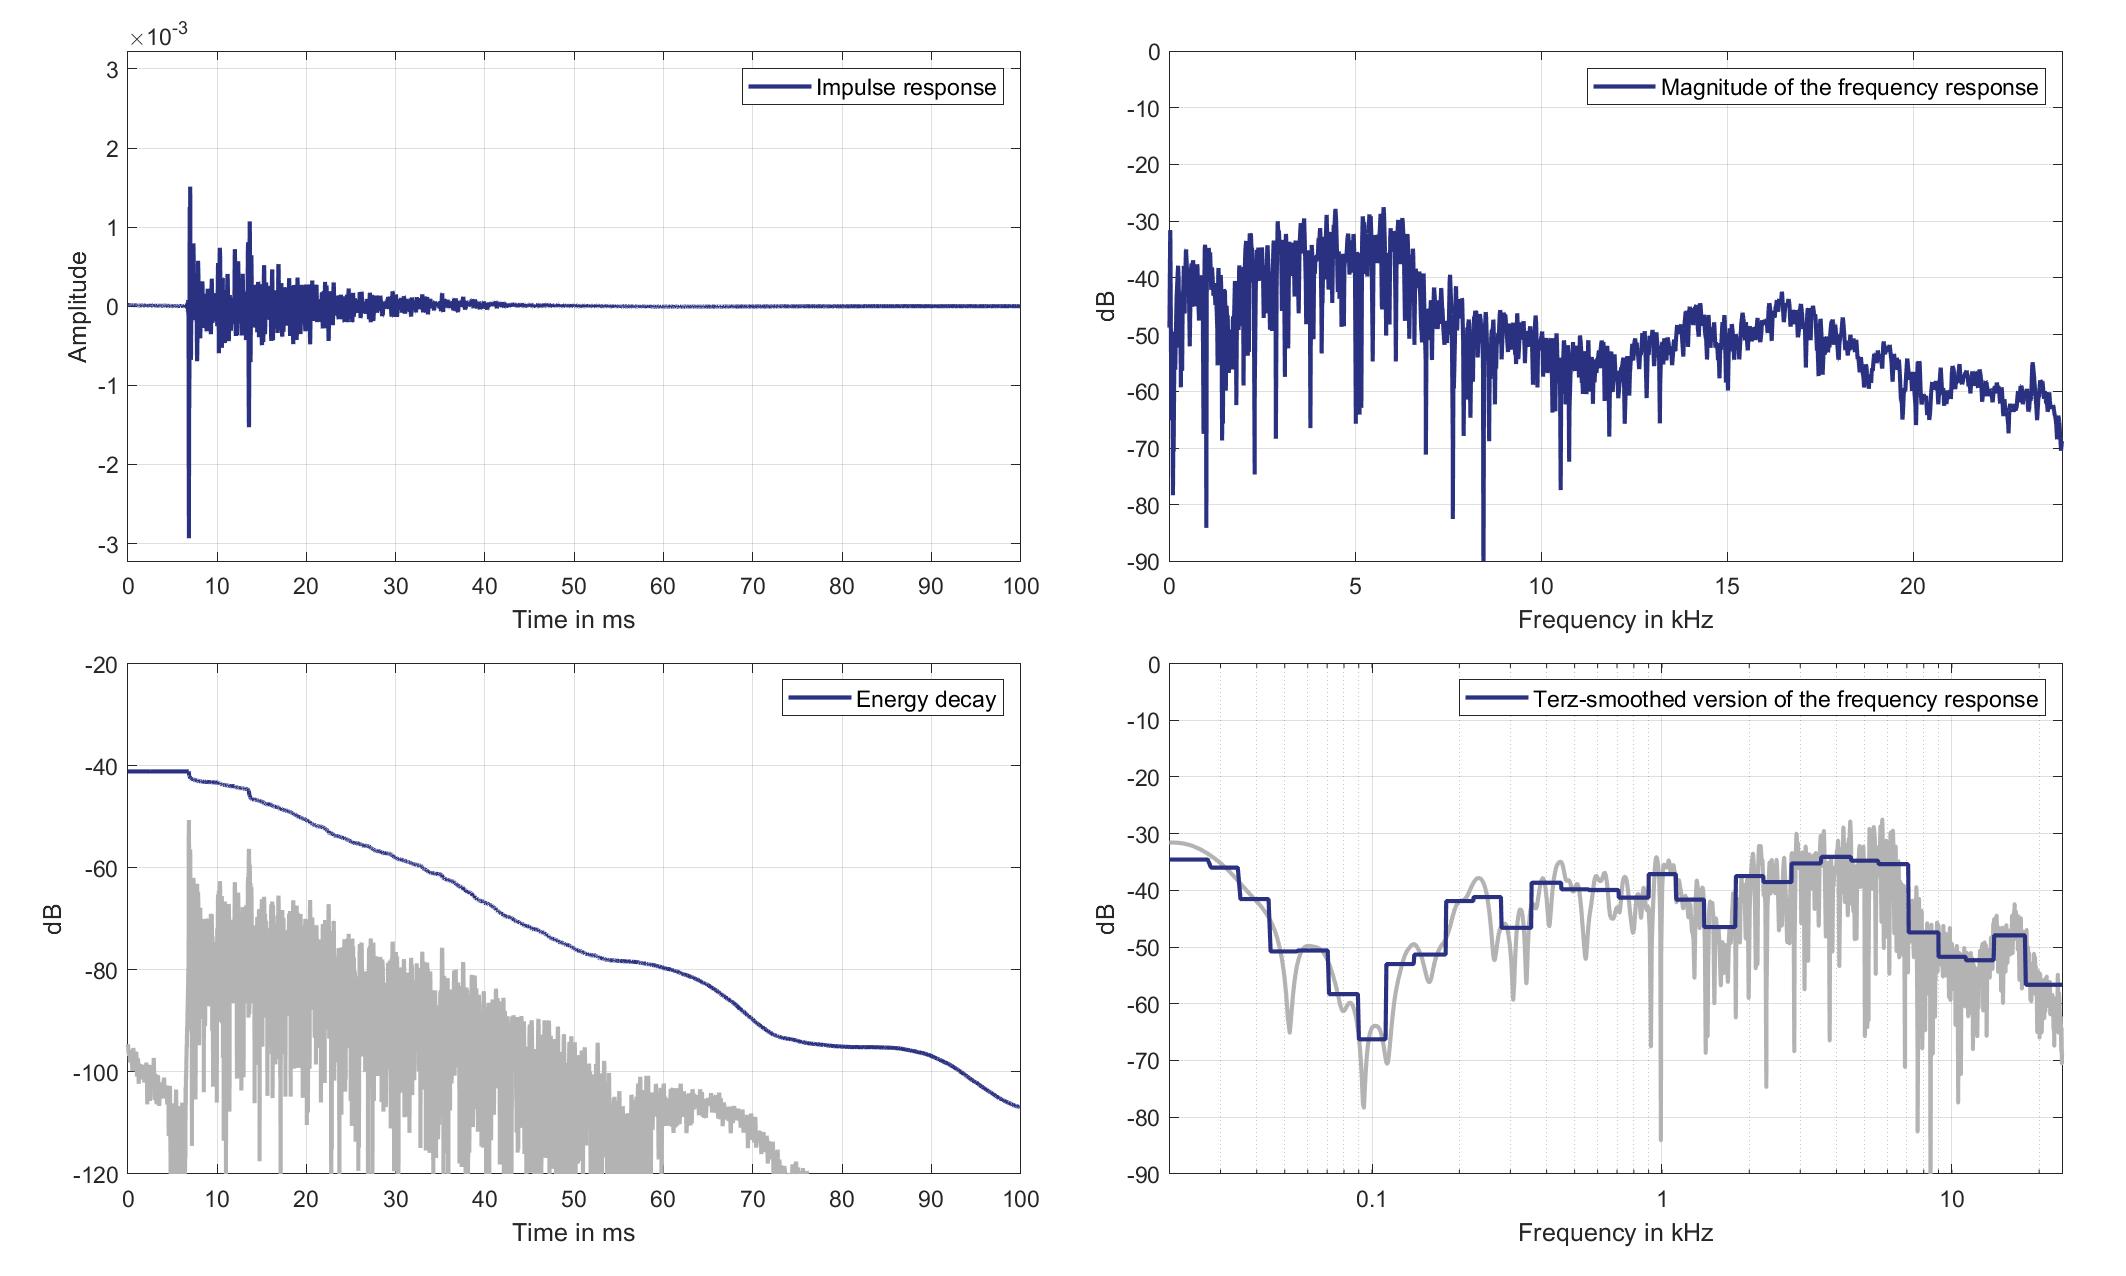
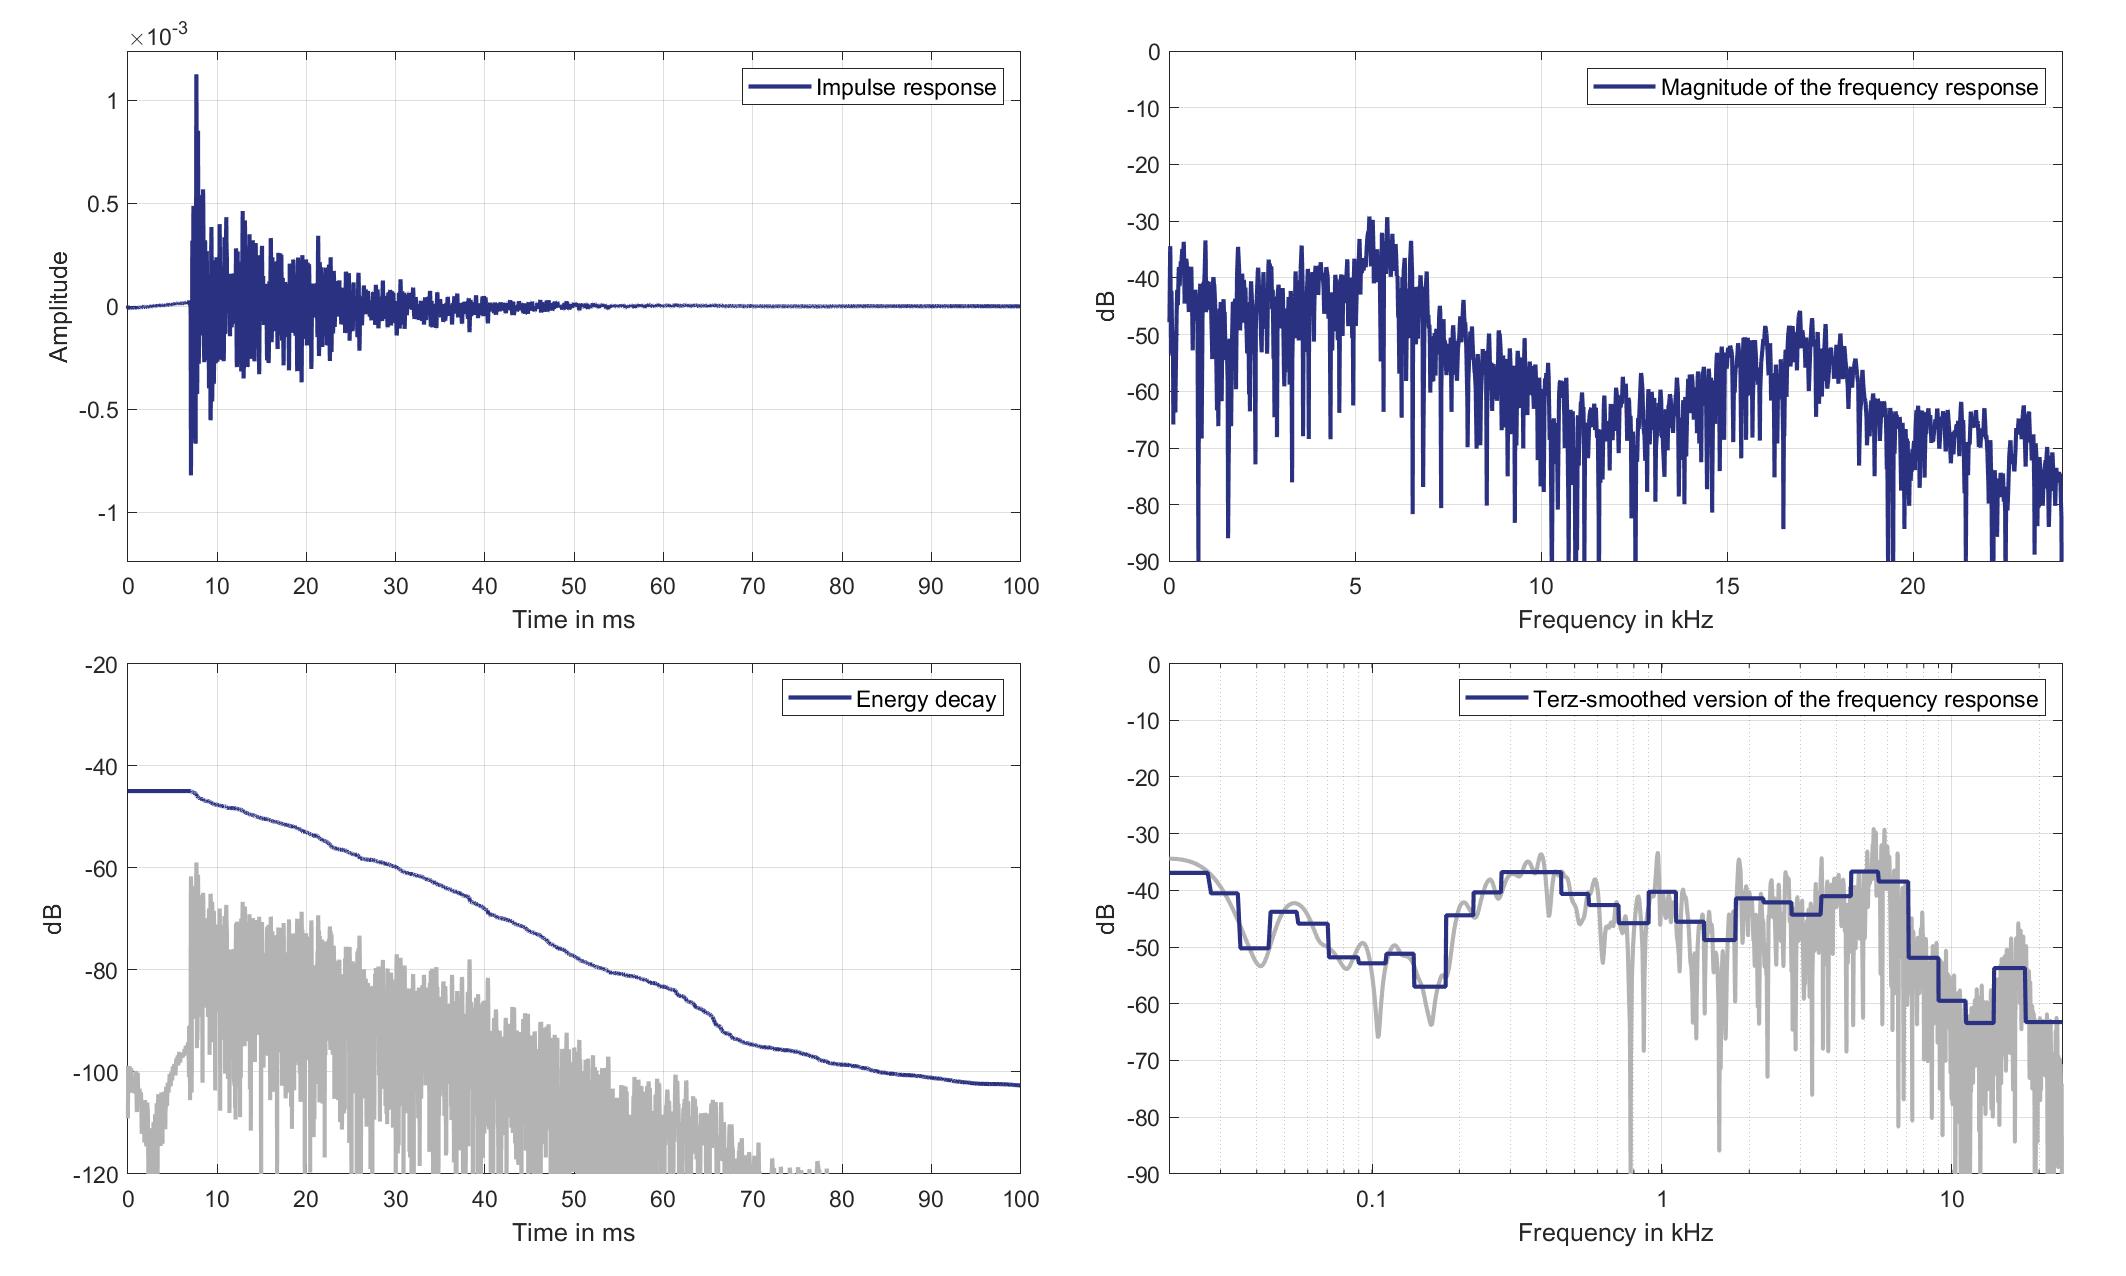
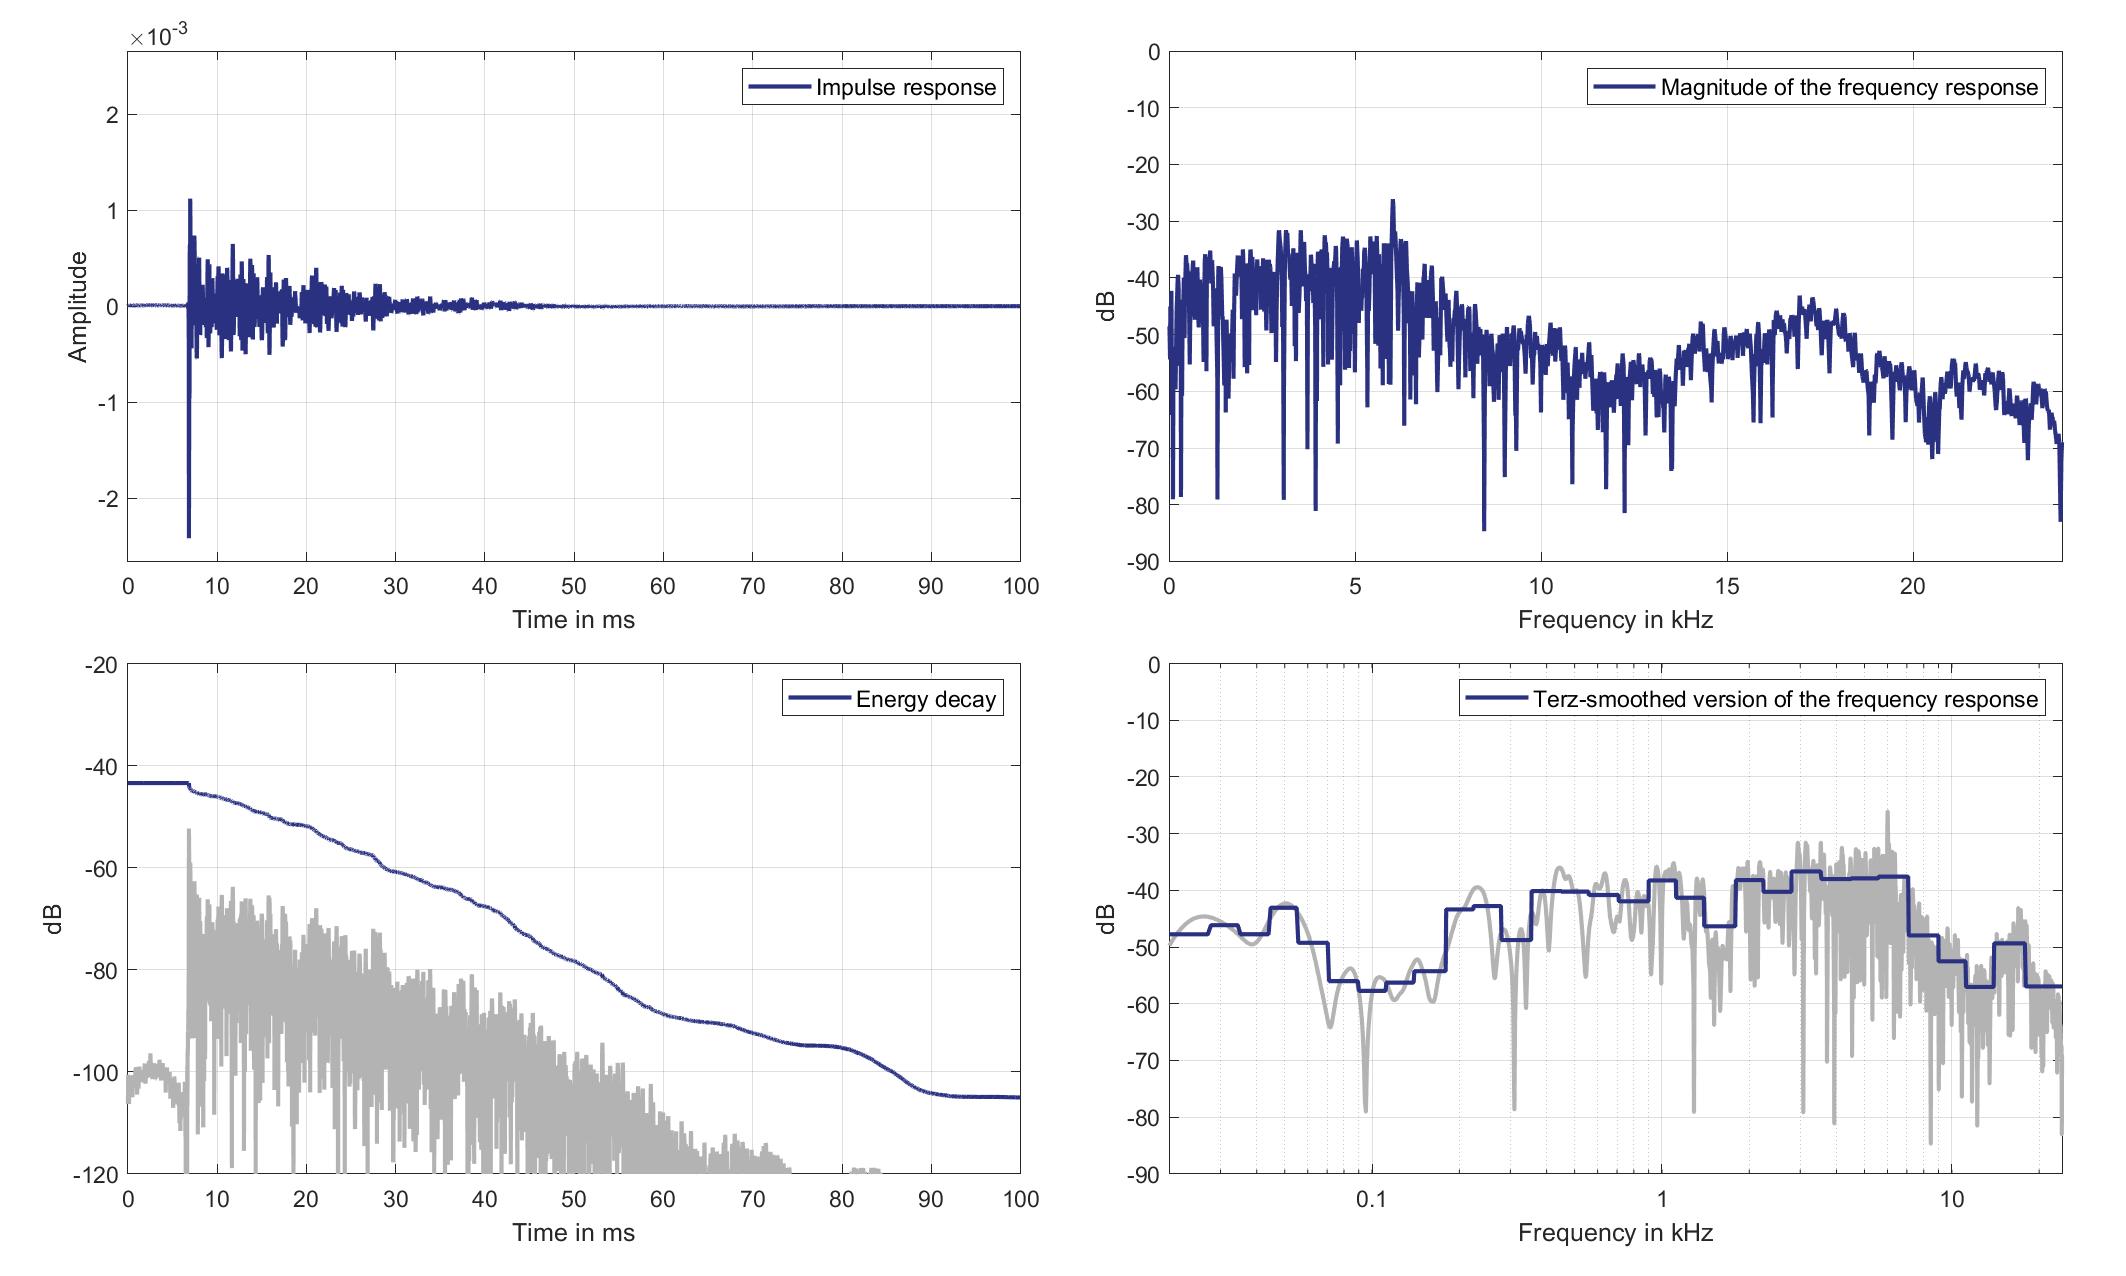
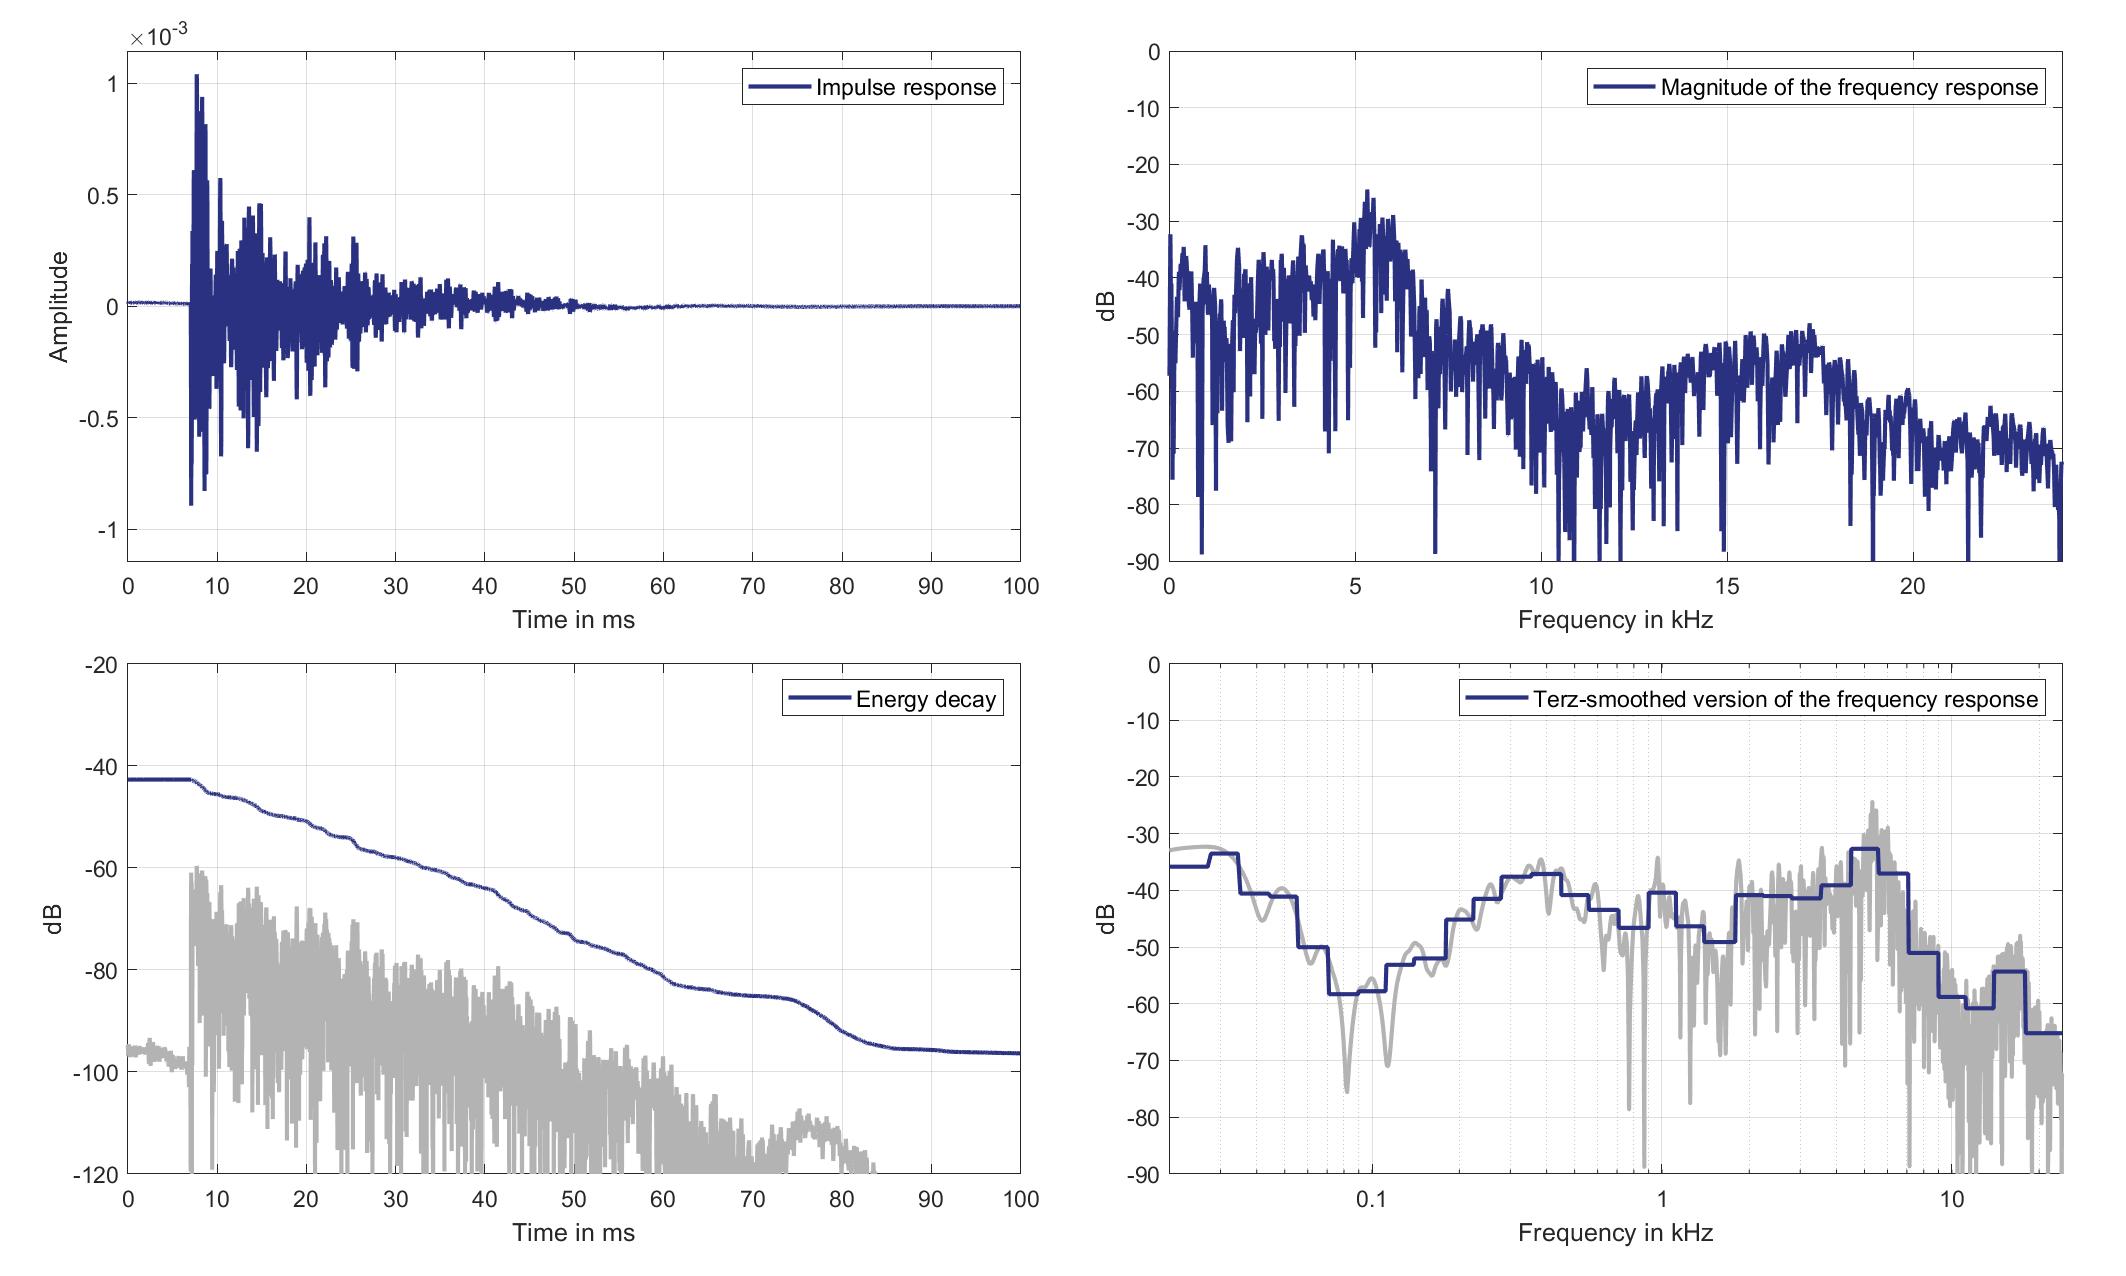
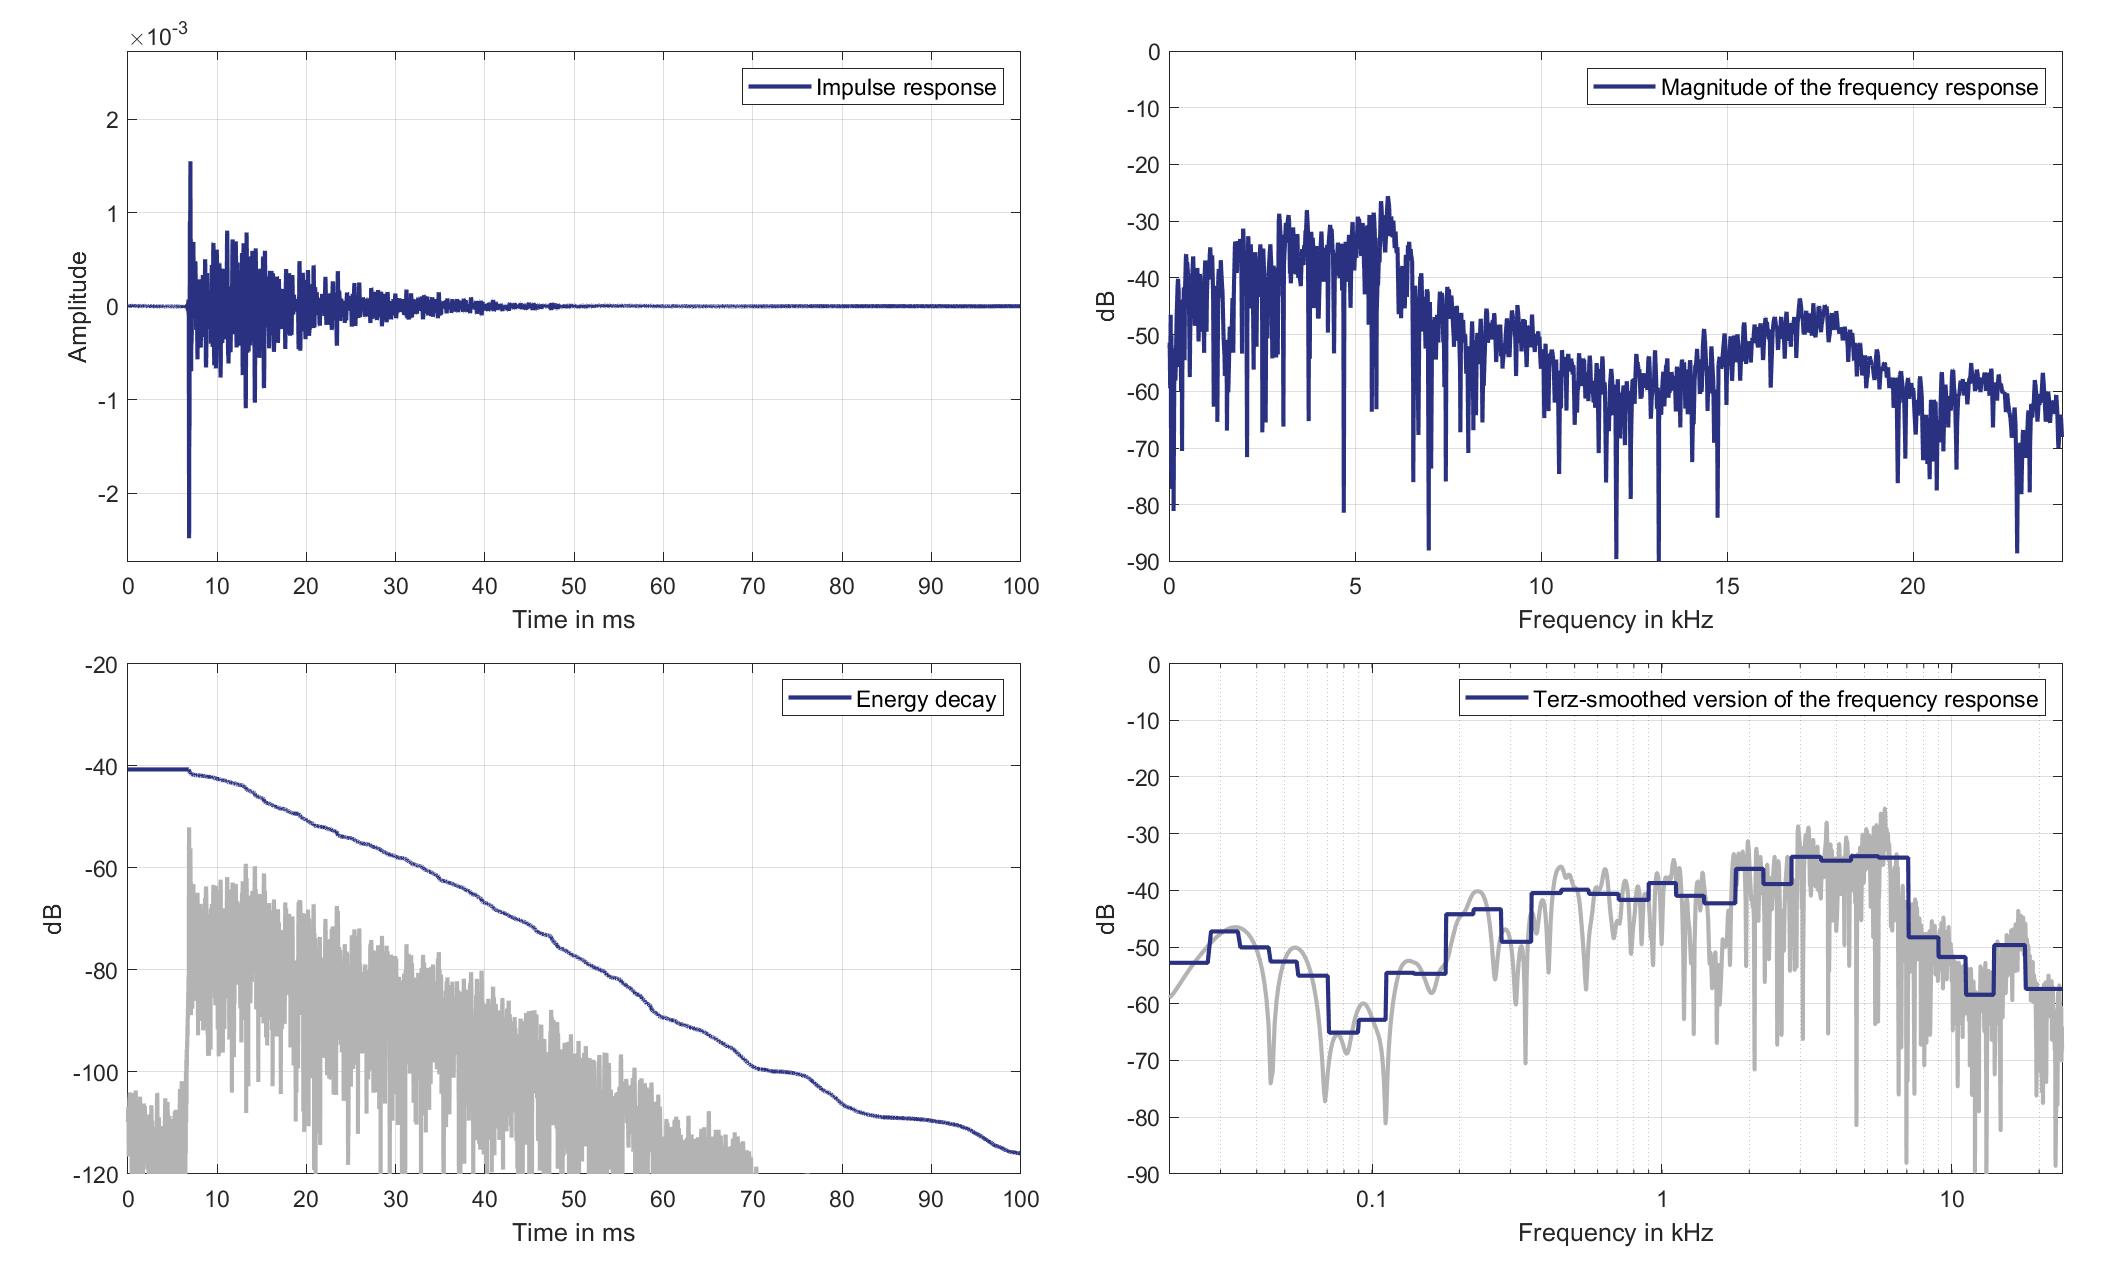
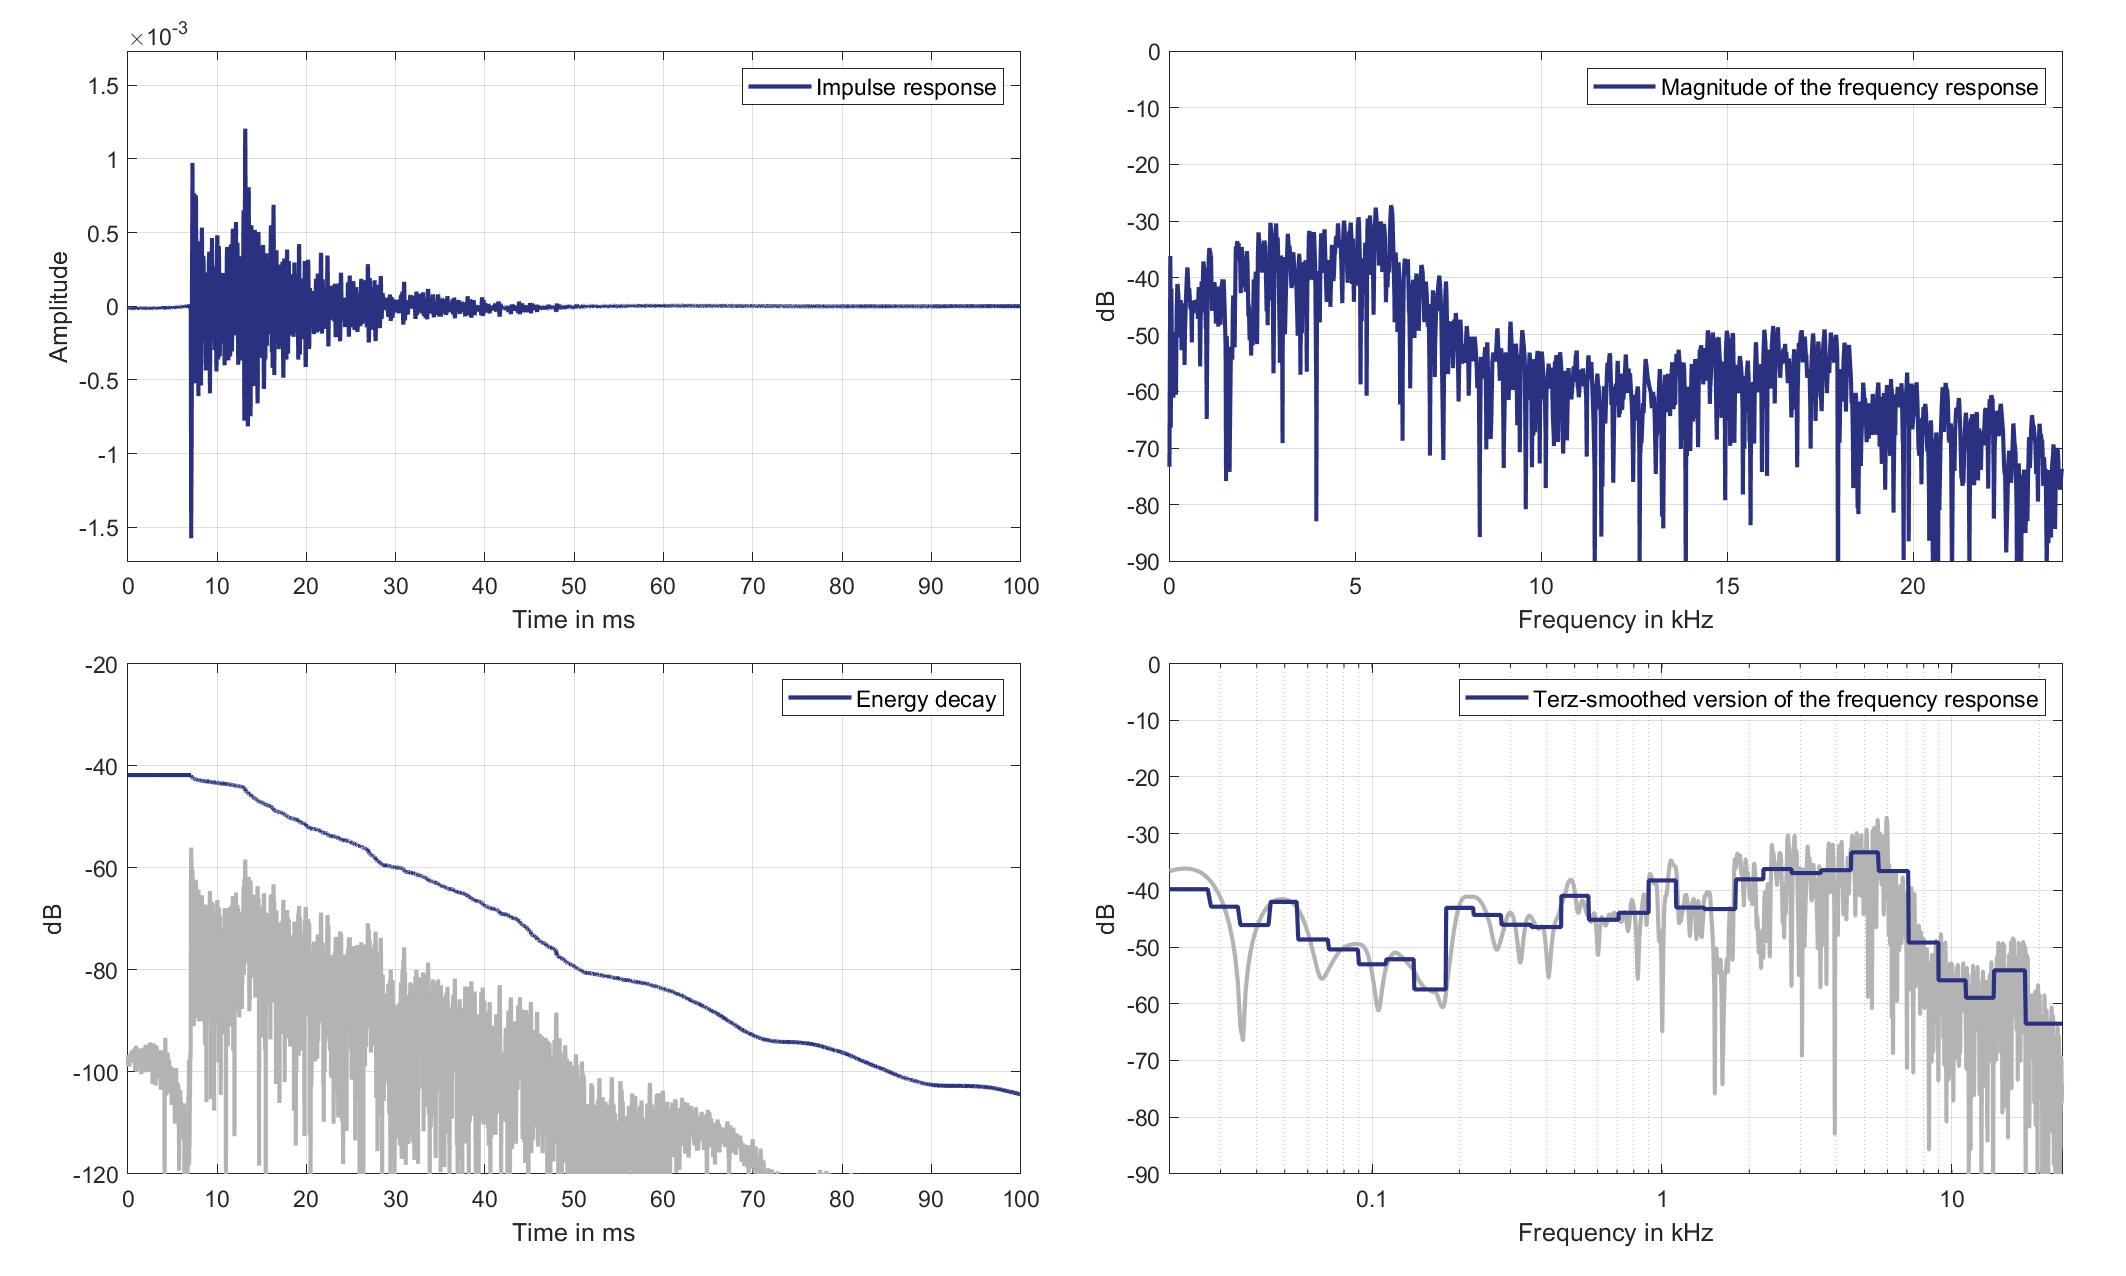
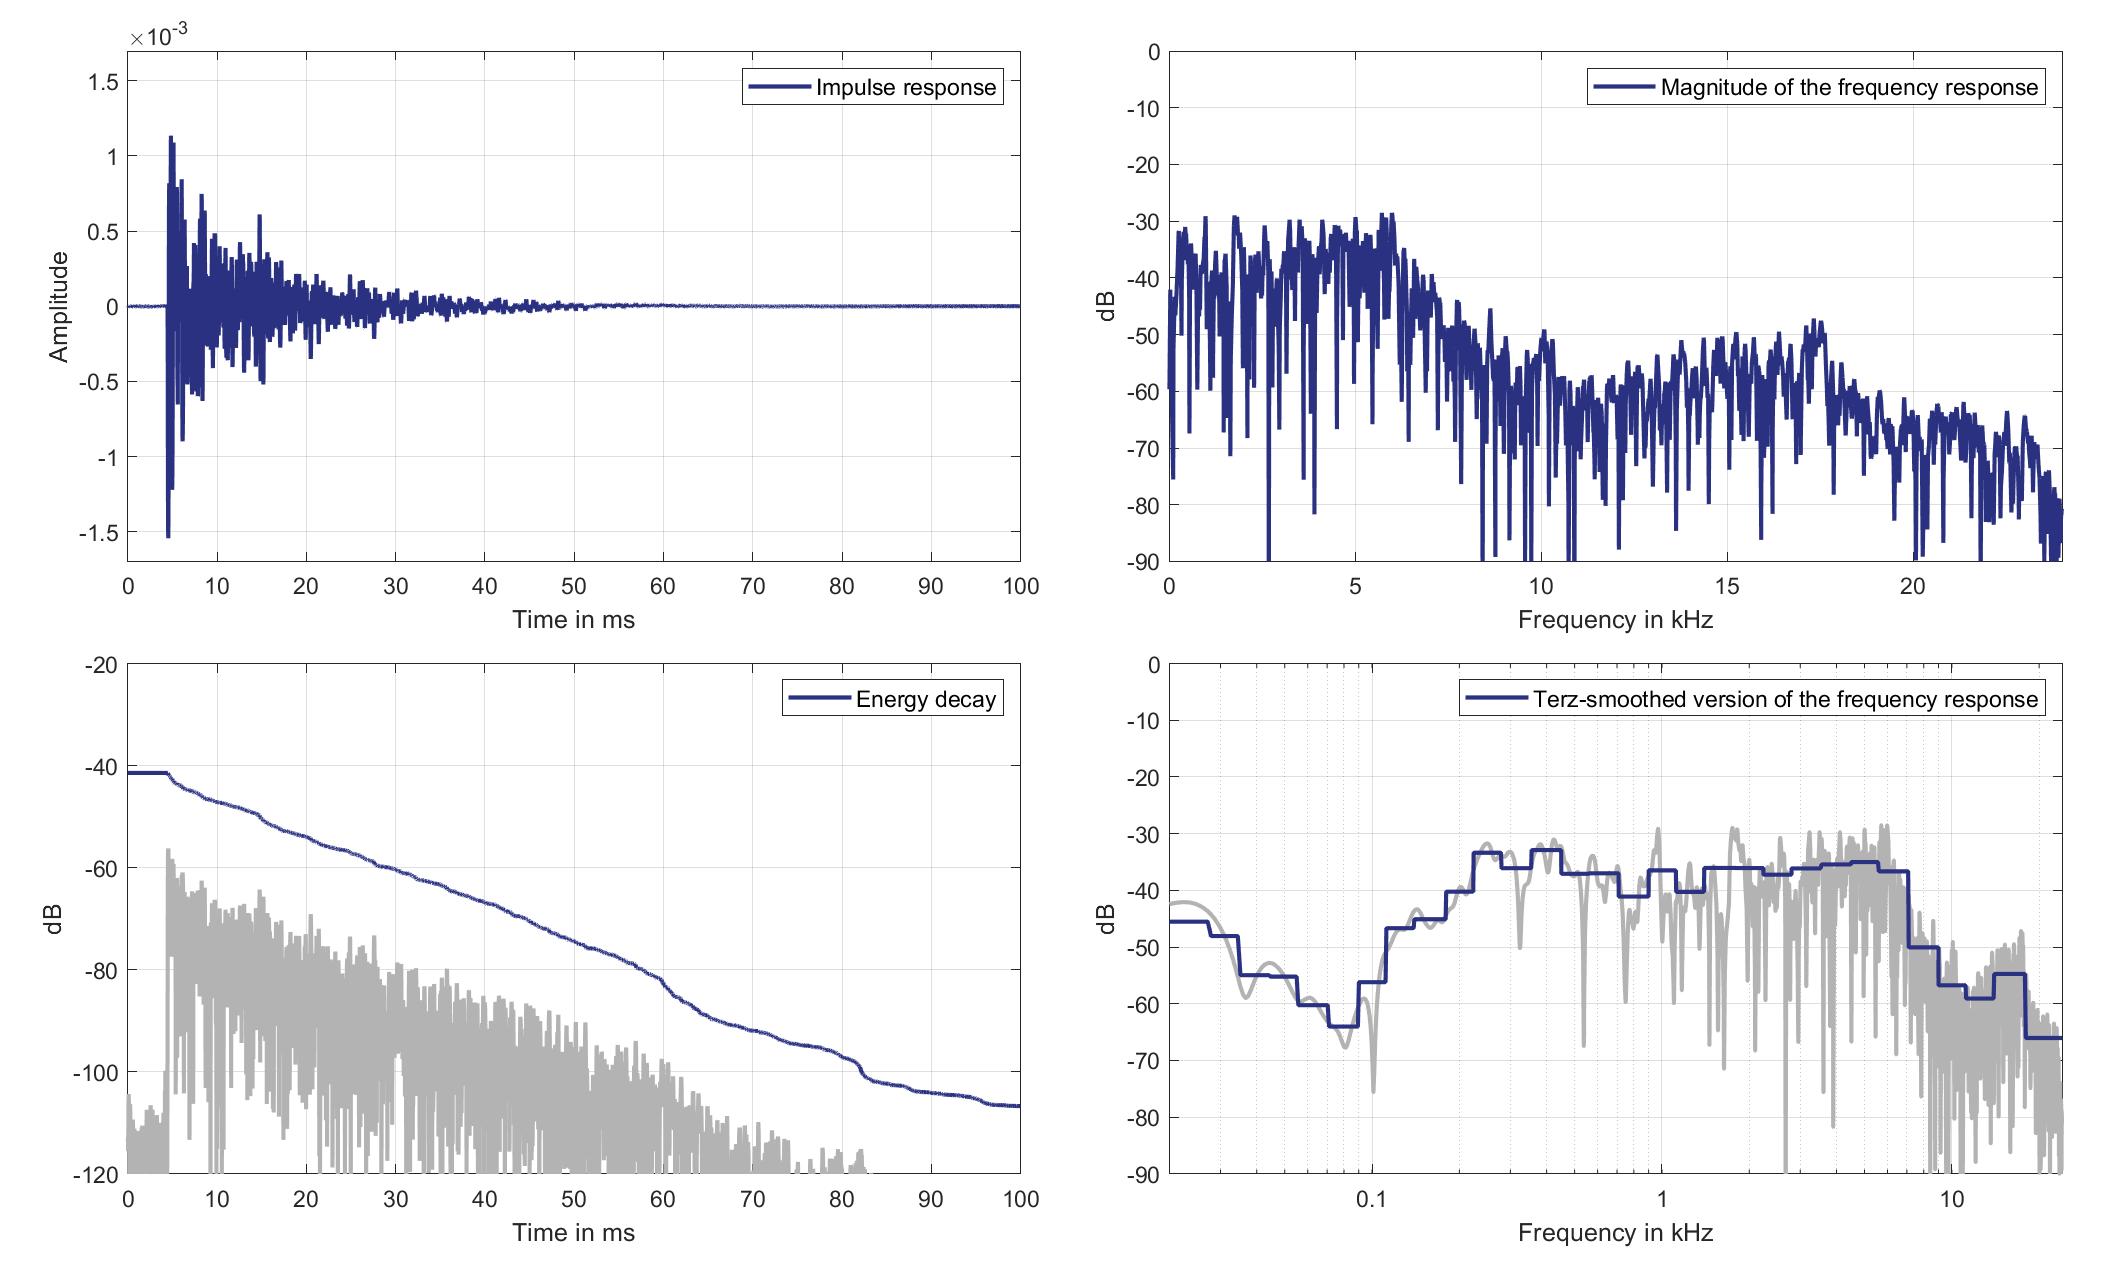
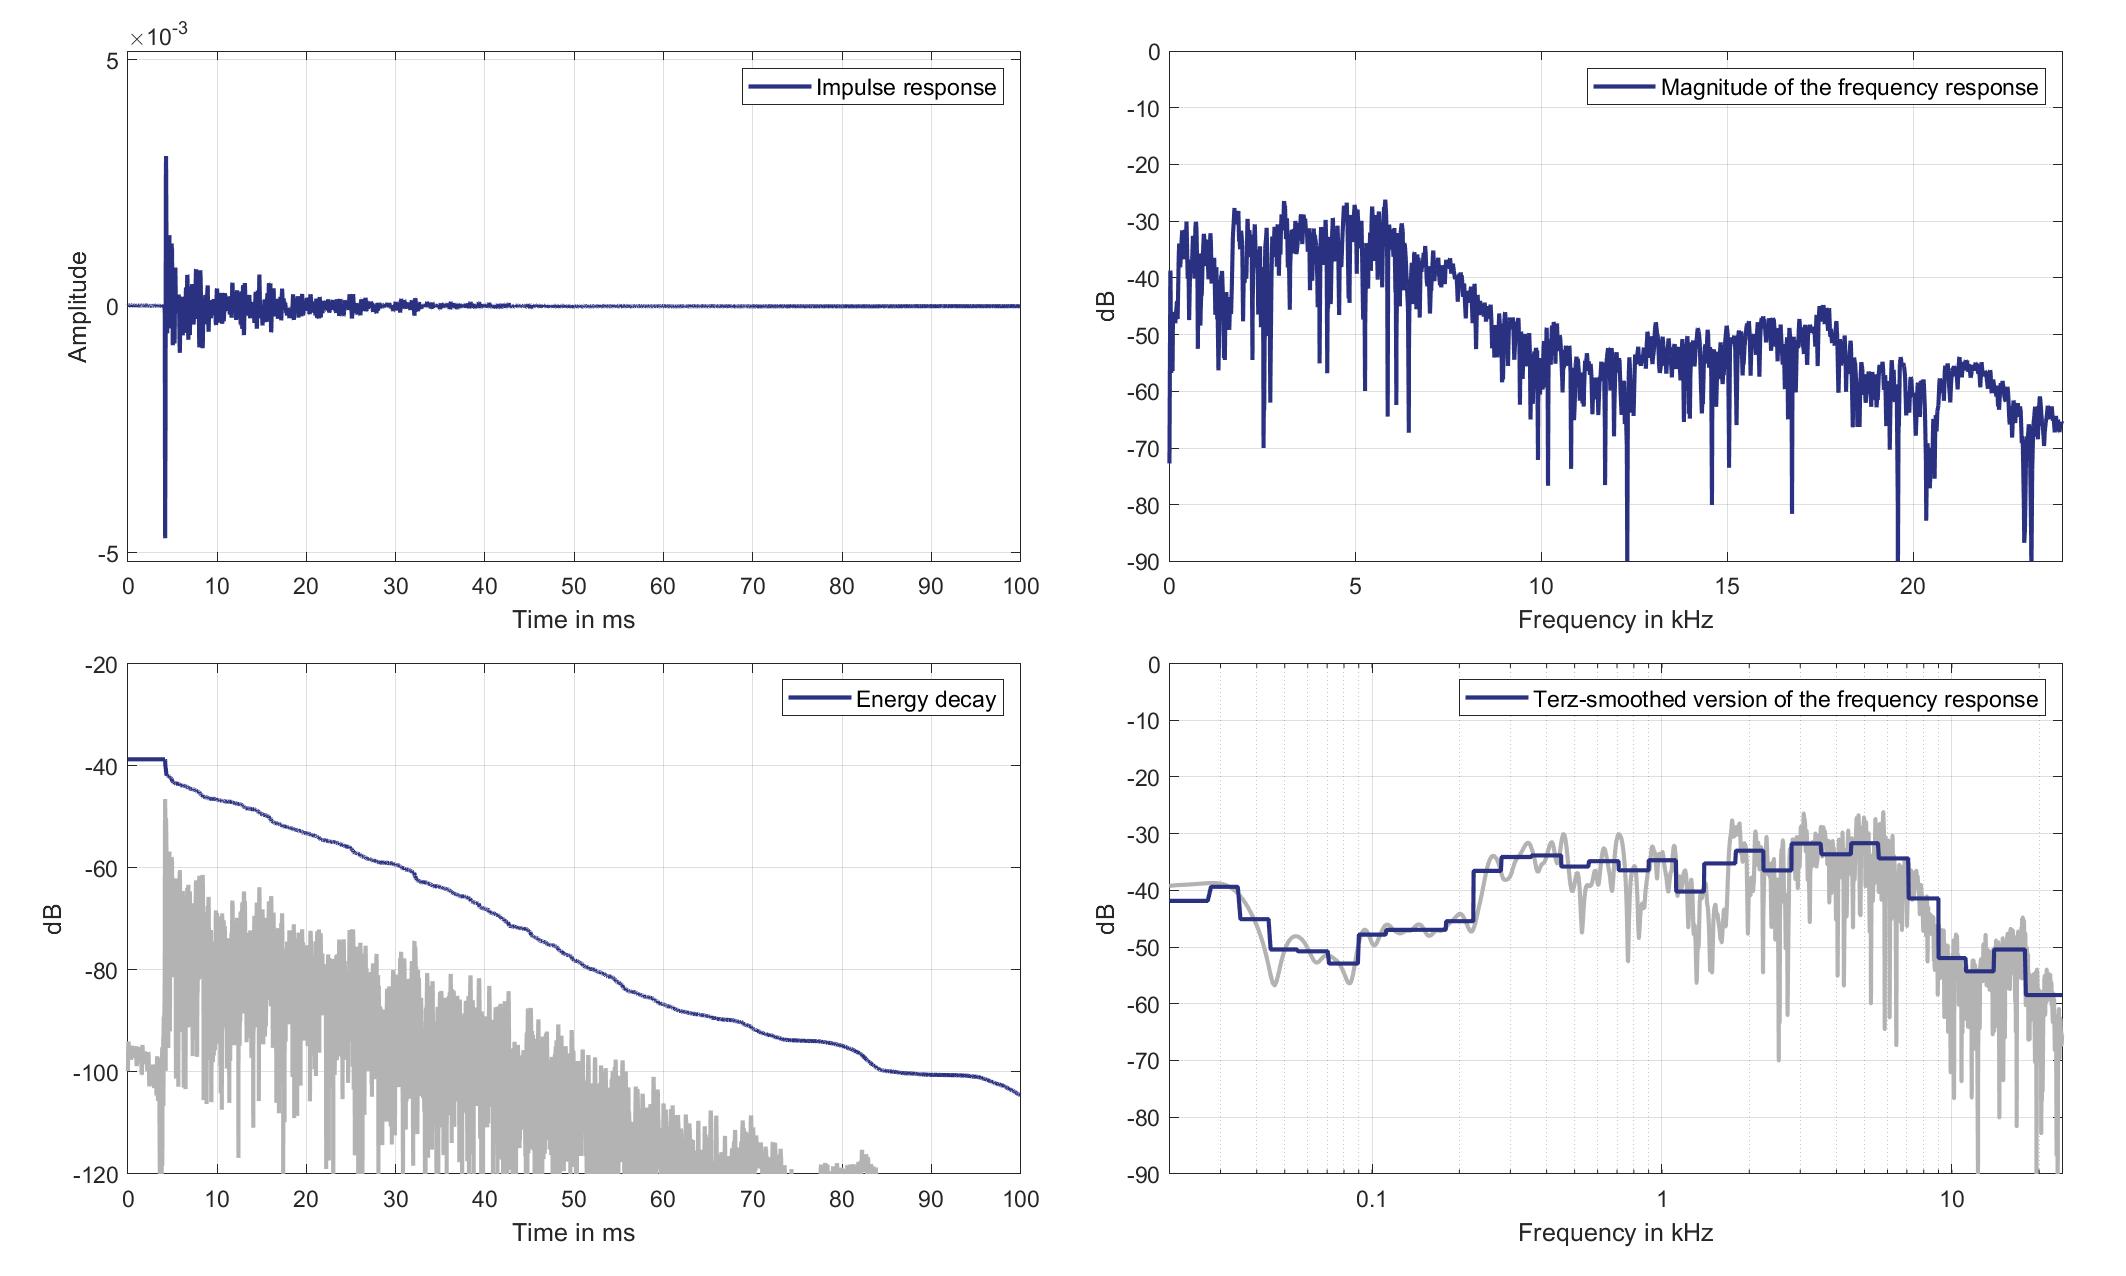
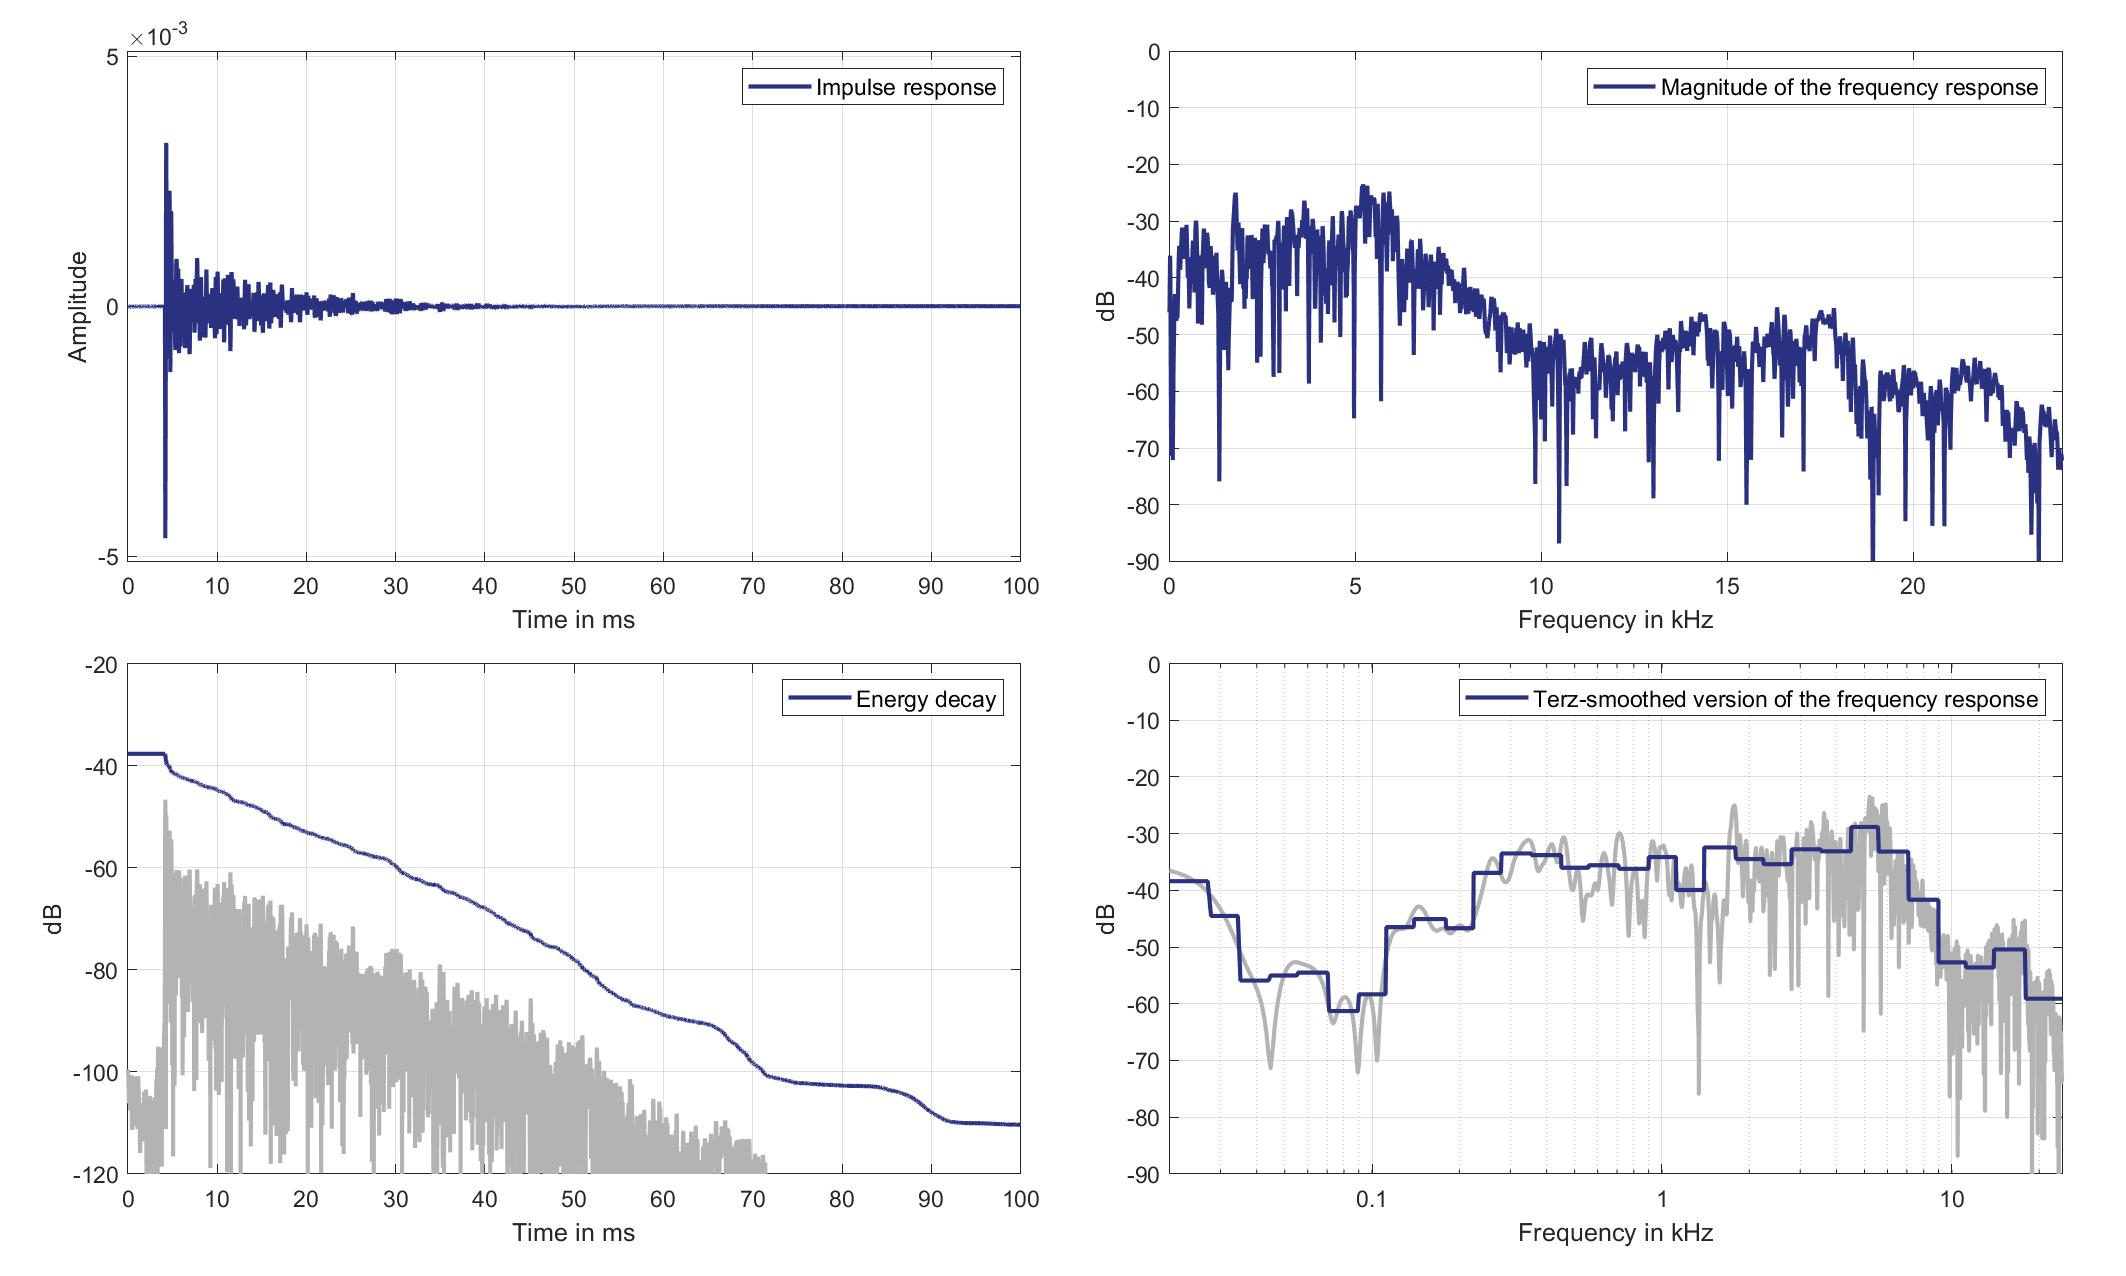
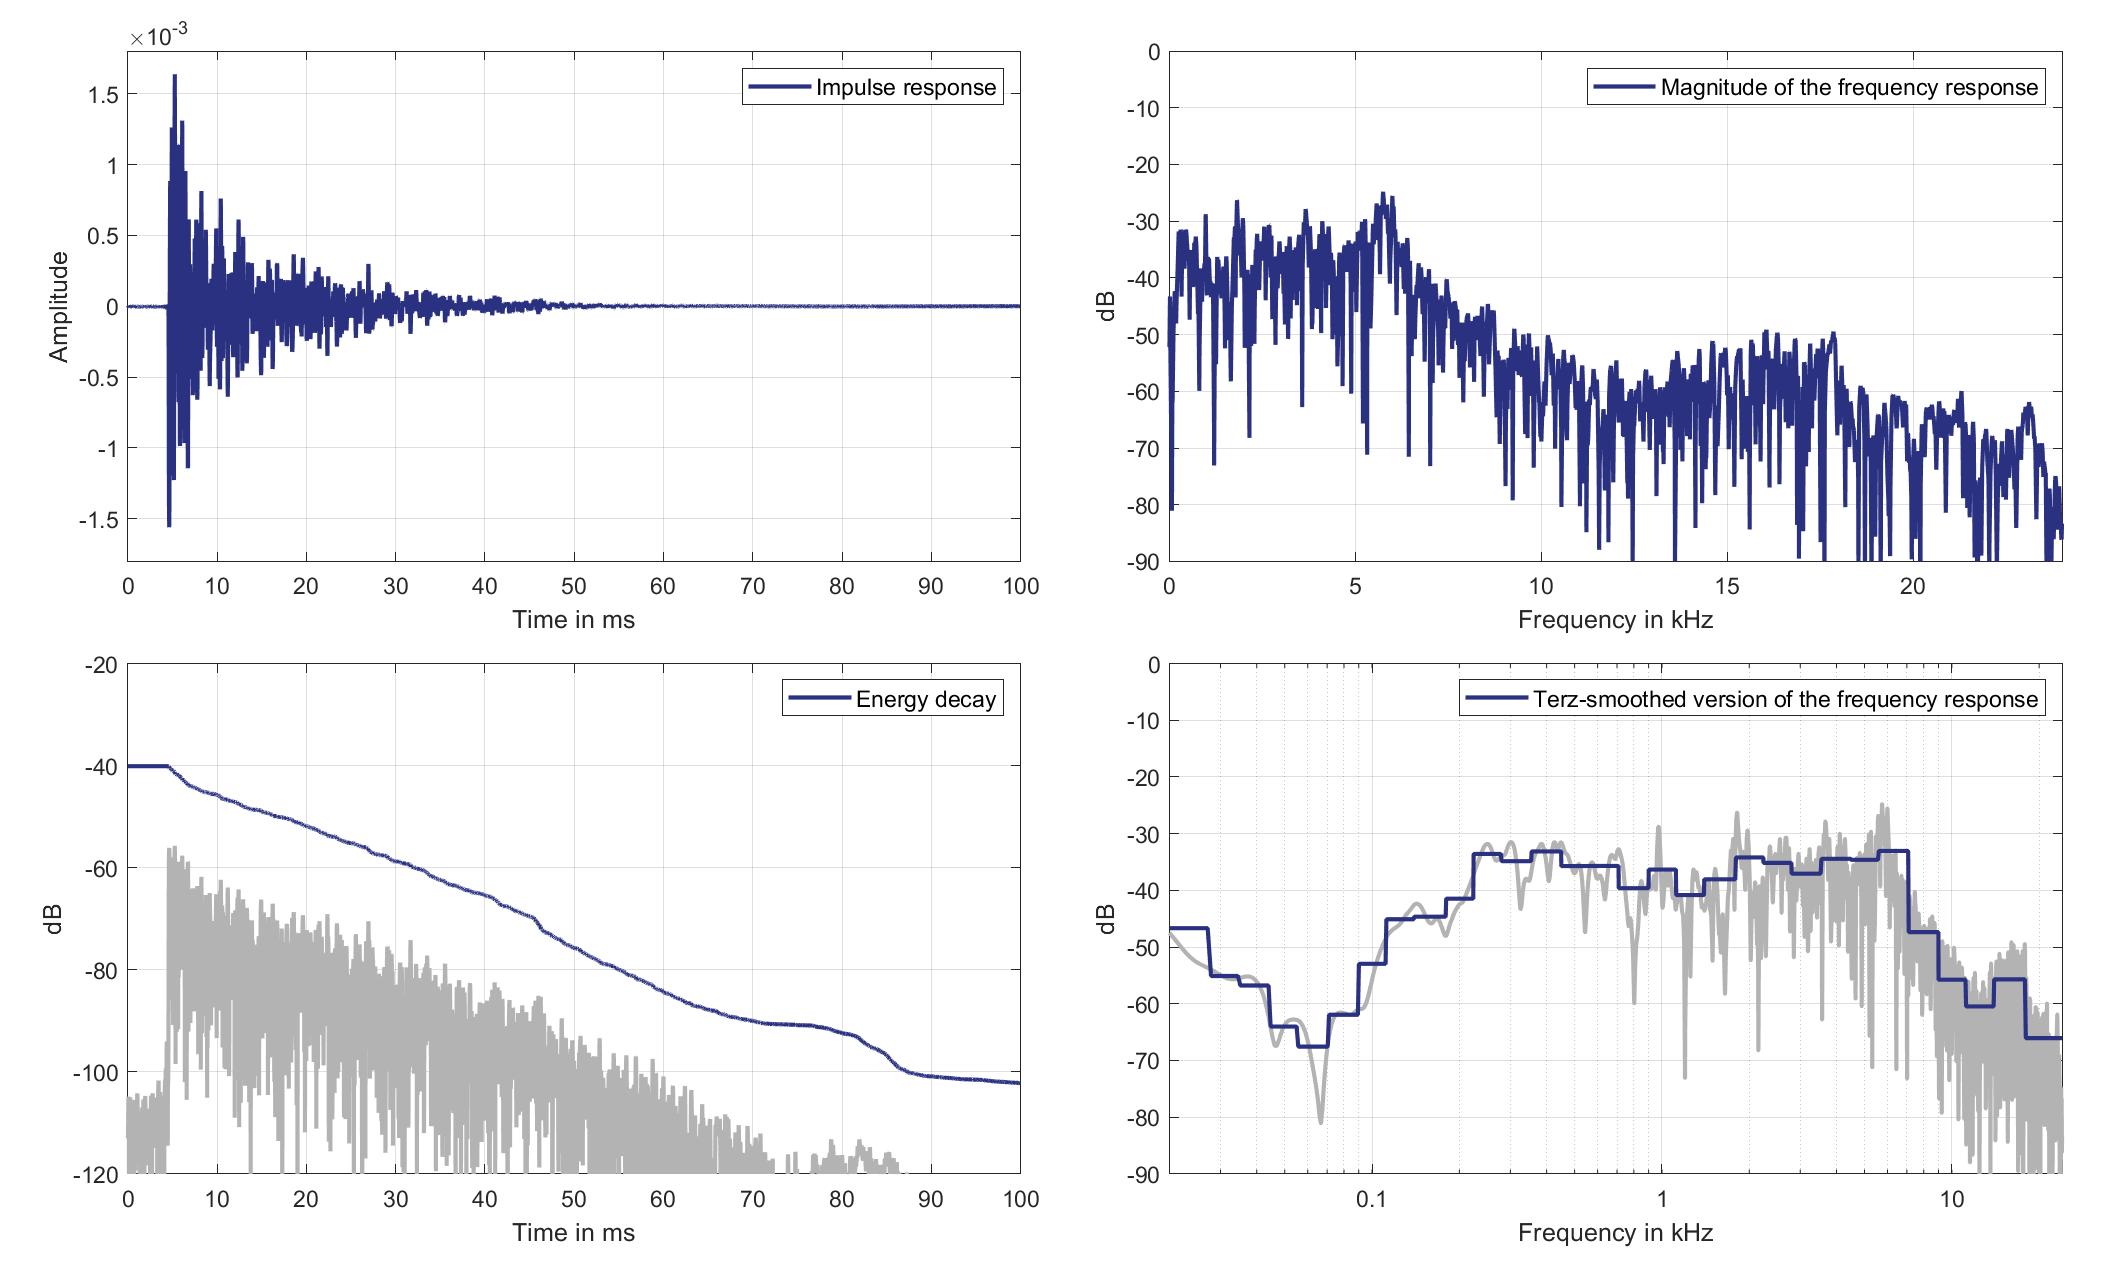
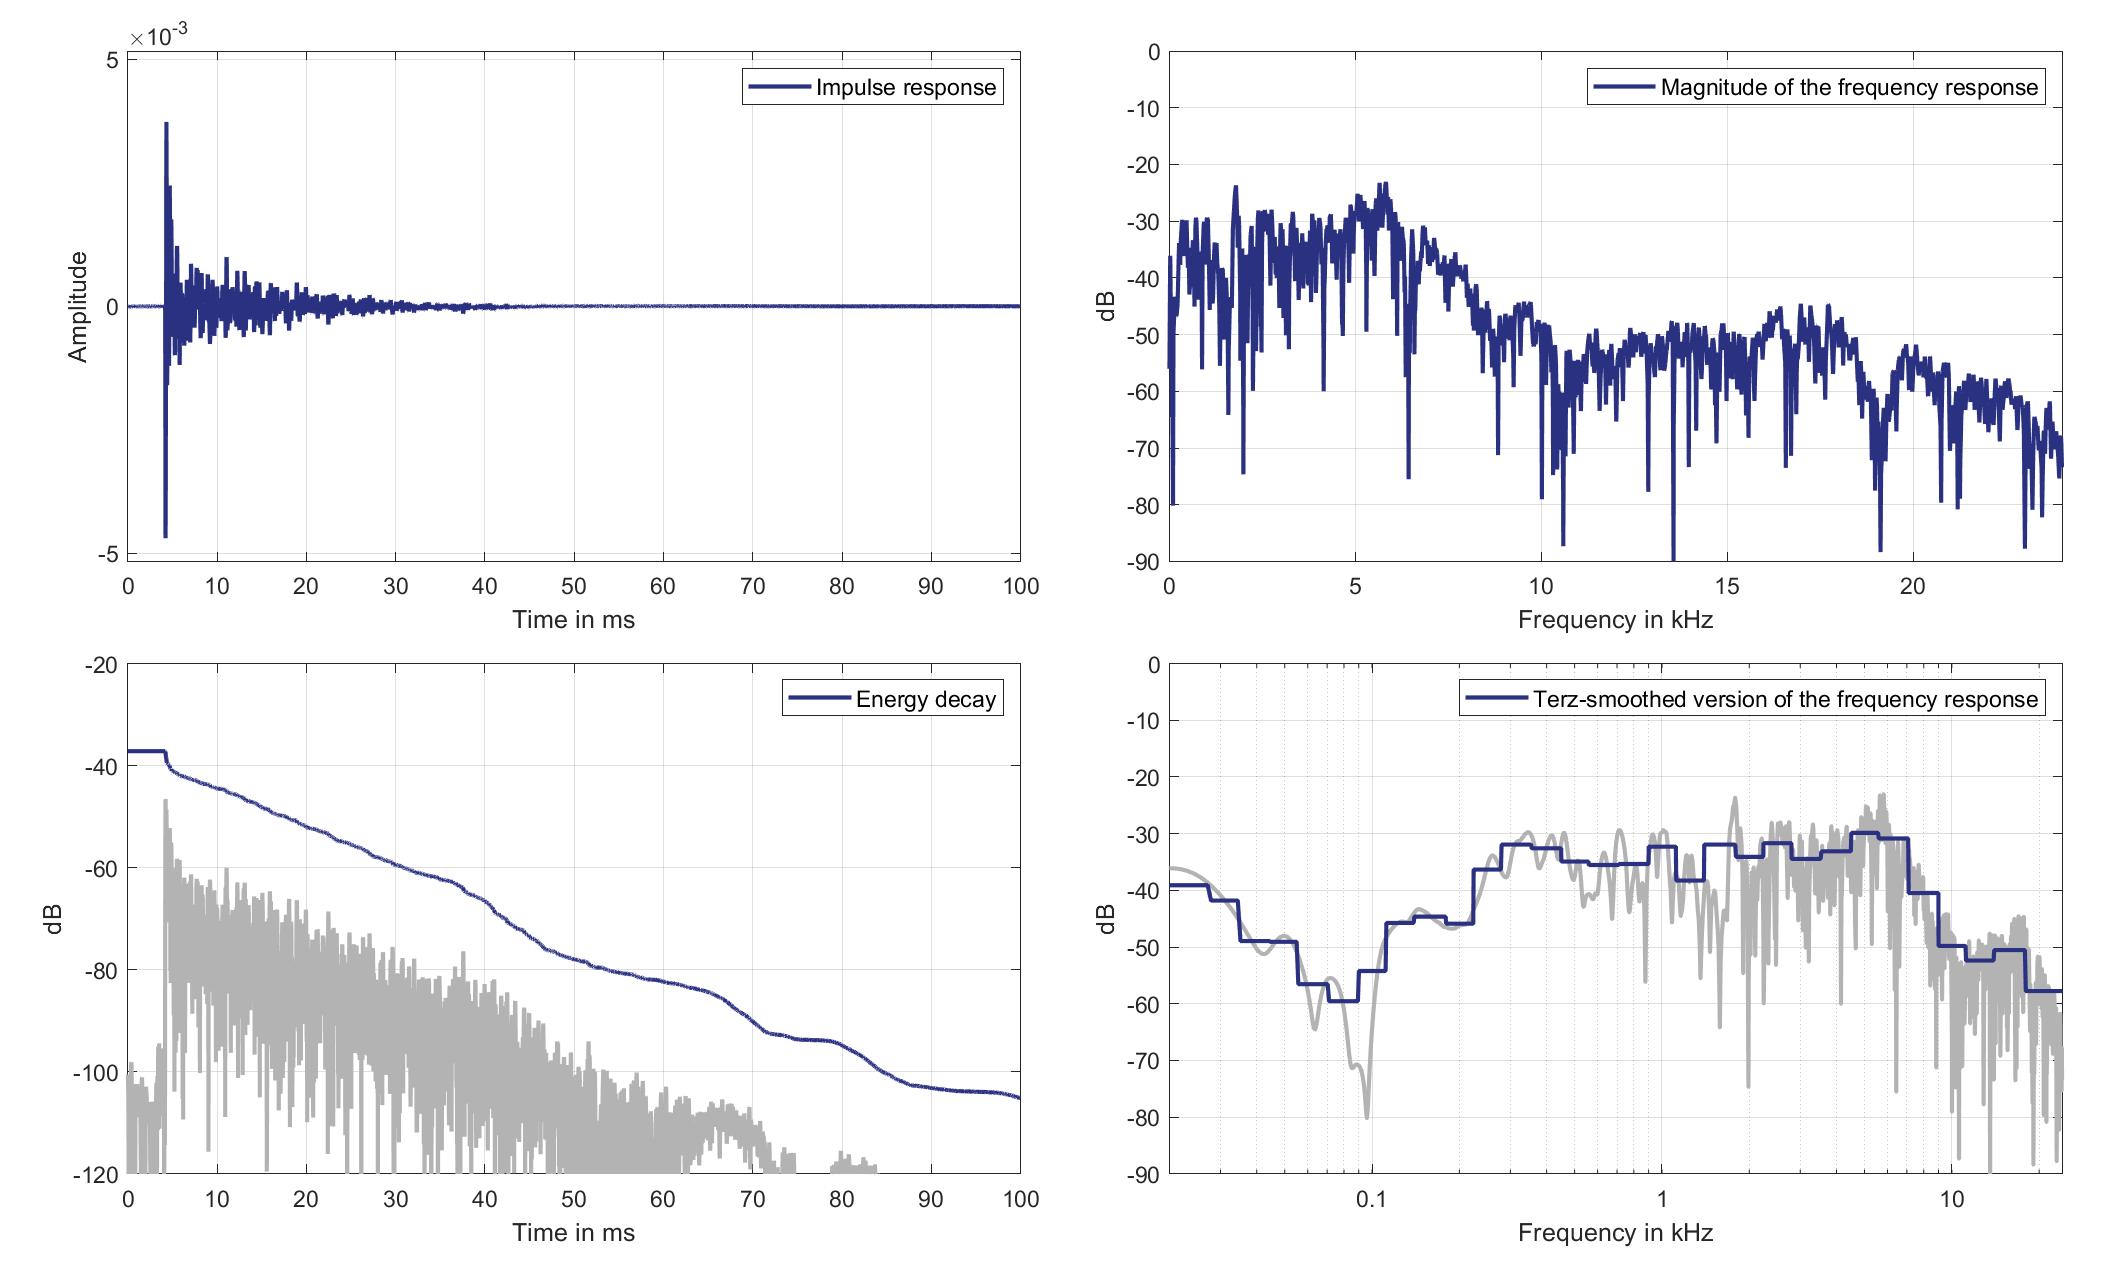
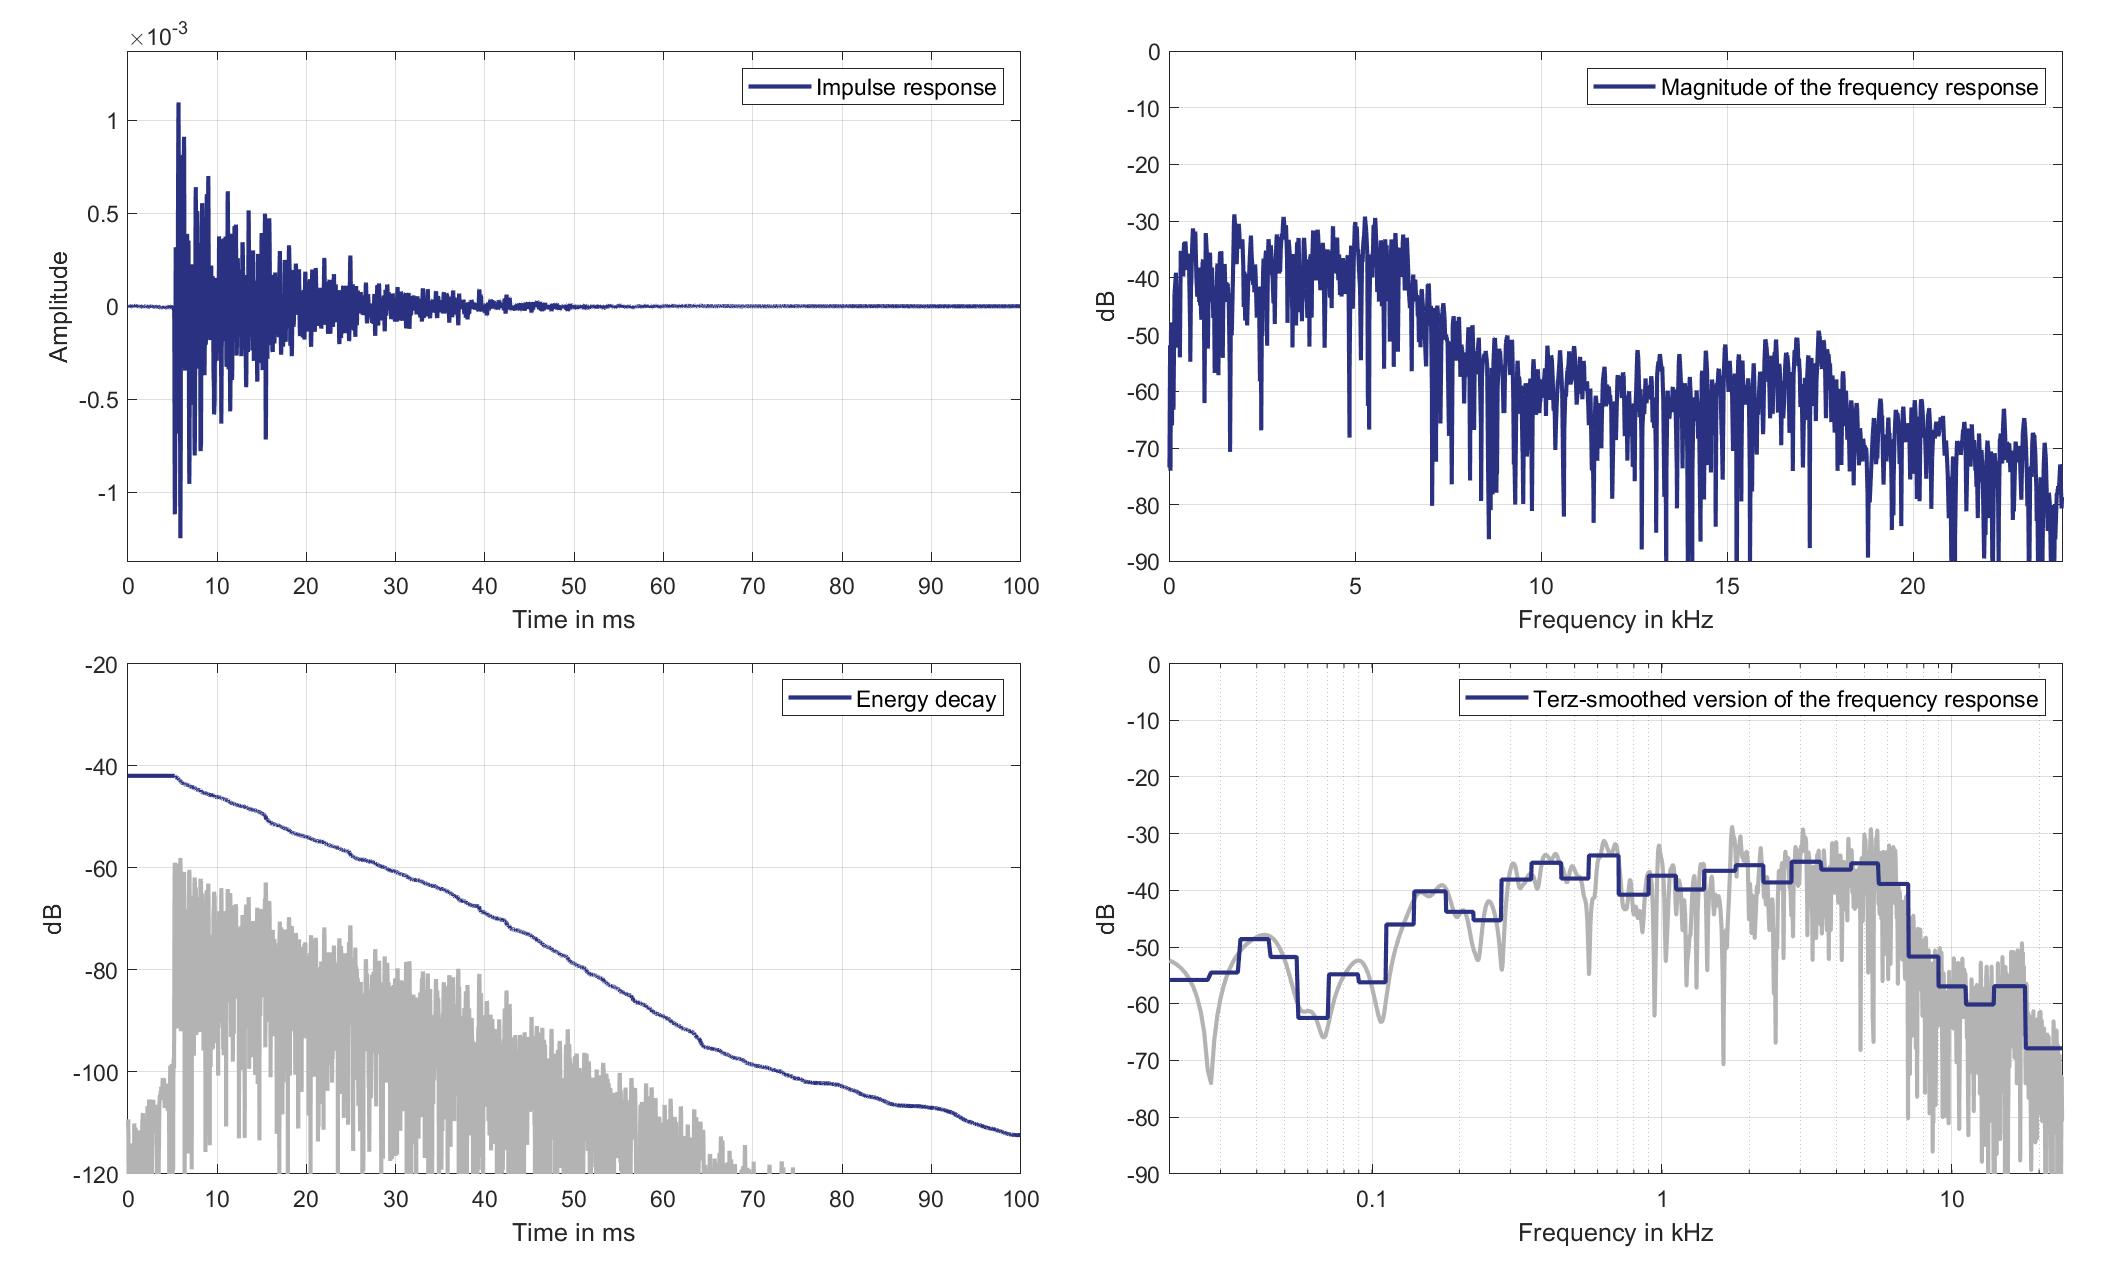
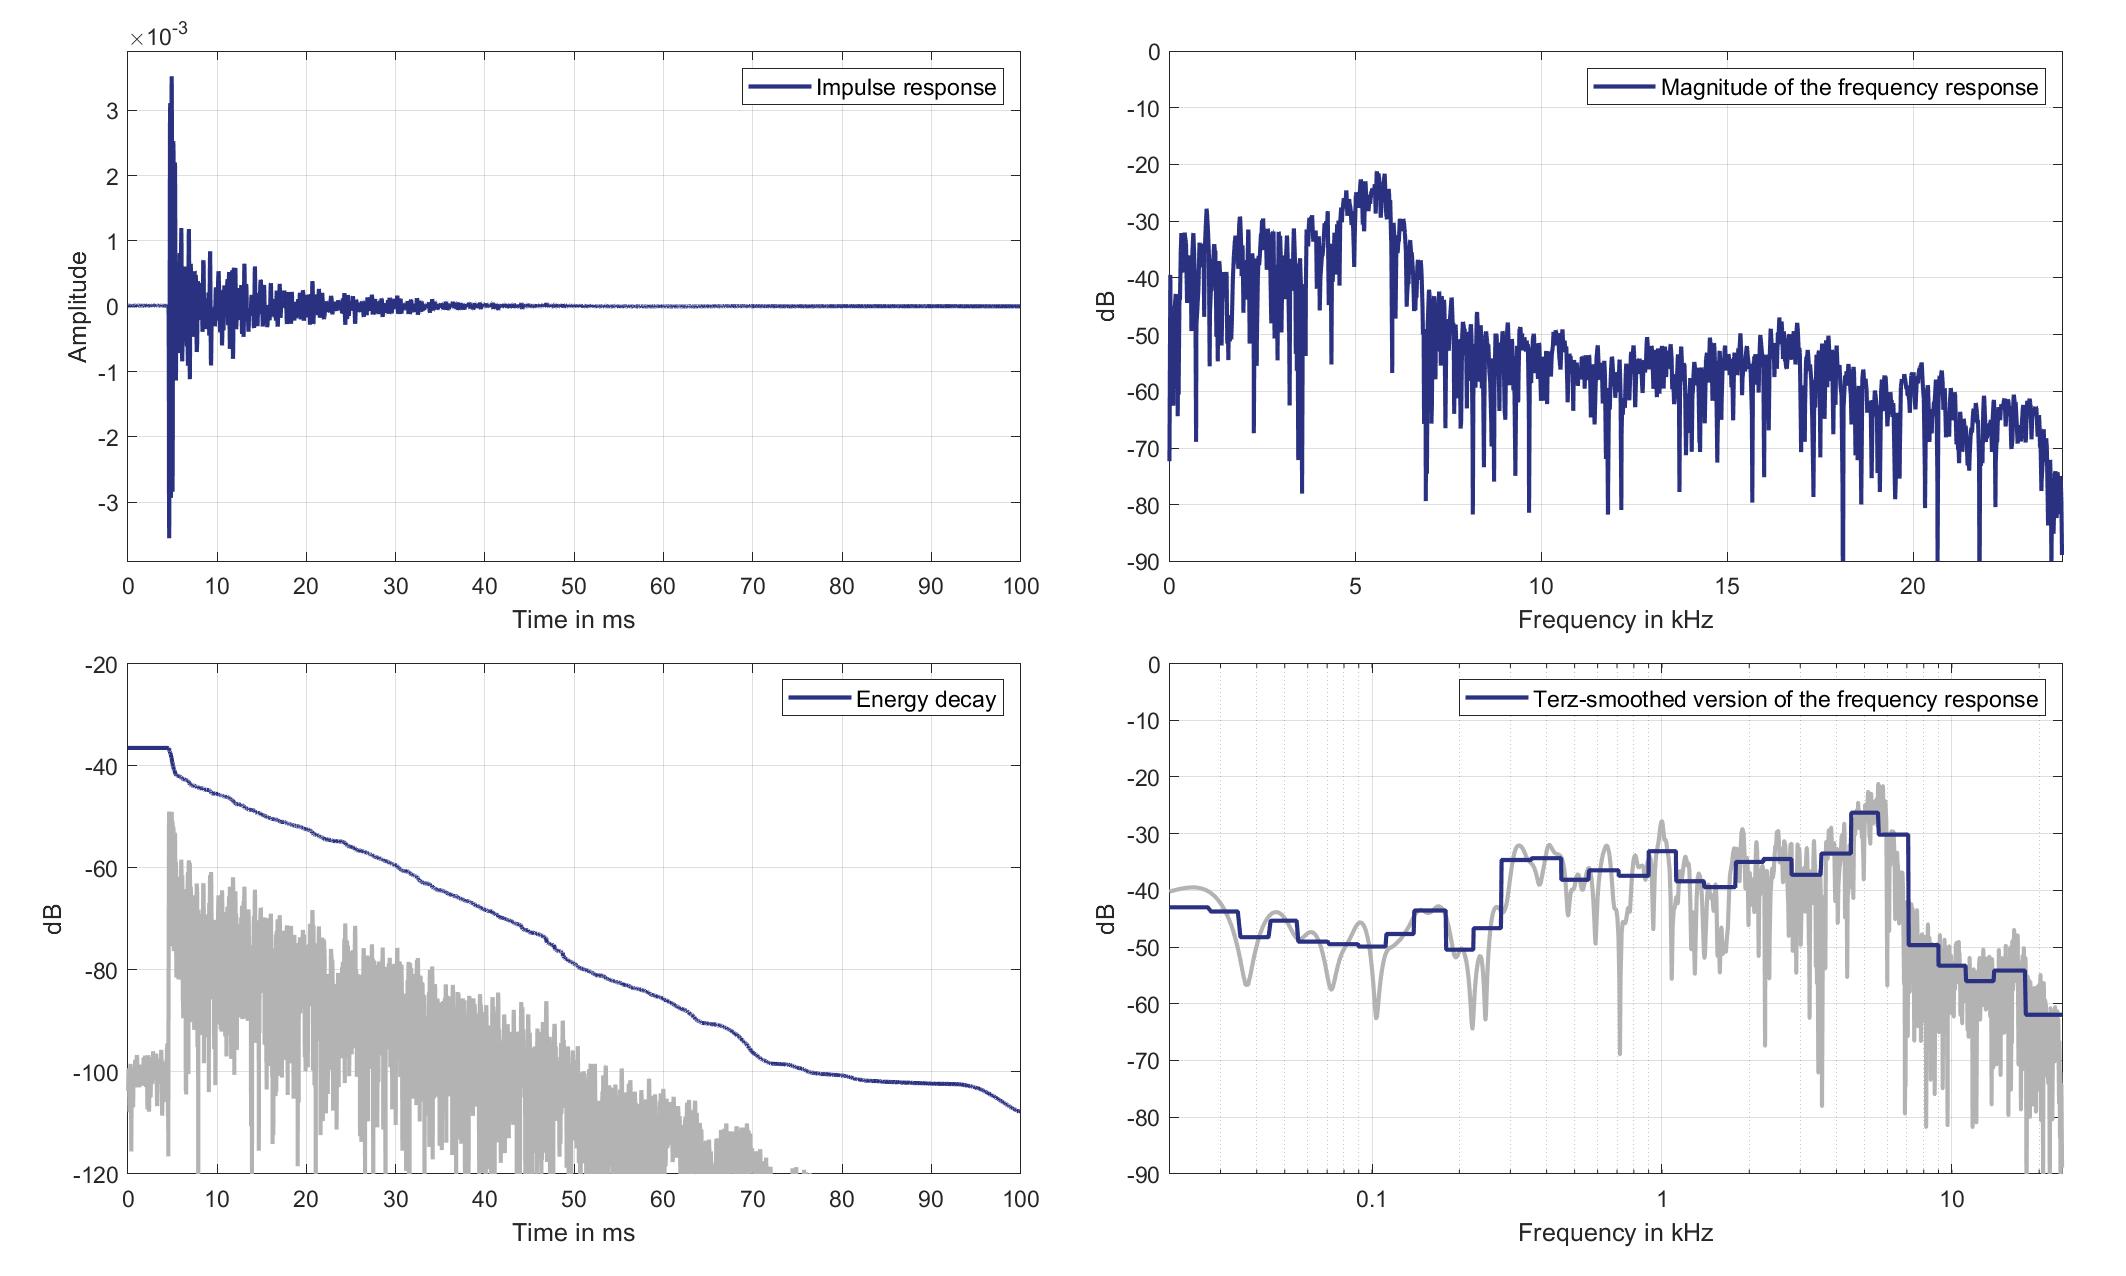
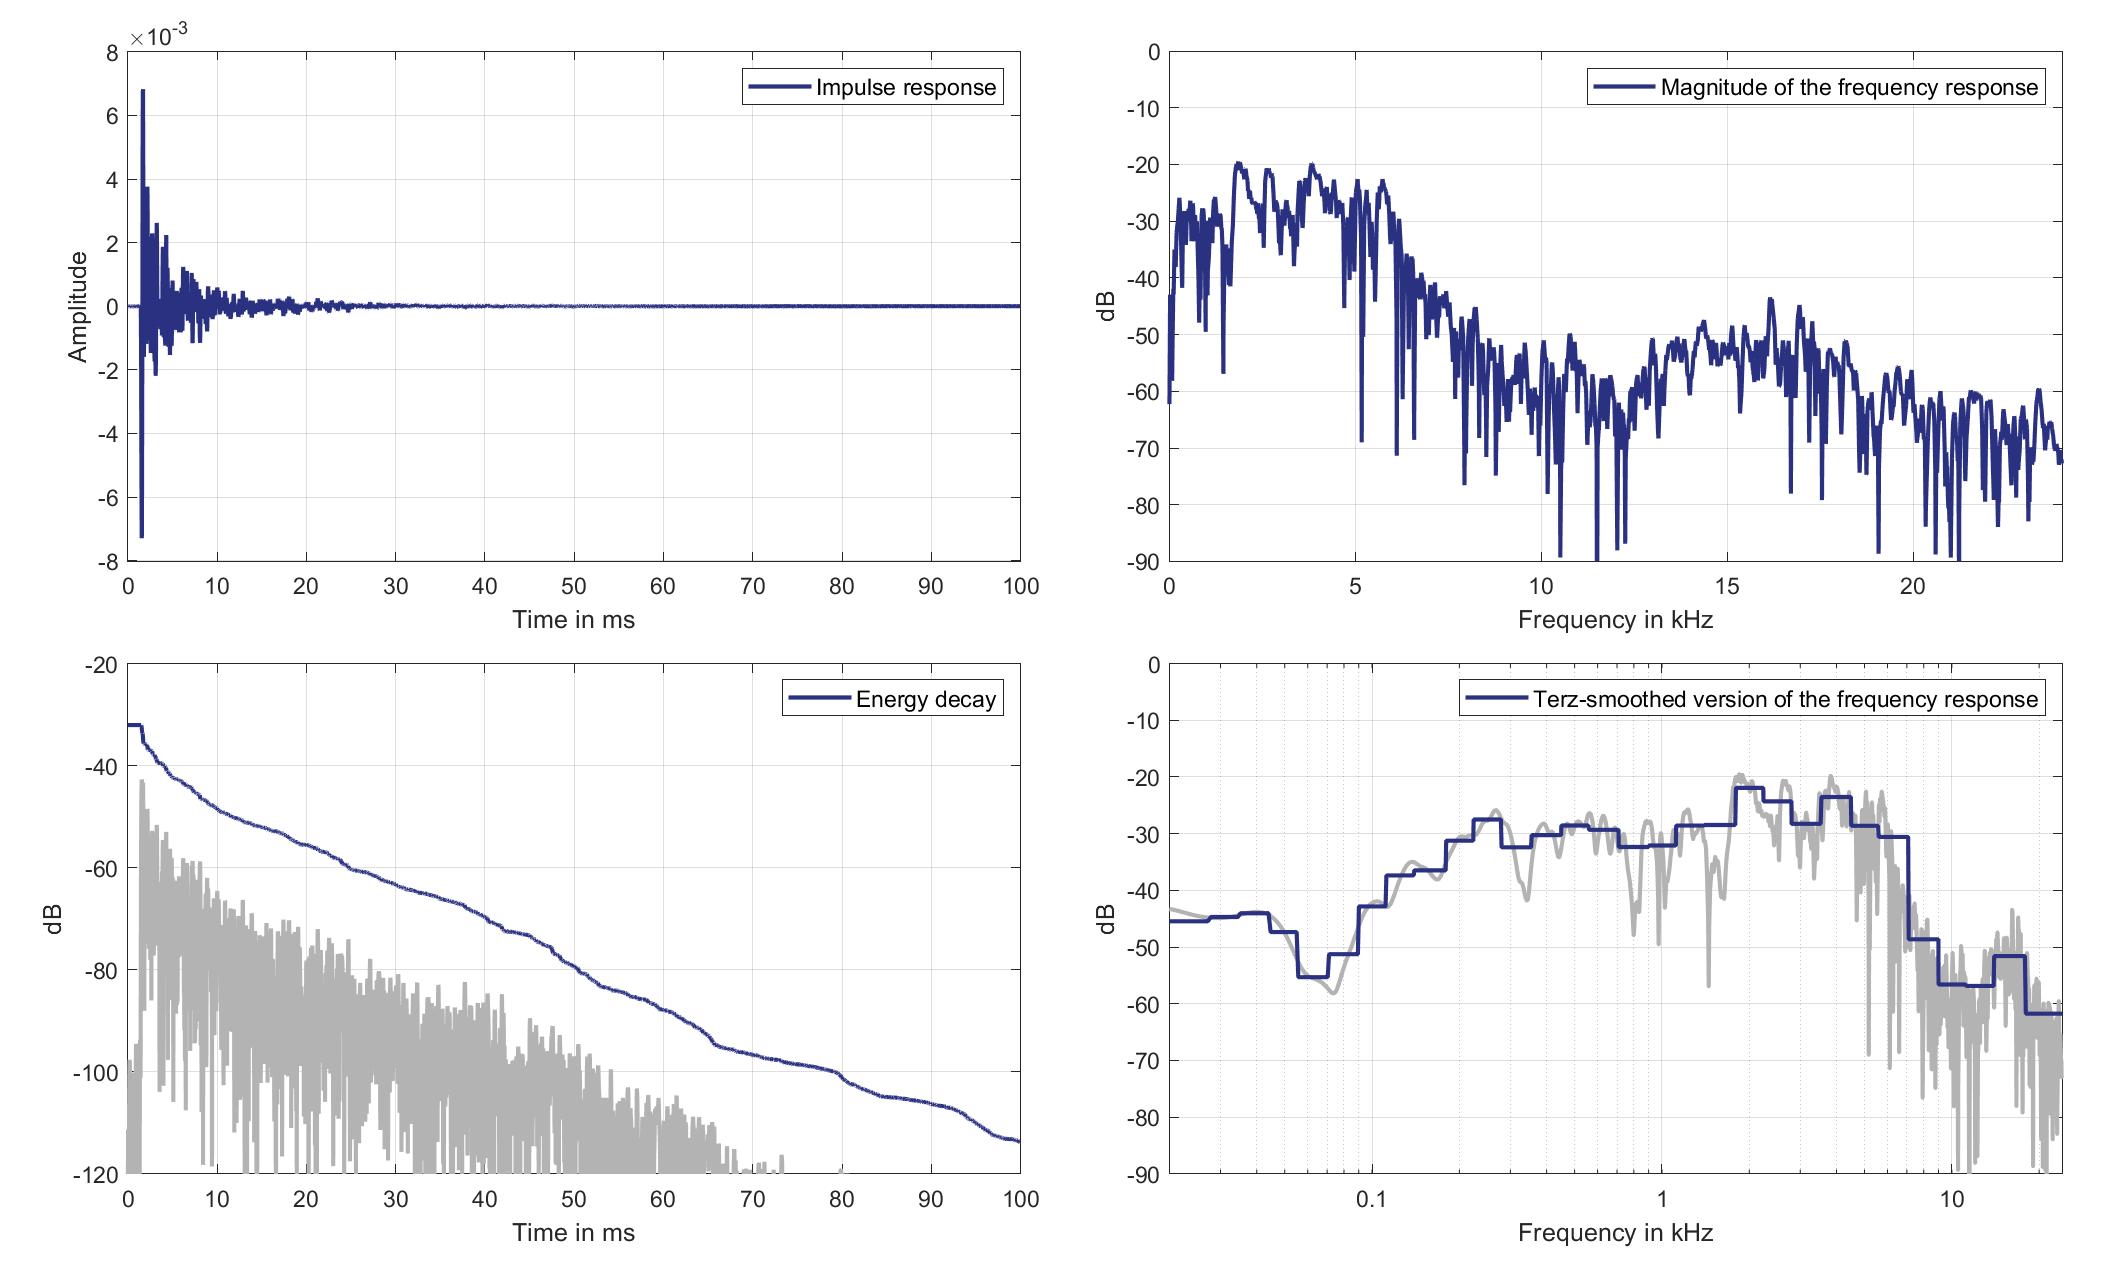
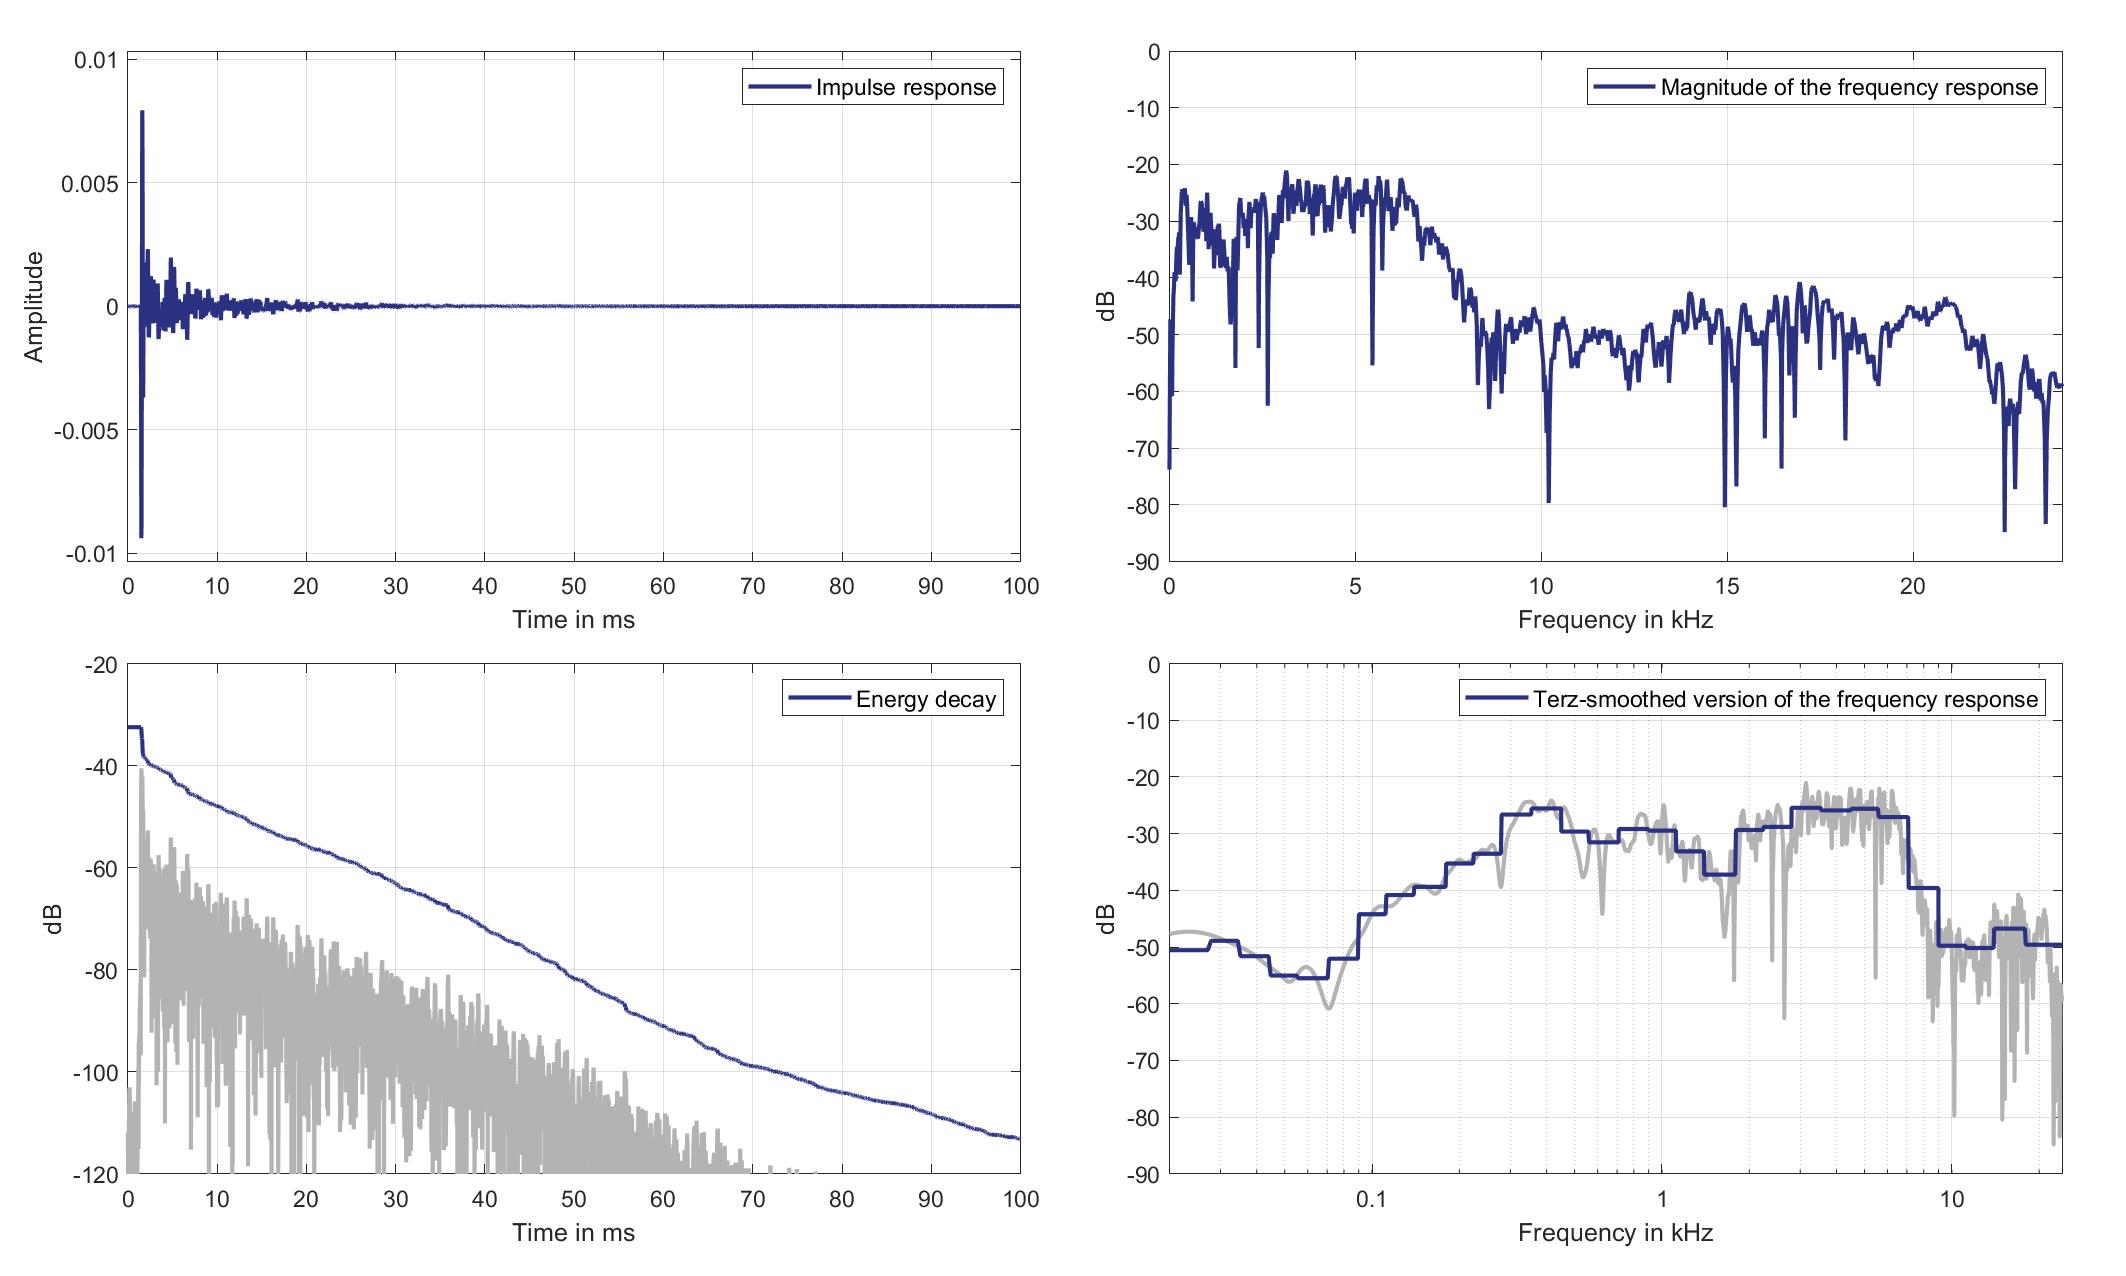
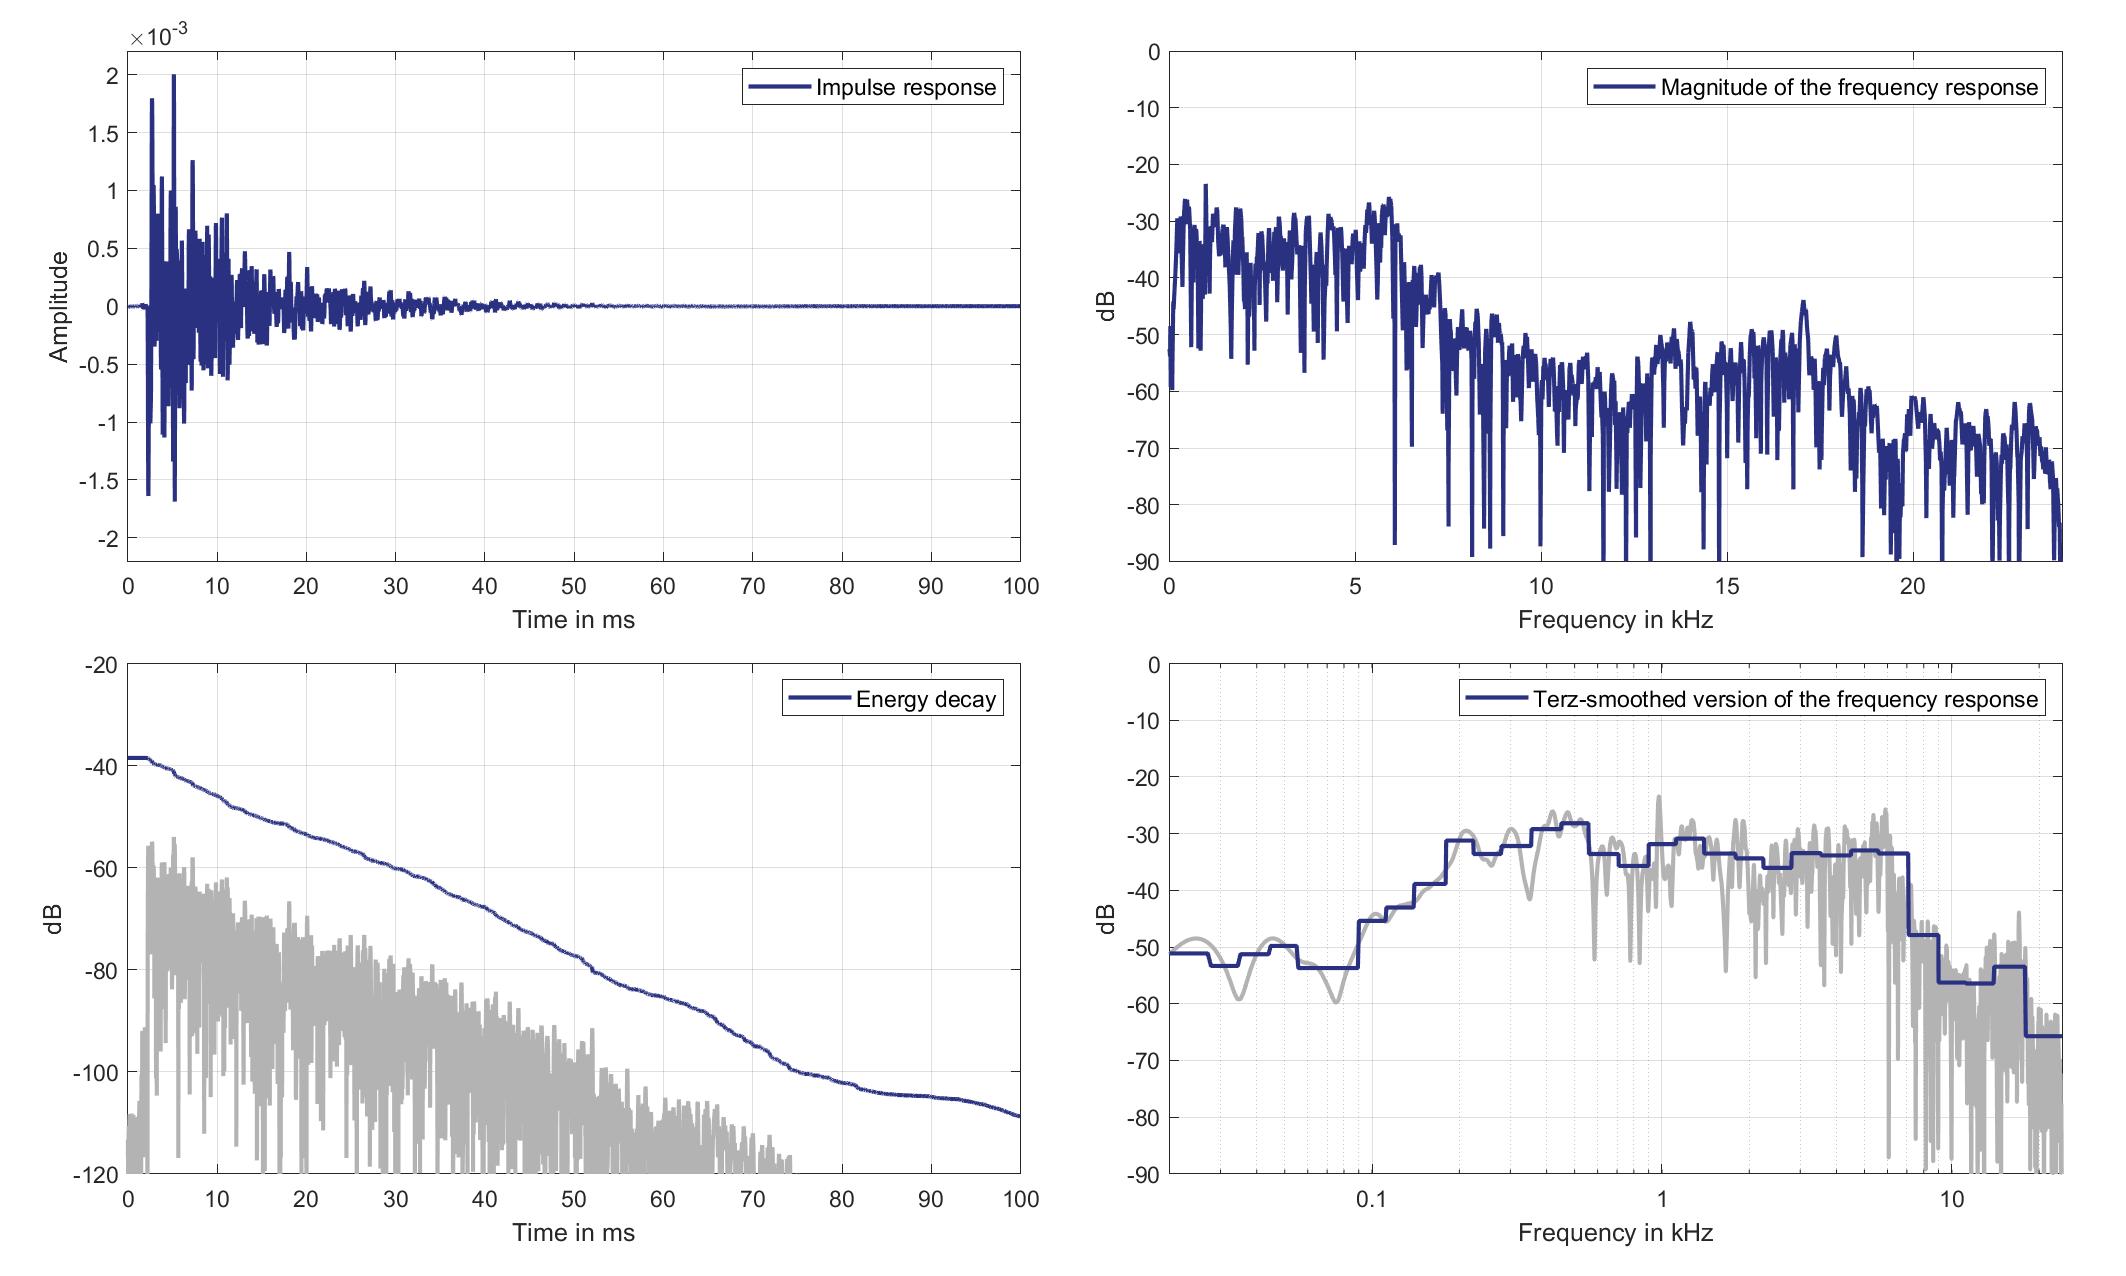
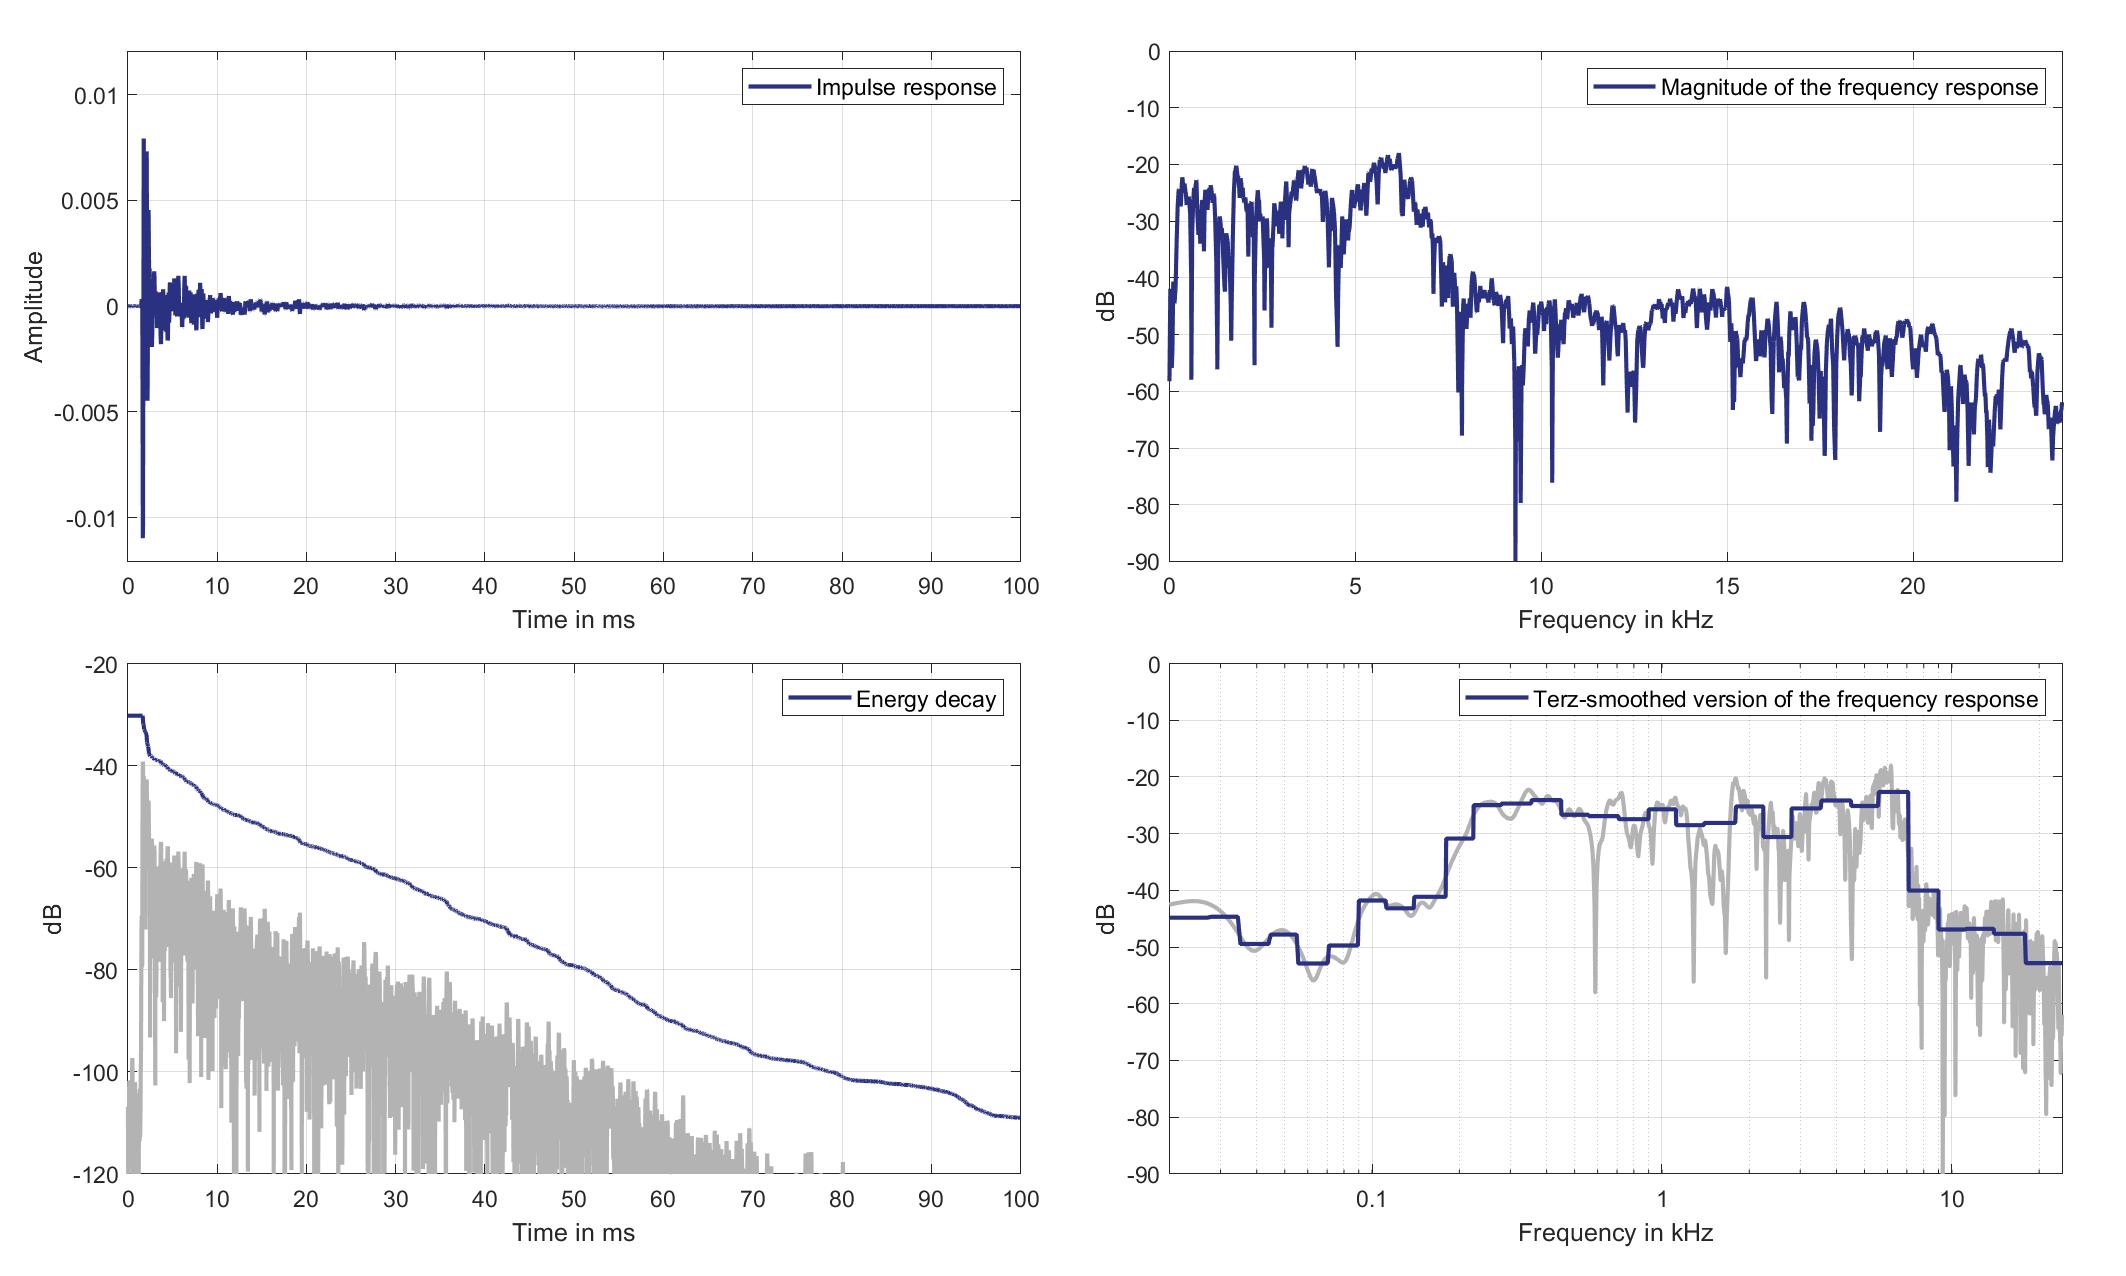
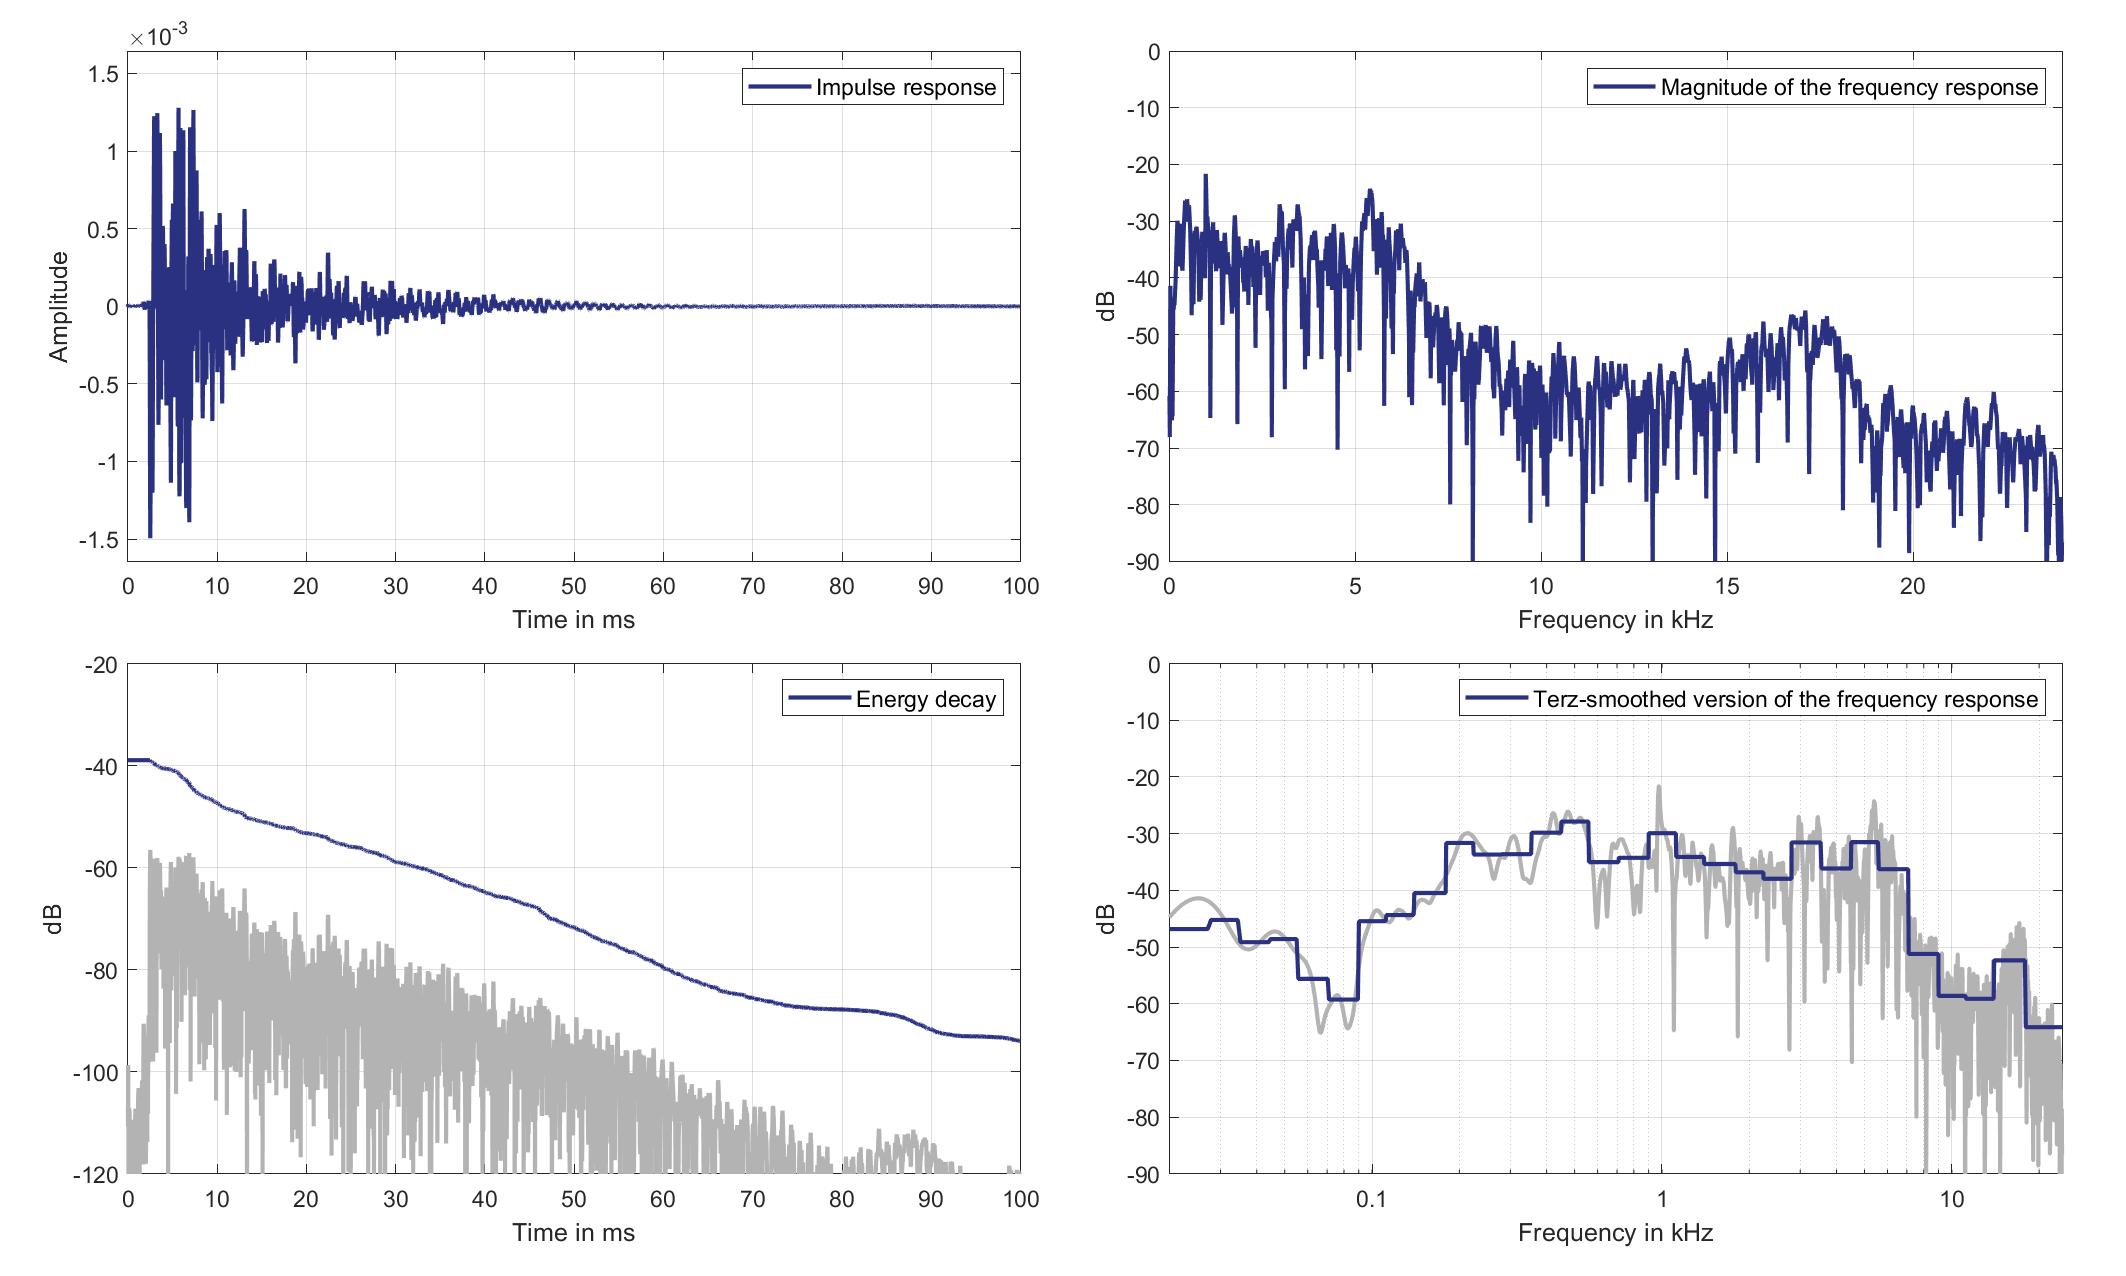
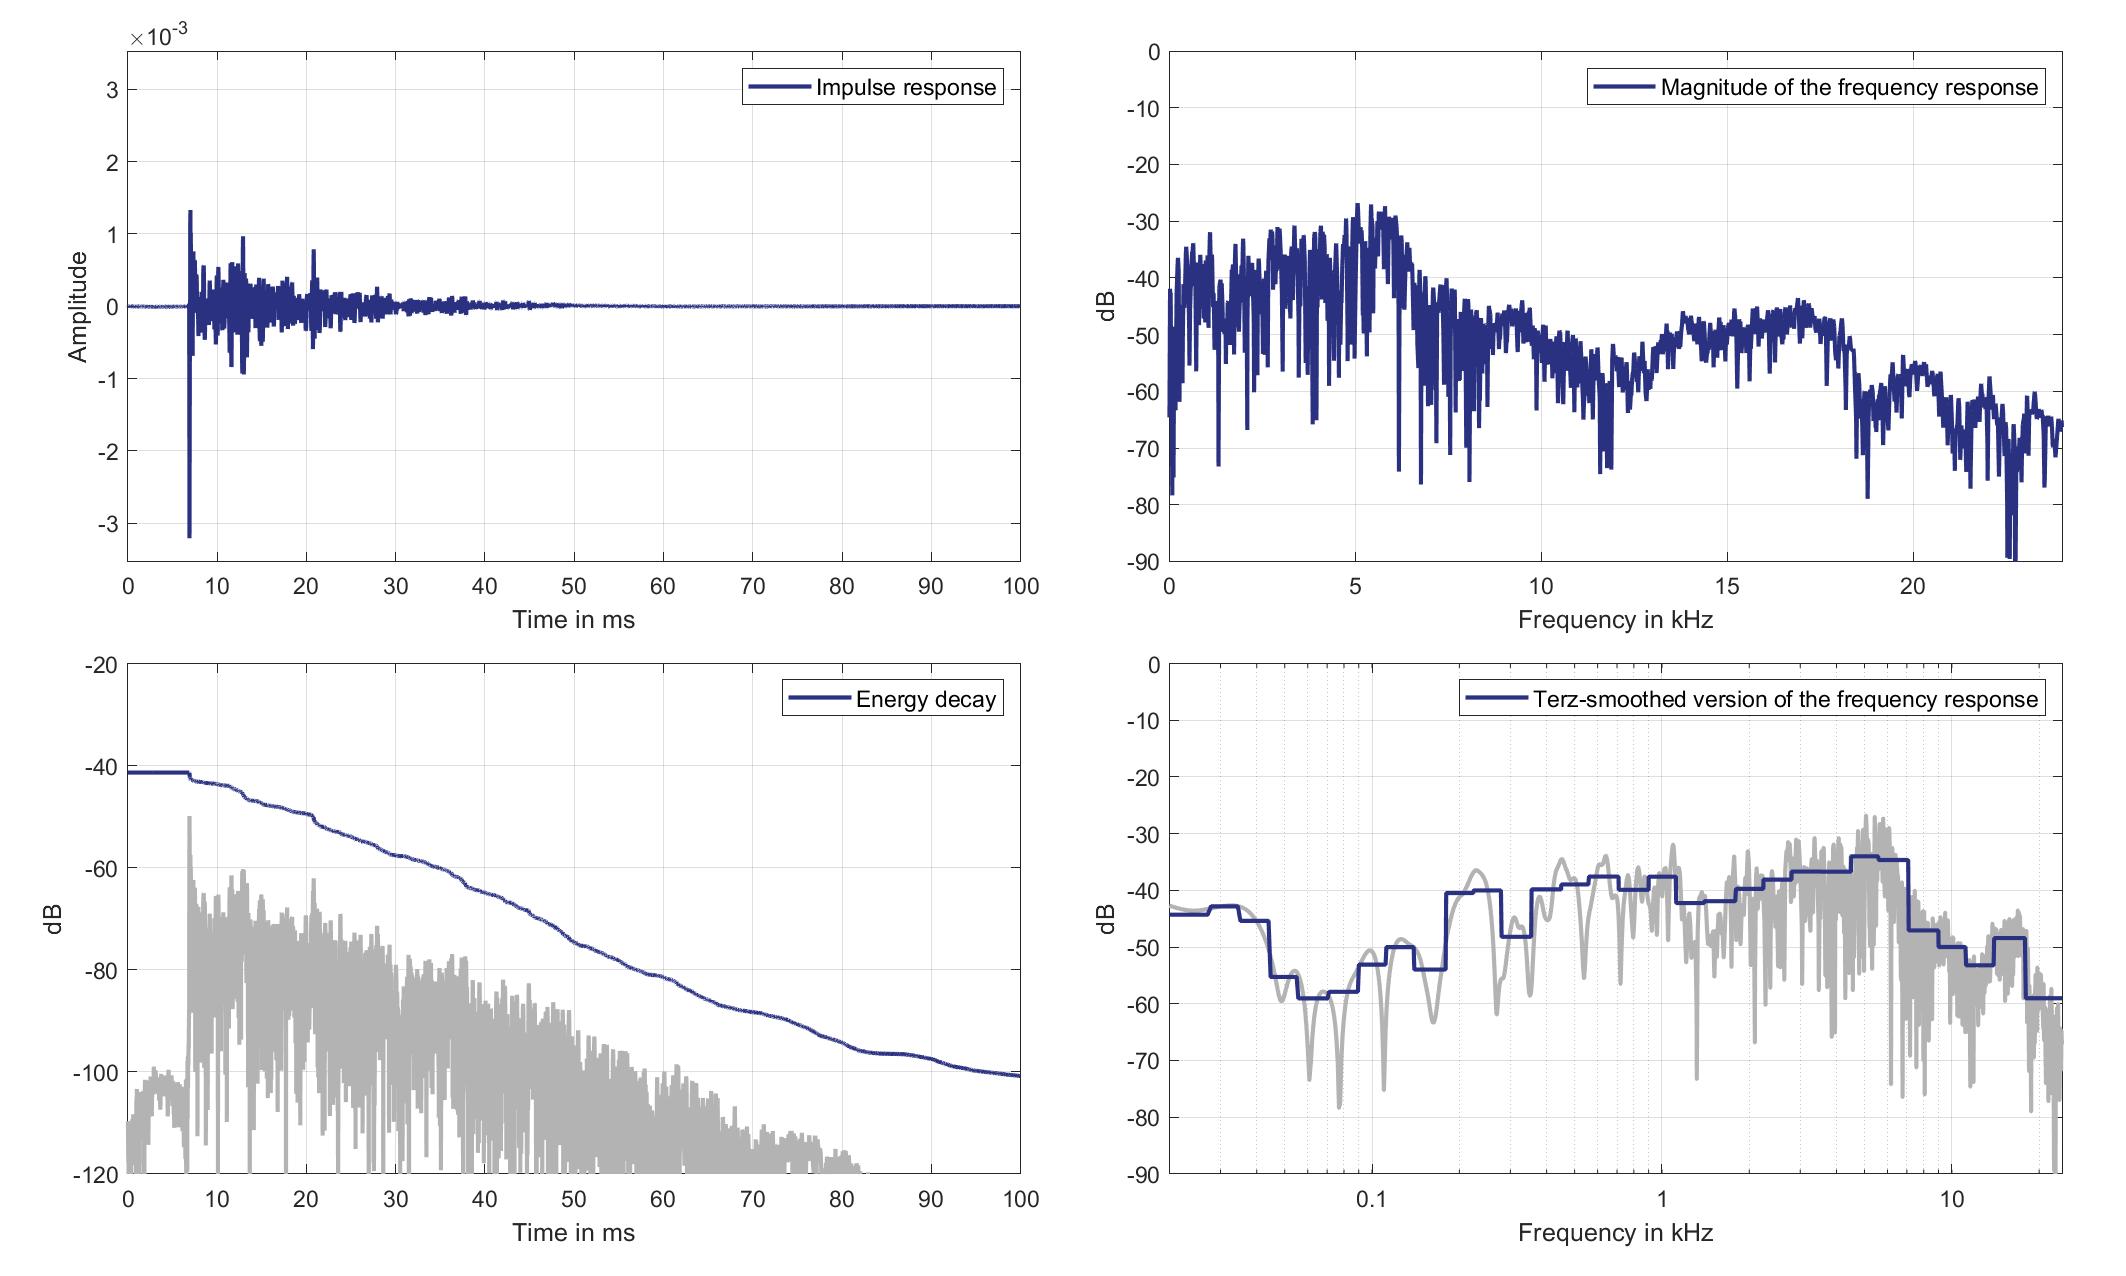
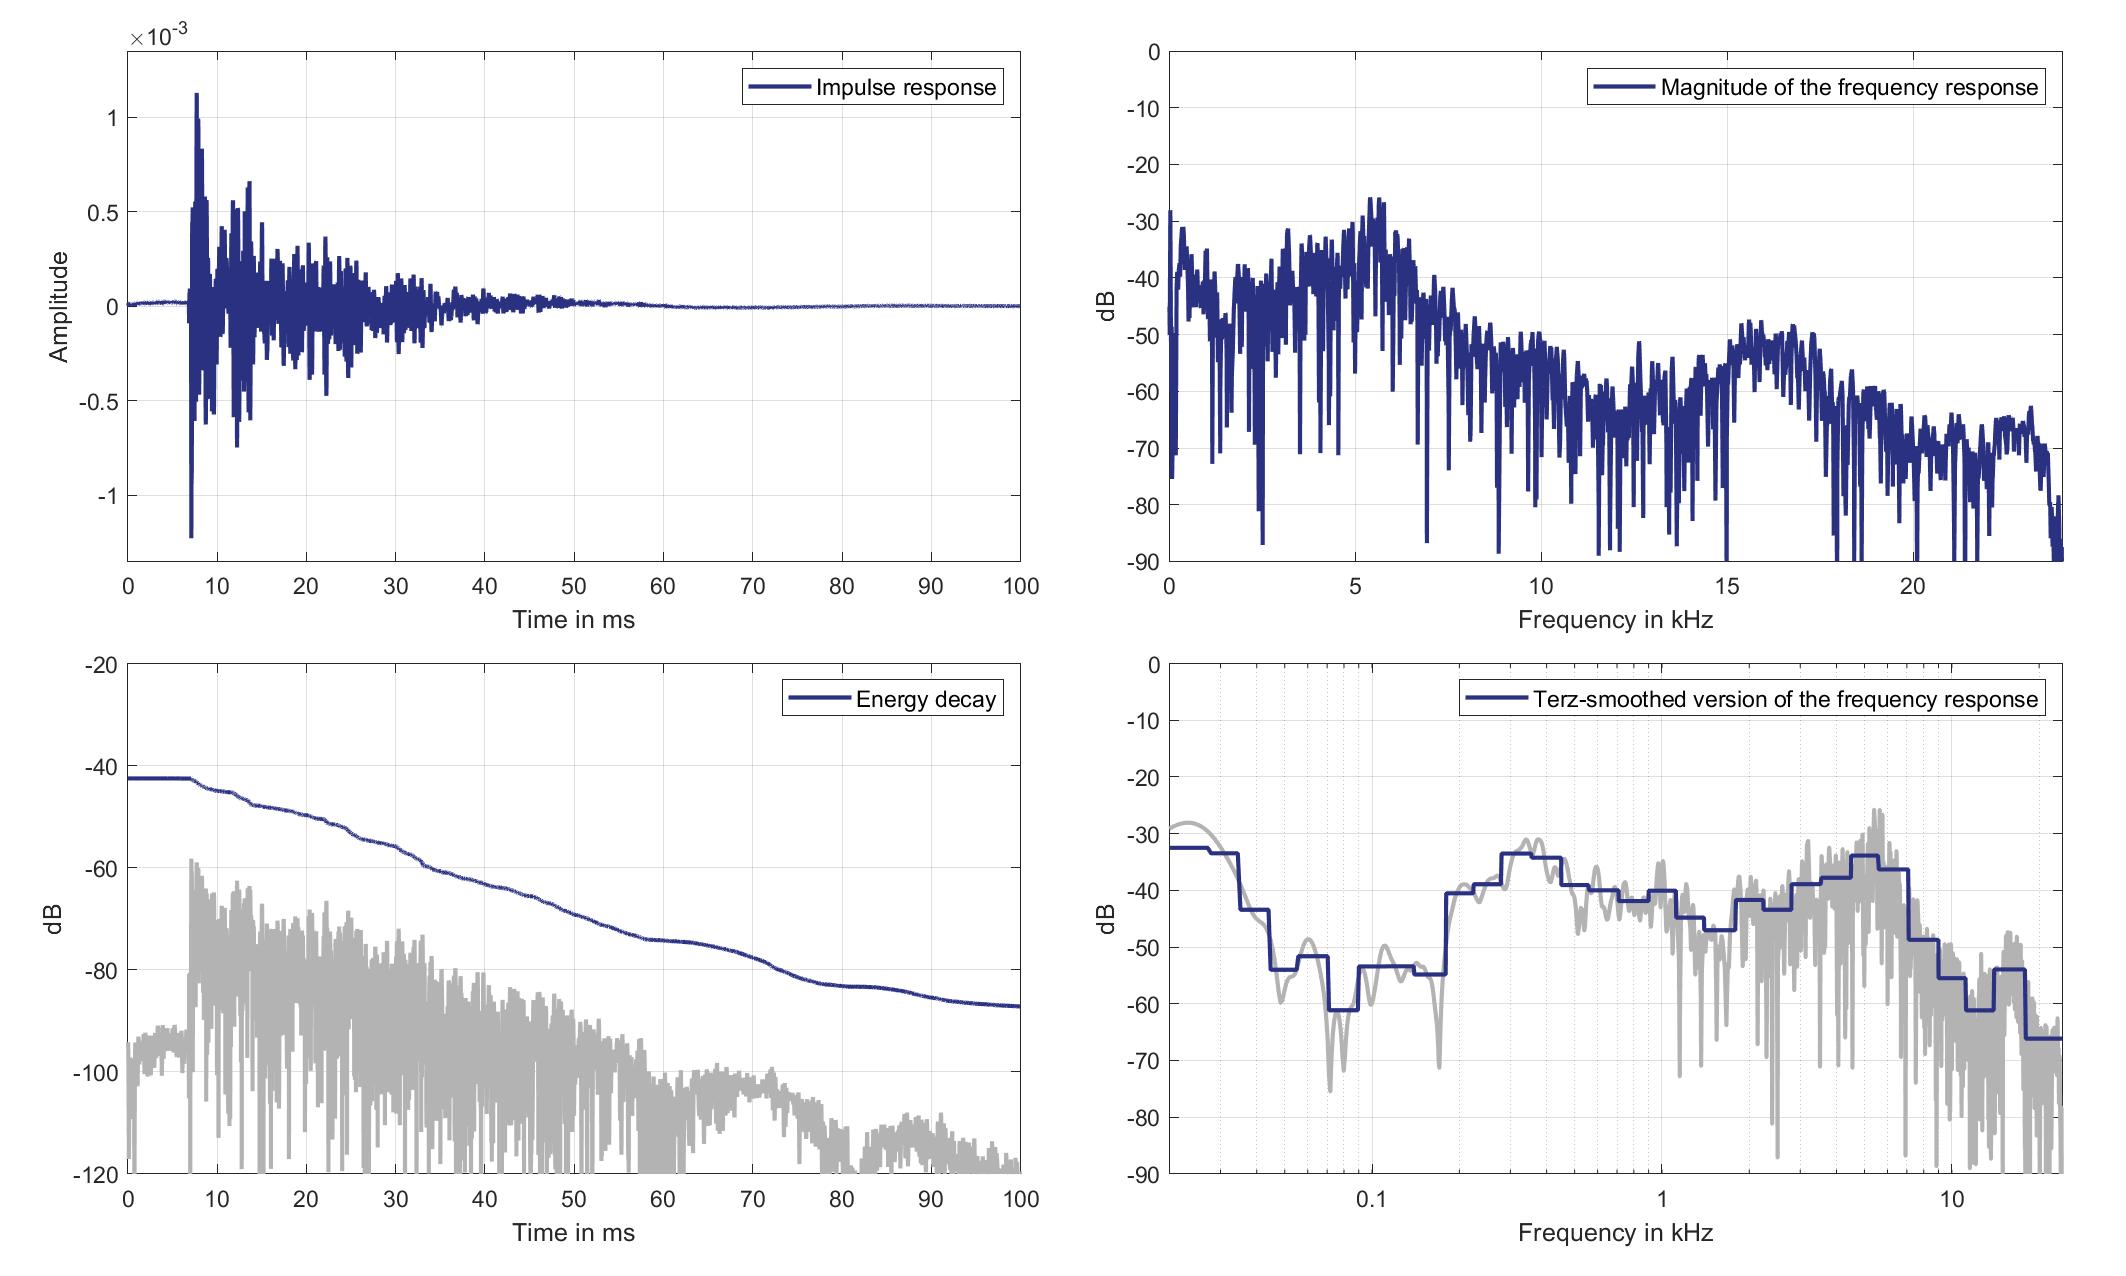
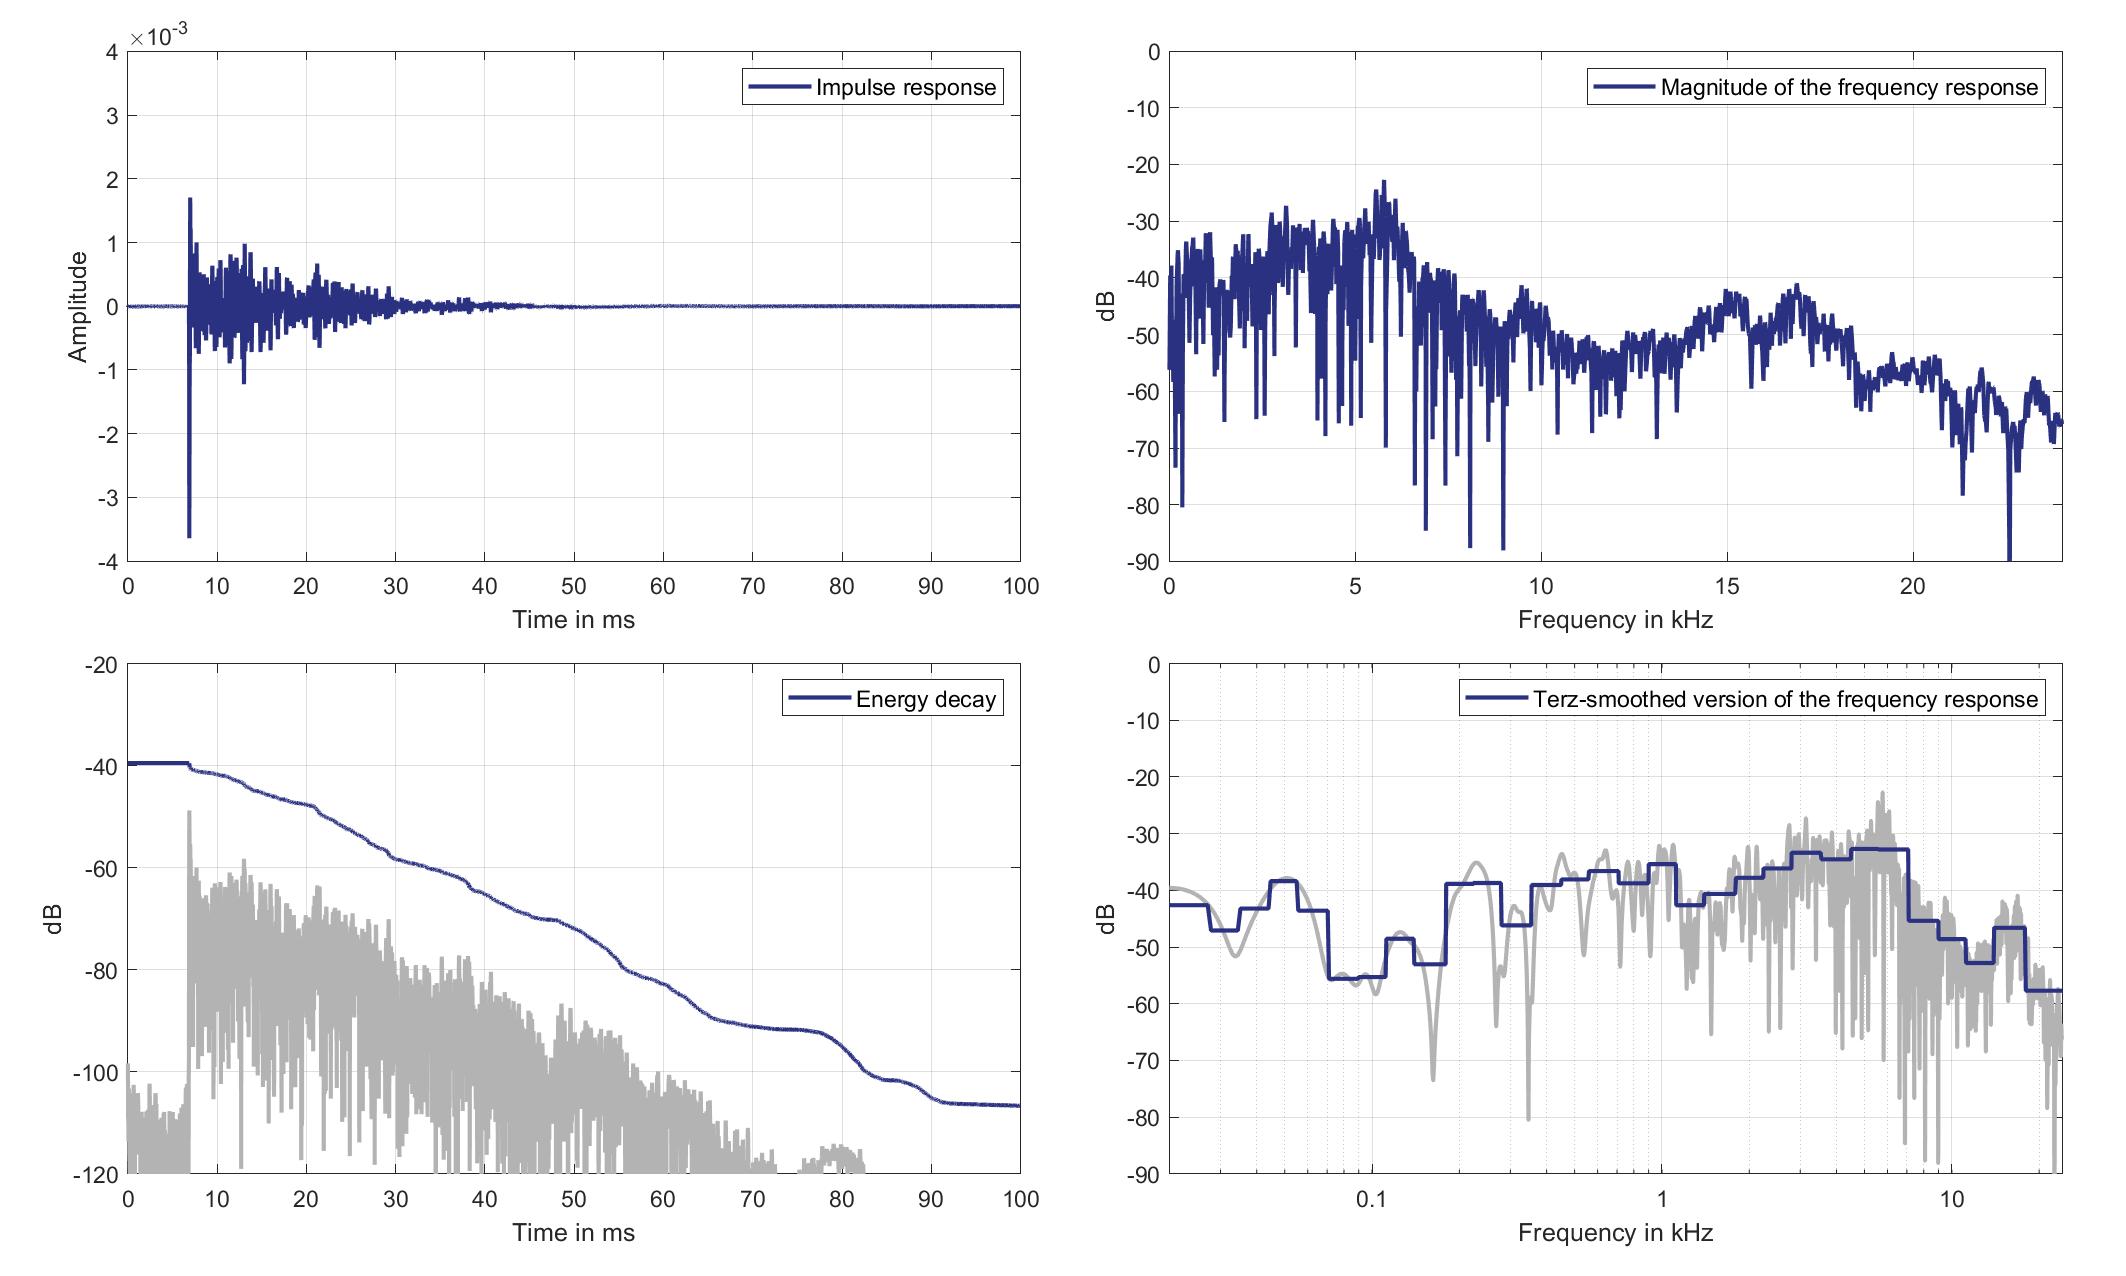
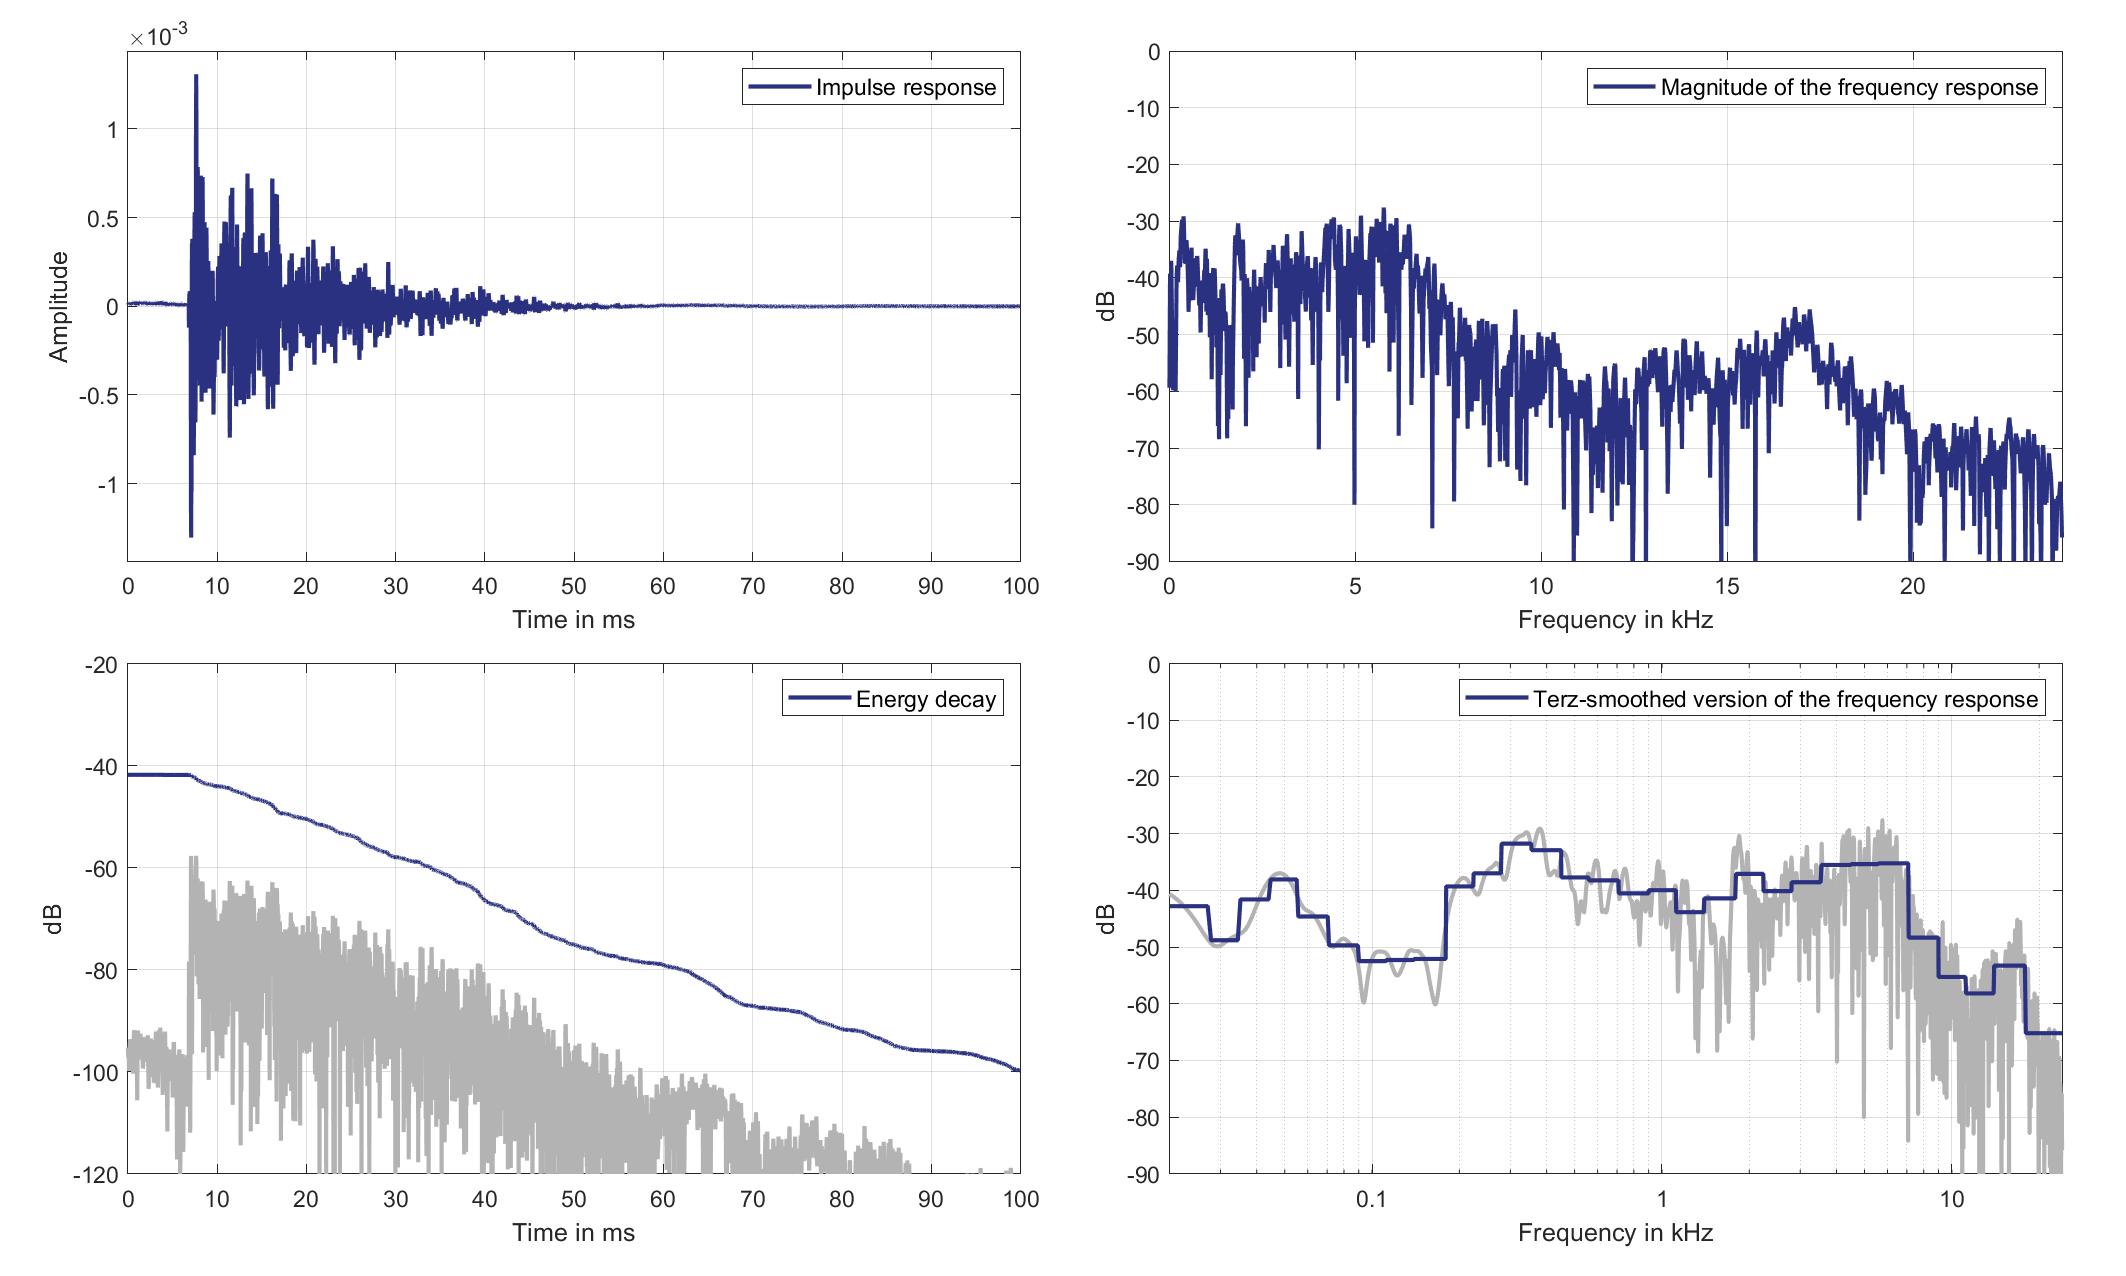
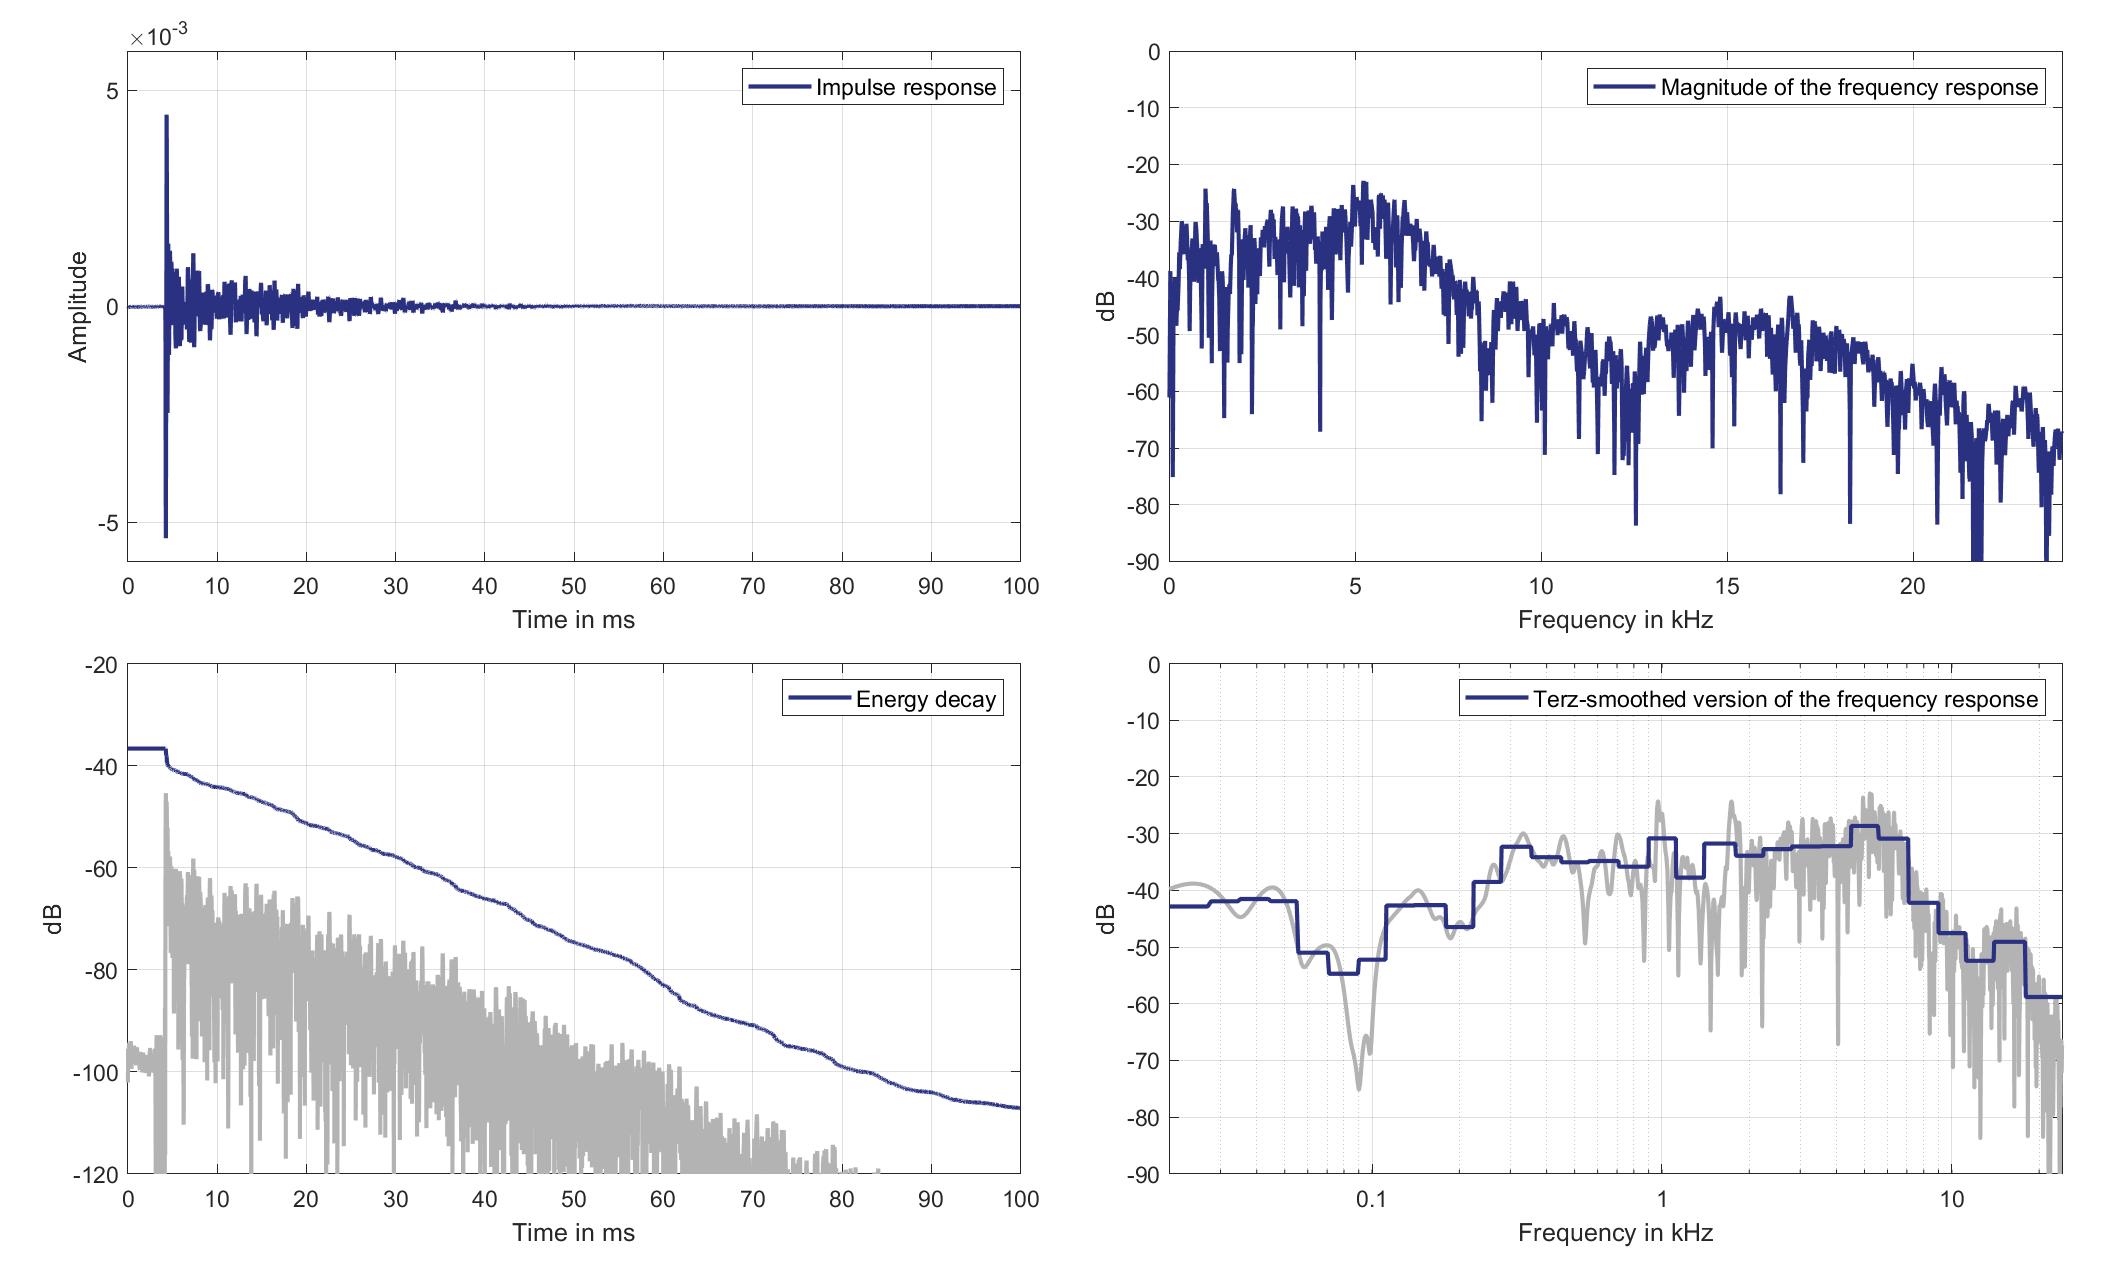
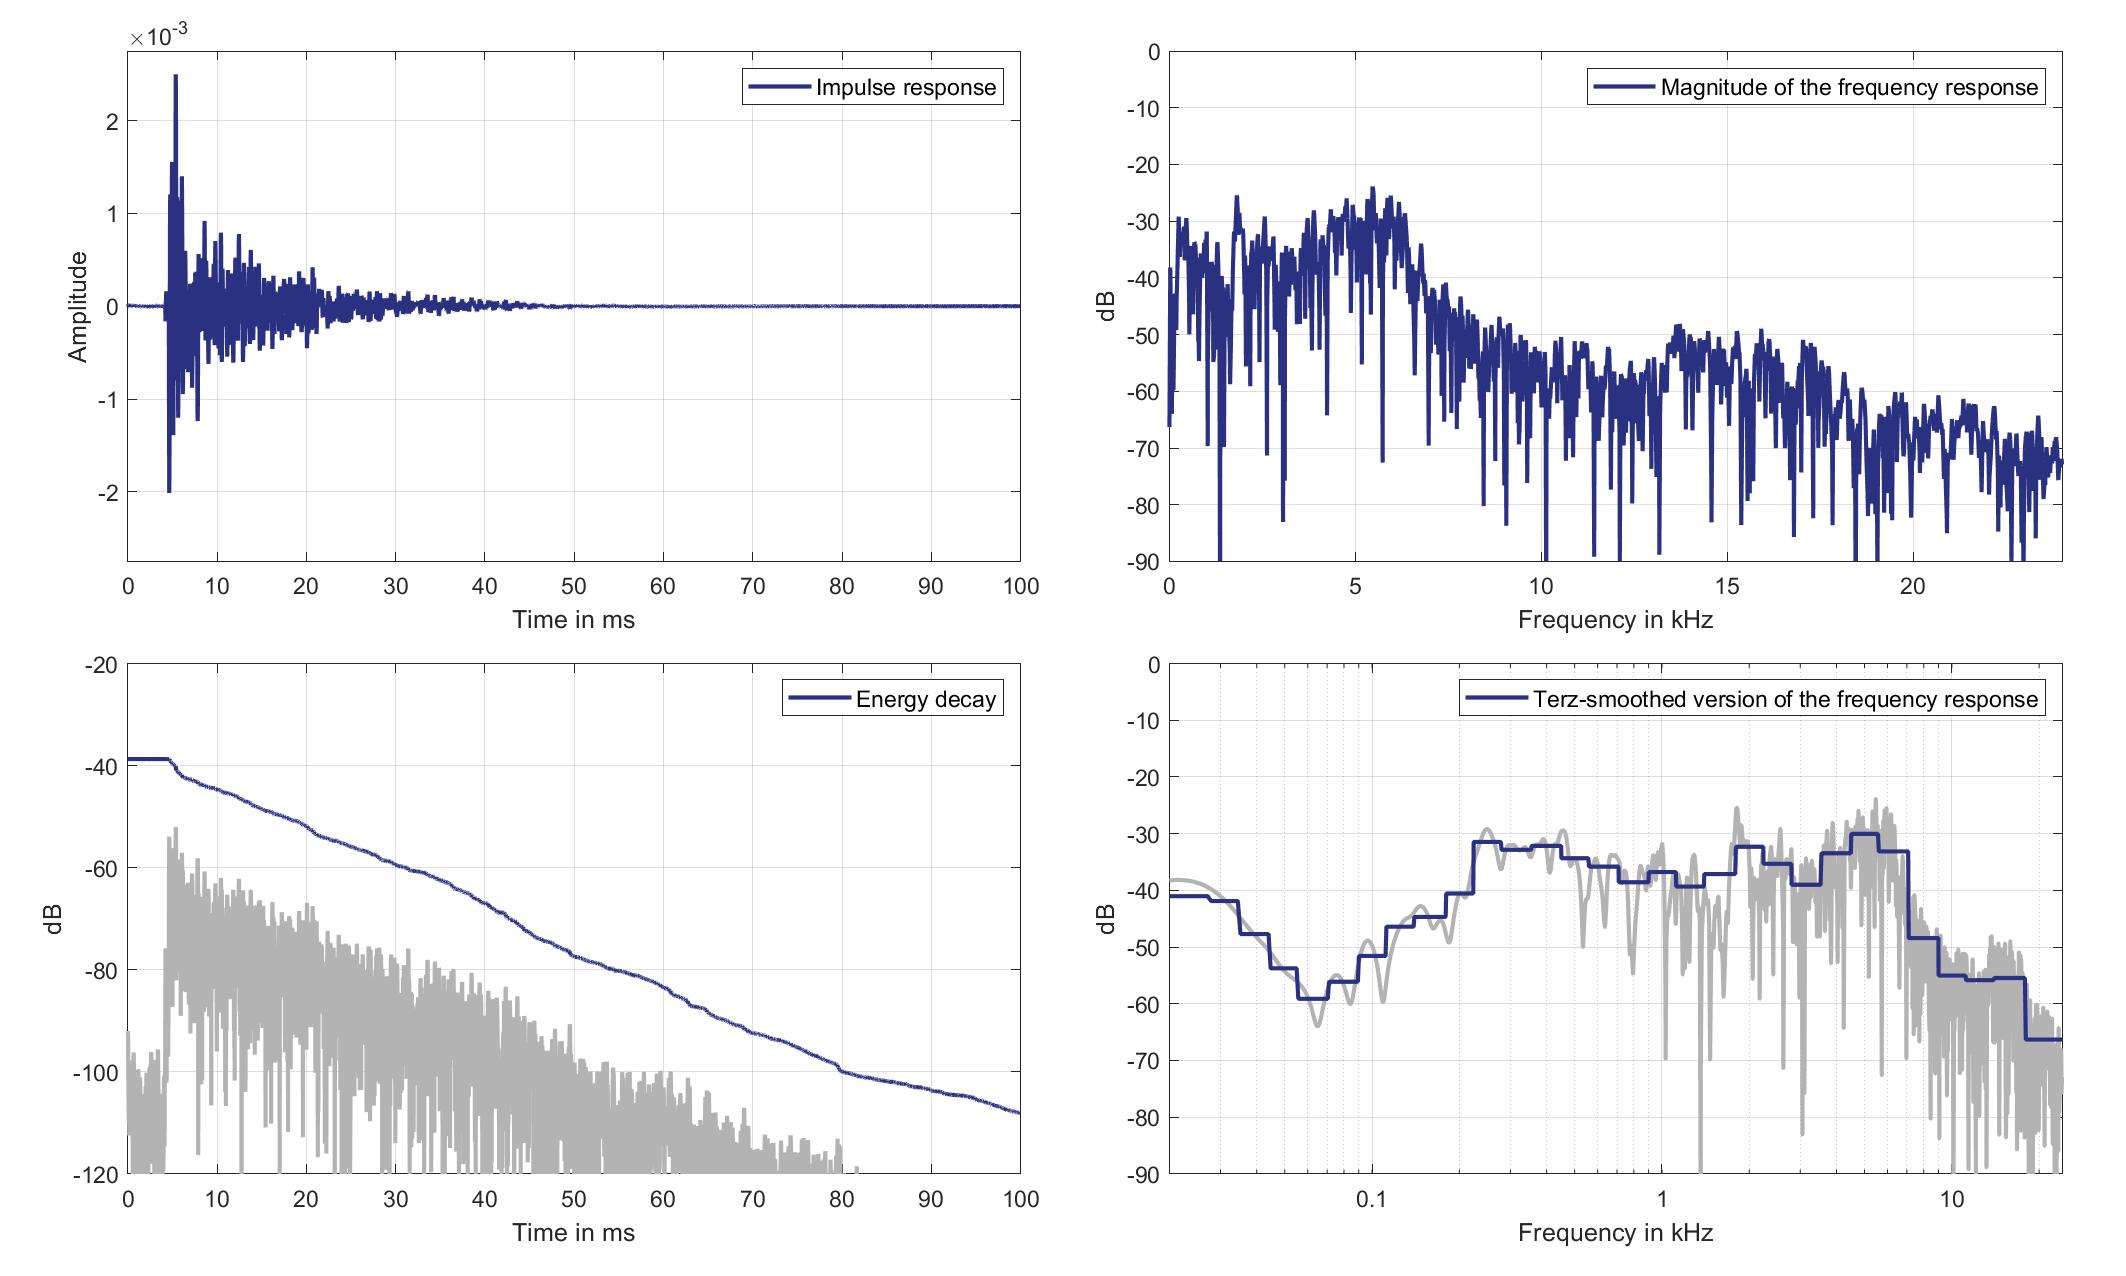
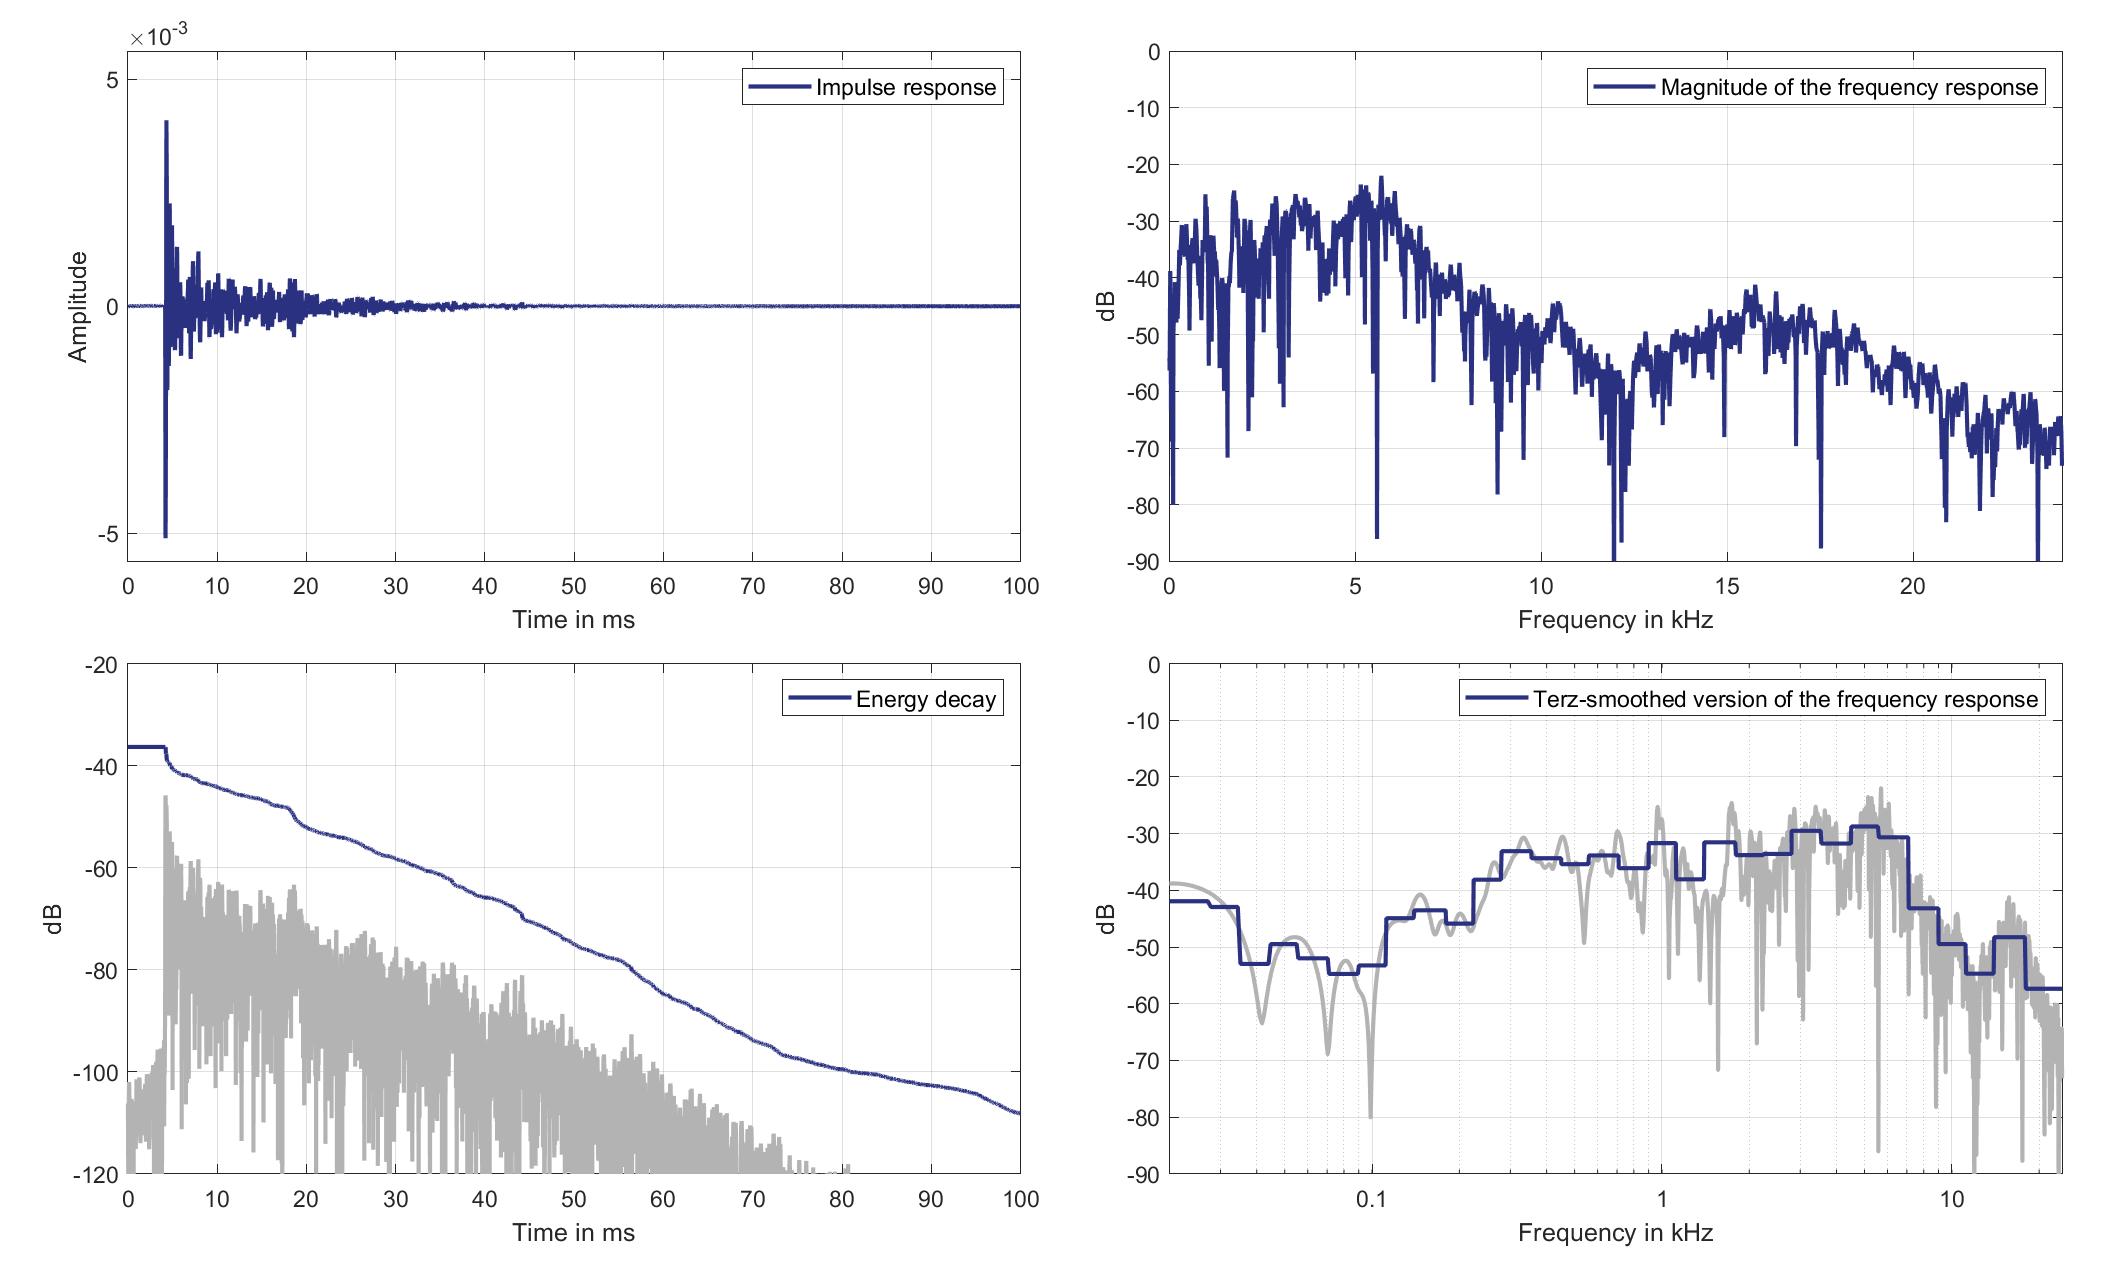
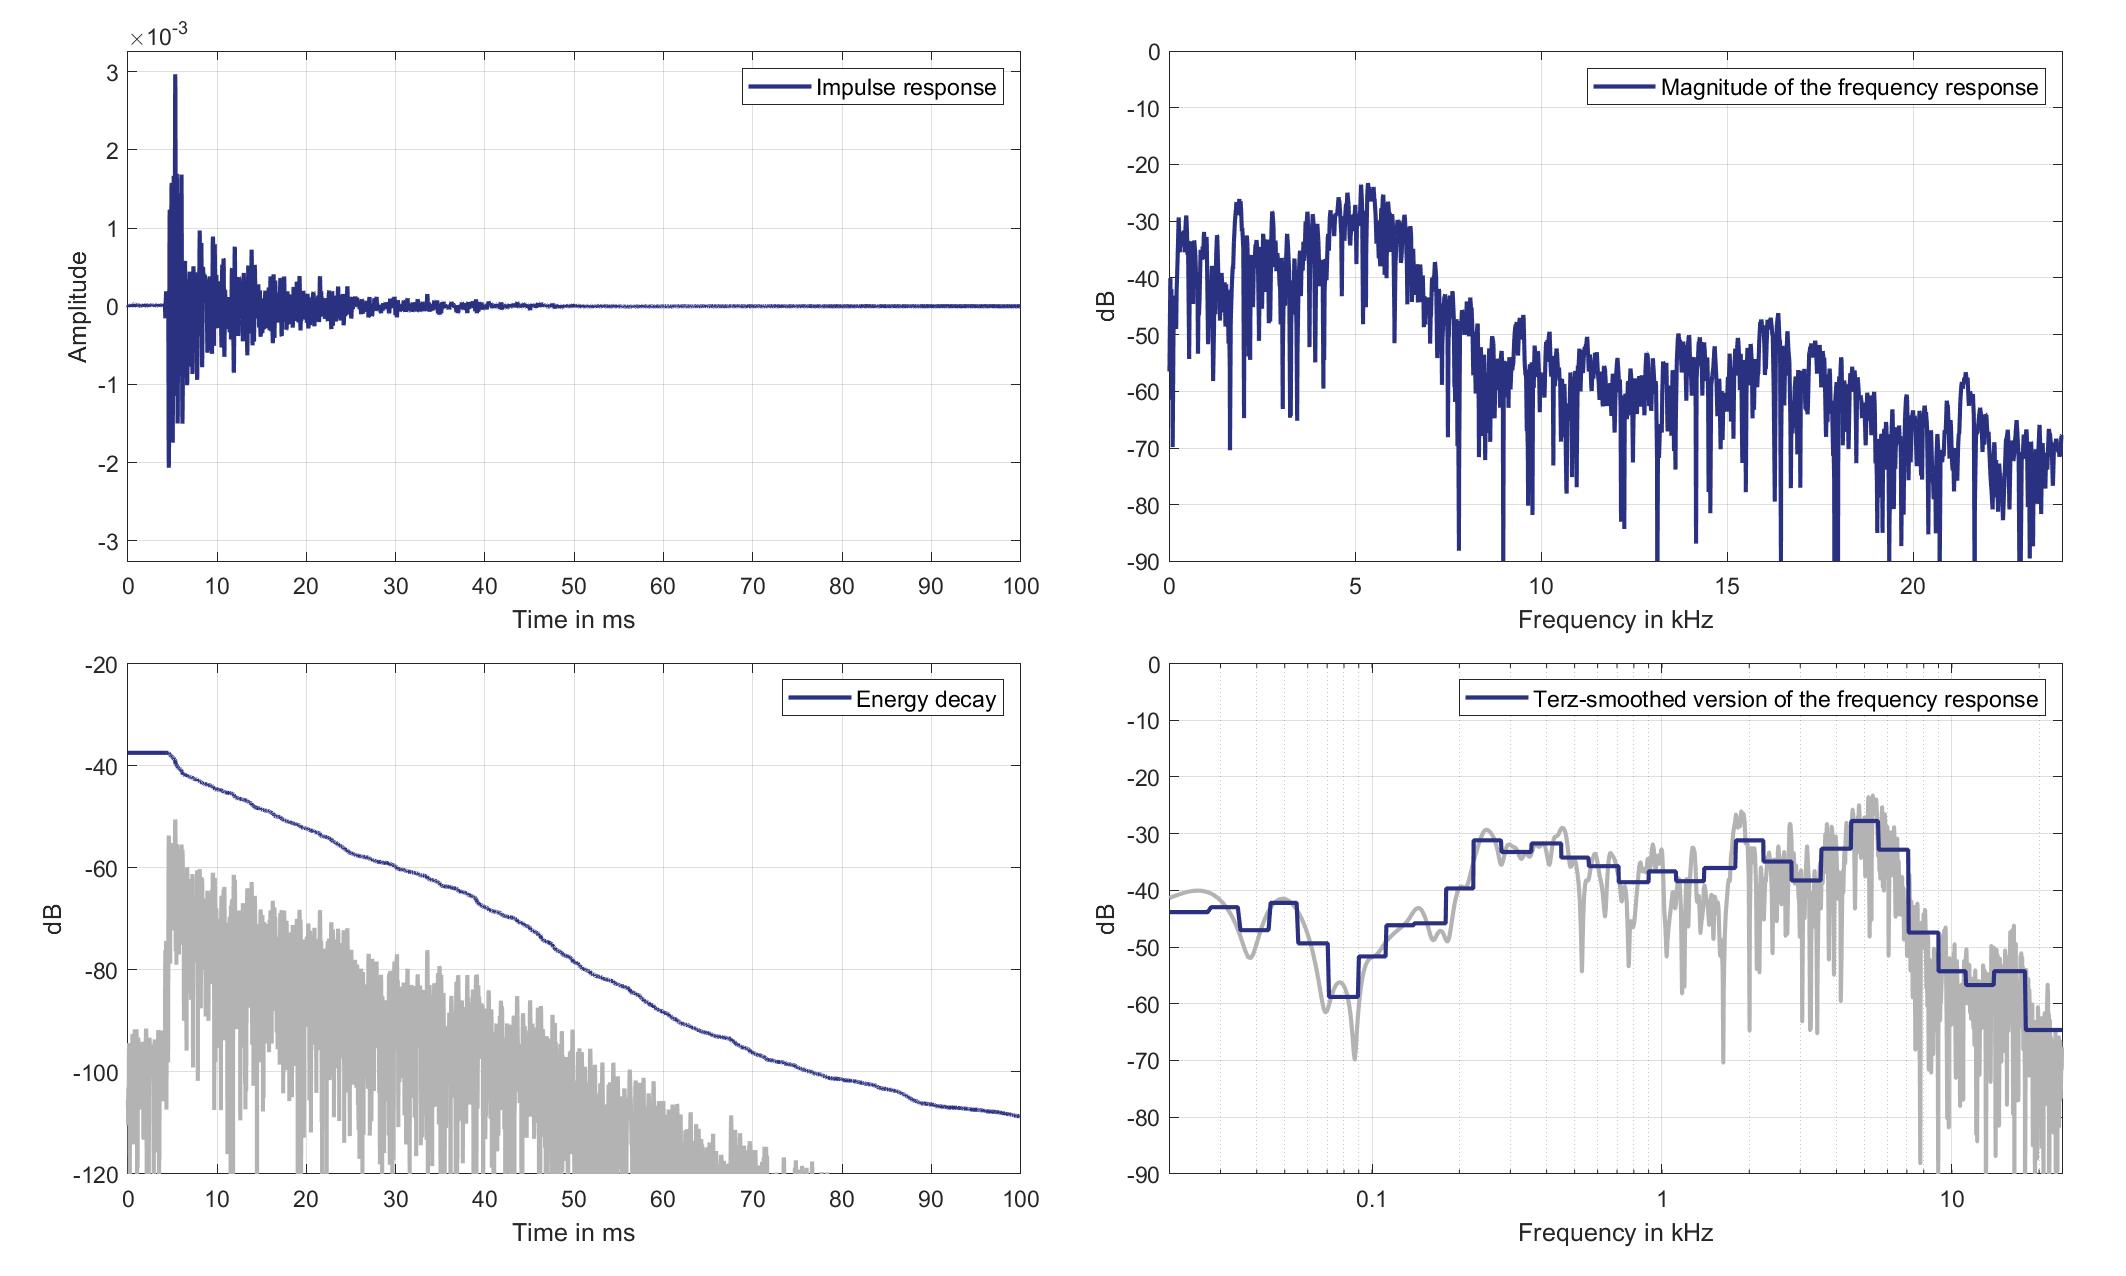
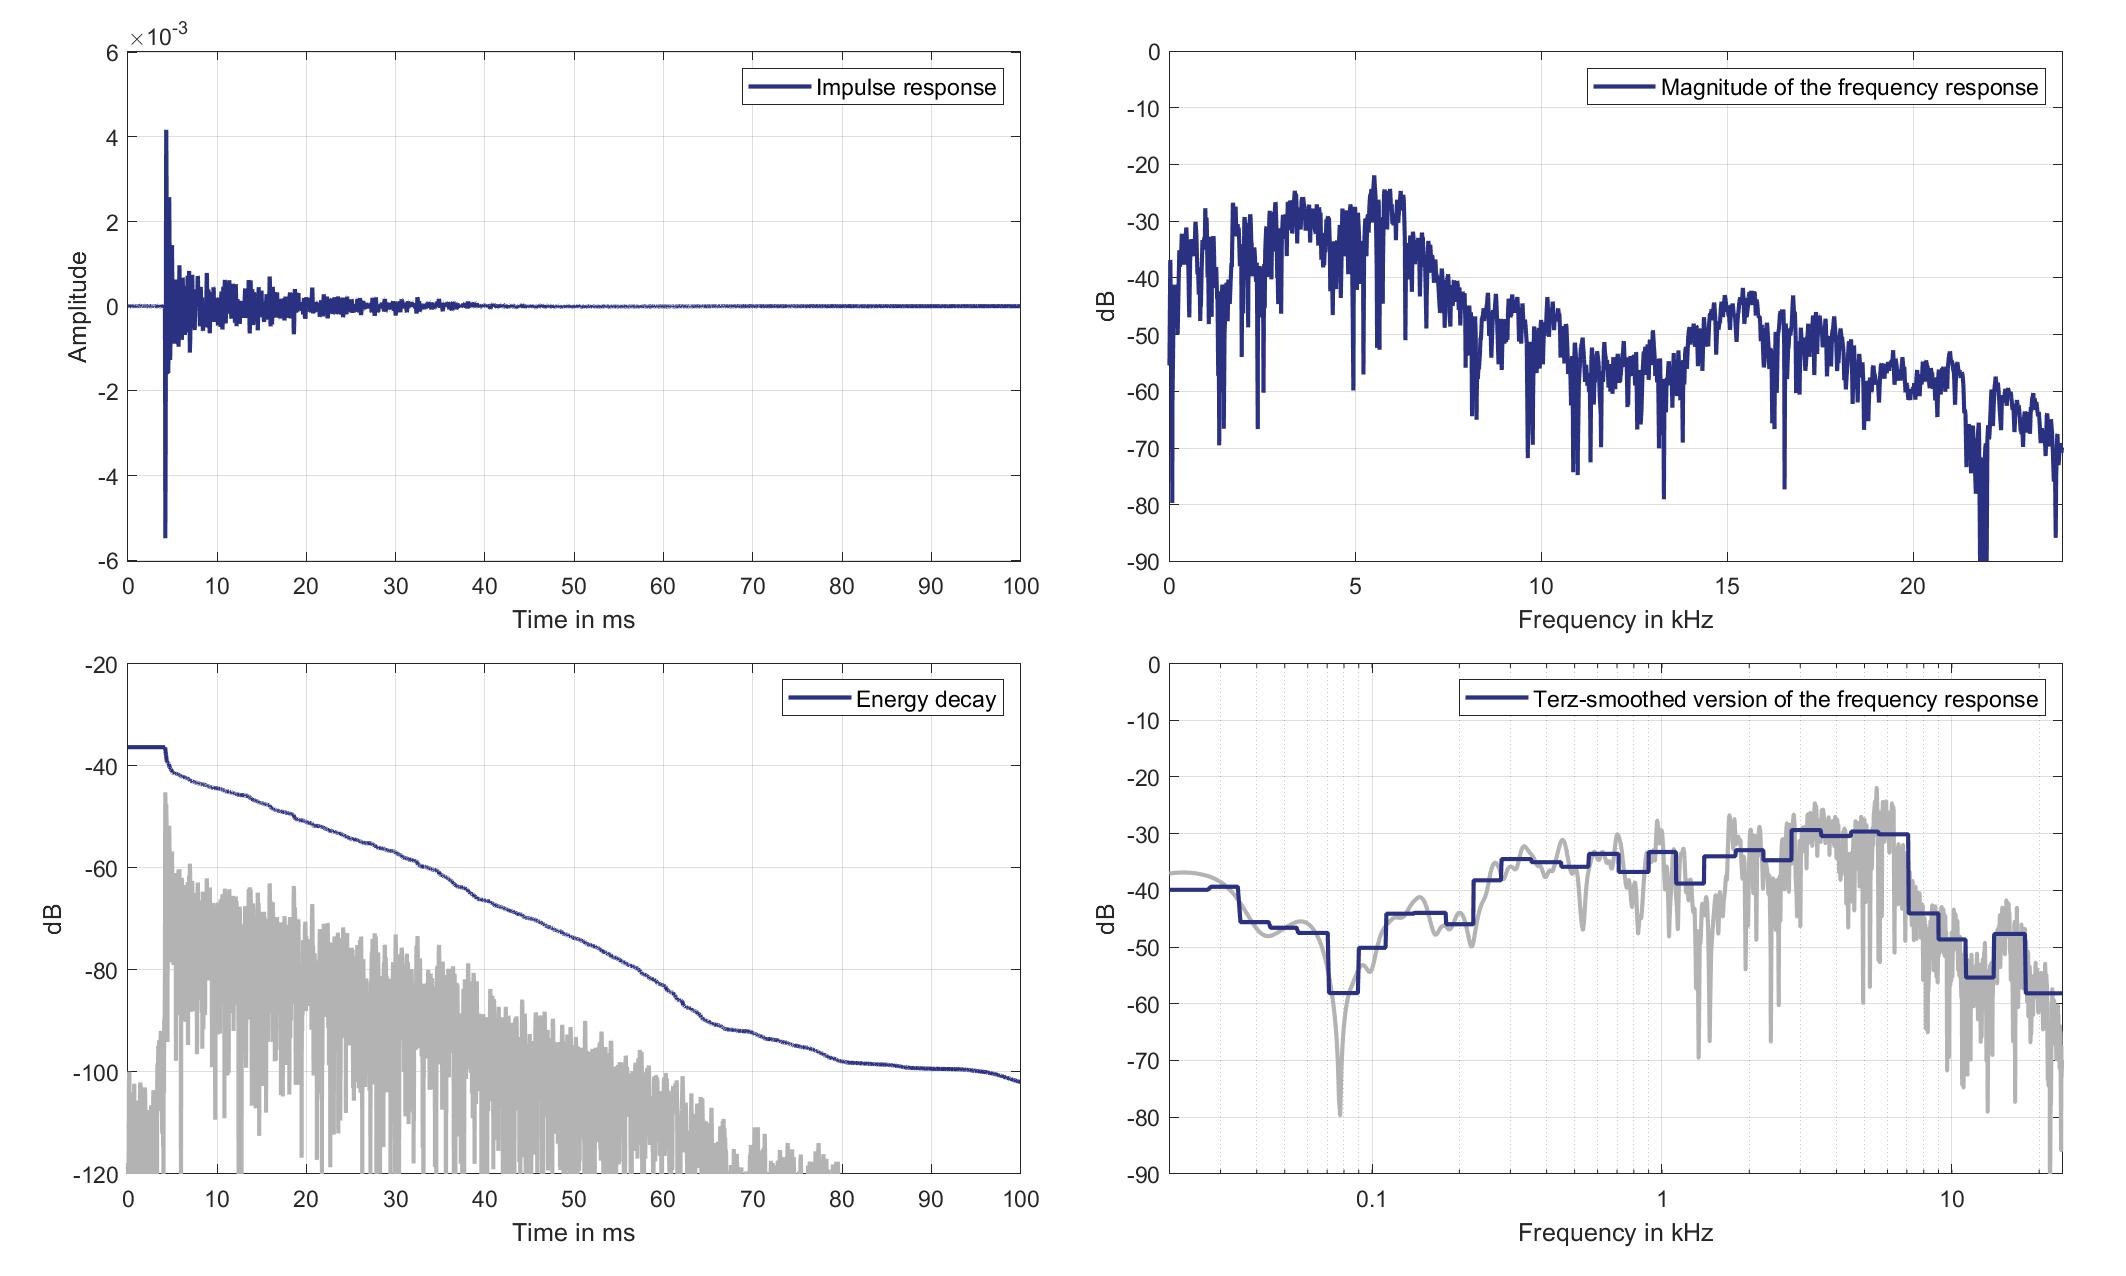
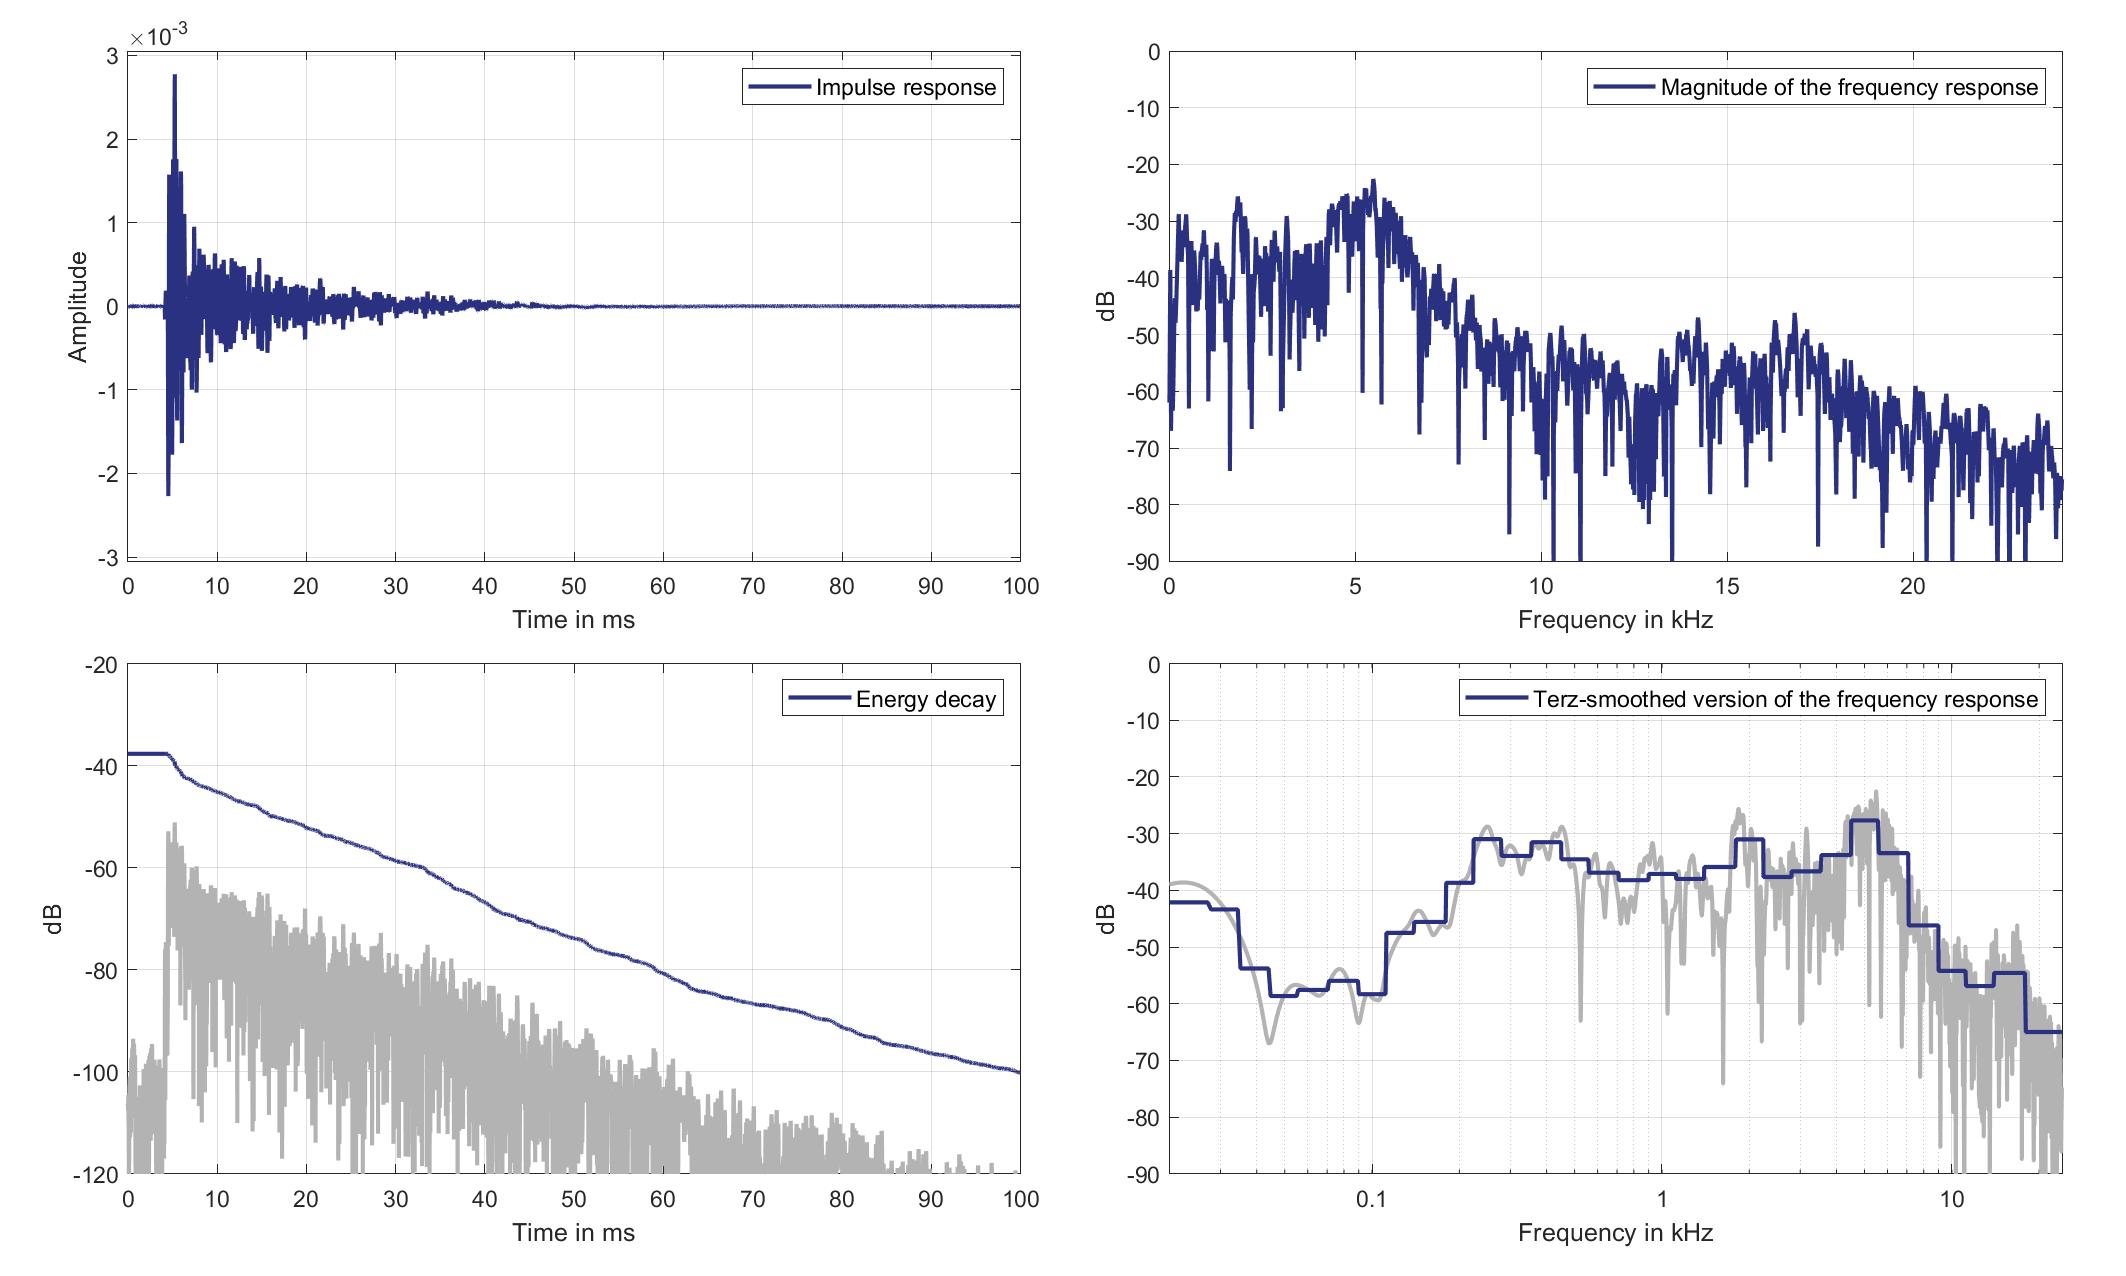
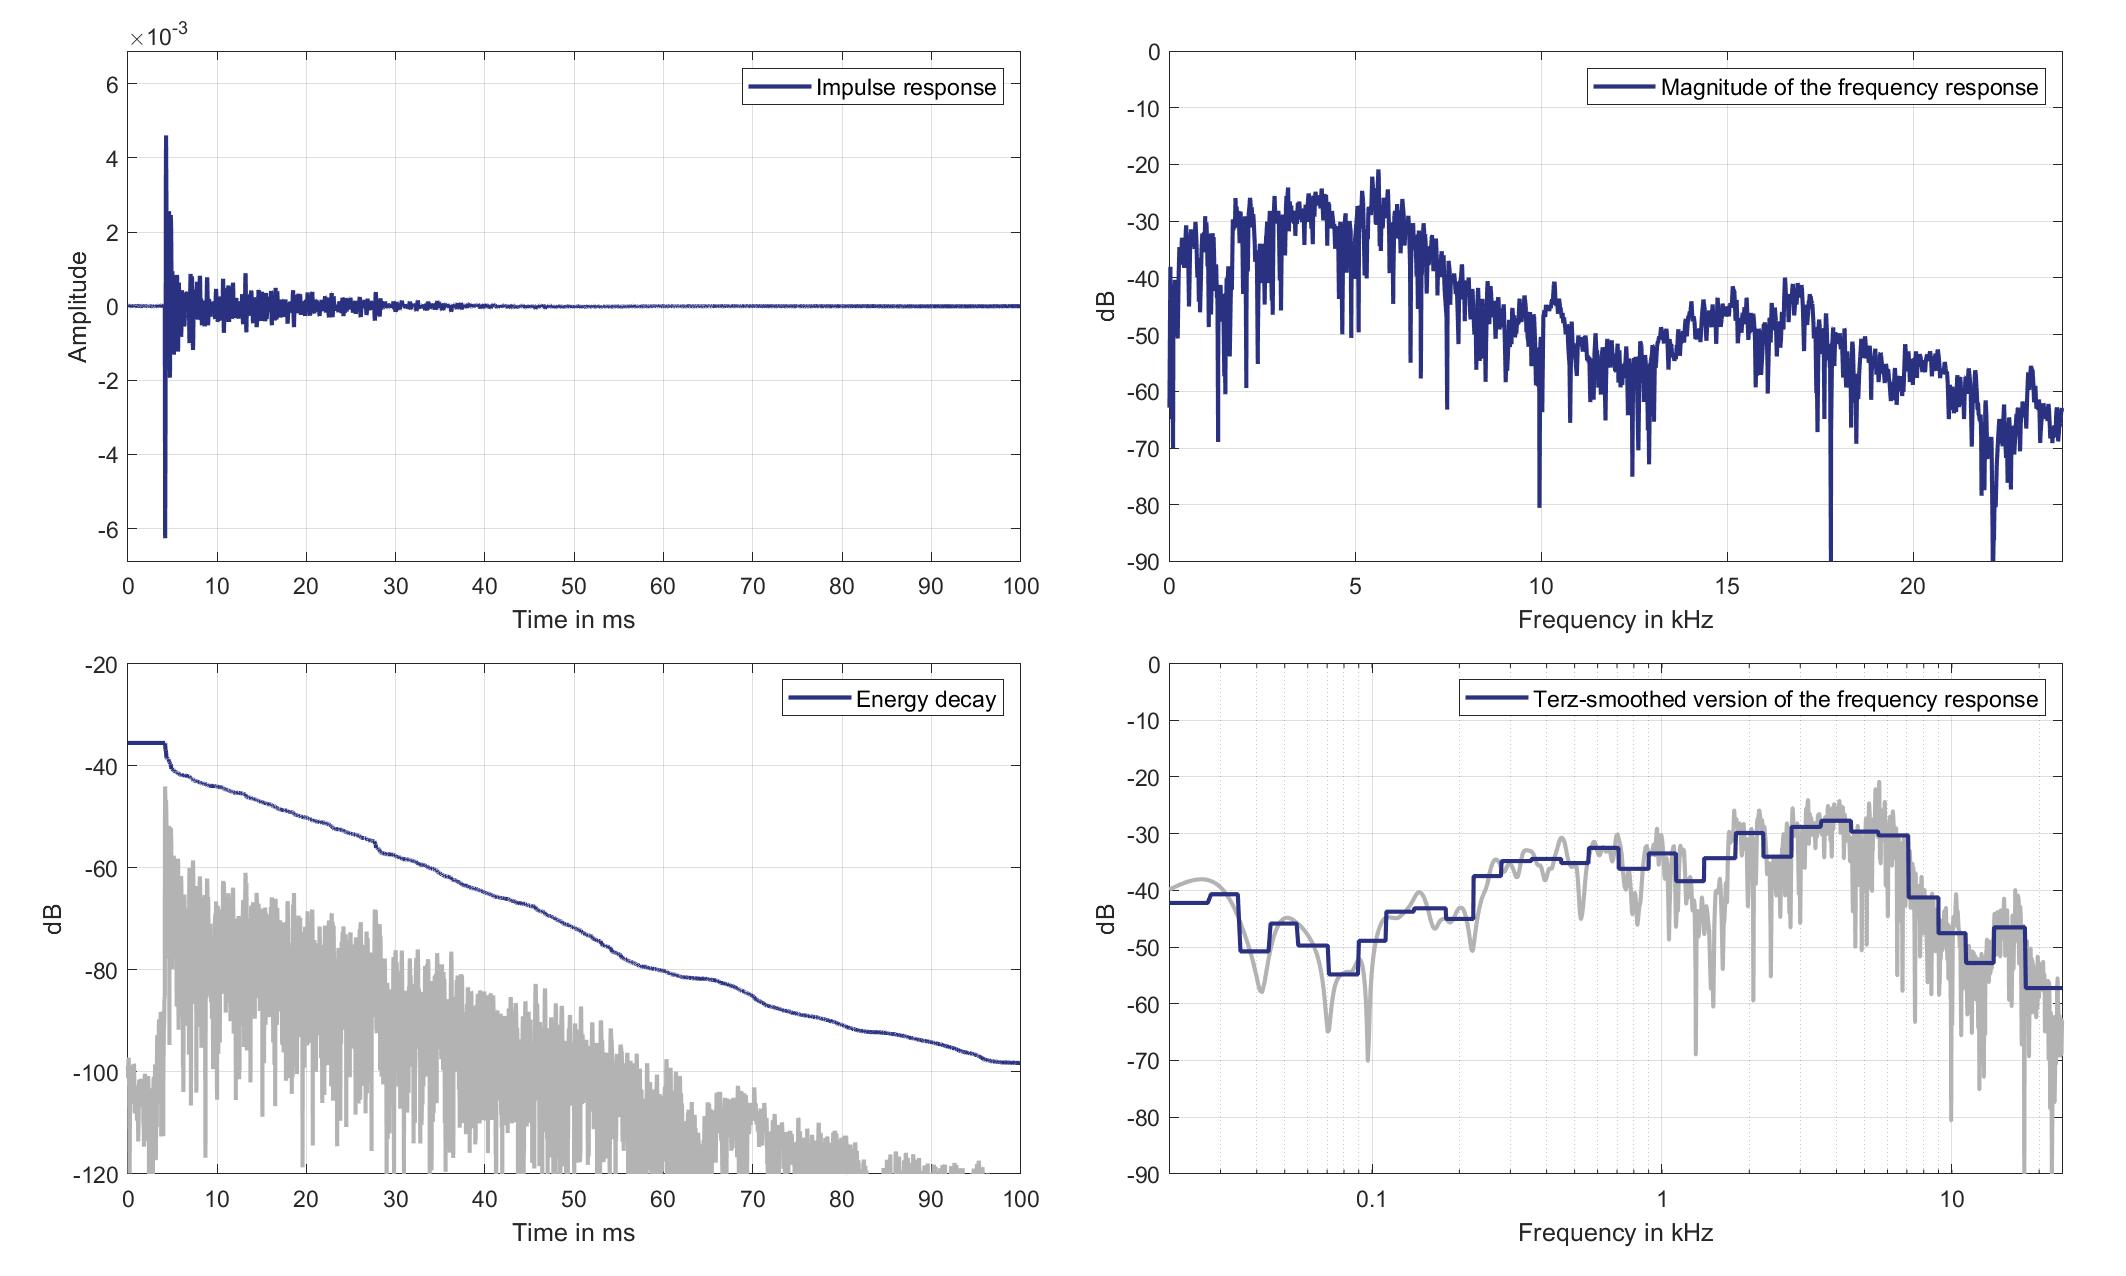
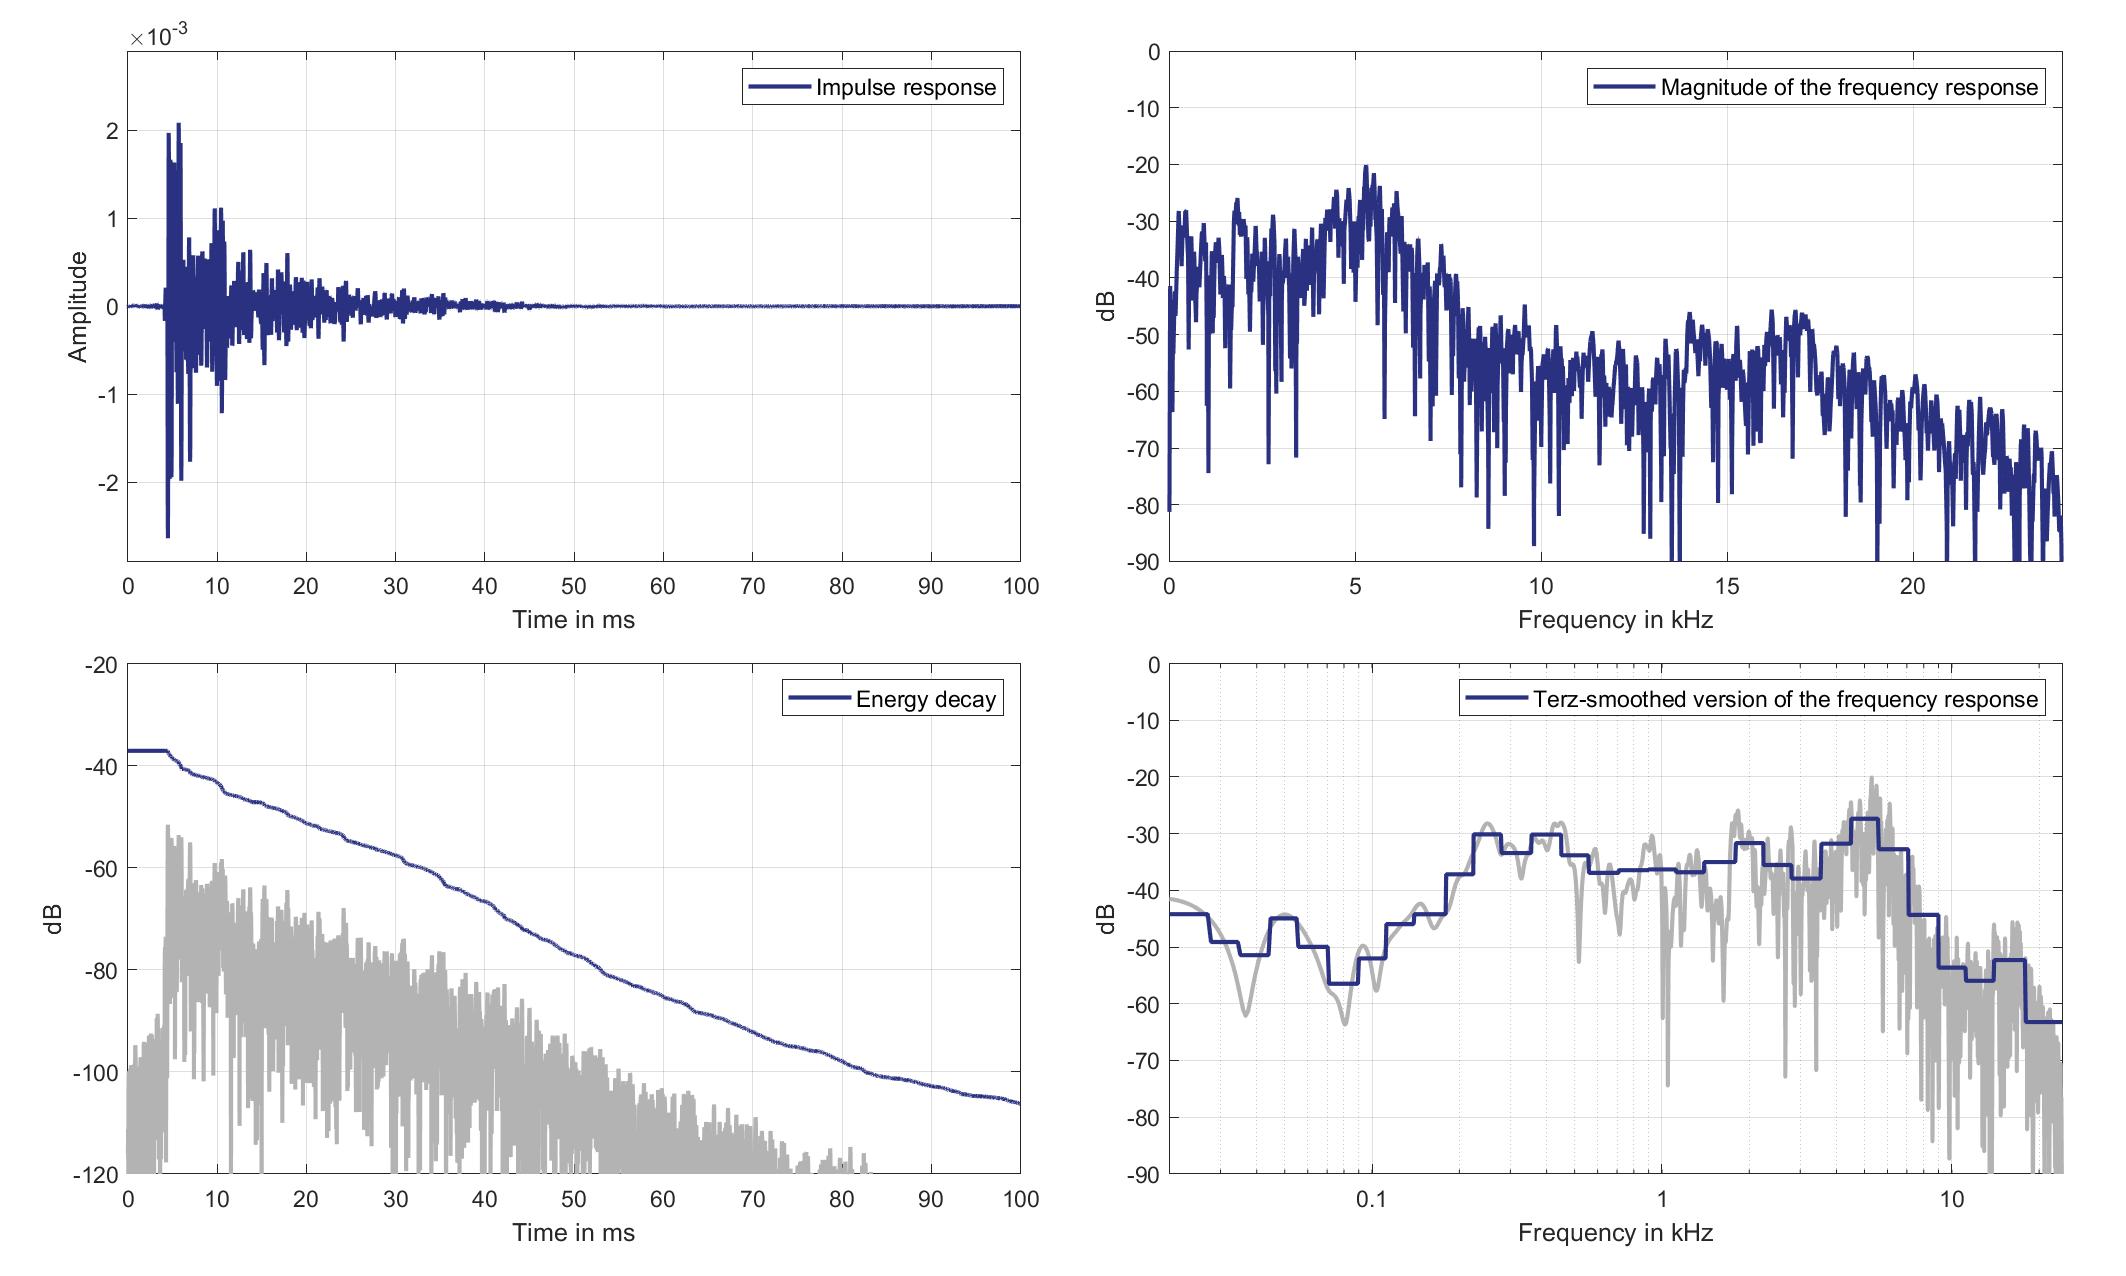
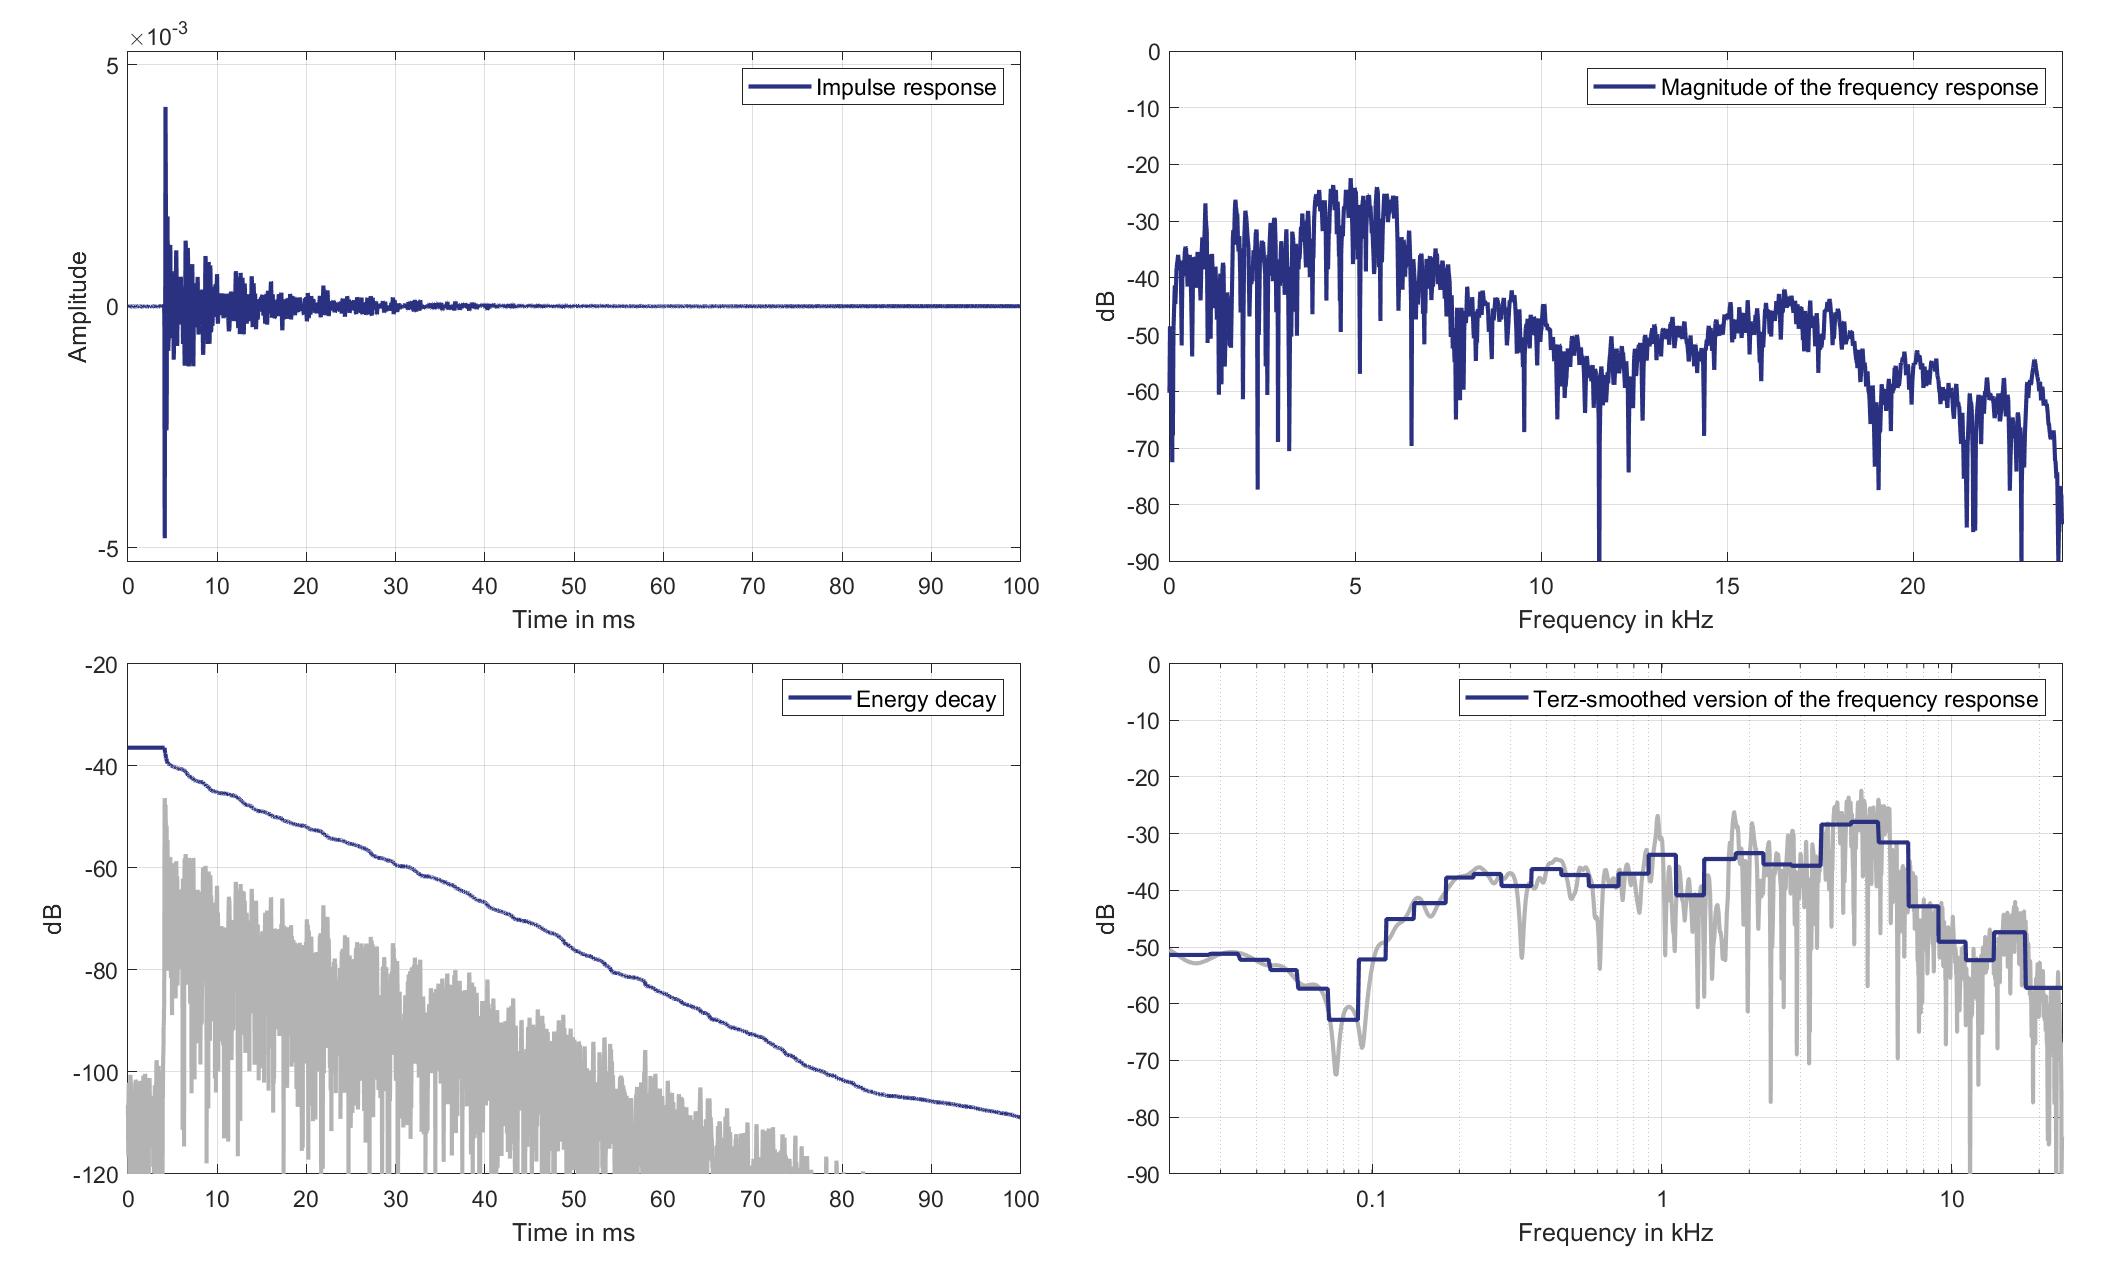
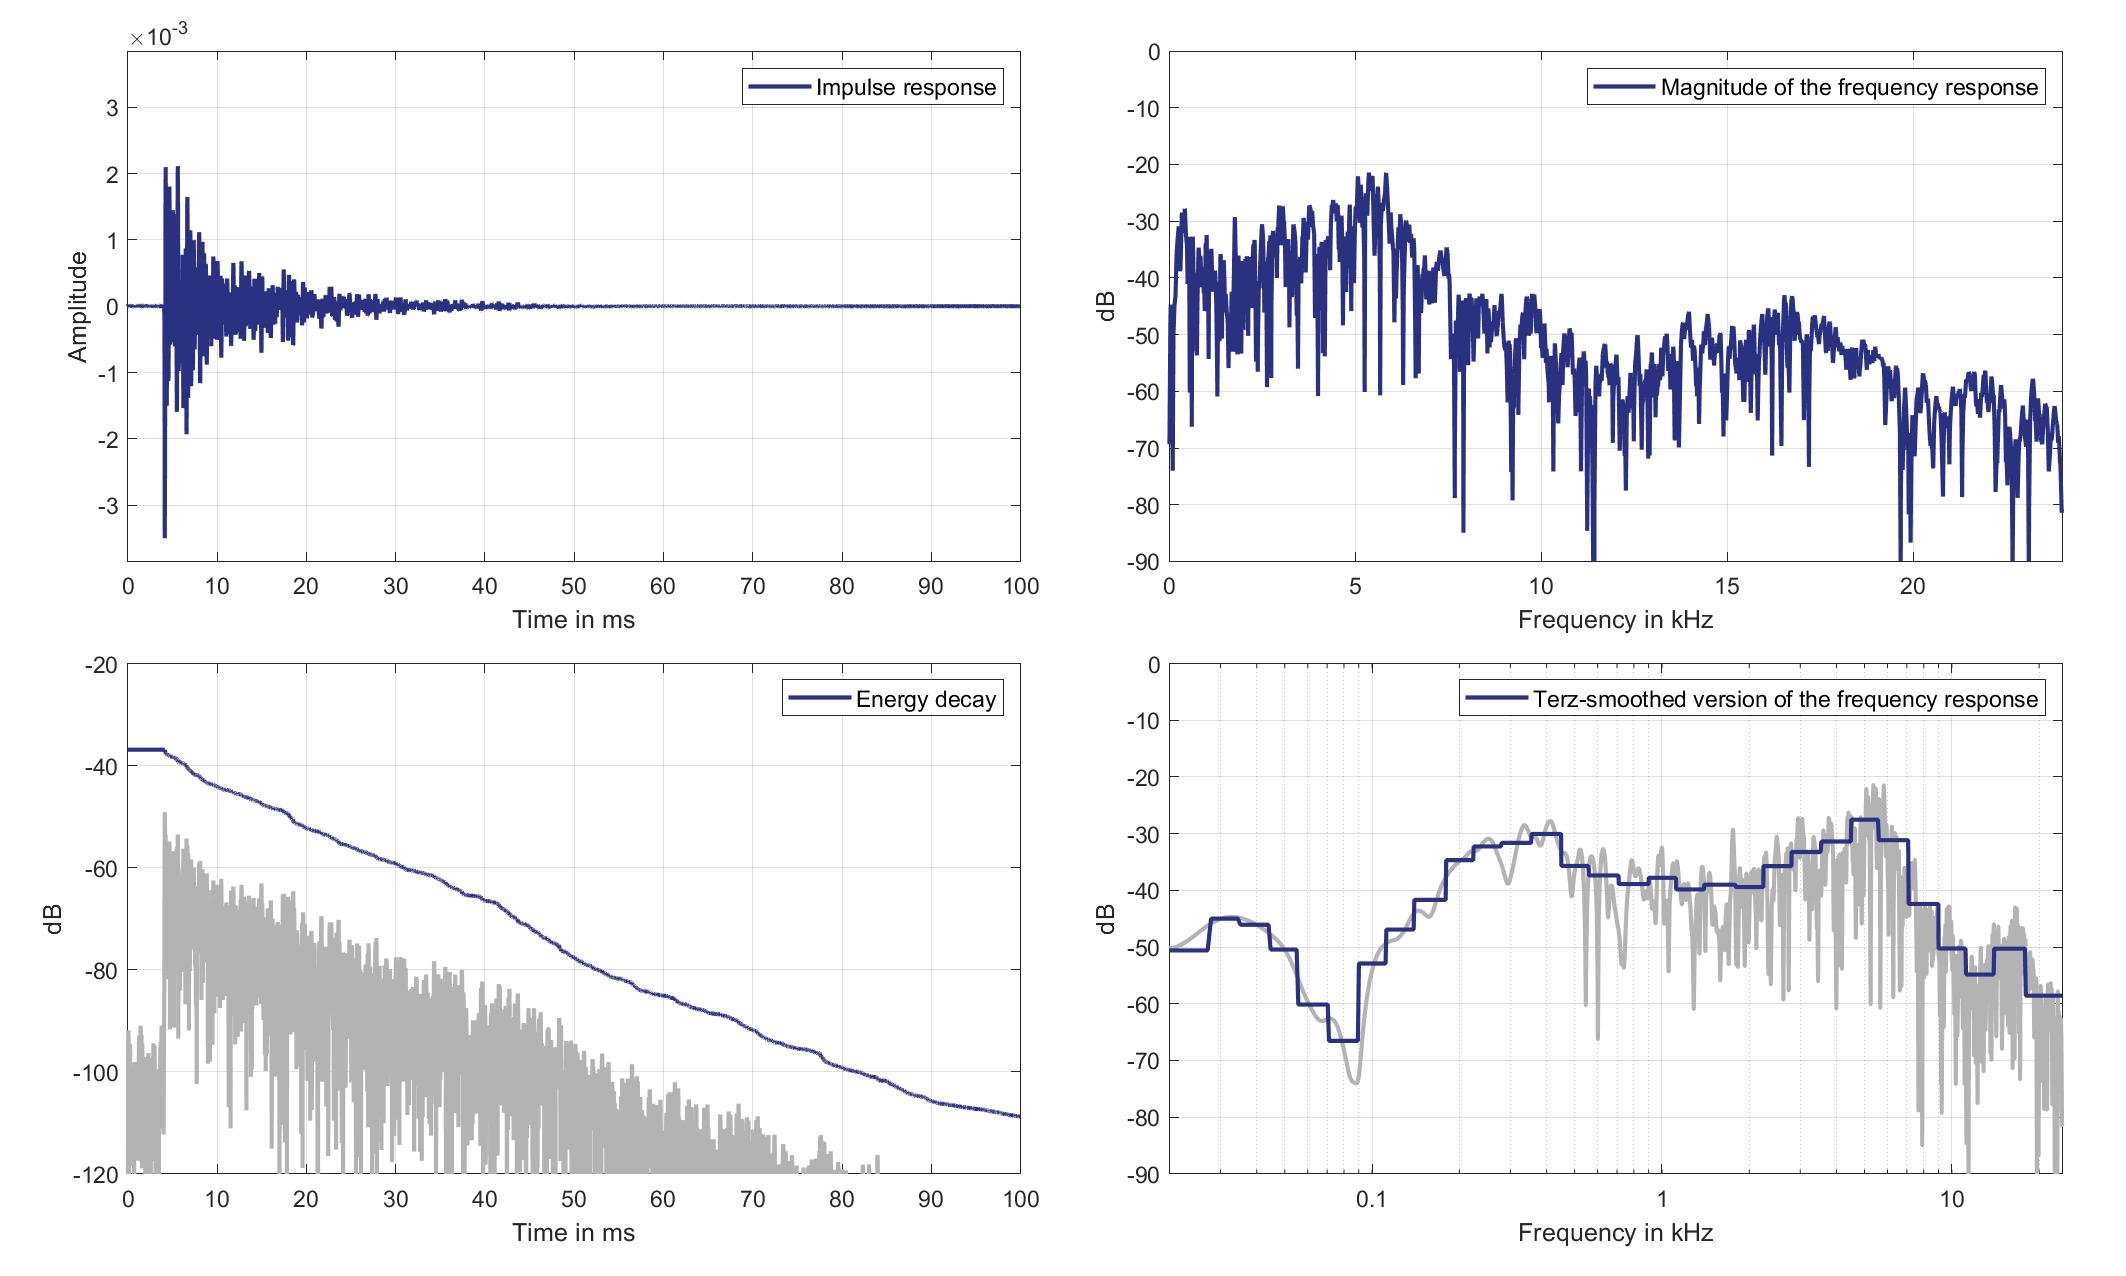
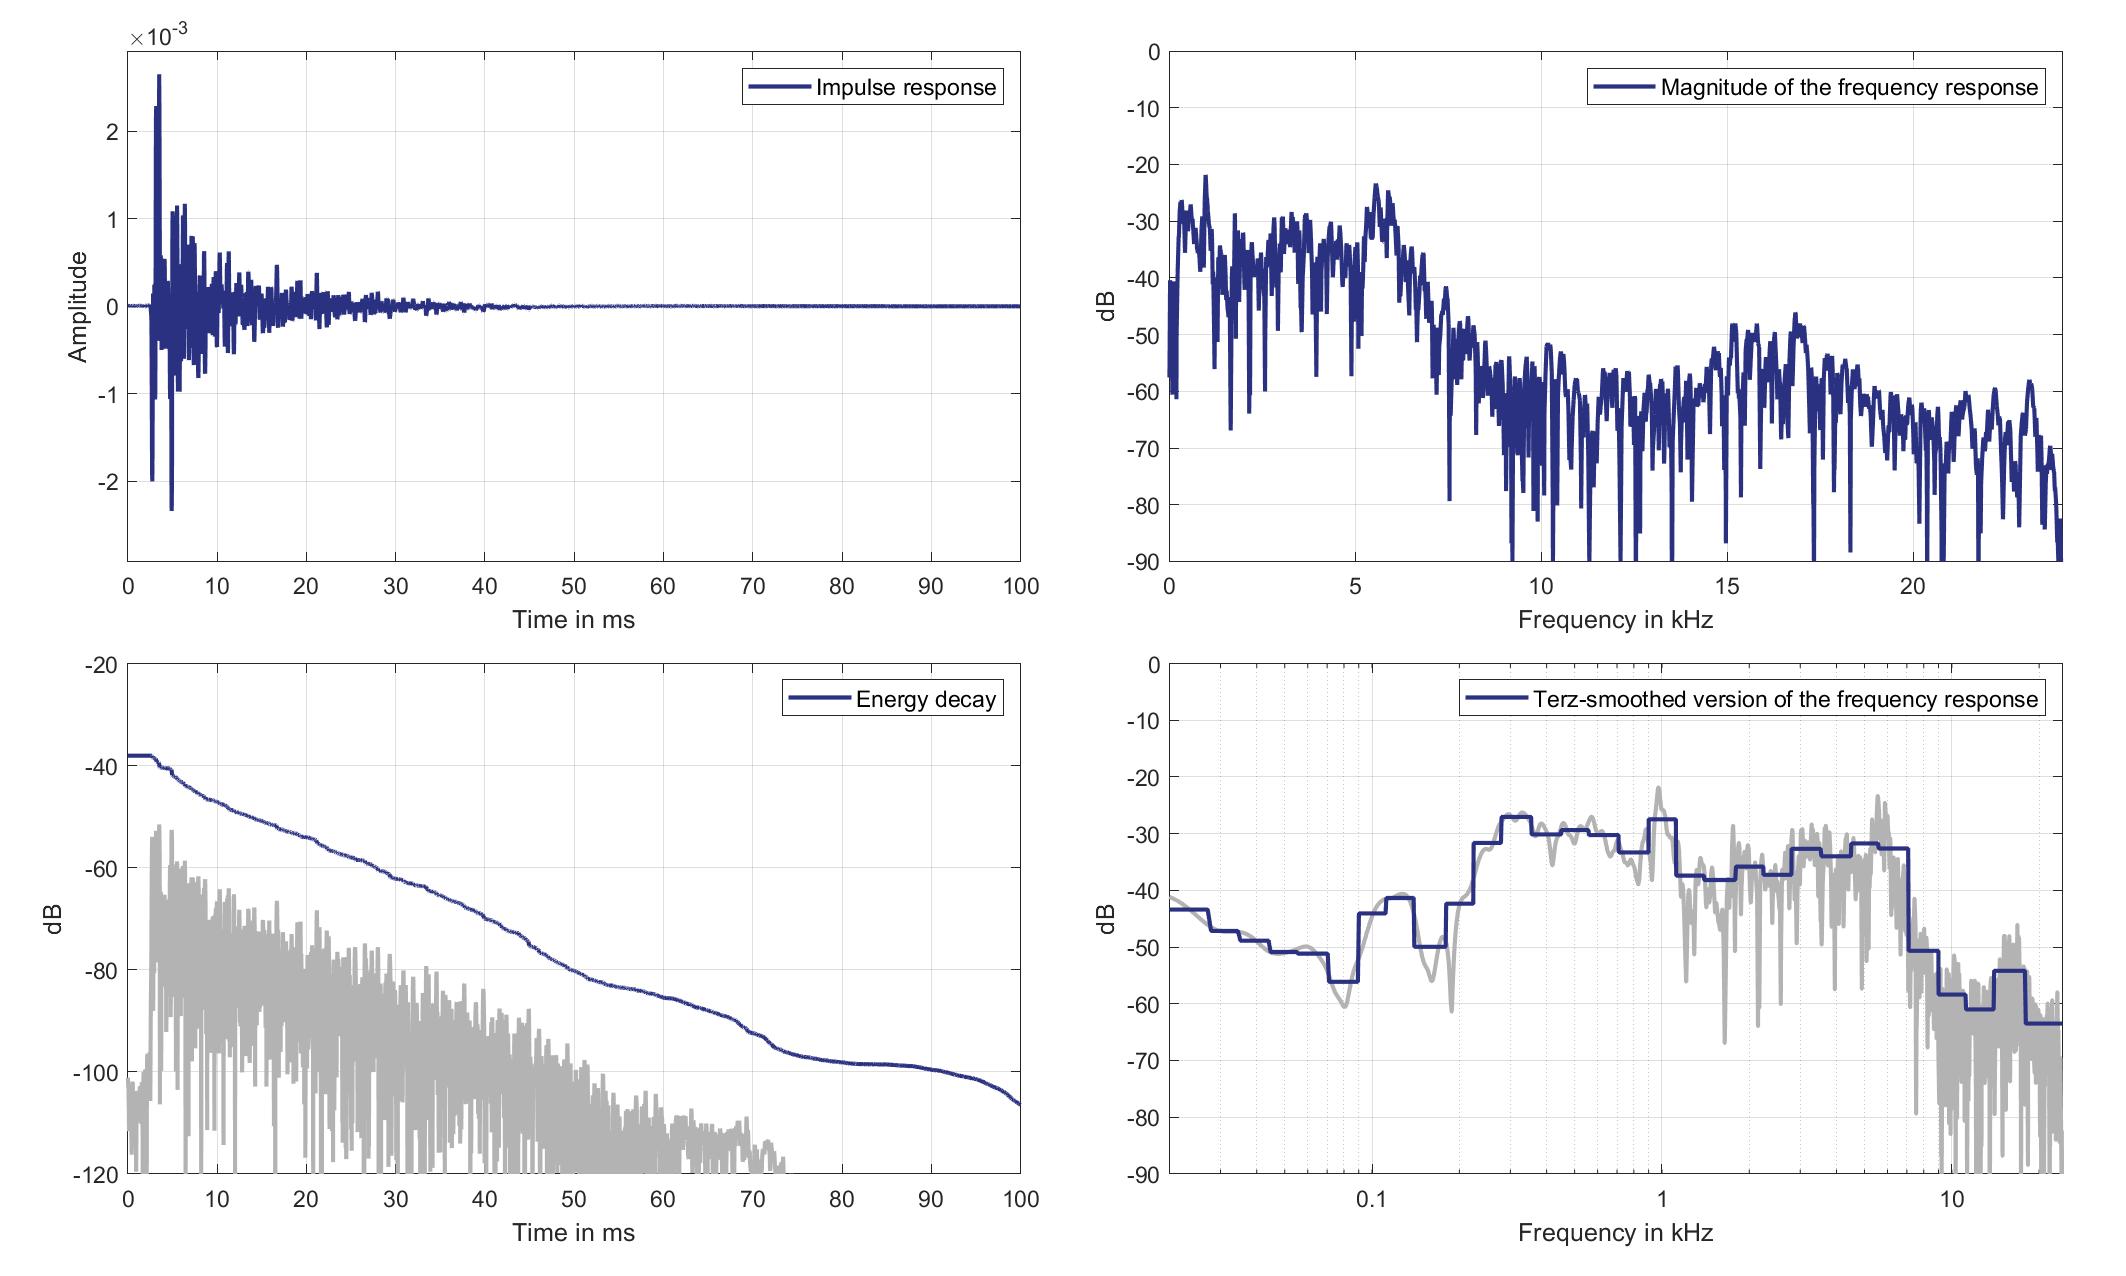
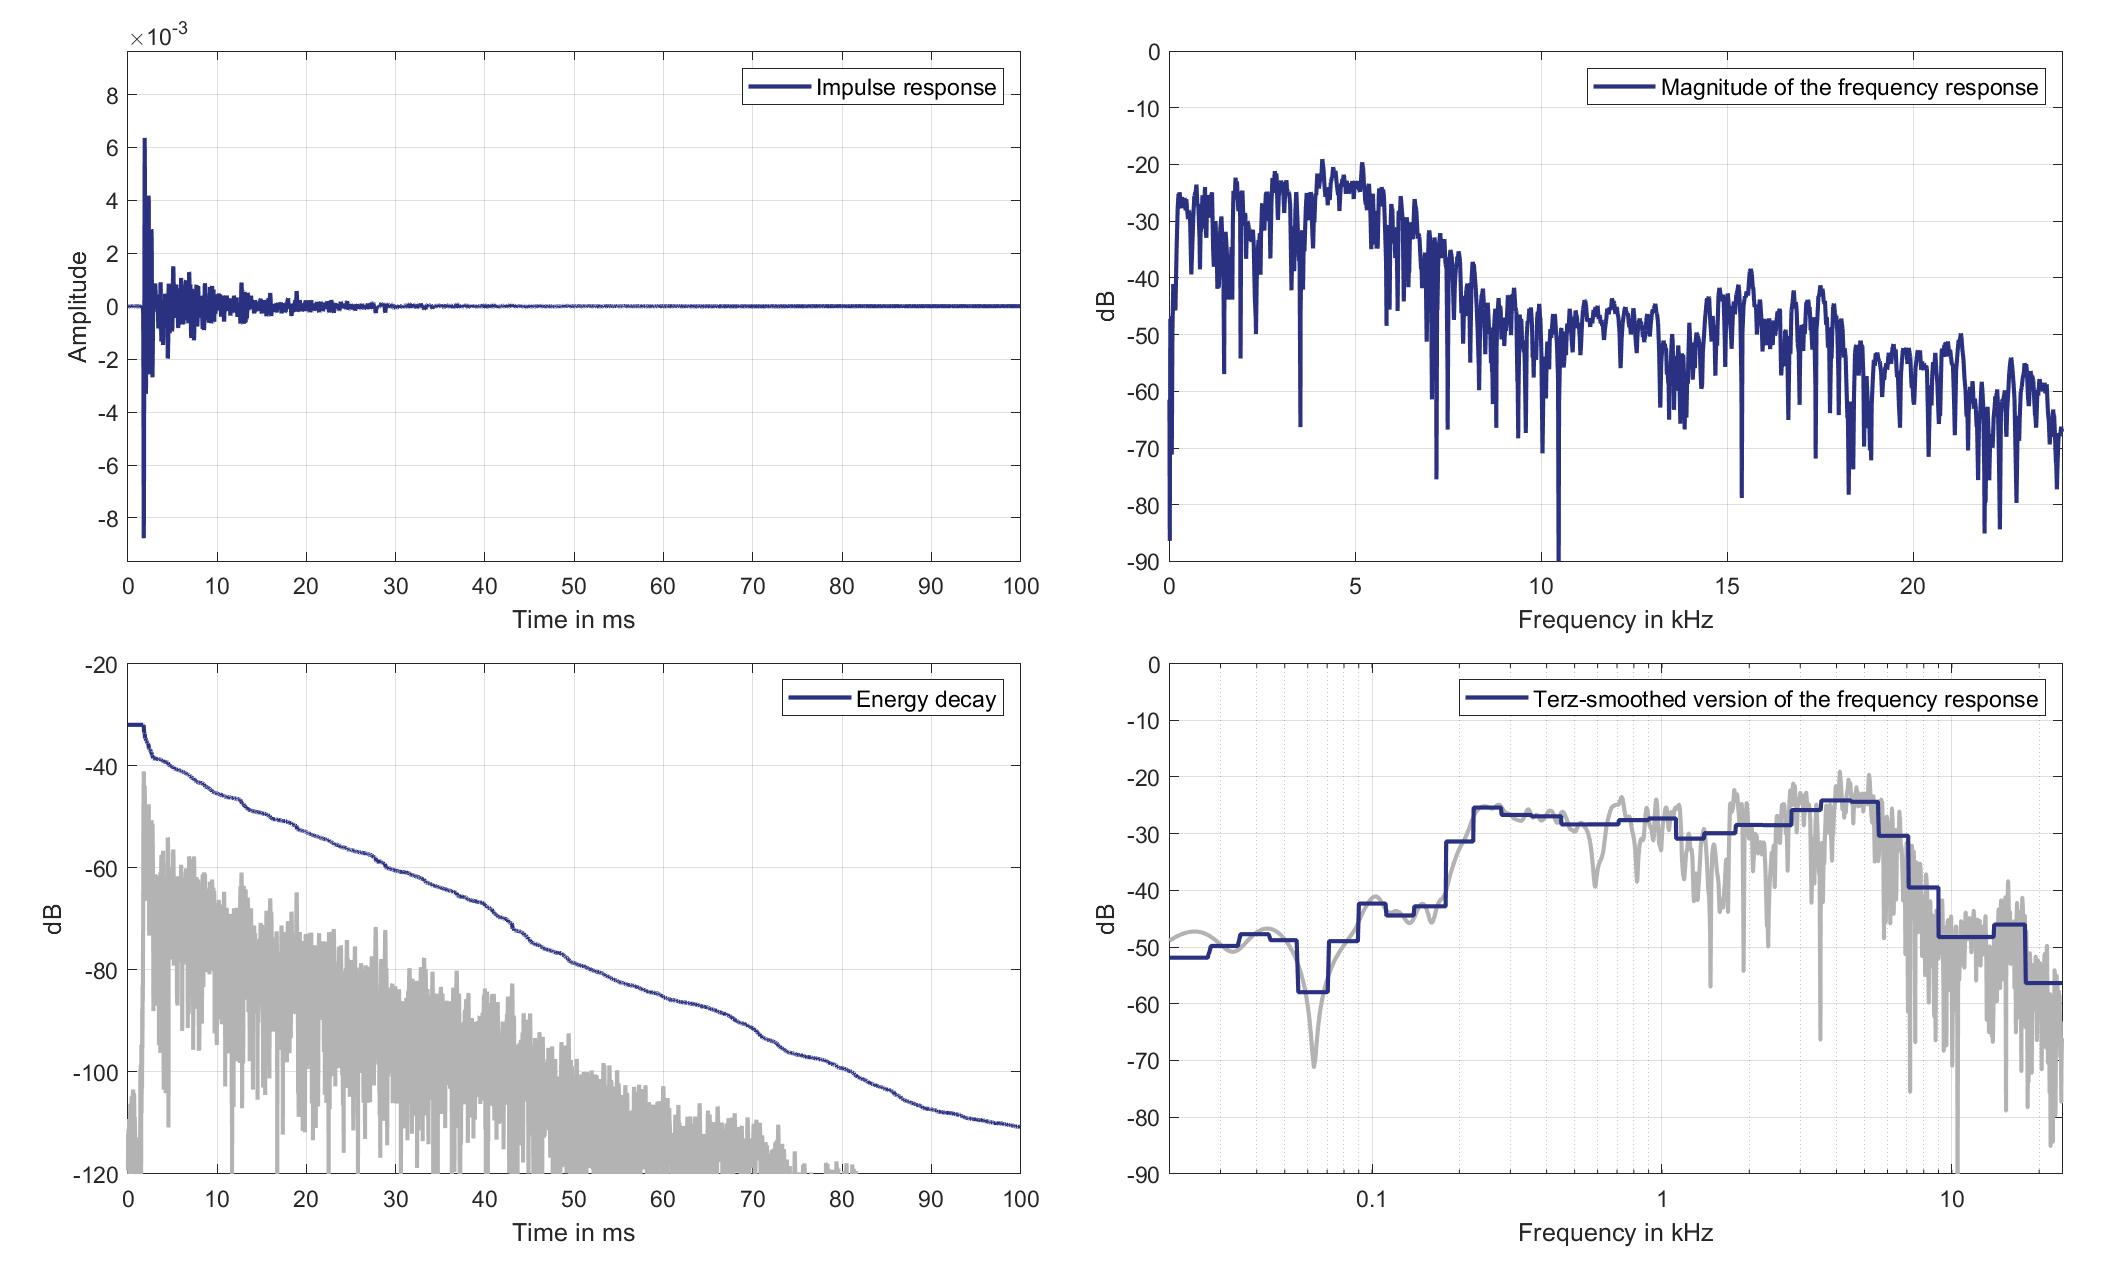
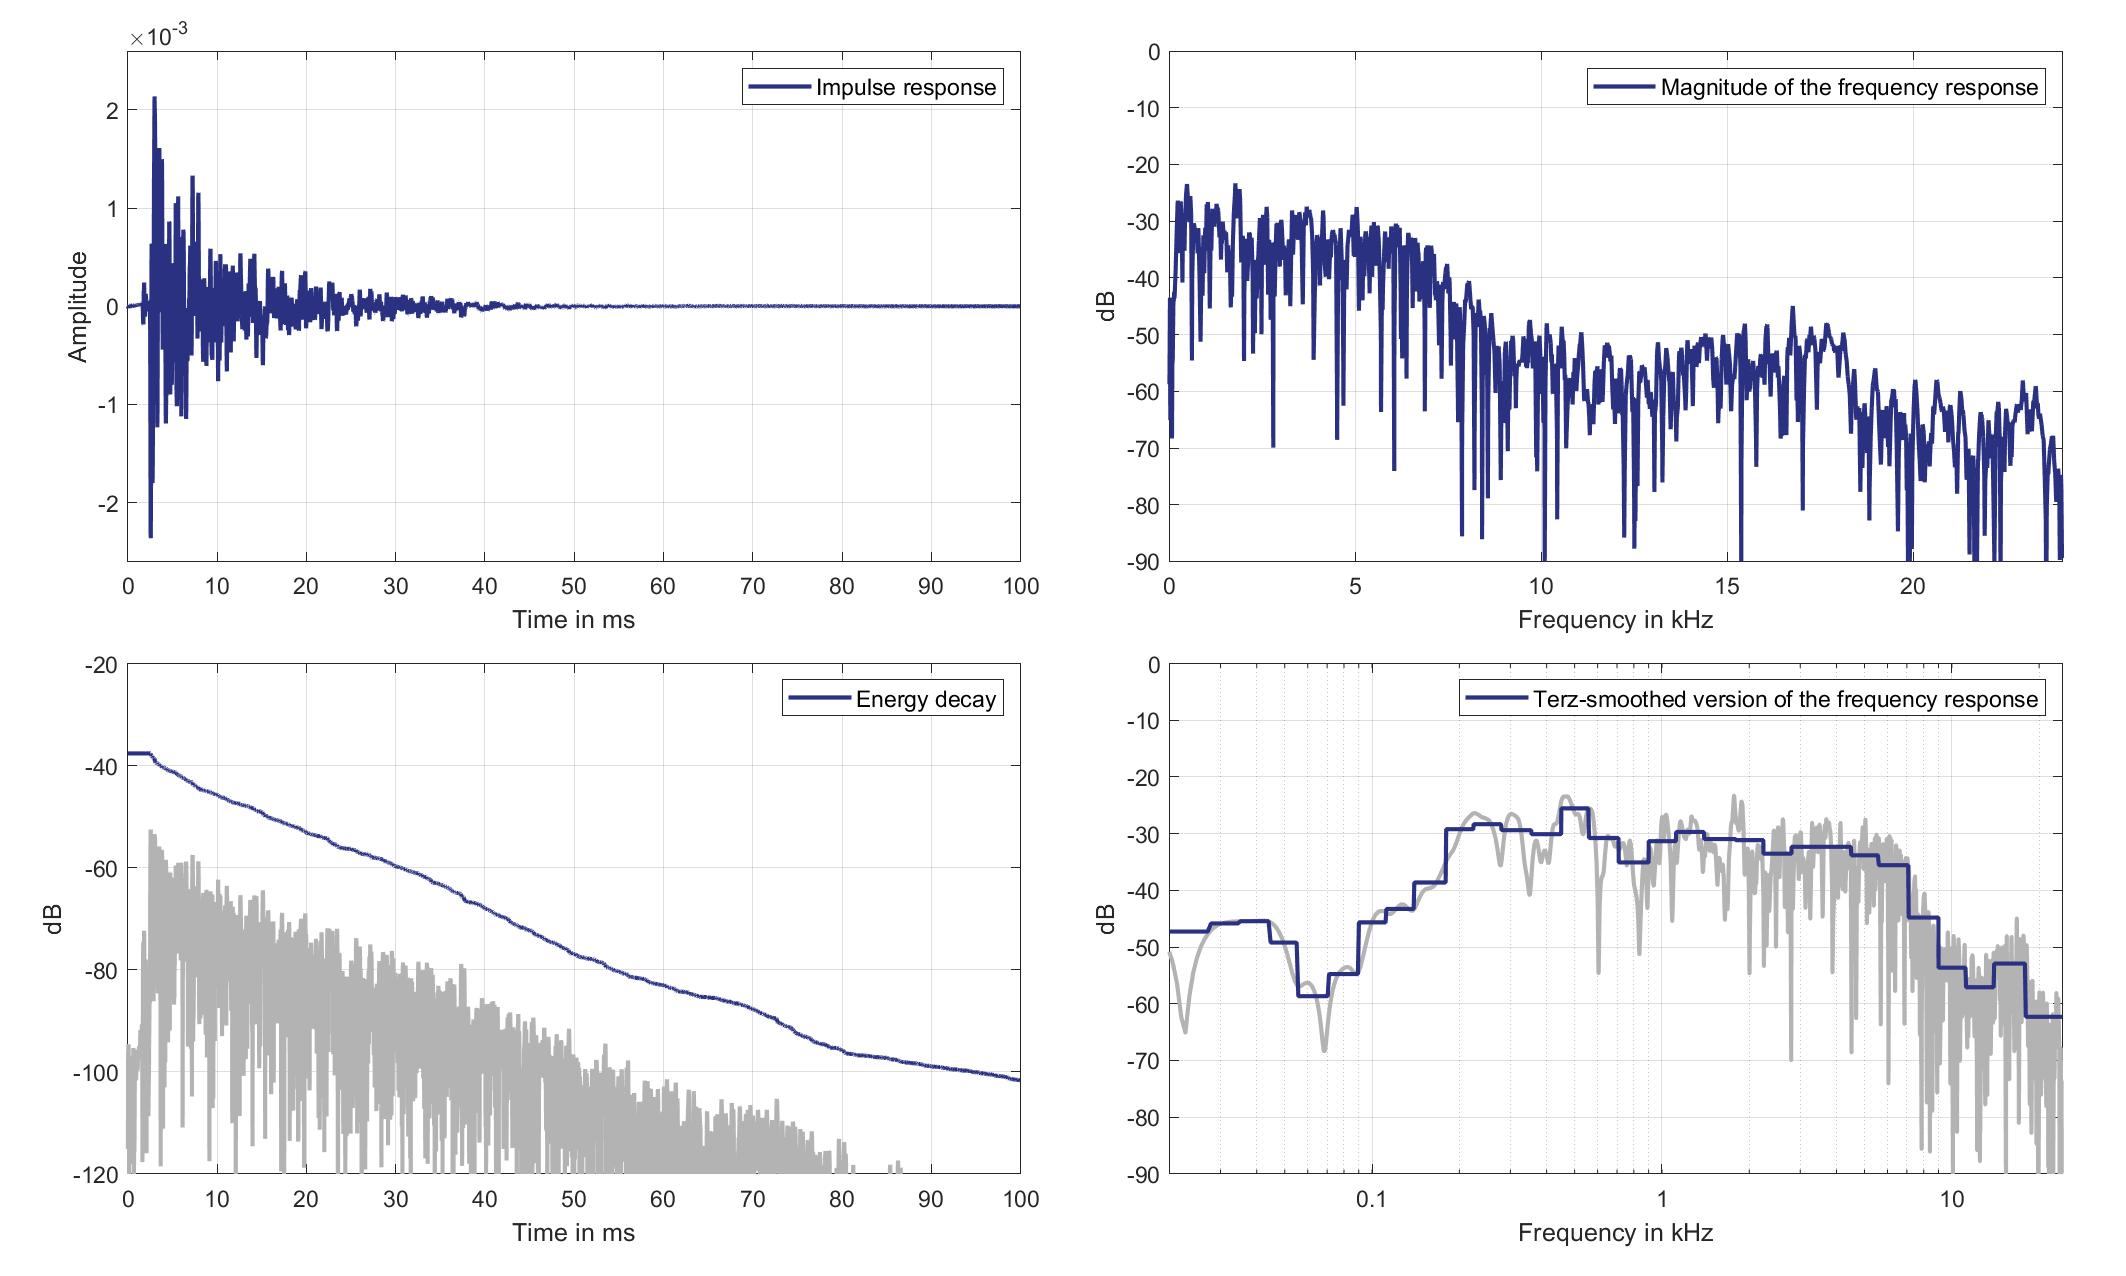
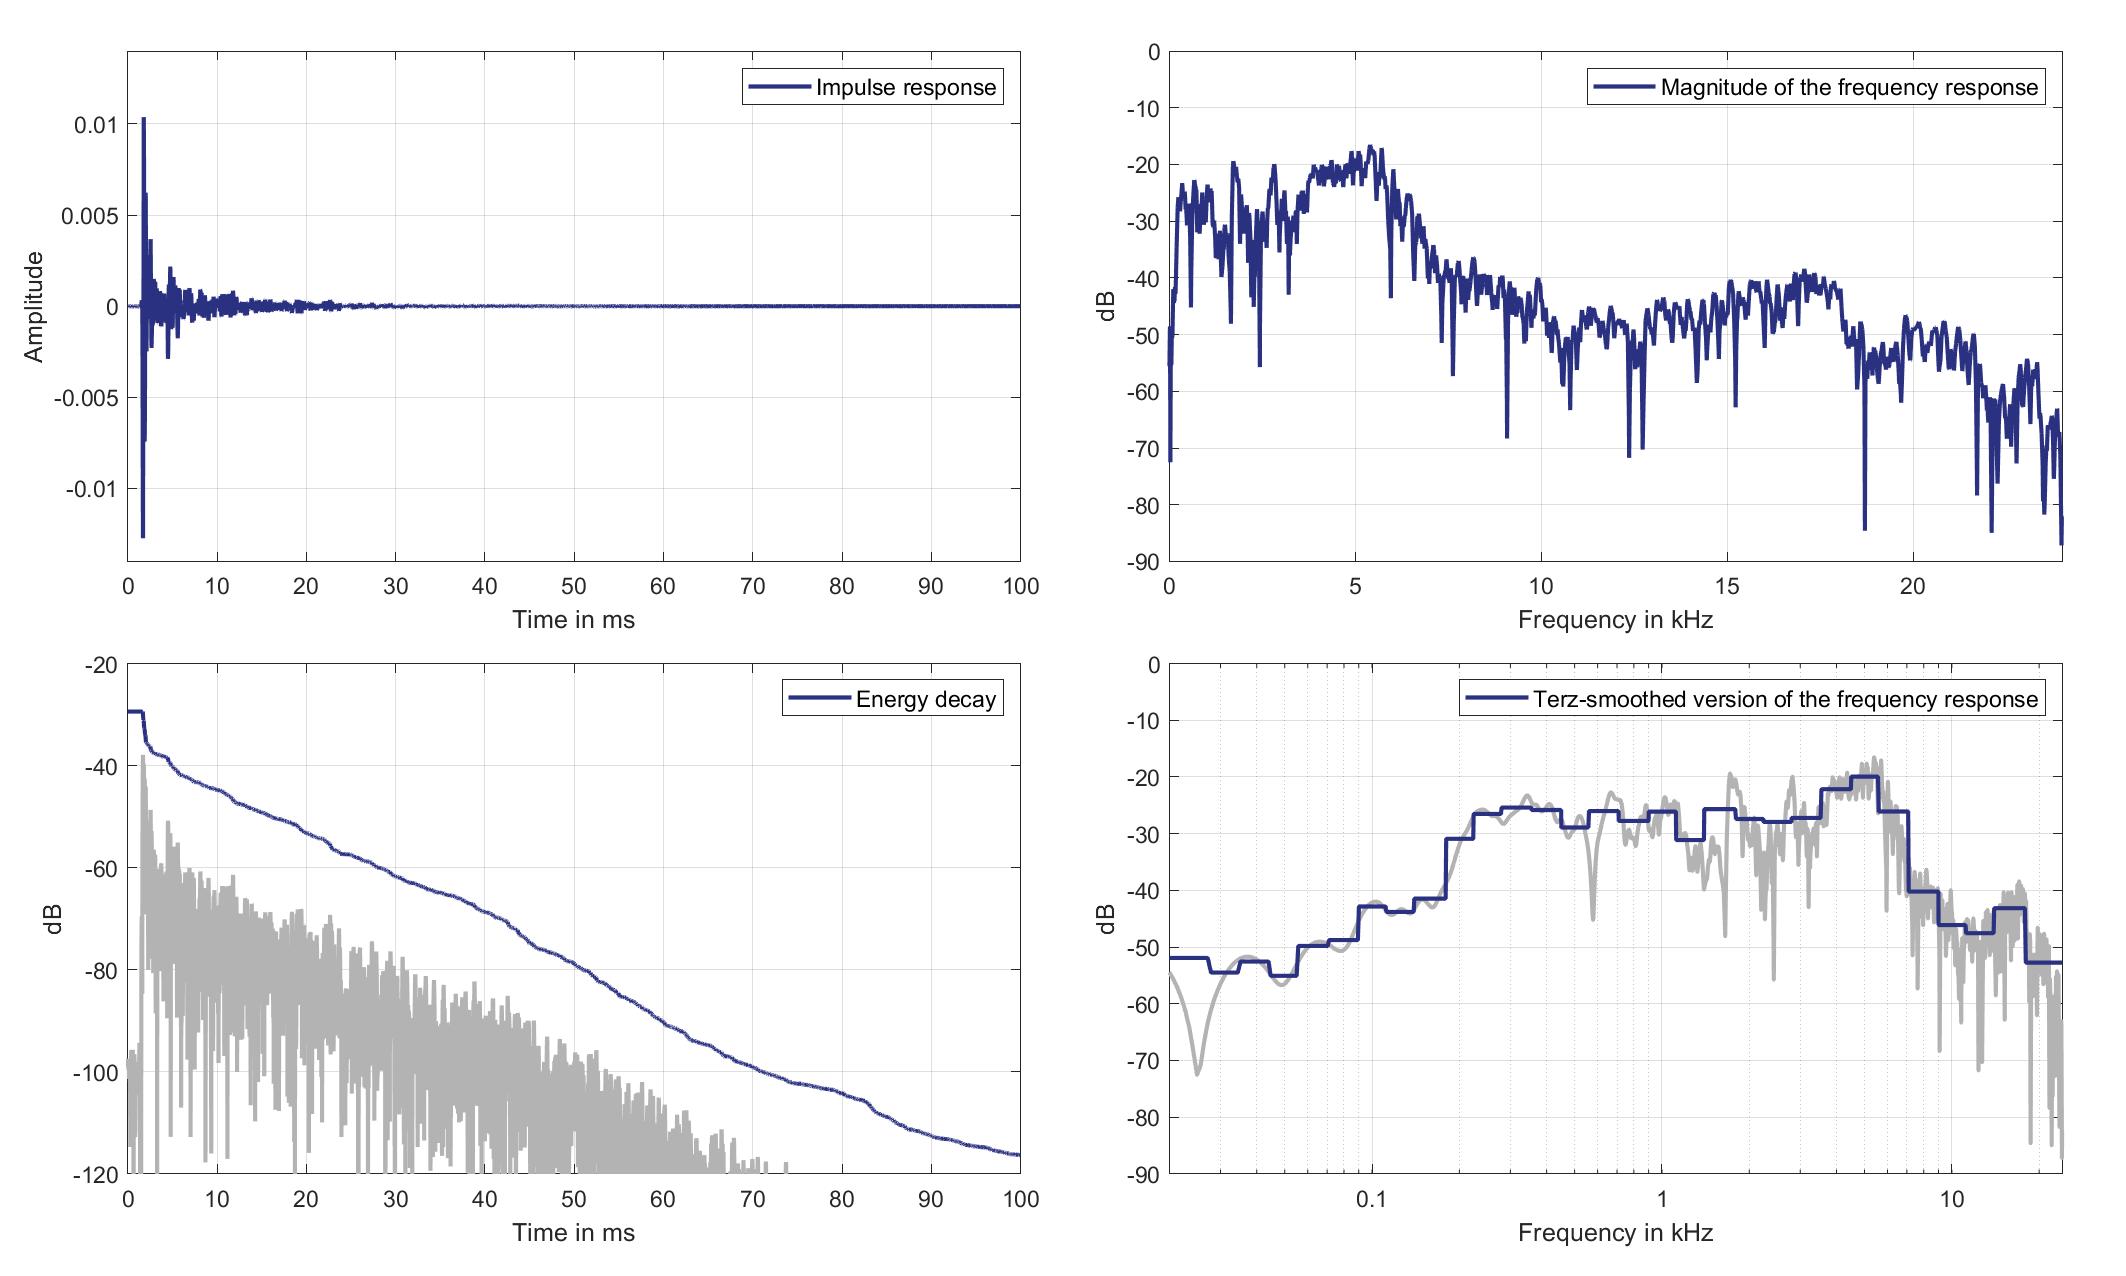
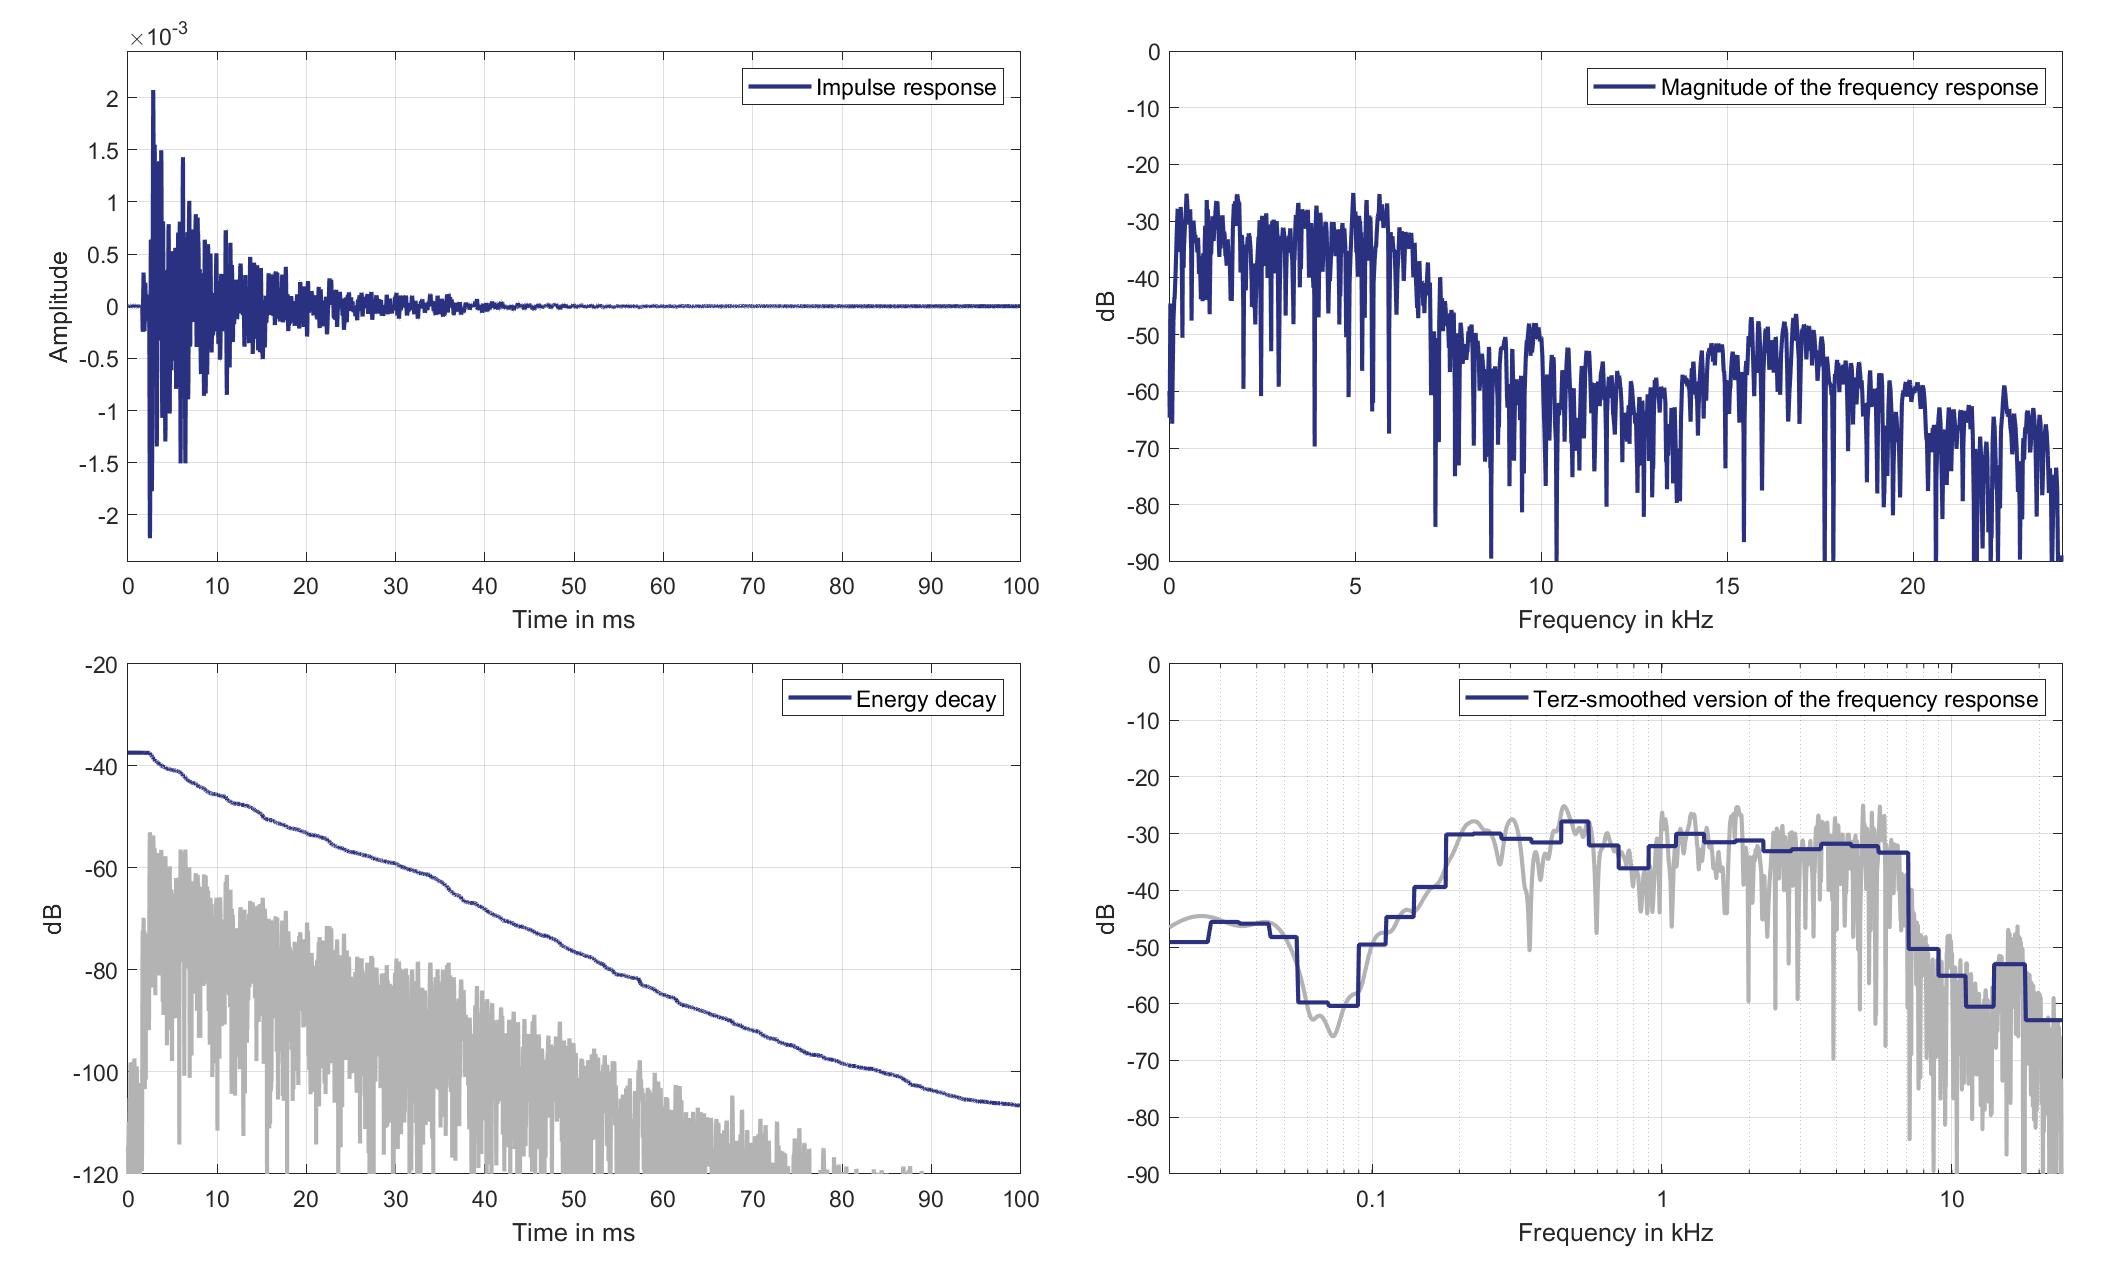
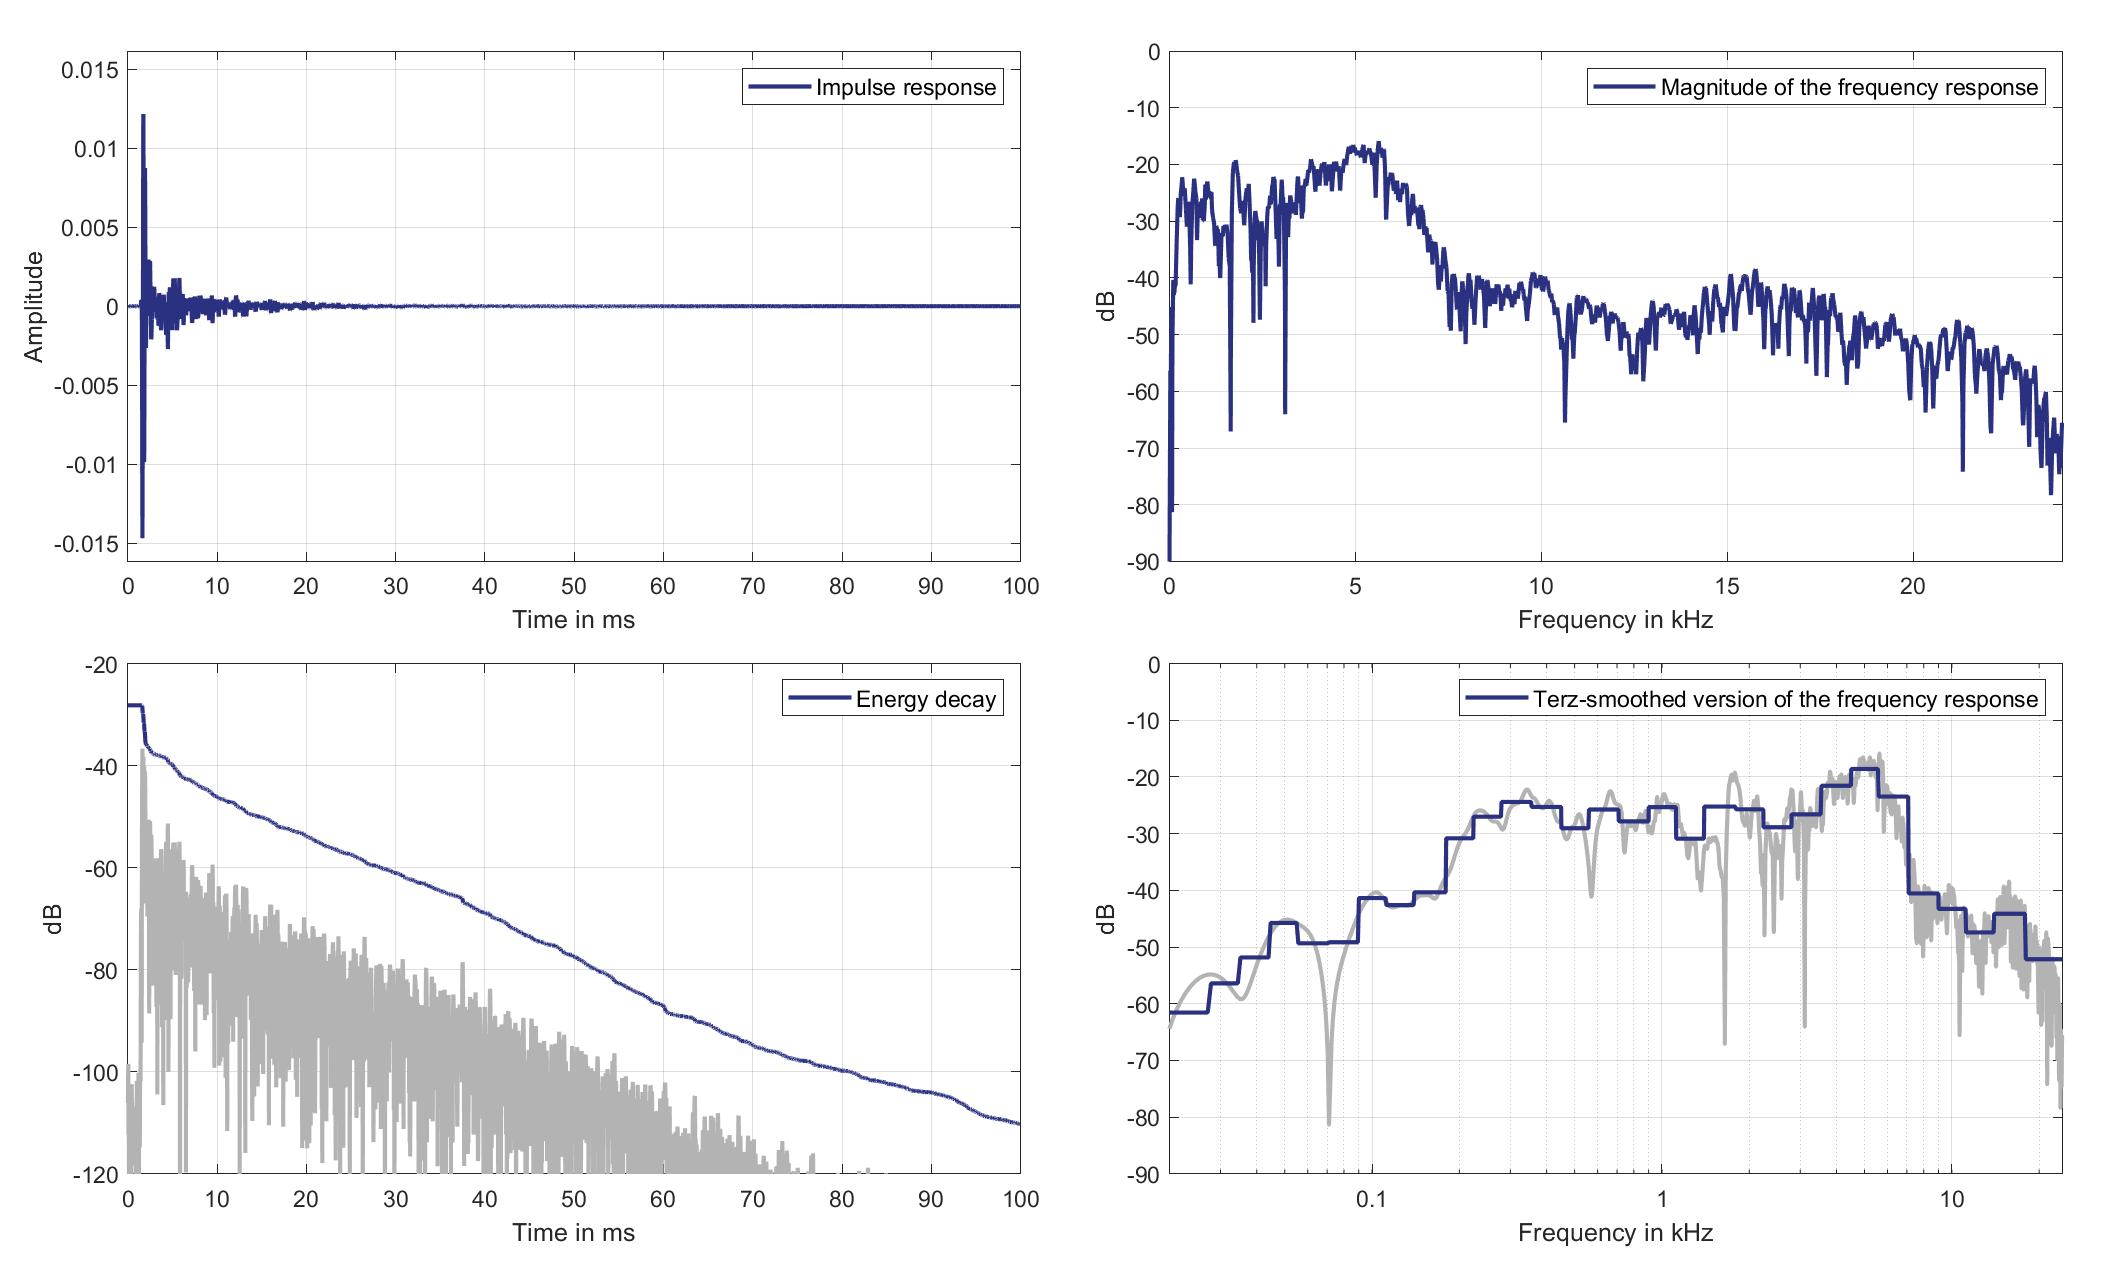
In below visualization of the impulse responses, the impulse responses are grouped by loudspeaker and microphone categories. The analyses provided show the impulse responses in the time domain, both an un-smoothed and a terz-smoothed version of the magnitude frequency responses, and the energy-decay curves. You can download the impulse responses individually on this page or all of them together as a zip file in the download section.
V Class (Daimler)
Headrest Loudspeakers to Standard Car Microphones
Lsps. 0/1
Mic. 0
Left loudspeaker
Left headrest Loudspeaker of Zone 1 (Lsp. 0) to Standard Car Microphone 0 (Mic. 0)
Download impulse response (in ".fir" format).
In the download section you can download all impulse response files as well as format explanation and Matlab as well as Python code examples for loading fir files.
Right loudspeaker
Right headrest Loudspeaker of Zone 1 (Lsp. 1) to Standard Car Microphone 0 (Mic. 0)

Download impulse response (in ".fir" format).
In the download section you can download all impulse response files as well as format explanation and Matlab as well as Python code examples for loading fir files.
Mic. 1
Left loudspeaker
Left headrest Loudspeaker of Zone 1 (Lsp. 0) to Standard Car Microphone 1 (Mic. 1)
Download impulse response (in ".fir" format).
In the download section you can download all impulse response files as well as format explanation and Matlab as well as Python code examples for loading fir files.
Right loudspeaker
Right headrest Loudspeaker of Zone 1 (Lsp. 1) to Standard Car Microphone 1 (Mic. 1)
Download impulse response (in ".fir" format).
In the download section you can download all impulse response files as well as format explanation and Matlab as well as Python code examples for loading fir files.
Mic. 2
Left loudspeaker
Left headrest Loudspeaker of Zone 1 (Lsp. 0) to Standard Car Microphone 2 (Mic. 2)
Download impulse response (in ".fir" format).
In the download section you can download all impulse response files as well as format explanation and Matlab as well as Python code examples for loading fir files.
Right loudspeaker
Right headrest Loudspeaker of Zone 1 (Lsp. 1) to Standard Car Microphone 2 (Mic. 2)

Download impulse response (in ".fir" format).
In the download section you can download all impulse response files as well as format explanation and Matlab as well as Python code examples for loading fir files.
Mic. 3
Left loudspeaker
Left headrest Loudspeaker of Zone 1 (Lsp. 0) to Standard Car Microphone 3 (Mic. 3)
Download impulse response (in ".fir" format).
In the download section you can download all impulse response files as well as format explanation and Matlab as well as Python code examples for loading fir files.
Right loudspeaker
Right headrest Loudspeaker of Zone 1 (Lsp. 1) to Standard Car Microphone 3 (Mic. 3)
Download impulse response (in ".fir" format).
In the download section you can download all impulse response files as well as format explanation and Matlab as well as Python code examples for loading fir files.
Mic. 4
Left loudspeaker
Left headrest Loudspeaker of Zone 1 (Lsp. 0) to Standard Car Microphone 4 (Mic. 4)
Download impulse response (in ".fir" format).
In the download section you can download all impulse response files as well as format explanation and Matlab as well as Python code examples for loading fir files.
Right loudspeaker
Right headrest Loudspeaker of Zone 1 (Lsp. 1) to Standard Car Microphone 4 (Mic. 4)
Download impulse response (in ".fir" format).
In the download section you can download all impulse response files as well as format explanation and Matlab as well as Python code examples for loading fir files.
Mic. 5
Left loudspeaker
Left headrest Loudspeaker of Zone 1 (Lsp. 0) to Standard Car Microphone 5 (Mic. 5)
Download impulse response (in ".fir" format).
In the download section you can download all impulse response files as well as format explanation and Matlab as well as Python code examples for loading fir files.
Right loudspeaker
Right headrest Loudspeaker of Zone 1 (Lsp. 1) to Standard Car Microphone 5 (Mic. 5)
Download impulse response (in ".fir" format).
In the download section you can download all impulse response files as well as format explanation and Matlab as well as Python code examples for loading fir files.
Mic. 6
Left loudspeaker
Left headrest Loudspeaker of Zone 1 (Lsp. 0) to Standard Car Microphone 6 (Mic. 6)
Download impulse response (in ".fir" format).
In the download section you can download all impulse response files as well as format explanation and Matlab as well as Python code examples for loading fir files.
Right loudspeaker
Right headrest Loudspeaker of Zone 1 (Lsp. 1) to Standard Car Microphone 6 (Mic. 6)
Download impulse response (in ".fir" format).
In the download section you can download all impulse response files as well as format explanation and Matlab as well as Python code examples for loading fir files.
Mic. 7
Left loudspeaker
Left headrest Loudspeaker of Zone 1 (Lsp. 0) to Standard Car Microphone 7 (Mic. 7)
Download impulse response (in ".fir" format).
In the download section you can download all impulse response files as well as format explanation and Matlab as well as Python code examples for loading fir files.
Right loudspeaker
Right headrest Loudspeaker of Zone 1 (Lsp. 1) to Standard Car Microphone 7 (Mic. 7)
Download impulse response (in ".fir" format).
In the download section you can download all impulse response files as well as format explanation and Matlab as well as Python code examples for loading fir files.
Mic. 8
Left loudspeaker
Left headrest Loudspeaker of Zone 1 (Lsp. 0) to Standard Car Microphone 8 (Mic. 8)
Download impulse response (in ".fir" format).
In the download section you can download all impulse response files as well as format explanation and Matlab as well as Python code examples for loading fir files.
Right loudspeaker
Right headrest Loudspeaker of Zone 1 (Lsp. 1) to Standard Car Microphone 8 (Mic. 8)

Download impulse response (in ".fir" format).
In the download section you can download all impulse response files as well as format explanation and Matlab as well as Python code examples for loading fir files.
Mic. 9
Left loudspeaker
Left headrest Loudspeaker of Zone 1 (Lsp. 0) to Standard Car Microphone 9 (Mic. 9)
Download impulse response (in ".fir" format).
In the download section you can download all impulse response files as well as format explanation and Matlab as well as Python code examples for loading fir files.
Right loudspeaker
Right headrest Loudspeaker of Zone 1 (Lsp. 1) to Standard Car Microphone 9 (Mic. 9)
Download impulse response (in ".fir" format).
In the download section you can download all impulse response files as well as format explanation and Matlab as well as Python code examples for loading fir files.
Mic. 10
Left loudspeaker
Left headrest Loudspeaker of Zone 1 (Lsp. 0) to Standard Car Microphone 10 (Mic. 10)
Download impulse response (in ".fir" format).
In the download section you can download all impulse response files as well as format explanation and Matlab as well as Python code examples for loading fir files.
Right loudspeaker
Right headrest Loudspeaker of Zone 1 (Lsp. 1) to Standard Car Microphone 10 (Mic. 10)
Download impulse response (in ".fir" format).
In the download section you can download all impulse response files as well as format explanation and Matlab as well as Python code examples for loading fir files.
Mic. 11
Left loudspeaker
Left headrest Loudspeaker of Zone 1 (Lsp. 0) to Standard Car Microphone 11 (Mic. 11)
Download impulse response (in ".fir" format).
In the download section you can download all impulse response files as well as format explanation and Matlab as well as Python code examples for loading fir files.
Right loudspeaker
Right headrest Loudspeaker of Zone 1 (Lsp. 1) to Standard Car Microphone 11 (Mic. 11)
Download impulse response (in ".fir" format).
In the download section you can download all impulse response files as well as format explanation and Matlab as well as Python code examples for loading fir files.
Mic. 12
Left loudspeaker
Left headrest Loudspeaker of Zone 1 (Lsp. 0) to Standard Car Microphone 12 (Mic. 12)
Download impulse response (in ".fir" format).
In the download section you can download all impulse response files as well as format explanation and Matlab as well as Python code examples for loading fir files.
Right loudspeaker
Right headrest Loudspeaker of Zone 1 (Lsp. 1) to Standard Car Microphone 12 (Mic. 12)
Download impulse response (in ".fir" format).
In the download section you can download all impulse response files as well as format explanation and Matlab as well as Python code examples for loading fir files.
Mic. 13
Left loudspeaker
Left headrest Loudspeaker of Zone 1 (Lsp. 0) to Standard Car Microphone 13 (Mic. 13)
Download impulse response (in ".fir" format).
In the download section you can download all impulse response files as well as format explanation and Matlab as well as Python code examples for loading fir files.
Right loudspeaker
Right headrest Loudspeaker of Zone 1 (Lsp. 1) to Standard Car Microphone 13 (Mic. 13)
Download impulse response (in ".fir" format).
In the download section you can download all impulse response files as well as format explanation and Matlab as well as Python code examples for loading fir files.
Mic. 14
Left loudspeaker
Left headrest Loudspeaker of Zone 1 (Lsp. 0) to Standard Car Microphone 14 (Mic. 14)
Download impulse response (in ".fir" format).
In the download section you can download all impulse response files as well as format explanation and Matlab as well as Python code examples for loading fir files.
Right loudspeaker
Right headrest Loudspeaker of Zone 1 (Lsp. 1) to Standard Car Microphone 14 (Mic. 14)

Download impulse response (in ".fir" format).
In the download section you can download all impulse response files as well as format explanation and Matlab as well as Python code examples for loading fir files.
Mic. 15
Left loudspeaker
Left headrest Loudspeaker of Zone 1 (Lsp. 0) to Standard Car Microphone 15 (Mic. 15)
Download impulse response (in ".fir" format).
In the download section you can download all impulse response files as well as format explanation and Matlab as well as Python code examples for loading fir files.
Right loudspeaker
Right headrest Loudspeaker of Zone 1 (Lsp. 1) to Standard Car Microphone 15 (Mic. 15)
Download impulse response (in ".fir" format).
In the download section you can download all impulse response files as well as format explanation and Matlab as well as Python code examples for loading fir files.
Mic. 16
Left loudspeaker
Left headrest Loudspeaker of Zone 1 (Lsp. 0) to Standard Car Microphone 16 (Mic. 16)

Download impulse response (in ".fir" format).
In the download section you can download all impulse response files as well as format explanation and Matlab as well as Python code examples for loading fir files.
Right loudspeaker
Right headrest Loudspeaker of Zone 1 (Lsp. 1) to Standard Car Microphone 16 (Mic. 16)
Download impulse response (in ".fir" format).
In the download section you can download all impulse response files as well as format explanation and Matlab as well as Python code examples for loading fir files.
Mic. 17
Left loudspeaker
Left headrest Loudspeaker of Zone 1 (Lsp. 0) to Standard Car Microphone 17 (Mic. 17)

Download impulse response (in ".fir" format).
In the download section you can download all impulse response files as well as format explanation and Matlab as well as Python code examples for loading fir files.
Right loudspeaker
Right headrest Loudspeaker of Zone 1 (Lsp. 1) to Standard Car Microphone 17 (Mic. 17)
Download impulse response (in ".fir" format).
In the download section you can download all impulse response files as well as format explanation and Matlab as well as Python code examples for loading fir files.
Mic. 18
Left loudspeaker
Left headrest Loudspeaker of Zone 1 (Lsp. 0) to Standard Car Microphone 18 (Mic. 18)
Download impulse response (in ".fir" format).
In the download section you can download all impulse response files as well as format explanation and Matlab as well as Python code examples for loading fir files.
Right loudspeaker
Right headrest Loudspeaker of Zone 1 (Lsp. 1) to Standard Car Microphone 18 (Mic. 18)
Download impulse response (in ".fir" format).
In the download section you can download all impulse response files as well as format explanation and Matlab as well as Python code examples for loading fir files.
Lsps. 2/3
Mic. 0
Left loudspeaker
Left headrest Loudspeaker of Zone 2 (Lsp. 2) to Standard Car Microphone 0 (Mic. 0)
Download impulse response (in ".fir" format).
In the download section you can download all impulse response files as well as format explanation and Matlab as well as Python code examples for loading fir files.
Right loudspeaker
Right headrest Loudspeaker of Zone 2 (Lsp. 3) to Standard Car Microphone 0 (Mic. 0)
Download impulse response (in ".fir" format).
In the download section you can download all impulse response files as well as format explanation and Matlab as well as Python code examples for loading fir files.
Mic. 1
Left loudspeaker
Left headrest Loudspeaker of Zone 2 (Lsp. 2) to Standard Car Microphone 1 (Mic. 1)
Download impulse response (in ".fir" format).
In the download section you can download all impulse response files as well as format explanation and Matlab as well as Python code examples for loading fir files.
Right loudspeaker
Right headrest Loudspeaker of Zone 2 (Lsp. 3) to Standard Car Microphone 1 (Mic. 1)
Download impulse response (in ".fir" format).
In the download section you can download all impulse response files as well as format explanation and Matlab as well as Python code examples for loading fir files.
Mic. 2
Left loudspeaker
Left headrest Loudspeaker of Zone 2 (Lsp. 2) to Standard Car Microphone 2 (Mic. 2)
Download impulse response (in ".fir" format).
In the download section you can download all impulse response files as well as format explanation and Matlab as well as Python code examples for loading fir files.
Right loudspeaker
Right headrest Loudspeaker of Zone 2 (Lsp. 3) to Standard Car Microphone 2 (Mic. 2)
Download impulse response (in ".fir" format).
In the download section you can download all impulse response files as well as format explanation and Matlab as well as Python code examples for loading fir files.
Mic. 3
Left loudspeaker
Left headrest Loudspeaker of Zone 2 (Lsp. 2) to Standard Car Microphone 3 (Mic. 3)
Download impulse response (in ".fir" format).
In the download section you can download all impulse response files as well as format explanation and Matlab as well as Python code examples for loading fir files.
Right loudspeaker
Right headrest Loudspeaker of Zone 2 (Lsp. 3) to Standard Car Microphone 3 (Mic. 3)
Download impulse response (in ".fir" format).
In the download section you can download all impulse response files as well as format explanation and Matlab as well as Python code examples for loading fir files.
Mic. 4
Left loudspeaker
Left headrest Loudspeaker of Zone 2 (Lsp. 2) to Standard Car Microphone 4 (Mic. 4)
Download impulse response (in ".fir" format).
In the download section you can download all impulse response files as well as format explanation and Matlab as well as Python code examples for loading fir files.
Right loudspeaker
Right headrest Loudspeaker of Zone 2 (Lsp. 3) to Standard Car Microphone 4 (Mic. 4)
Download impulse response (in ".fir" format).
In the download section you can download all impulse response files as well as format explanation and Matlab as well as Python code examples for loading fir files.
Mic. 5
Left loudspeaker
Left headrest Loudspeaker of Zone 2 (Lsp. 2) to Standard Car Microphone 5 (Mic. 5)
Download impulse response (in ".fir" format).
In the download section you can download all impulse response files as well as format explanation and Matlab as well as Python code examples for loading fir files.
Right loudspeaker
Right headrest Loudspeaker of Zone 2 (Lsp. 3) to Standard Car Microphone 5 (Mic. 5)
Download impulse response (in ".fir" format).
In the download section you can download all impulse response files as well as format explanation and Matlab as well as Python code examples for loading fir files.
Mic. 6
Left loudspeaker
Left headrest Loudspeaker of Zone 2 (Lsp. 2) to Standard Car Microphone 6 (Mic. 6)
Download impulse response (in ".fir" format).
In the download section you can download all impulse response files as well as format explanation and Matlab as well as Python code examples for loading fir files.
Right loudspeaker
Right headrest Loudspeaker of Zone 2 (Lsp. 3) to Standard Car Microphone 6 (Mic. 6)
Download impulse response (in ".fir" format).
In the download section you can download all impulse response files as well as format explanation and Matlab as well as Python code examples for loading fir files.
Mic. 7
Left loudspeaker
Left headrest Loudspeaker of Zone 2 (Lsp. 2) to Standard Car Microphone 7 (Mic. 7)
Download impulse response (in ".fir" format).
In the download section you can download all impulse response files as well as format explanation and Matlab as well as Python code examples for loading fir files.
Right loudspeaker
Right headrest Loudspeaker of Zone 2 (Lsp. 3) to Standard Car Microphone 7 (Mic. 7)

Download impulse response (in ".fir" format).
In the download section you can download all impulse response files as well as format explanation and Matlab as well as Python code examples for loading fir files.
Mic. 8
Left loudspeaker
Left headrest Loudspeaker of Zone 2 (Lsp. 2) to Standard Car Microphone 8 (Mic. 8)
Download impulse response (in ".fir" format).
In the download section you can download all impulse response files as well as format explanation and Matlab as well as Python code examples for loading fir files.
Right loudspeaker
Right headrest Loudspeaker of Zone 2 (Lsp. 3) to Standard Car Microphone 8 (Mic. 8)
Download impulse response (in ".fir" format).
In the download section you can download all impulse response files as well as format explanation and Matlab as well as Python code examples for loading fir files.
Mic. 9
Left loudspeaker
Left headrest Loudspeaker of Zone 2 (Lsp. 2) to Standard Car Microphone 9 (Mic. 9)
Download impulse response (in ".fir" format).
In the download section you can download all impulse response files as well as format explanation and Matlab as well as Python code examples for loading fir files.
Right loudspeaker
Right headrest Loudspeaker of Zone 2 (Lsp. 3) to Standard Car Microphone 9 (Mic. 9)
Download impulse response (in ".fir" format).
In the download section you can download all impulse response files as well as format explanation and Matlab as well as Python code examples for loading fir files.
Mic. 10
Left loudspeaker
Left headrest Loudspeaker of Zone 2 (Lsp. 2) to Standard Car Microphone 10 (Mic. 10)
Download impulse response (in ".fir" format).
In the download section you can download all impulse response files as well as format explanation and Matlab as well as Python code examples for loading fir files.
Right loudspeaker
Right headrest Loudspeaker of Zone 2 (Lsp. 3) to Standard Car Microphone 10 (Mic. 10)
Download impulse response (in ".fir" format).
In the download section you can download all impulse response files as well as format explanation and Matlab as well as Python code examples for loading fir files.
Mic. 11
Left loudspeaker
Left headrest Loudspeaker of Zone 2 (Lsp. 2) to Standard Car Microphone 11 (Mic. 11)
Download impulse response (in ".fir" format).
In the download section you can download all impulse response files as well as format explanation and Matlab as well as Python code examples for loading fir files.
Right loudspeaker
Right headrest Loudspeaker of Zone 2 (Lsp. 3) to Standard Car Microphone 11 (Mic. 11)
Download impulse response (in ".fir" format).
In the download section you can download all impulse response files as well as format explanation and Matlab as well as Python code examples for loading fir files.
Mic. 12
Left loudspeaker
Left headrest Loudspeaker of Zone 2 (Lsp. 2) to Standard Car Microphone 12 (Mic. 12)
Download impulse response (in ".fir" format).
In the download section you can download all impulse response files as well as format explanation and Matlab as well as Python code examples for loading fir files.
Right loudspeaker
Right headrest Loudspeaker of Zone 2 (Lsp. 3) to Standard Car Microphone 12 (Mic. 12)

Download impulse response (in ".fir" format).
In the download section you can download all impulse response files as well as format explanation and Matlab as well as Python code examples for loading fir files.
Mic. 13
Left loudspeaker
Left headrest Loudspeaker of Zone 2 (Lsp. 2) to Standard Car Microphone 13 (Mic. 13)
Download impulse response (in ".fir" format).
In the download section you can download all impulse response files as well as format explanation and Matlab as well as Python code examples for loading fir files.
Right loudspeaker
Right headrest Loudspeaker of Zone 2 (Lsp. 3) to Standard Car Microphone 13 (Mic. 13)
Download impulse response (in ".fir" format).
In the download section you can download all impulse response files as well as format explanation and Matlab as well as Python code examples for loading fir files.
Mic. 14
Left loudspeaker
Left headrest Loudspeaker of Zone 2 (Lsp. 2) to Standard Car Microphone 14 (Mic. 14)
Download impulse response (in ".fir" format).
In the download section you can download all impulse response files as well as format explanation and Matlab as well as Python code examples for loading fir files.
Right loudspeaker
Right headrest Loudspeaker of Zone 2 (Lsp. 3) to Standard Car Microphone 14 (Mic. 14)

Download impulse response (in ".fir" format).
In the download section you can download all impulse response files as well as format explanation and Matlab as well as Python code examples for loading fir files.
Mic. 15
Left loudspeaker
Left headrest Loudspeaker of Zone 2 (Lsp. 2) to Standard Car Microphone 15 (Mic. 15)

Download impulse response (in ".fir" format).
In the download section you can download all impulse response files as well as format explanation and Matlab as well as Python code examples for loading fir files.
Right loudspeaker
Right headrest Loudspeaker of Zone 2 (Lsp. 3) to Standard Car Microphone 15 (Mic. 15)
Download impulse response (in ".fir" format).
In the download section you can download all impulse response files as well as format explanation and Matlab as well as Python code examples for loading fir files.
Mic. 16
Left loudspeaker
Left headrest Loudspeaker of Zone 2 (Lsp. 2) to Standard Car Microphone 16 (Mic. 16)
Download impulse response (in ".fir" format).
In the download section you can download all impulse response files as well as format explanation and Matlab as well as Python code examples for loading fir files.
Right loudspeaker
Right headrest Loudspeaker of Zone 2 (Lsp. 3) to Standard Car Microphone 16 (Mic. 16)
Download impulse response (in ".fir" format).
In the download section you can download all impulse response files as well as format explanation and Matlab as well as Python code examples for loading fir files.
Mic. 17
Left loudspeaker
Left headrest Loudspeaker of Zone 2 (Lsp. 2) to Standard Car Microphone 17 (Mic. 17)
Download impulse response (in ".fir" format).
In the download section you can download all impulse response files as well as format explanation and Matlab as well as Python code examples for loading fir files.
Right loudspeaker
Right headrest Loudspeaker of Zone 2 (Lsp. 3) to Standard Car Microphone 17 (Mic. 17)

Download impulse response (in ".fir" format).
In the download section you can download all impulse response files as well as format explanation and Matlab as well as Python code examples for loading fir files.
Mic. 18
Left loudspeaker
Left headrest Loudspeaker of Zone 2 (Lsp. 2) to Standard Car Microphone 18 (Mic. 18)

Download impulse response (in ".fir" format).
In the download section you can download all impulse response files as well as format explanation and Matlab as well as Python code examples for loading fir files.
Right loudspeaker
Right headrest Loudspeaker of Zone 2 (Lsp. 3) to Standard Car Microphone 18 (Mic. 18)

Download impulse response (in ".fir" format).
In the download section you can download all impulse response files as well as format explanation and Matlab as well as Python code examples for loading fir files.
Lsps. 4/5
Mic. 0
Left loudspeaker
Left headrest Loudspeaker of Zone 3 (Lsp. 4) to Standard Car Microphone 0 (Mic. 0)
Download impulse response (in ".fir" format).
In the download section you can download all impulse response files as well as format explanation and Matlab as well as Python code examples for loading fir files.
Right loudspeaker
Right headrest Loudspeaker of Zone 3 (Lsp. 5) to Standard Car Microphone 0 (Mic. 0)
Download impulse response (in ".fir" format).
In the download section you can download all impulse response files as well as format explanation and Matlab as well as Python code examples for loading fir files.
Mic. 1
Left loudspeaker
Left headrest Loudspeaker of Zone 3 (Lsp. 4) to Standard Car Microphone 1 (Mic. 1)
Download impulse response (in ".fir" format).
In the download section you can download all impulse response files as well as format explanation and Matlab as well as Python code examples for loading fir files.
Right loudspeaker
Right headrest Loudspeaker of Zone 3 (Lsp. 5) to Standard Car Microphone 1 (Mic. 1)
Download impulse response (in ".fir" format).
In the download section you can download all impulse response files as well as format explanation and Matlab as well as Python code examples for loading fir files.
Mic. 2
Left loudspeaker
Left headrest Loudspeaker of Zone 3 (Lsp. 4) to Standard Car Microphone 2 (Mic. 2)
Download impulse response (in ".fir" format).
In the download section you can download all impulse response files as well as format explanation and Matlab as well as Python code examples for loading fir files.
Right loudspeaker
Right headrest Loudspeaker of Zone 3 (Lsp. 5) to Standard Car Microphone 2 (Mic. 2)
Download impulse response (in ".fir" format).
In the download section you can download all impulse response files as well as format explanation and Matlab as well as Python code examples for loading fir files.
Mic. 3
Left loudspeaker
Left headrest Loudspeaker of Zone 3 (Lsp. 4) to Standard Car Microphone 3 (Mic. 3)
Download impulse response (in ".fir" format).
In the download section you can download all impulse response files as well as format explanation and Matlab as well as Python code examples for loading fir files.
Right loudspeaker
Right headrest Loudspeaker of Zone 3 (Lsp. 5) to Standard Car Microphone 3 (Mic. 3)
Download impulse response (in ".fir" format).
In the download section you can download all impulse response files as well as format explanation and Matlab as well as Python code examples for loading fir files.
Mic. 4
Left loudspeaker
Left headrest Loudspeaker of Zone 3 (Lsp. 4) to Standard Car Microphone 4 (Mic. 4)
Download impulse response (in ".fir" format).
In the download section you can download all impulse response files as well as format explanation and Matlab as well as Python code examples for loading fir files.
Right loudspeaker
Right headrest Loudspeaker of Zone 3 (Lsp. 5) to Standard Car Microphone 4 (Mic. 4)
Download impulse response (in ".fir" format).
In the download section you can download all impulse response files as well as format explanation and Matlab as well as Python code examples for loading fir files.
Mic. 5
Left loudspeaker
Left headrest Loudspeaker of Zone 3 (Lsp. 4) to Standard Car Microphone 5 (Mic. 5)
Download impulse response (in ".fir" format).
In the download section you can download all impulse response files as well as format explanation and Matlab as well as Python code examples for loading fir files.
Right loudspeaker
Right headrest Loudspeaker of Zone 3 (Lsp. 5) to Standard Car Microphone 5 (Mic. 5)
Download impulse response (in ".fir" format).
In the download section you can download all impulse response files as well as format explanation and Matlab as well as Python code examples for loading fir files.
Mic. 6
Left loudspeaker
Left headrest Loudspeaker of Zone 3 (Lsp. 4) to Standard Car Microphone 6 (Mic. 6)
Download impulse response (in ".fir" format).
In the download section you can download all impulse response files as well as format explanation and Matlab as well as Python code examples for loading fir files.
Right loudspeaker
Right headrest Loudspeaker of Zone 3 (Lsp. 5) to Standard Car Microphone 6 (Mic. 6)
Download impulse response (in ".fir" format).
In the download section you can download all impulse response files as well as format explanation and Matlab as well as Python code examples for loading fir files.
Mic. 7
Left loudspeaker
Left headrest Loudspeaker of Zone 3 (Lsp. 4) to Standard Car Microphone 7 (Mic. 7)
Download impulse response (in ".fir" format).
In the download section you can download all impulse response files as well as format explanation and Matlab as well as Python code examples for loading fir files.
Right loudspeaker
Right headrest Loudspeaker of Zone 3 (Lsp. 5) to Standard Car Microphone 7 (Mic. 7)
Download impulse response (in ".fir" format).
In the download section you can download all impulse response files as well as format explanation and Matlab as well as Python code examples for loading fir files.
Mic. 8
Left loudspeaker
Left headrest Loudspeaker of Zone 3 (Lsp. 4) to Standard Car Microphone 8 (Mic. 8)
Download impulse response (in ".fir" format).
In the download section you can download all impulse response files as well as format explanation and Matlab as well as Python code examples for loading fir files.
Right loudspeaker
Right headrest Loudspeaker of Zone 3 (Lsp. 5) to Standard Car Microphone 8 (Mic. 8)

Download impulse response (in ".fir" format).
In the download section you can download all impulse response files as well as format explanation and Matlab as well as Python code examples for loading fir files.
Mic. 9
Left loudspeaker
Left headrest Loudspeaker of Zone 3 (Lsp. 4) to Standard Car Microphone 9 (Mic. 9)
Download impulse response (in ".fir" format).
In the download section you can download all impulse response files as well as format explanation and Matlab as well as Python code examples for loading fir files.
Right loudspeaker
Right headrest Loudspeaker of Zone 3 (Lsp. 5) to Standard Car Microphone 9 (Mic. 9)
Download impulse response (in ".fir" format).
In the download section you can download all impulse response files as well as format explanation and Matlab as well as Python code examples for loading fir files.
Mic. 10
Left loudspeaker
Left headrest Loudspeaker of Zone 3 (Lsp. 4) to Standard Car Microphone 10 (Mic. 10)
Download impulse response (in ".fir" format).
In the download section you can download all impulse response files as well as format explanation and Matlab as well as Python code examples for loading fir files.
Right loudspeaker
Right headrest Loudspeaker of Zone 3 (Lsp. 5) to Standard Car Microphone 10 (Mic. 10)
Download impulse response (in ".fir" format).
In the download section you can download all impulse response files as well as format explanation and Matlab as well as Python code examples for loading fir files.
Mic. 11
Left loudspeaker
Left headrest Loudspeaker of Zone 3 (Lsp. 4) to Standard Car Microphone 11 (Mic. 11)
Download impulse response (in ".fir" format).
In the download section you can download all impulse response files as well as format explanation and Matlab as well as Python code examples for loading fir files.
Right loudspeaker
Right headrest Loudspeaker of Zone 3 (Lsp. 5) to Standard Car Microphone 11 (Mic. 11)
Download impulse response (in ".fir" format).
In the download section you can download all impulse response files as well as format explanation and Matlab as well as Python code examples for loading fir files.
Mic. 12
Left loudspeaker
Left headrest Loudspeaker of Zone 3 (Lsp. 4) to Standard Car Microphone 12 (Mic. 12)
Download impulse response (in ".fir" format).
In the download section you can download all impulse response files as well as format explanation and Matlab as well as Python code examples for loading fir files.
Right loudspeaker
Right headrest Loudspeaker of Zone 3 (Lsp. 5) to Standard Car Microphone 12 (Mic. 12)
Download impulse response (in ".fir" format).
In the download section you can download all impulse response files as well as format explanation and Matlab as well as Python code examples for loading fir files.
Mic. 13
Left loudspeaker
Left headrest Loudspeaker of Zone 3 (Lsp. 4) to Standard Car Microphone 13 (Mic. 13)
Download impulse response (in ".fir" format).
In the download section you can download all impulse response files as well as format explanation and Matlab as well as Python code examples for loading fir files.
Right loudspeaker
Right headrest Loudspeaker of Zone 3 (Lsp. 5) to Standard Car Microphone 13 (Mic. 13)

Download impulse response (in ".fir" format).
In the download section you can download all impulse response files as well as format explanation and Matlab as well as Python code examples for loading fir files.
Mic. 14
Left loudspeaker
Left headrest Loudspeaker of Zone 3 (Lsp. 4) to Standard Car Microphone 14 (Mic. 14)

Download impulse response (in ".fir" format).
In the download section you can download all impulse response files as well as format explanation and Matlab as well as Python code examples for loading fir files.
Right loudspeaker
Right headrest Loudspeaker of Zone 3 (Lsp. 5) to Standard Car Microphone 14 (Mic. 14)

Download impulse response (in ".fir" format).
In the download section you can download all impulse response files as well as format explanation and Matlab as well as Python code examples for loading fir files.
Mic. 15
Left loudspeaker
Left headrest Loudspeaker of Zone 3 (Lsp. 4) to Standard Car Microphone 15 (Mic. 15)

Download impulse response (in ".fir" format).
In the download section you can download all impulse response files as well as format explanation and Matlab as well as Python code examples for loading fir files.
Right loudspeaker
Right headrest Loudspeaker of Zone 3 (Lsp. 5) to Standard Car Microphone 15 (Mic. 15)
Download impulse response (in ".fir" format).
In the download section you can download all impulse response files as well as format explanation and Matlab as well as Python code examples for loading fir files.
Mic. 16
Left loudspeaker
Left headrest Loudspeaker of Zone 3 (Lsp. 4) to Standard Car Microphone 16 (Mic. 16)

Download impulse response (in ".fir" format).
In the download section you can download all impulse response files as well as format explanation and Matlab as well as Python code examples for loading fir files.
Right loudspeaker
Right headrest Loudspeaker of Zone 3 (Lsp. 5) to Standard Car Microphone 16 (Mic. 16)

Download impulse response (in ".fir" format).
In the download section you can download all impulse response files as well as format explanation and Matlab as well as Python code examples for loading fir files.
Mic. 17
Left loudspeaker
Left headrest Loudspeaker of Zone 3 (Lsp. 4) to Standard Car Microphone 17 (Mic. 17)
Download impulse response (in ".fir" format).
In the download section you can download all impulse response files as well as format explanation and Matlab as well as Python code examples for loading fir files.
Right loudspeaker
Right headrest Loudspeaker of Zone 3 (Lsp. 5) to Standard Car Microphone 17 (Mic. 17)

Download impulse response (in ".fir" format).
In the download section you can download all impulse response files as well as format explanation and Matlab as well as Python code examples for loading fir files.
Mic. 18
Left loudspeaker
Left headrest Loudspeaker of Zone 3 (Lsp. 4) to Standard Car Microphone 18 (Mic. 18)
Download impulse response (in ".fir" format).
In the download section you can download all impulse response files as well as format explanation and Matlab as well as Python code examples for loading fir files.
Right loudspeaker
Right headrest Loudspeaker of Zone 3 (Lsp. 5) to Standard Car Microphone 18 (Mic. 18)
Download impulse response (in ".fir" format).
In the download section you can download all impulse response files as well as format explanation and Matlab as well as Python code examples for loading fir files.
Lsps. 6/7
Mic. 0
Left loudspeaker
Left headrest Loudspeaker of Zone 5 (Lsp. 6) to Standard Car Microphone 0 (Mic. 0)
Download impulse response (in ".fir" format).
In the download section you can download all impulse response files as well as format explanation and Matlab as well as Python code examples for loading fir files.
Right loudspeaker
Right headrest Loudspeaker of Zone 5 (Lsp. 7) to Standard Car Microphone 0 (Mic. 0)
Download impulse response (in ".fir" format).
In the download section you can download all impulse response files as well as format explanation and Matlab as well as Python code examples for loading fir files.
Mic. 1
Left loudspeaker
Left headrest Loudspeaker of Zone 5 (Lsp. 6) to Standard Car Microphone 1 (Mic. 1)
Download impulse response (in ".fir" format).
In the download section you can download all impulse response files as well as format explanation and Matlab as well as Python code examples for loading fir files.
Right loudspeaker
Right headrest Loudspeaker of Zone 5 (Lsp. 7) to Standard Car Microphone 1 (Mic. 1)
Download impulse response (in ".fir" format).
In the download section you can download all impulse response files as well as format explanation and Matlab as well as Python code examples for loading fir files.
Mic. 2
Left loudspeaker
Left headrest Loudspeaker of Zone 5 (Lsp. 6) to Standard Car Microphone 2 (Mic. 2)
Download impulse response (in ".fir" format).
In the download section you can download all impulse response files as well as format explanation and Matlab as well as Python code examples for loading fir files.
Right loudspeaker
Right headrest Loudspeaker of Zone 5 (Lsp. 7) to Standard Car Microphone 2 (Mic. 2)
Download impulse response (in ".fir" format).
In the download section you can download all impulse response files as well as format explanation and Matlab as well as Python code examples for loading fir files.
Mic. 3
Left loudspeaker
Left headrest Loudspeaker of Zone 5 (Lsp. 6) to Standard Car Microphone 3 (Mic. 3)

Download impulse response (in ".fir" format).
In the download section you can download all impulse response files as well as format explanation and Matlab as well as Python code examples for loading fir files.
Right loudspeaker
Right headrest Loudspeaker of Zone 5 (Lsp. 7) to Standard Car Microphone 3 (Mic. 3)
Download impulse response (in ".fir" format).
In the download section you can download all impulse response files as well as format explanation and Matlab as well as Python code examples for loading fir files.
Mic. 4
Left loudspeaker
Left headrest Loudspeaker of Zone 5 (Lsp. 6) to Standard Car Microphone 4 (Mic. 4)
Download impulse response (in ".fir" format).
In the download section you can download all impulse response files as well as format explanation and Matlab as well as Python code examples for loading fir files.
Right loudspeaker
Right headrest Loudspeaker of Zone 5 (Lsp. 7) to Standard Car Microphone 4 (Mic. 4)
Download impulse response (in ".fir" format).
In the download section you can download all impulse response files as well as format explanation and Matlab as well as Python code examples for loading fir files.
Mic. 5
Left loudspeaker
Left headrest Loudspeaker of Zone 5 (Lsp. 6) to Standard Car Microphone 5 (Mic. 5)
Download impulse response (in ".fir" format).
In the download section you can download all impulse response files as well as format explanation and Matlab as well as Python code examples for loading fir files.
Right loudspeaker
Right headrest Loudspeaker of Zone 5 (Lsp. 7) to Standard Car Microphone 5 (Mic. 5)
Download impulse response (in ".fir" format).
In the download section you can download all impulse response files as well as format explanation and Matlab as well as Python code examples for loading fir files.
Mic. 6
Left loudspeaker
Left headrest Loudspeaker of Zone 5 (Lsp. 6) to Standard Car Microphone 6 (Mic. 6)
Download impulse response (in ".fir" format).
In the download section you can download all impulse response files as well as format explanation and Matlab as well as Python code examples for loading fir files.
Right loudspeaker
Right headrest Loudspeaker of Zone 5 (Lsp. 7) to Standard Car Microphone 6 (Mic. 6)
Download impulse response (in ".fir" format).
In the download section you can download all impulse response files as well as format explanation and Matlab as well as Python code examples for loading fir files.
Mic. 7
Left loudspeaker
Left headrest Loudspeaker of Zone 5 (Lsp. 6) to Standard Car Microphone 7 (Mic. 7)

Download impulse response (in ".fir" format).
In the download section you can download all impulse response files as well as format explanation and Matlab as well as Python code examples for loading fir files.
Right loudspeaker
Right headrest Loudspeaker of Zone 5 (Lsp. 7) to Standard Car Microphone 7 (Mic. 7)
Download impulse response (in ".fir" format).
In the download section you can download all impulse response files as well as format explanation and Matlab as well as Python code examples for loading fir files.
Mic. 8
Left loudspeaker
Left headrest Loudspeaker of Zone 5 (Lsp. 6) to Standard Car Microphone 8 (Mic. 8)
Download impulse response (in ".fir" format).
In the download section you can download all impulse response files as well as format explanation and Matlab as well as Python code examples for loading fir files.
Right loudspeaker
Right headrest Loudspeaker of Zone 5 (Lsp. 7) to Standard Car Microphone 8 (Mic. 8)
Download impulse response (in ".fir" format).
In the download section you can download all impulse response files as well as format explanation and Matlab as well as Python code examples for loading fir files.
Mic. 9
Left loudspeaker
Left headrest Loudspeaker of Zone 5 (Lsp. 6) to Standard Car Microphone 9 (Mic. 9)
Download impulse response (in ".fir" format).
In the download section you can download all impulse response files as well as format explanation and Matlab as well as Python code examples for loading fir files.
Right loudspeaker
Right headrest Loudspeaker of Zone 5 (Lsp. 7) to Standard Car Microphone 9 (Mic. 9)
Download impulse response (in ".fir" format).
In the download section you can download all impulse response files as well as format explanation and Matlab as well as Python code examples for loading fir files.
Mic. 10
Left loudspeaker
Left headrest Loudspeaker of Zone 5 (Lsp. 6) to Standard Car Microphone 10 (Mic. 10)
Download impulse response (in ".fir" format).
In the download section you can download all impulse response files as well as format explanation and Matlab as well as Python code examples for loading fir files.
Right loudspeaker
Right headrest Loudspeaker of Zone 5 (Lsp. 7) to Standard Car Microphone 10 (Mic. 10)
Download impulse response (in ".fir" format).
In the download section you can download all impulse response files as well as format explanation and Matlab as well as Python code examples for loading fir files.
Mic. 11
Left loudspeaker
Left headrest Loudspeaker of Zone 5 (Lsp. 6) to Standard Car Microphone 11 (Mic. 11)

Download impulse response (in ".fir" format).
In the download section you can download all impulse response files as well as format explanation and Matlab as well as Python code examples for loading fir files.
Right loudspeaker
Right headrest Loudspeaker of Zone 5 (Lsp. 7) to Standard Car Microphone 11 (Mic. 11)
Download impulse response (in ".fir" format).
In the download section you can download all impulse response files as well as format explanation and Matlab as well as Python code examples for loading fir files.
Mic. 12
Left loudspeaker
Left headrest Loudspeaker of Zone 5 (Lsp. 6) to Standard Car Microphone 12 (Mic. 12)
Download impulse response (in ".fir" format).
In the download section you can download all impulse response files as well as format explanation and Matlab as well as Python code examples for loading fir files.
Right loudspeaker
Right headrest Loudspeaker of Zone 5 (Lsp. 7) to Standard Car Microphone 12 (Mic. 12)
Download impulse response (in ".fir" format).
In the download section you can download all impulse response files as well as format explanation and Matlab as well as Python code examples for loading fir files.
Mic. 13
Left loudspeaker
Left headrest Loudspeaker of Zone 5 (Lsp. 6) to Standard Car Microphone 13 (Mic. 13)

Download impulse response (in ".fir" format).
In the download section you can download all impulse response files as well as format explanation and Matlab as well as Python code examples for loading fir files.
Right loudspeaker
Right headrest Loudspeaker of Zone 5 (Lsp. 7) to Standard Car Microphone 13 (Mic. 13)

Download impulse response (in ".fir" format).
In the download section you can download all impulse response files as well as format explanation and Matlab as well as Python code examples for loading fir files.
Mic. 14
Left loudspeaker
Left headrest Loudspeaker of Zone 5 (Lsp. 6) to Standard Car Microphone 14 (Mic. 14)
Download impulse response (in ".fir" format).
In the download section you can download all impulse response files as well as format explanation and Matlab as well as Python code examples for loading fir files.
Right loudspeaker
Right headrest Loudspeaker of Zone 5 (Lsp. 7) to Standard Car Microphone 14 (Mic. 14)

Download impulse response (in ".fir" format).
In the download section you can download all impulse response files as well as format explanation and Matlab as well as Python code examples for loading fir files.
Mic. 15
Left loudspeaker
Left headrest Loudspeaker of Zone 5 (Lsp. 6) to Standard Car Microphone 15 (Mic. 15)
Download impulse response (in ".fir" format).
In the download section you can download all impulse response files as well as format explanation and Matlab as well as Python code examples for loading fir files.
Right loudspeaker
Right headrest Loudspeaker of Zone 5 (Lsp. 7) to Standard Car Microphone 15 (Mic. 15)

Download impulse response (in ".fir" format).
In the download section you can download all impulse response files as well as format explanation and Matlab as well as Python code examples for loading fir files.
Mic. 16
Left loudspeaker
Left headrest Loudspeaker of Zone 5 (Lsp. 6) to Standard Car Microphone 16 (Mic. 16)
Download impulse response (in ".fir" format).
In the download section you can download all impulse response files as well as format explanation and Matlab as well as Python code examples for loading fir files.
Right loudspeaker
Right headrest Loudspeaker of Zone 5 (Lsp. 7) to Standard Car Microphone 16 (Mic. 16)

Download impulse response (in ".fir" format).
In the download section you can download all impulse response files as well as format explanation and Matlab as well as Python code examples for loading fir files.
Mic. 17
Left loudspeaker
Left headrest Loudspeaker of Zone 5 (Lsp. 6) to Standard Car Microphone 17 (Mic. 17)
Download impulse response (in ".fir" format).
In the download section you can download all impulse response files as well as format explanation and Matlab as well as Python code examples for loading fir files.
Right loudspeaker
Right headrest Loudspeaker of Zone 5 (Lsp. 7) to Standard Car Microphone 17 (Mic. 17)

Download impulse response (in ".fir" format).
In the download section you can download all impulse response files as well as format explanation and Matlab as well as Python code examples for loading fir files.
Mic. 18
Left loudspeaker
Left headrest Loudspeaker of Zone 5 (Lsp. 6) to Standard Car Microphone 18 (Mic. 18)
Download impulse response (in ".fir" format).
In the download section you can download all impulse response files as well as format explanation and Matlab as well as Python code examples for loading fir files.
Right loudspeaker
Right headrest Loudspeaker of Zone 5 (Lsp. 7) to Standard Car Microphone 18 (Mic. 18)
Download impulse response (in ".fir" format).
In the download section you can download all impulse response files as well as format explanation and Matlab as well as Python code examples for loading fir files.
Lsps. 8/9
Mic. 0
Left loudspeaker
Left headrest Loudspeaker of Zone 6 (Lsp. 8) to Standard Car Microphone 0 (Mic. 0)
Download impulse response (in ".fir" format).
In the download section you can download all impulse response files as well as format explanation and Matlab as well as Python code examples for loading fir files.
Right loudspeaker
Right headrest Loudspeaker of Zone 6 (Lsp. 9) to Standard Car Microphone 0 (Mic. 0)
Download impulse response (in ".fir" format).
In the download section you can download all impulse response files as well as format explanation and Matlab as well as Python code examples for loading fir files.
Mic. 1
Left loudspeaker
Left headrest Loudspeaker of Zone 6 (Lsp. 8) to Standard Car Microphone 1 (Mic. 1)
Download impulse response (in ".fir" format).
In the download section you can download all impulse response files as well as format explanation and Matlab as well as Python code examples for loading fir files.
Right loudspeaker
Right headrest Loudspeaker of Zone 6 (Lsp. 9) to Standard Car Microphone 1 (Mic. 1)
Download impulse response (in ".fir" format).
In the download section you can download all impulse response files as well as format explanation and Matlab as well as Python code examples for loading fir files.
Mic. 2
Left loudspeaker
Left headrest Loudspeaker of Zone 6 (Lsp. 8) to Standard Car Microphone 2 (Mic. 2)
Download impulse response (in ".fir" format).
In the download section you can download all impulse response files as well as format explanation and Matlab as well as Python code examples for loading fir files.
Right loudspeaker
Right headrest Loudspeaker of Zone 6 (Lsp. 9) to Standard Car Microphone 2 (Mic. 2)
Download impulse response (in ".fir" format).
In the download section you can download all impulse response files as well as format explanation and Matlab as well as Python code examples for loading fir files.
Mic. 3
Left loudspeaker
Left headrest Loudspeaker of Zone 6 (Lsp. 8) to Standard Car Microphone 3 (Mic. 3)
Download impulse response (in ".fir" format).
In the download section you can download all impulse response files as well as format explanation and Matlab as well as Python code examples for loading fir files.
Right loudspeaker
Right headrest Loudspeaker of Zone 6 (Lsp. 9) to Standard Car Microphone 3 (Mic. 3)
Download impulse response (in ".fir" format).
In the download section you can download all impulse response files as well as format explanation and Matlab as well as Python code examples for loading fir files.
Mic. 4
Left loudspeaker
Left headrest Loudspeaker of Zone 6 (Lsp. 8) to Standard Car Microphone 4 (Mic. 4)
Download impulse response (in ".fir" format).
In the download section you can download all impulse response files as well as format explanation and Matlab as well as Python code examples for loading fir files.
Right loudspeaker
Right headrest Loudspeaker of Zone 6 (Lsp. 9) to Standard Car Microphone 4 (Mic. 4)
Download impulse response (in ".fir" format).
In the download section you can download all impulse response files as well as format explanation and Matlab as well as Python code examples for loading fir files.
Mic. 5
Left loudspeaker
Left headrest Loudspeaker of Zone 6 (Lsp. 8) to Standard Car Microphone 5 (Mic. 5)
Download impulse response (in ".fir" format).
In the download section you can download all impulse response files as well as format explanation and Matlab as well as Python code examples for loading fir files.
Right loudspeaker
Right headrest Loudspeaker of Zone 6 (Lsp. 9) to Standard Car Microphone 5 (Mic. 5)
Download impulse response (in ".fir" format).
In the download section you can download all impulse response files as well as format explanation and Matlab as well as Python code examples for loading fir files.
Mic. 6
Left loudspeaker
Left headrest Loudspeaker of Zone 6 (Lsp. 8) to Standard Car Microphone 6 (Mic. 6)

Download impulse response (in ".fir" format).
In the download section you can download all impulse response files as well as format explanation and Matlab as well as Python code examples for loading fir files.
Right loudspeaker
Right headrest Loudspeaker of Zone 6 (Lsp. 9) to Standard Car Microphone 6 (Mic. 6)
Download impulse response (in ".fir" format).
In the download section you can download all impulse response files as well as format explanation and Matlab as well as Python code examples for loading fir files.
Mic. 7
Left loudspeaker
Left headrest Loudspeaker of Zone 6 (Lsp. 8) to Standard Car Microphone 7 (Mic. 7)
Download impulse response (in ".fir" format).
In the download section you can download all impulse response files as well as format explanation and Matlab as well as Python code examples for loading fir files.
Right loudspeaker
Right headrest Loudspeaker of Zone 6 (Lsp. 9) to Standard Car Microphone 7 (Mic. 7)
Download impulse response (in ".fir" format).
In the download section you can download all impulse response files as well as format explanation and Matlab as well as Python code examples for loading fir files.
Mic. 8
Left loudspeaker
Left headrest Loudspeaker of Zone 6 (Lsp. 8) to Standard Car Microphone 8 (Mic. 8)
Download impulse response (in ".fir" format).
In the download section you can download all impulse response files as well as format explanation and Matlab as well as Python code examples for loading fir files.
Right loudspeaker
Right headrest Loudspeaker of Zone 6 (Lsp. 9) to Standard Car Microphone 8 (Mic. 8)
Download impulse response (in ".fir" format).
In the download section you can download all impulse response files as well as format explanation and Matlab as well as Python code examples for loading fir files.
Mic. 9
Left loudspeaker
Left headrest Loudspeaker of Zone 6 (Lsp. 8) to Standard Car Microphone 9 (Mic. 9)
Download impulse response (in ".fir" format).
In the download section you can download all impulse response files as well as format explanation and Matlab as well as Python code examples for loading fir files.
Right loudspeaker
Right headrest Loudspeaker of Zone 6 (Lsp. 9) to Standard Car Microphone 9 (Mic. 9)
Download impulse response (in ".fir" format).
In the download section you can download all impulse response files as well as format explanation and Matlab as well as Python code examples for loading fir files.
Mic. 10
Left loudspeaker
Left headrest Loudspeaker of Zone 6 (Lsp. 8) to Standard Car Microphone 10 (Mic. 10)

Download impulse response (in ".fir" format).
In the download section you can download all impulse response files as well as format explanation and Matlab as well as Python code examples for loading fir files.
Right loudspeaker
Right headrest Loudspeaker of Zone 6 (Lsp. 9) to Standard Car Microphone 10 (Mic. 10)
Download impulse response (in ".fir" format).
In the download section you can download all impulse response files as well as format explanation and Matlab as well as Python code examples for loading fir files.
Mic. 11
Left loudspeaker
Left headrest Loudspeaker of Zone 6 (Lsp. 8) to Standard Car Microphone 11 (Mic. 11)
Download impulse response (in ".fir" format).
In the download section you can download all impulse response files as well as format explanation and Matlab as well as Python code examples for loading fir files.
Right loudspeaker
Right headrest Loudspeaker of Zone 6 (Lsp. 9) to Standard Car Microphone 11 (Mic. 11)
Download impulse response (in ".fir" format).
In the download section you can download all impulse response files as well as format explanation and Matlab as well as Python code examples for loading fir files.
Mic. 12
Left loudspeaker
Left headrest Loudspeaker of Zone 6 (Lsp. 8) to Standard Car Microphone 12 (Mic. 12)
Download impulse response (in ".fir" format).
In the download section you can download all impulse response files as well as format explanation and Matlab as well as Python code examples for loading fir files.
Right loudspeaker
Right headrest Loudspeaker of Zone 6 (Lsp. 9) to Standard Car Microphone 12 (Mic. 12)
Download impulse response (in ".fir" format).
In the download section you can download all impulse response files as well as format explanation and Matlab as well as Python code examples for loading fir files.
Mic. 13
Left loudspeaker
Left headrest Loudspeaker of Zone 6 (Lsp. 8) to Standard Car Microphone 13 (Mic. 13)
Download impulse response (in ".fir" format).
In the download section you can download all impulse response files as well as format explanation and Matlab as well as Python code examples for loading fir files.
Right loudspeaker
Right headrest Loudspeaker of Zone 6 (Lsp. 9) to Standard Car Microphone 13 (Mic. 13)
Download impulse response (in ".fir" format).
In the download section you can download all impulse response files as well as format explanation and Matlab as well as Python code examples for loading fir files.
Mic. 14
Left loudspeaker
Left headrest Loudspeaker of Zone 6 (Lsp. 8) to Standard Car Microphone 14 (Mic. 14)
Download impulse response (in ".fir" format).
In the download section you can download all impulse response files as well as format explanation and Matlab as well as Python code examples for loading fir files.
Right loudspeaker
Right headrest Loudspeaker of Zone 6 (Lsp. 9) to Standard Car Microphone 14 (Mic. 14)

Download impulse response (in ".fir" format).
In the download section you can download all impulse response files as well as format explanation and Matlab as well as Python code examples for loading fir files.
Mic. 15
Left loudspeaker
Left headrest Loudspeaker of Zone 6 (Lsp. 8) to Standard Car Microphone 15 (Mic. 15)

Download impulse response (in ".fir" format).
In the download section you can download all impulse response files as well as format explanation and Matlab as well as Python code examples for loading fir files.
Right loudspeaker
Right headrest Loudspeaker of Zone 6 (Lsp. 9) to Standard Car Microphone 15 (Mic. 15)
Download impulse response (in ".fir" format).
In the download section you can download all impulse response files as well as format explanation and Matlab as well as Python code examples for loading fir files.
Mic. 16
Left loudspeaker
Left headrest Loudspeaker of Zone 6 (Lsp. 8) to Standard Car Microphone 16 (Mic. 16)
Download impulse response (in ".fir" format).
In the download section you can download all impulse response files as well as format explanation and Matlab as well as Python code examples for loading fir files.
Right loudspeaker
Right headrest Loudspeaker of Zone 6 (Lsp. 9) to Standard Car Microphone 16 (Mic. 16)
Download impulse response (in ".fir" format).
In the download section you can download all impulse response files as well as format explanation and Matlab as well as Python code examples for loading fir files.
Mic. 17
Left loudspeaker
Left headrest Loudspeaker of Zone 6 (Lsp. 8) to Standard Car Microphone 17 (Mic. 17)
Download impulse response (in ".fir" format).
In the download section you can download all impulse response files as well as format explanation and Matlab as well as Python code examples for loading fir files.
Right loudspeaker
Right headrest Loudspeaker of Zone 6 (Lsp. 9) to Standard Car Microphone 17 (Mic. 17)
Download impulse response (in ".fir" format).
In the download section you can download all impulse response files as well as format explanation and Matlab as well as Python code examples for loading fir files.
Mic. 18
Left loudspeaker
Left headrest Loudspeaker of Zone 6 (Lsp. 8) to Standard Car Microphone 18 (Mic. 18)

Download impulse response (in ".fir" format).
In the download section you can download all impulse response files as well as format explanation and Matlab as well as Python code examples for loading fir files.
Right loudspeaker
Right headrest Loudspeaker of Zone 6 (Lsp. 9) to Standard Car Microphone 18 (Mic. 18)
Download impulse response (in ".fir" format).
In the download section you can download all impulse response files as well as format explanation and Matlab as well as Python code examples for loading fir files.
Lsps. 10/11
Mic. 0
Left loudspeaker
Left headrest Loudspeaker of Zone 8 (Lsp. 10) to Standard Car Microphone 0 (Mic. 0)
Download impulse response (in ".fir" format).
In the download section you can download all impulse response files as well as format explanation and Matlab as well as Python code examples for loading fir files.
Right loudspeaker
Right headrest Loudspeaker of Zone 8 (Lsp. 11) to Standard Car Microphone 0 (Mic. 0)
Download impulse response (in ".fir" format).
In the download section you can download all impulse response files as well as format explanation and Matlab as well as Python code examples for loading fir files.
Mic. 1
Left loudspeaker
Left headrest Loudspeaker of Zone 8 (Lsp. 10) to Standard Car Microphone 1 (Mic. 1)
Download impulse response (in ".fir" format).
In the download section you can download all impulse response files as well as format explanation and Matlab as well as Python code examples for loading fir files.
Right loudspeaker
Right headrest Loudspeaker of Zone 8 (Lsp. 11) to Standard Car Microphone 1 (Mic. 1)
Download impulse response (in ".fir" format).
In the download section you can download all impulse response files as well as format explanation and Matlab as well as Python code examples for loading fir files.
Mic. 2
Left loudspeaker
Left headrest Loudspeaker of Zone 8 (Lsp. 10) to Standard Car Microphone 2 (Mic. 2)
Download impulse response (in ".fir" format).
In the download section you can download all impulse response files as well as format explanation and Matlab as well as Python code examples for loading fir files.
Right loudspeaker
Right headrest Loudspeaker of Zone 8 (Lsp. 11) to Standard Car Microphone 2 (Mic. 2)
Download impulse response (in ".fir" format).
In the download section you can download all impulse response files as well as format explanation and Matlab as well as Python code examples for loading fir files.
Mic. 3
Left loudspeaker
Left headrest Loudspeaker of Zone 8 (Lsp. 10) to Standard Car Microphone 3 (Mic. 3)
Download impulse response (in ".fir" format).
In the download section you can download all impulse response files as well as format explanation and Matlab as well as Python code examples for loading fir files.
Right loudspeaker
Right headrest Loudspeaker of Zone 8 (Lsp. 11) to Standard Car Microphone 3 (Mic. 3)
Download impulse response (in ".fir" format).
In the download section you can download all impulse response files as well as format explanation and Matlab as well as Python code examples for loading fir files.
Mic. 4
Left loudspeaker
Left headrest Loudspeaker of Zone 8 (Lsp. 10) to Standard Car Microphone 4 (Mic. 4)
Download impulse response (in ".fir" format).
In the download section you can download all impulse response files as well as format explanation and Matlab as well as Python code examples for loading fir files.
Right loudspeaker
Right headrest Loudspeaker of Zone 8 (Lsp. 11) to Standard Car Microphone 4 (Mic. 4)
Download impulse response (in ".fir" format).
In the download section you can download all impulse response files as well as format explanation and Matlab as well as Python code examples for loading fir files.
Mic. 5
Left loudspeaker
Left headrest Loudspeaker of Zone 8 (Lsp. 10) to Standard Car Microphone 5 (Mic. 5)
Download impulse response (in ".fir" format).
In the download section you can download all impulse response files as well as format explanation and Matlab as well as Python code examples for loading fir files.
Right loudspeaker
Right headrest Loudspeaker of Zone 8 (Lsp. 11) to Standard Car Microphone 5 (Mic. 5)
Download impulse response (in ".fir" format).
In the download section you can download all impulse response files as well as format explanation and Matlab as well as Python code examples for loading fir files.
Mic. 6
Left loudspeaker
Left headrest Loudspeaker of Zone 8 (Lsp. 10) to Standard Car Microphone 6 (Mic. 6)
Download impulse response (in ".fir" format).
In the download section you can download all impulse response files as well as format explanation and Matlab as well as Python code examples for loading fir files.
Right loudspeaker
Right headrest Loudspeaker of Zone 8 (Lsp. 11) to Standard Car Microphone 6 (Mic. 6)
Download impulse response (in ".fir" format).
In the download section you can download all impulse response files as well as format explanation and Matlab as well as Python code examples for loading fir files.
Mic. 7
Left loudspeaker
Left headrest Loudspeaker of Zone 8 (Lsp. 10) to Standard Car Microphone 7 (Mic. 7)
Download impulse response (in ".fir" format).
In the download section you can download all impulse response files as well as format explanation and Matlab as well as Python code examples for loading fir files.
Right loudspeaker
Right headrest Loudspeaker of Zone 8 (Lsp. 11) to Standard Car Microphone 7 (Mic. 7)
Download impulse response (in ".fir" format).
In the download section you can download all impulse response files as well as format explanation and Matlab as well as Python code examples for loading fir files.
Mic. 8
Left loudspeaker
Left headrest Loudspeaker of Zone 8 (Lsp. 10) to Standard Car Microphone 8 (Mic. 8)
Download impulse response (in ".fir" format).
In the download section you can download all impulse response files as well as format explanation and Matlab as well as Python code examples for loading fir files.
Right loudspeaker
Right headrest Loudspeaker of Zone 8 (Lsp. 11) to Standard Car Microphone 8 (Mic. 8)
Download impulse response (in ".fir" format).
In the download section you can download all impulse response files as well as format explanation and Matlab as well as Python code examples for loading fir files.
Mic. 9
Left loudspeaker
Left headrest Loudspeaker of Zone 8 (Lsp. 10) to Standard Car Microphone 9 (Mic. 9)
Download impulse response (in ".fir" format).
In the download section you can download all impulse response files as well as format explanation and Matlab as well as Python code examples for loading fir files.
Right loudspeaker
Right headrest Loudspeaker of Zone 8 (Lsp. 11) to Standard Car Microphone 9 (Mic. 9)
Download impulse response (in ".fir" format).
In the download section you can download all impulse response files as well as format explanation and Matlab as well as Python code examples for loading fir files.
Mic. 10
Left loudspeaker
Left headrest Loudspeaker of Zone 8 (Lsp. 10) to Standard Car Microphone 10 (Mic. 10)
Download impulse response (in ".fir" format).
In the download section you can download all impulse response files as well as format explanation and Matlab as well as Python code examples for loading fir files.
Right loudspeaker
Right headrest Loudspeaker of Zone 8 (Lsp. 11) to Standard Car Microphone 10 (Mic. 10)
Download impulse response (in ".fir" format).
In the download section you can download all impulse response files as well as format explanation and Matlab as well as Python code examples for loading fir files.
Mic. 11
Left loudspeaker
Left headrest Loudspeaker of Zone 8 (Lsp. 10) to Standard Car Microphone 11 (Mic. 11)
Download impulse response (in ".fir" format).
In the download section you can download all impulse response files as well as format explanation and Matlab as well as Python code examples for loading fir files.
Right loudspeaker
Right headrest Loudspeaker of Zone 8 (Lsp. 11) to Standard Car Microphone 11 (Mic. 11)
Download impulse response (in ".fir" format).
In the download section you can download all impulse response files as well as format explanation and Matlab as well as Python code examples for loading fir files.
Mic. 12
Left loudspeaker
Left headrest Loudspeaker of Zone 8 (Lsp. 10) to Standard Car Microphone 12 (Mic. 12)
Download impulse response (in ".fir" format).
In the download section you can download all impulse response files as well as format explanation and Matlab as well as Python code examples for loading fir files.
Right loudspeaker
Right headrest Loudspeaker of Zone 8 (Lsp. 11) to Standard Car Microphone 12 (Mic. 12)
Download impulse response (in ".fir" format).
In the download section you can download all impulse response files as well as format explanation and Matlab as well as Python code examples for loading fir files.
Mic. 13
Left loudspeaker
Left headrest Loudspeaker of Zone 8 (Lsp. 10) to Standard Car Microphone 13 (Mic. 13)
Download impulse response (in ".fir" format).
In the download section you can download all impulse response files as well as format explanation and Matlab as well as Python code examples for loading fir files.
Right loudspeaker
Right headrest Loudspeaker of Zone 8 (Lsp. 11) to Standard Car Microphone 13 (Mic. 13)

Download impulse response (in ".fir" format).
In the download section you can download all impulse response files as well as format explanation and Matlab as well as Python code examples for loading fir files.
Mic. 14
Left loudspeaker
Left headrest Loudspeaker of Zone 8 (Lsp. 10) to Standard Car Microphone 14 (Mic. 14)
Download impulse response (in ".fir" format).
In the download section you can download all impulse response files as well as format explanation and Matlab as well as Python code examples for loading fir files.
Right loudspeaker
Right headrest Loudspeaker of Zone 8 (Lsp. 11) to Standard Car Microphone 14 (Mic. 14)

Download impulse response (in ".fir" format).
In the download section you can download all impulse response files as well as format explanation and Matlab as well as Python code examples for loading fir files.
Mic. 15
Left loudspeaker
Left headrest Loudspeaker of Zone 8 (Lsp. 10) to Standard Car Microphone 15 (Mic. 15)

Download impulse response (in ".fir" format).
In the download section you can download all impulse response files as well as format explanation and Matlab as well as Python code examples for loading fir files.
Right loudspeaker
Right headrest Loudspeaker of Zone 8 (Lsp. 11) to Standard Car Microphone 15 (Mic. 15)
Download impulse response (in ".fir" format).
In the download section you can download all impulse response files as well as format explanation and Matlab as well as Python code examples for loading fir files.
Mic. 16
Left loudspeaker
Left headrest Loudspeaker of Zone 8 (Lsp. 10) to Standard Car Microphone 16 (Mic. 16)
Download impulse response (in ".fir" format).
In the download section you can download all impulse response files as well as format explanation and Matlab as well as Python code examples for loading fir files.
Right loudspeaker
Right headrest Loudspeaker of Zone 8 (Lsp. 11) to Standard Car Microphone 16 (Mic. 16)
Download impulse response (in ".fir" format).
In the download section you can download all impulse response files as well as format explanation and Matlab as well as Python code examples for loading fir files.
Mic. 17
Left loudspeaker
Left headrest Loudspeaker of Zone 8 (Lsp. 10) to Standard Car Microphone 17 (Mic. 17)
Download impulse response (in ".fir" format).
In the download section you can download all impulse response files as well as format explanation and Matlab as well as Python code examples for loading fir files.
Right loudspeaker
Right headrest Loudspeaker of Zone 8 (Lsp. 11) to Standard Car Microphone 17 (Mic. 17)
Download impulse response (in ".fir" format).
In the download section you can download all impulse response files as well as format explanation and Matlab as well as Python code examples for loading fir files.
Mic. 18
Left loudspeaker
Left headrest Loudspeaker of Zone 8 (Lsp. 10) to Standard Car Microphone 18 (Mic. 18)
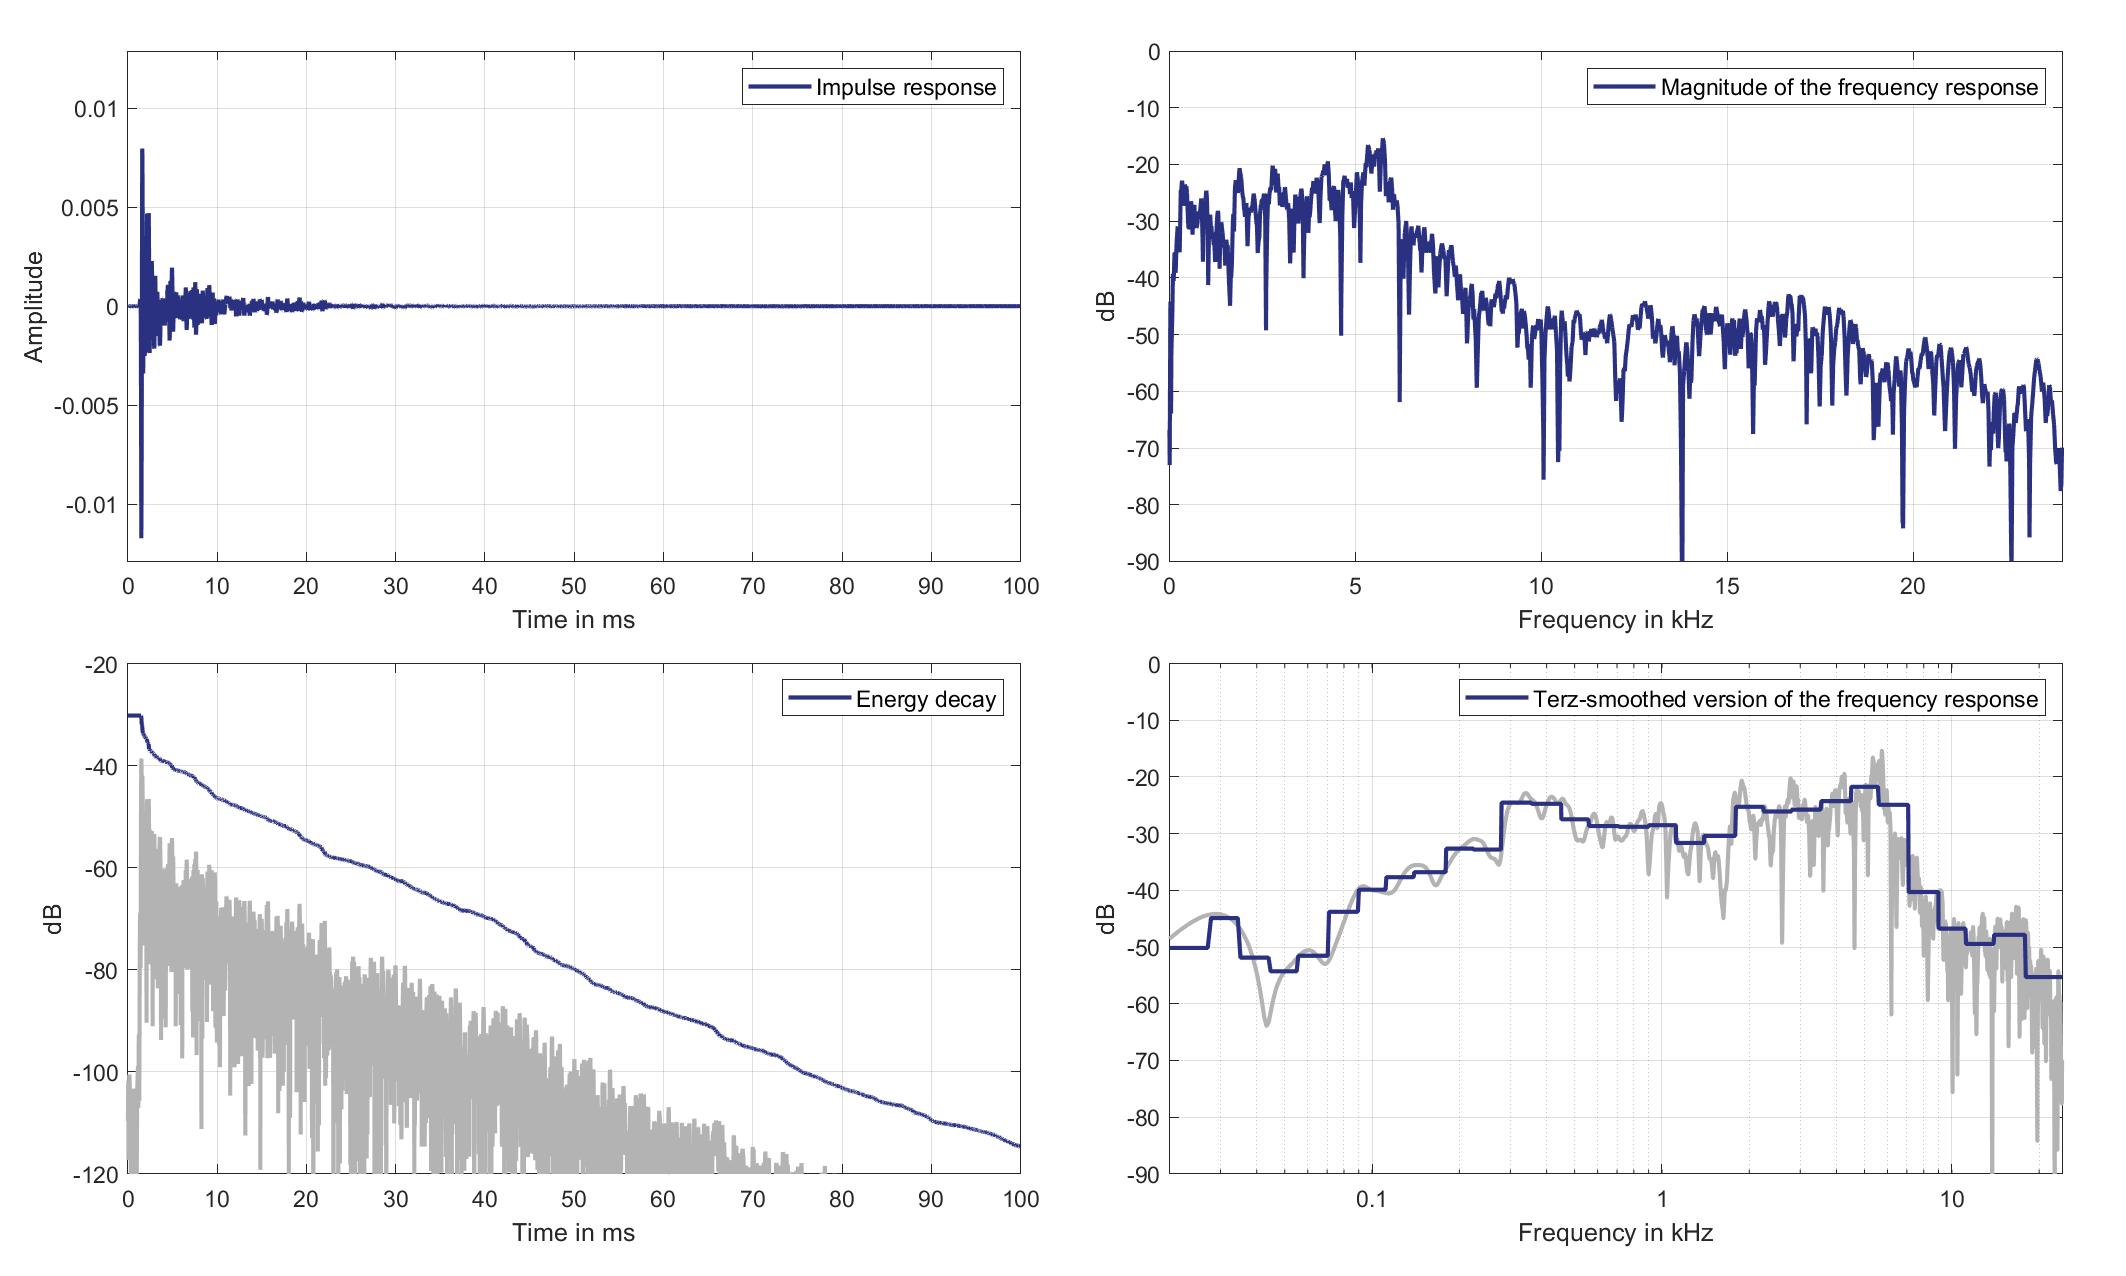
Download impulse response (in ".fir" format).
In the download section you can download all impulse response files as well as format explanation and Matlab as well as Python code examples for loading fir files.
Right loudspeaker
Right headrest Loudspeaker of Zone 8 (Lsp. 11) to Standard Car Microphone 18 (Mic. 18)
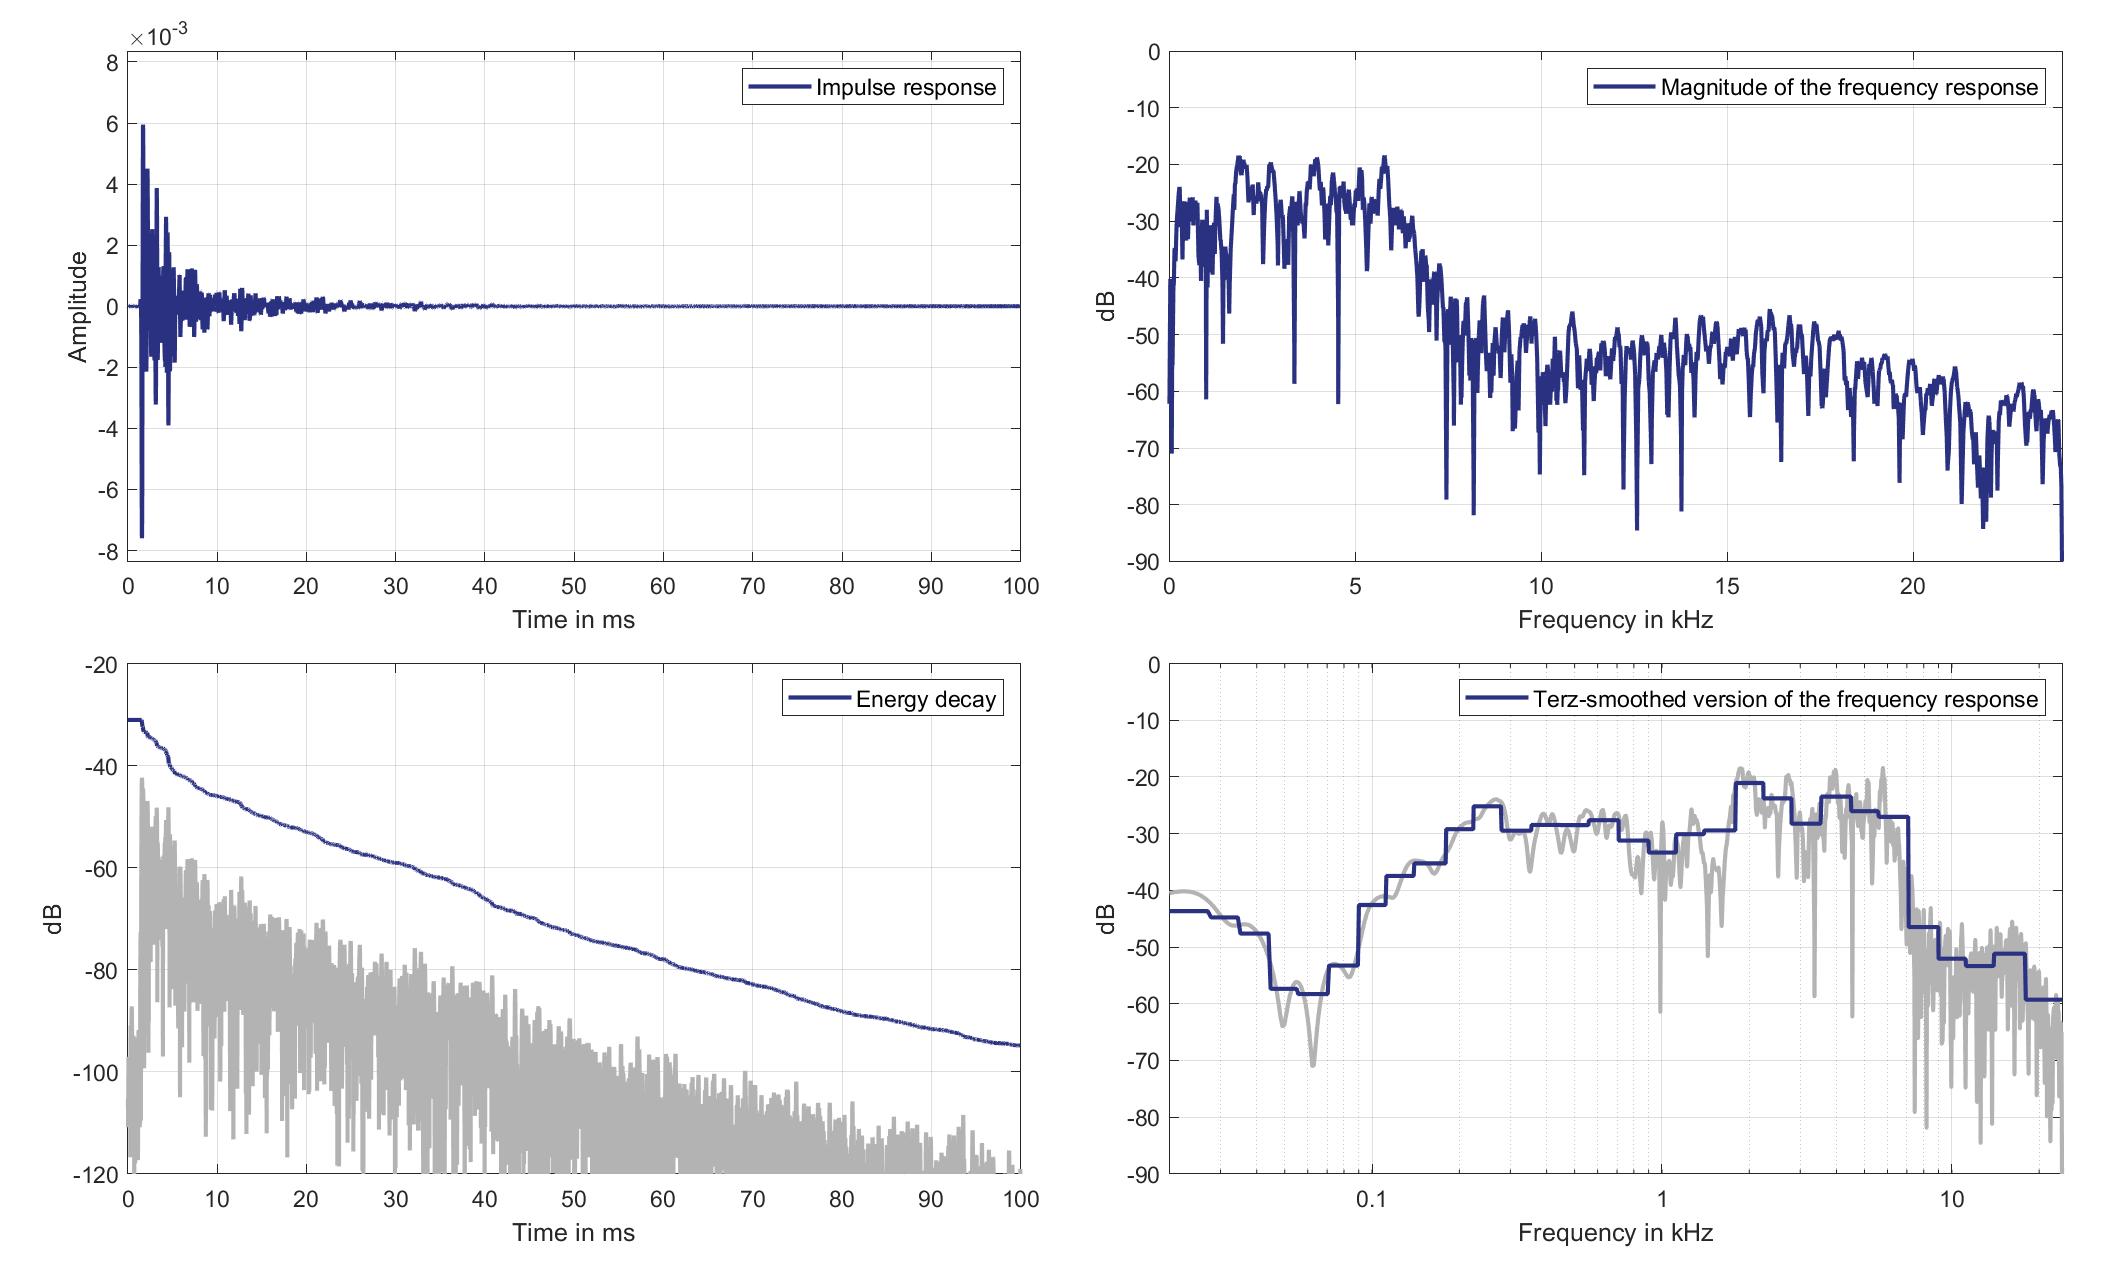
Download impulse response (in ".fir" format).
In the download section you can download all impulse response files as well as format explanation and Matlab as well as Python code examples for loading fir files.
Headrest Loudspeakers to Ear Microphones
Lsps. 0/1
Mics. 19/20
Left lsp. - left ear mic.
Left Headrest Loudspeaker of Zone 1 (Lsp. 0) to Left Ear Microphone of Zone 1 (Mic. 19)
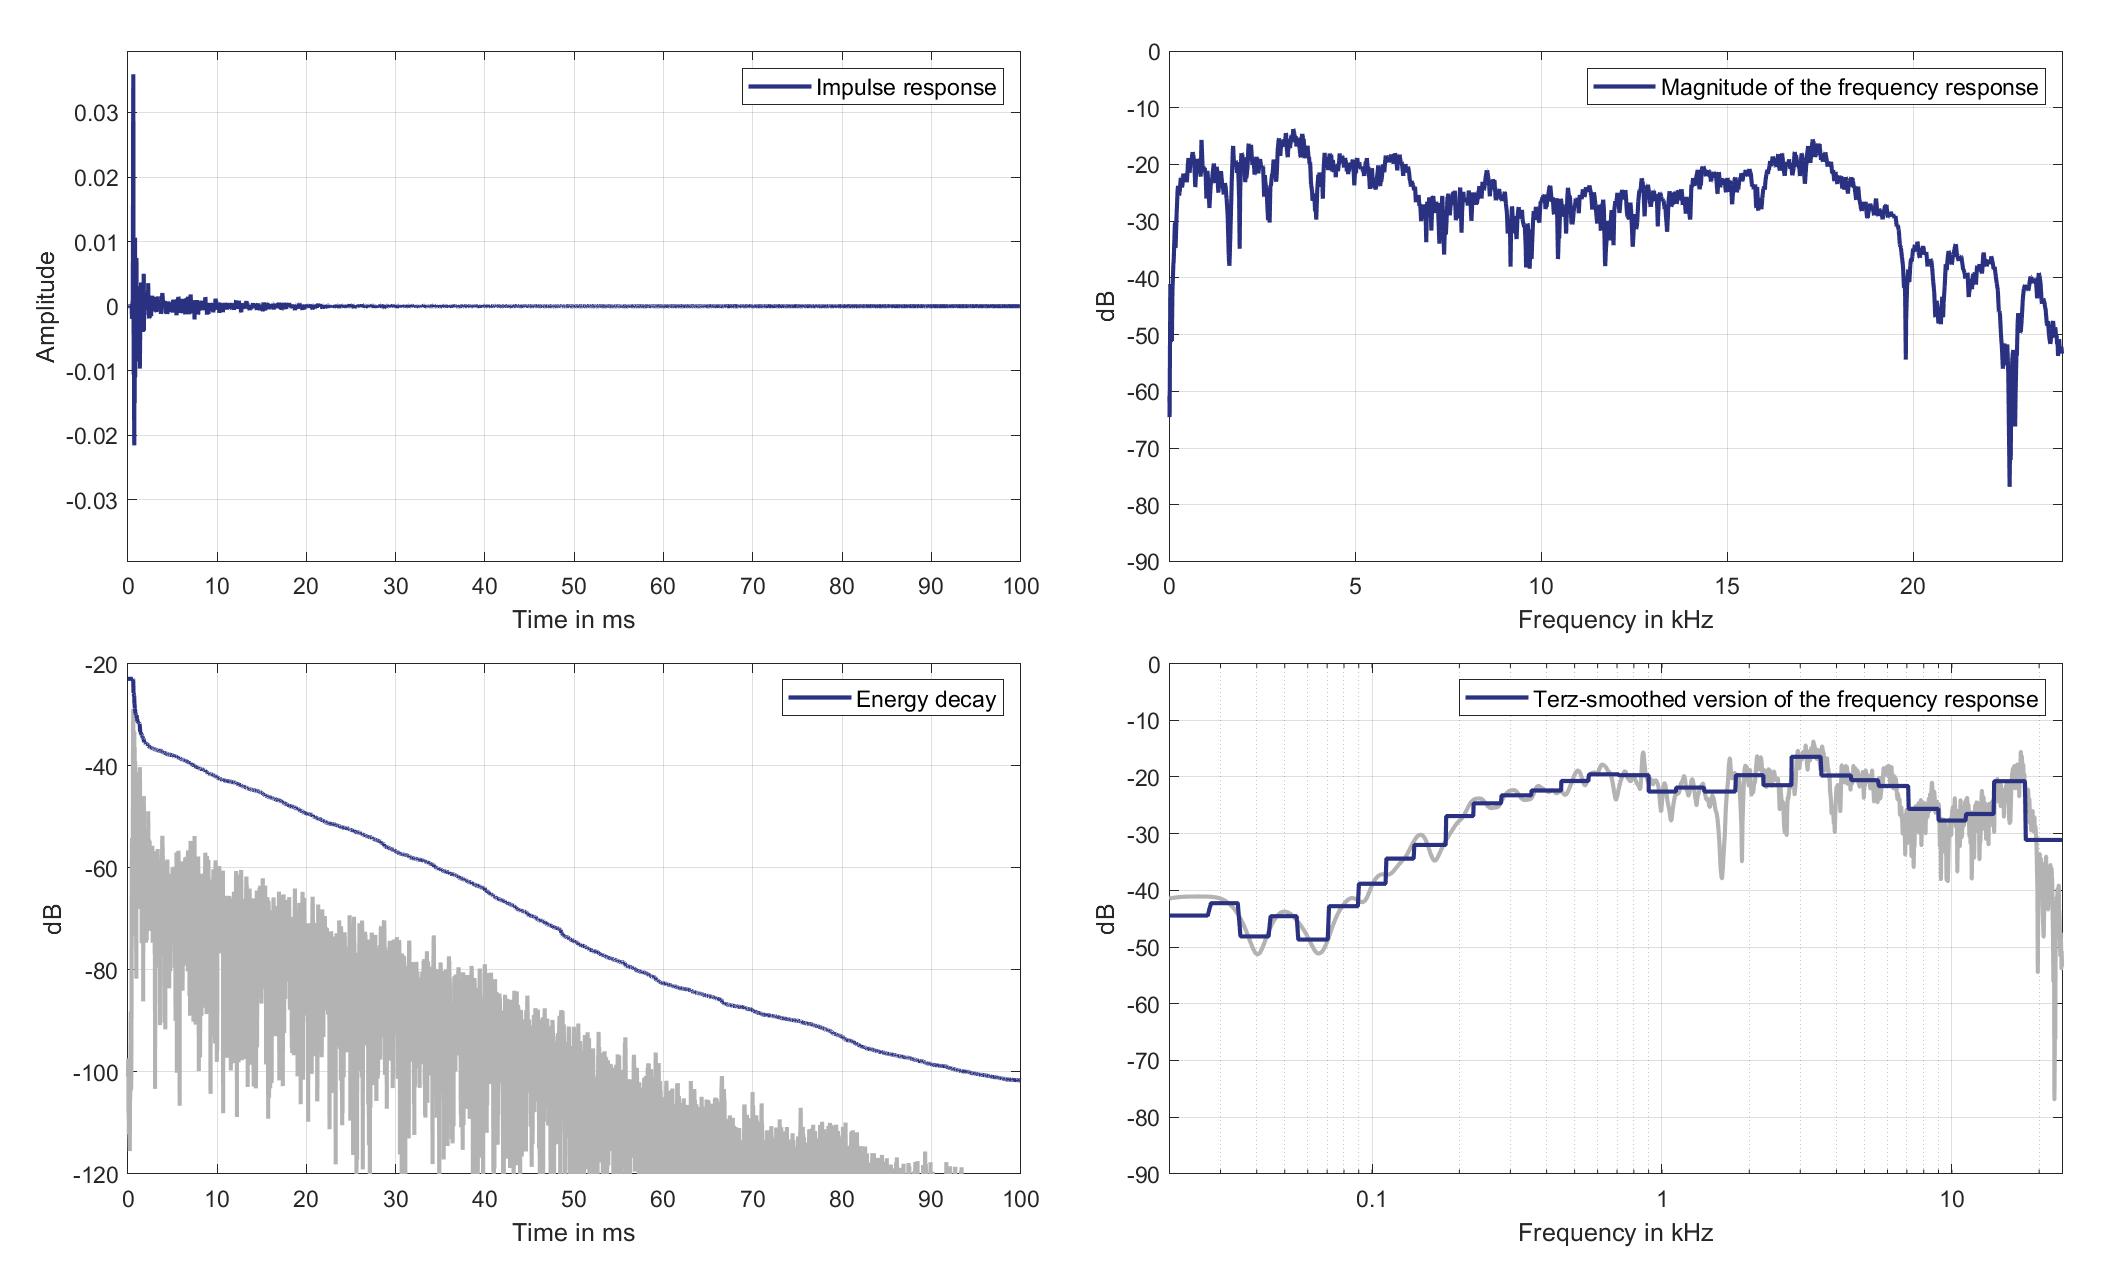
Download impulse response (in ".fir" format).
In the download section you can download all impulse response files as well as format explanation and Matlab as well as Python code examples for loading fir files.
Left lsp. - Right ear mic.
Left Headrest Loudspeaker of Zone 1 (Lsp. 0) to Right Ear Microphone of Zone 1 (Mic. 20)
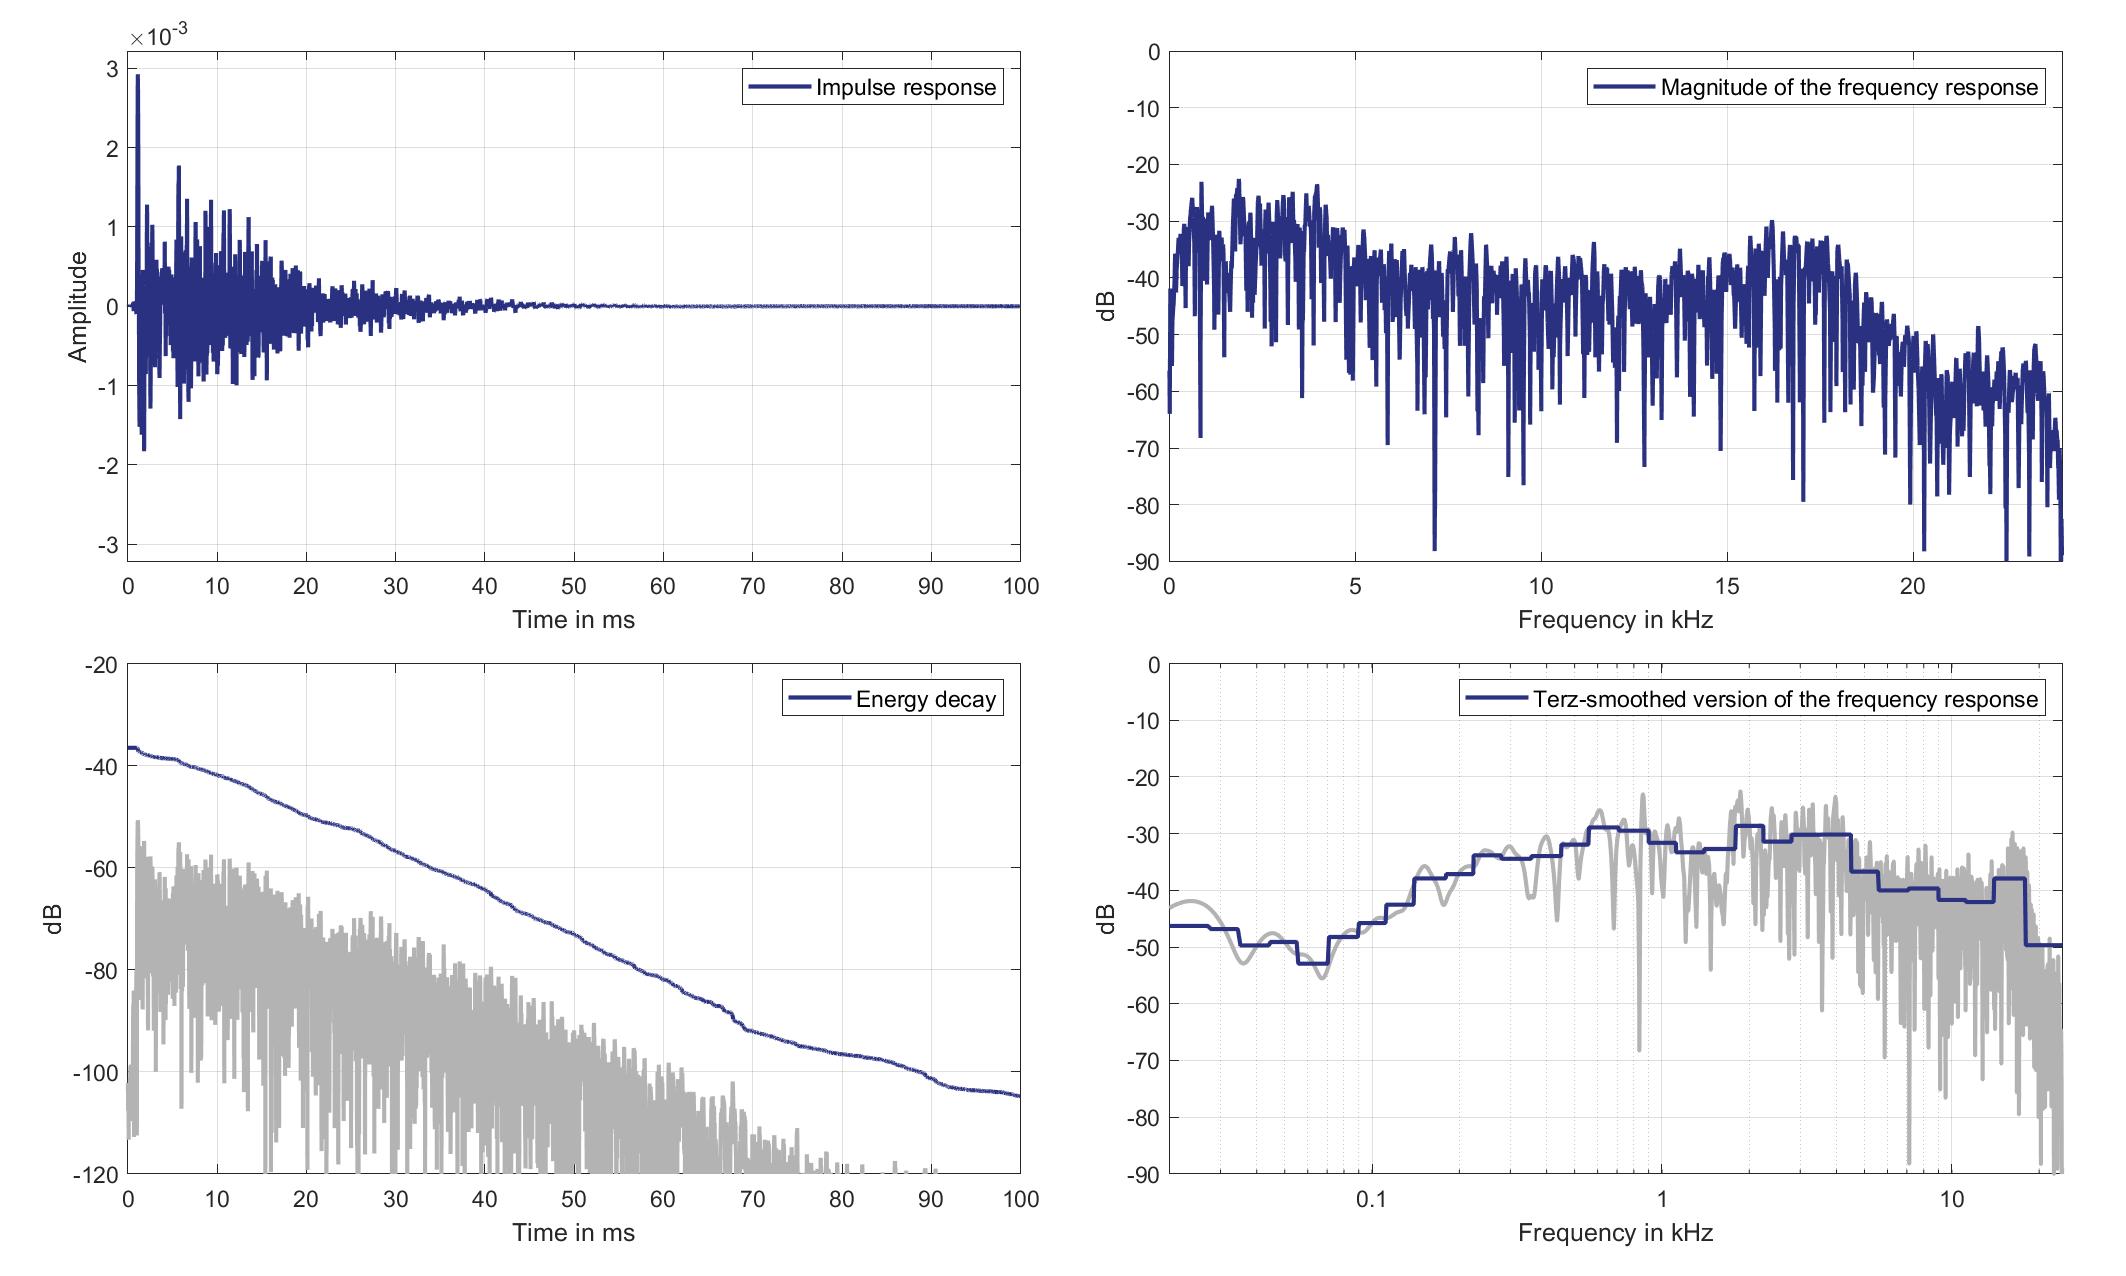
Download impulse response (in ".fir" format).
In the download section you can download all impulse response files as well as format explanation and Matlab as well as Python code examples for loading fir files.
Right lsp. - left ear mic.
Right Headrest Loudspeaker of Zone 1 (Lsp. 1) to Left Ear Microphone of Zone 1 (Mic. 19)
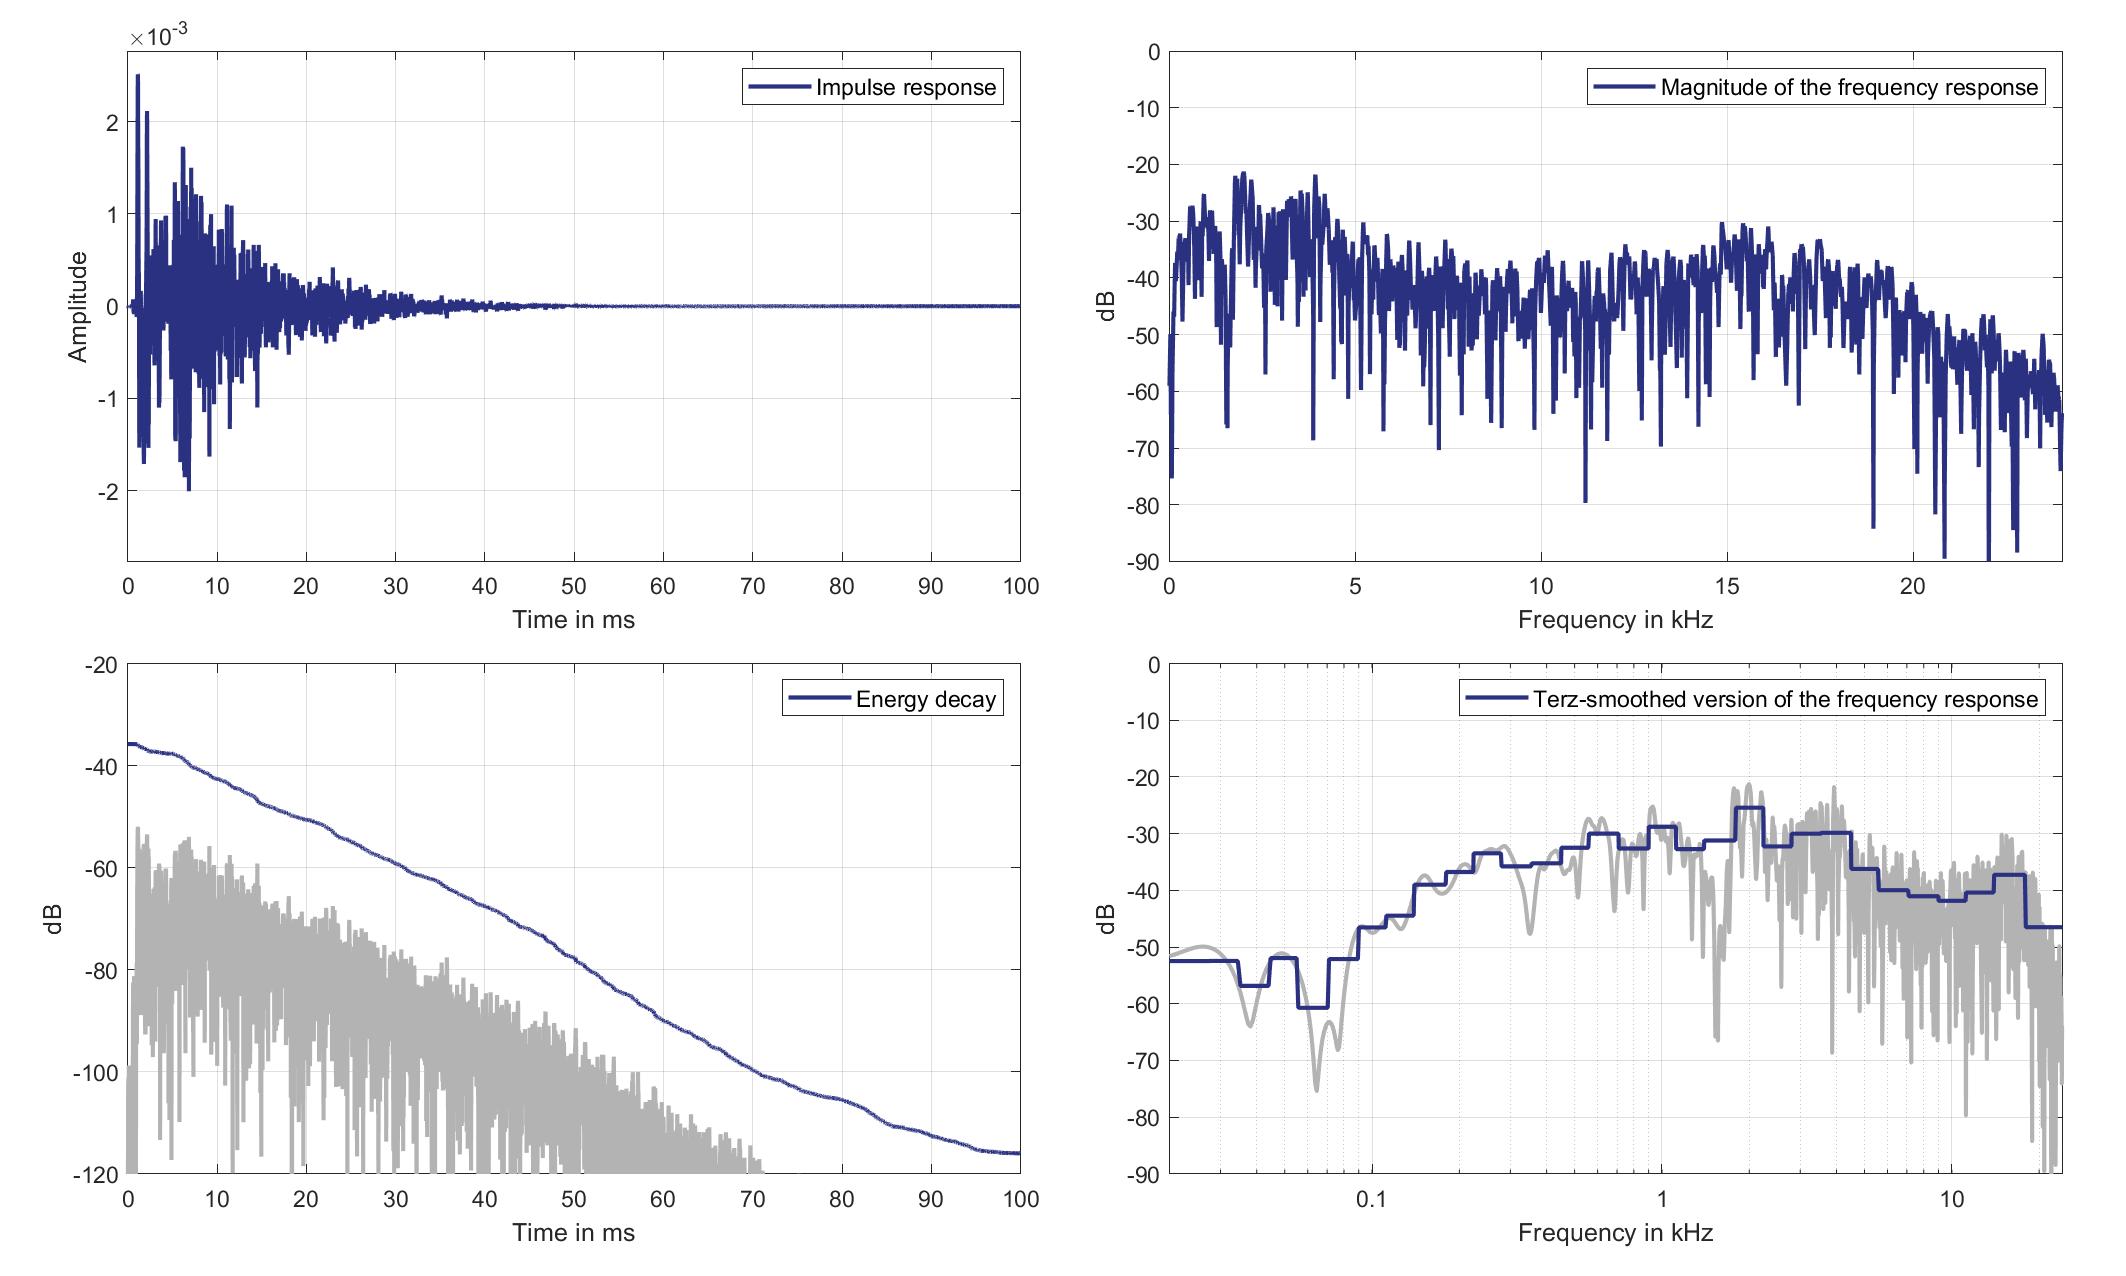
Download impulse response (in ".fir" format).
In the download section you can download all impulse response files as well as format explanation and Matlab as well as Python code examples for loading fir files.
Right lsp. - Right ear mic.
Right Headrest Loudspeaker of Zone 1 (Lsp. 1 to Right Ear Microphone of Zone 1 (Mic. 20)
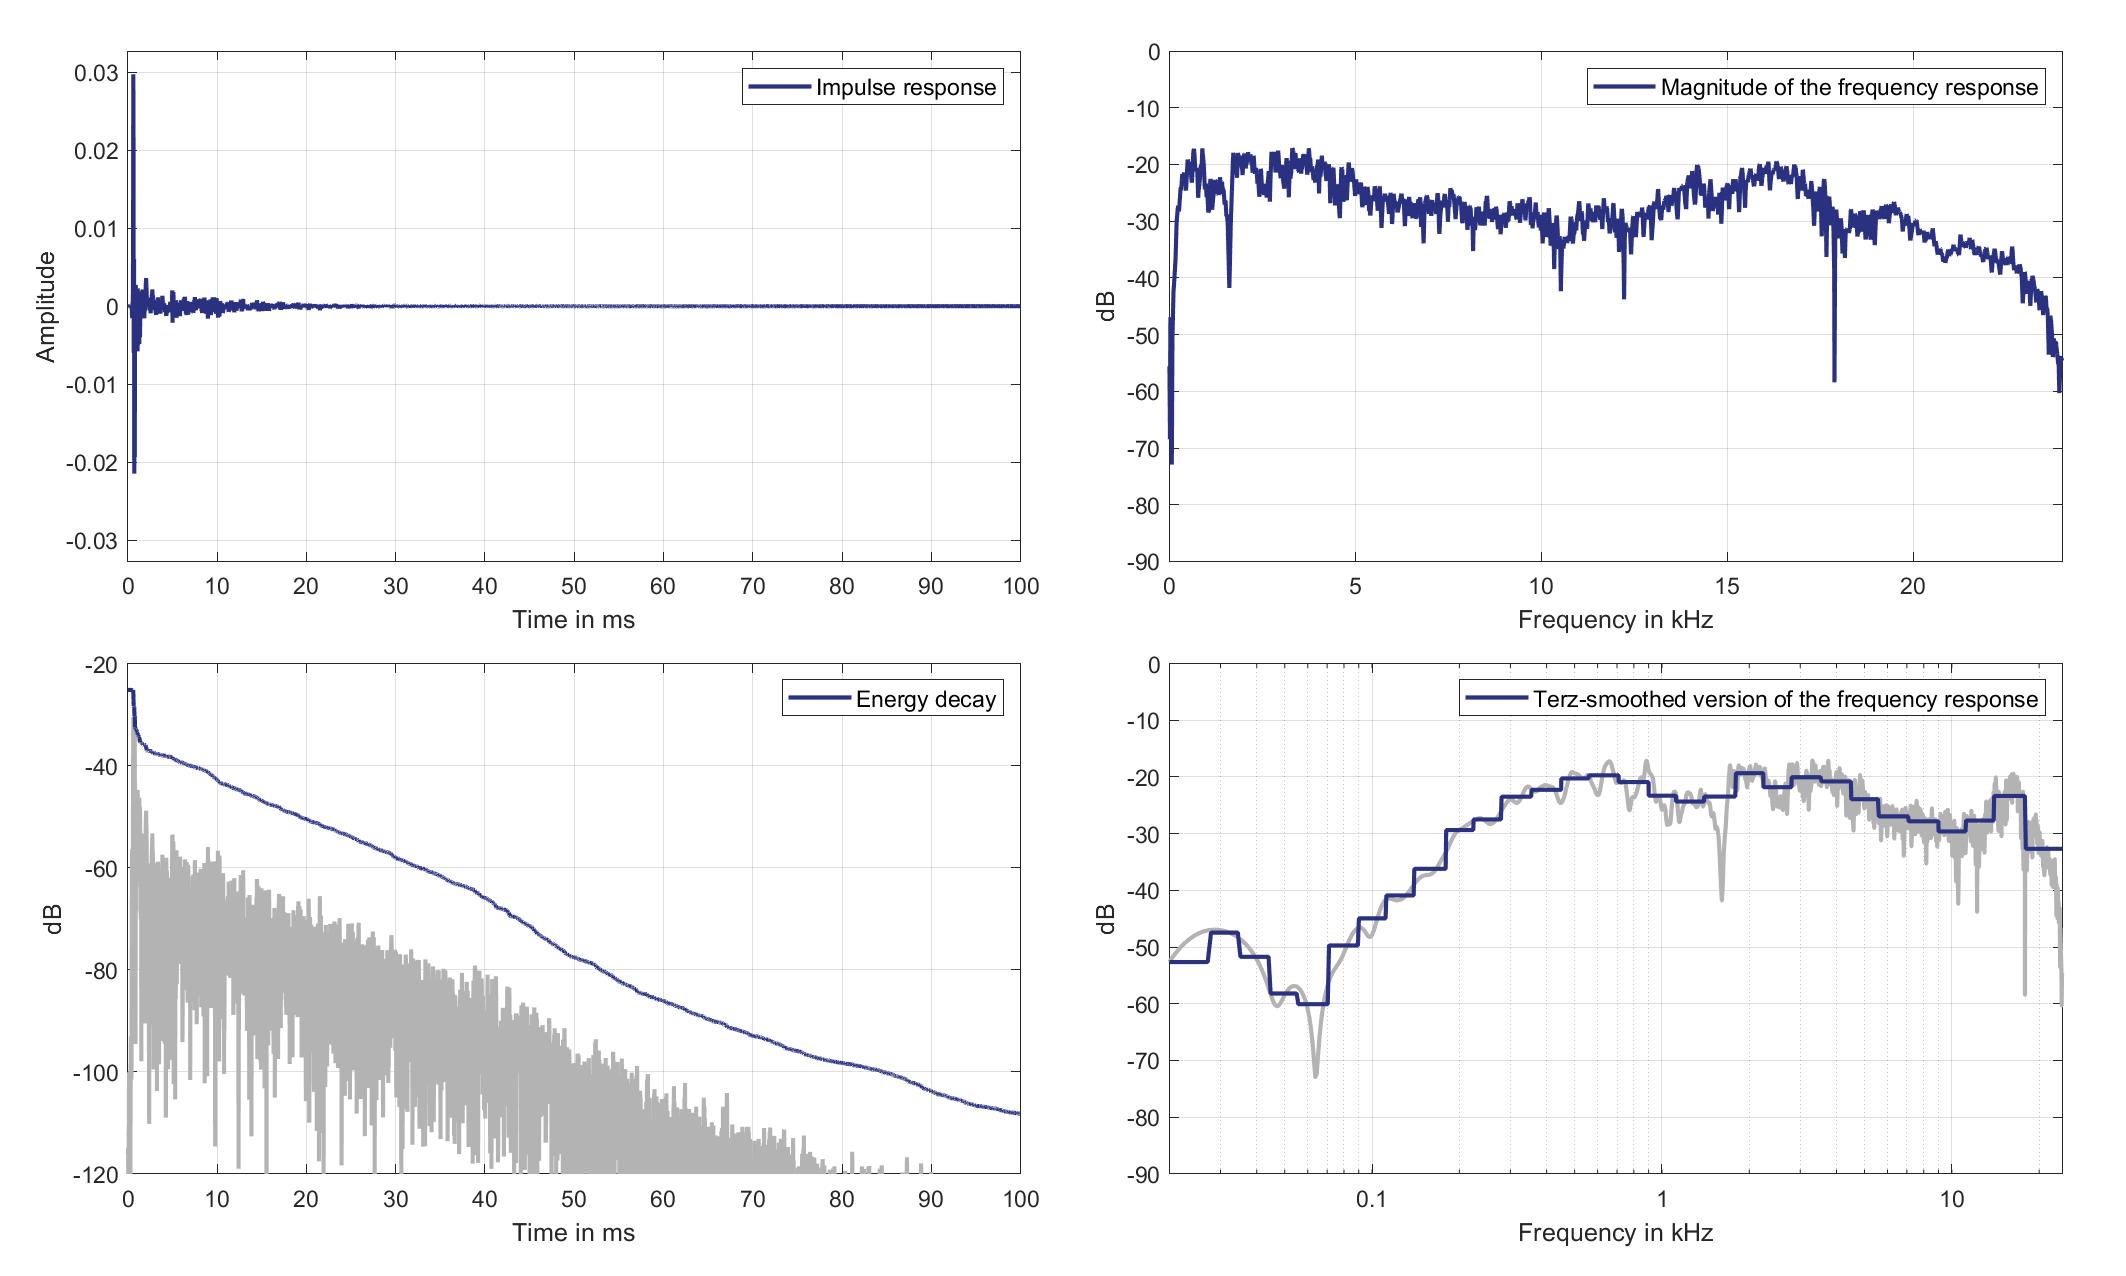
Download impulse response (in ".fir" format).
In the download section you can download all impulse response files as well as format explanation and Matlab as well as Python code examples for loading fir files.
Mics. 21/22
Left lsp. - left ear mic.
Left Headrest Loudspeaker of Zone 1 (Lsp. 0) to Left Ear Microphone of Zone 2 (Mic. 21)
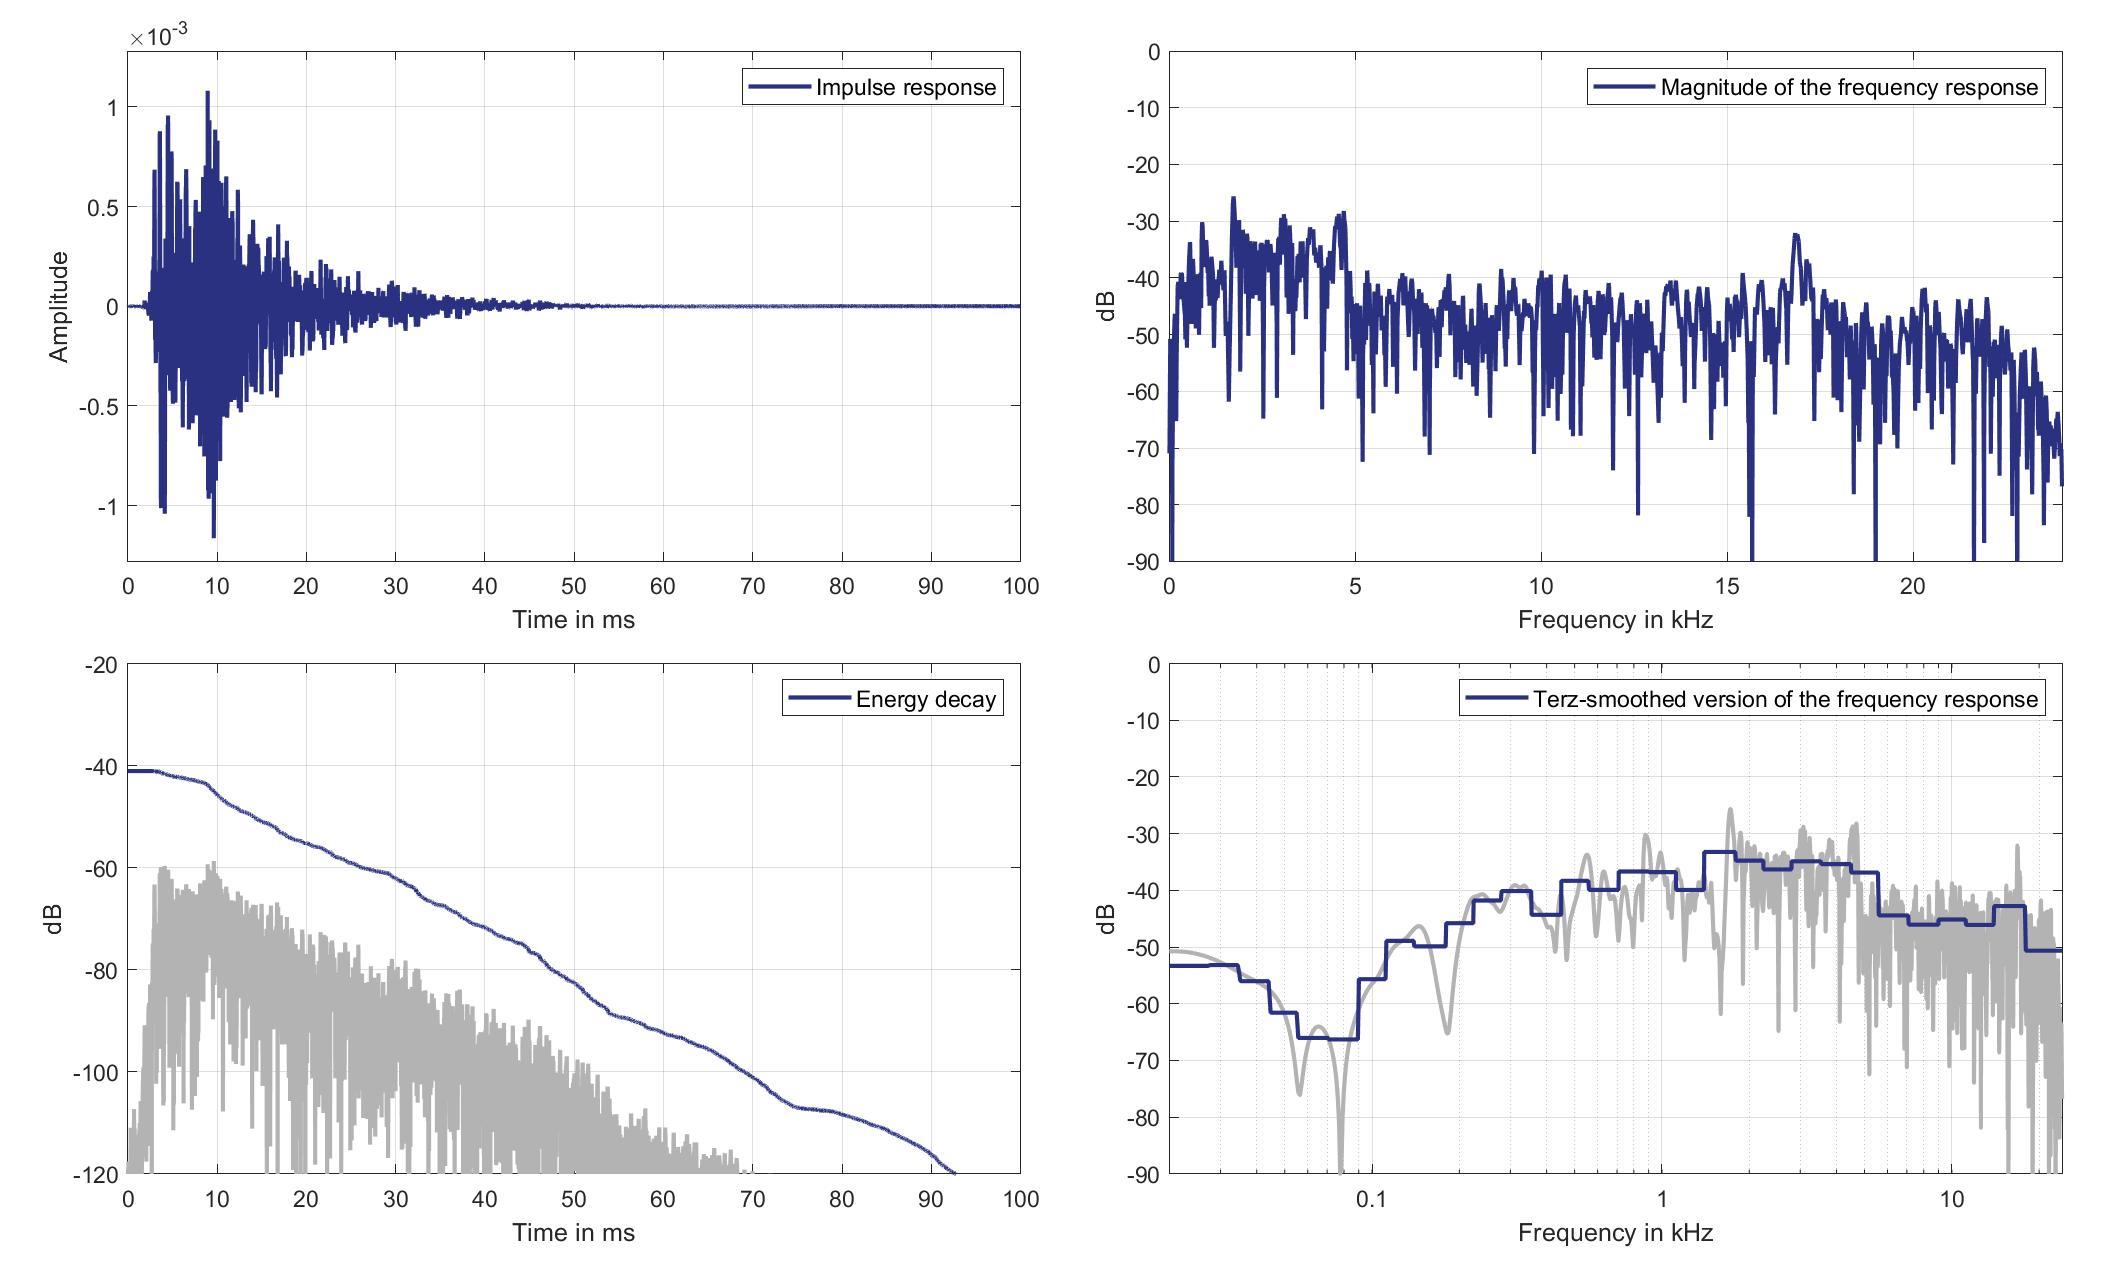
Download impulse response (in ".fir" format).
In the download section you can download all impulse response files as well as format explanation and Matlab as well as Python code examples for loading fir files.
Left lsp. - Right ear mic.
Left Headrest Loudspeaker of Zone 1 (Lsp. 0) to Right Ear Microphone of Zone 2 (Mic. 22)

Download impulse response (in ".fir" format).
In the download section you can download all impulse response files as well as format explanation and Matlab as well as Python code examples for loading fir files.
Right lsp. - left ear mic.
Right Headrest Loudspeaker of Zone 1 (Lsp. 1) to Left Ear Microphone of Zone 2 (Mic. 21)
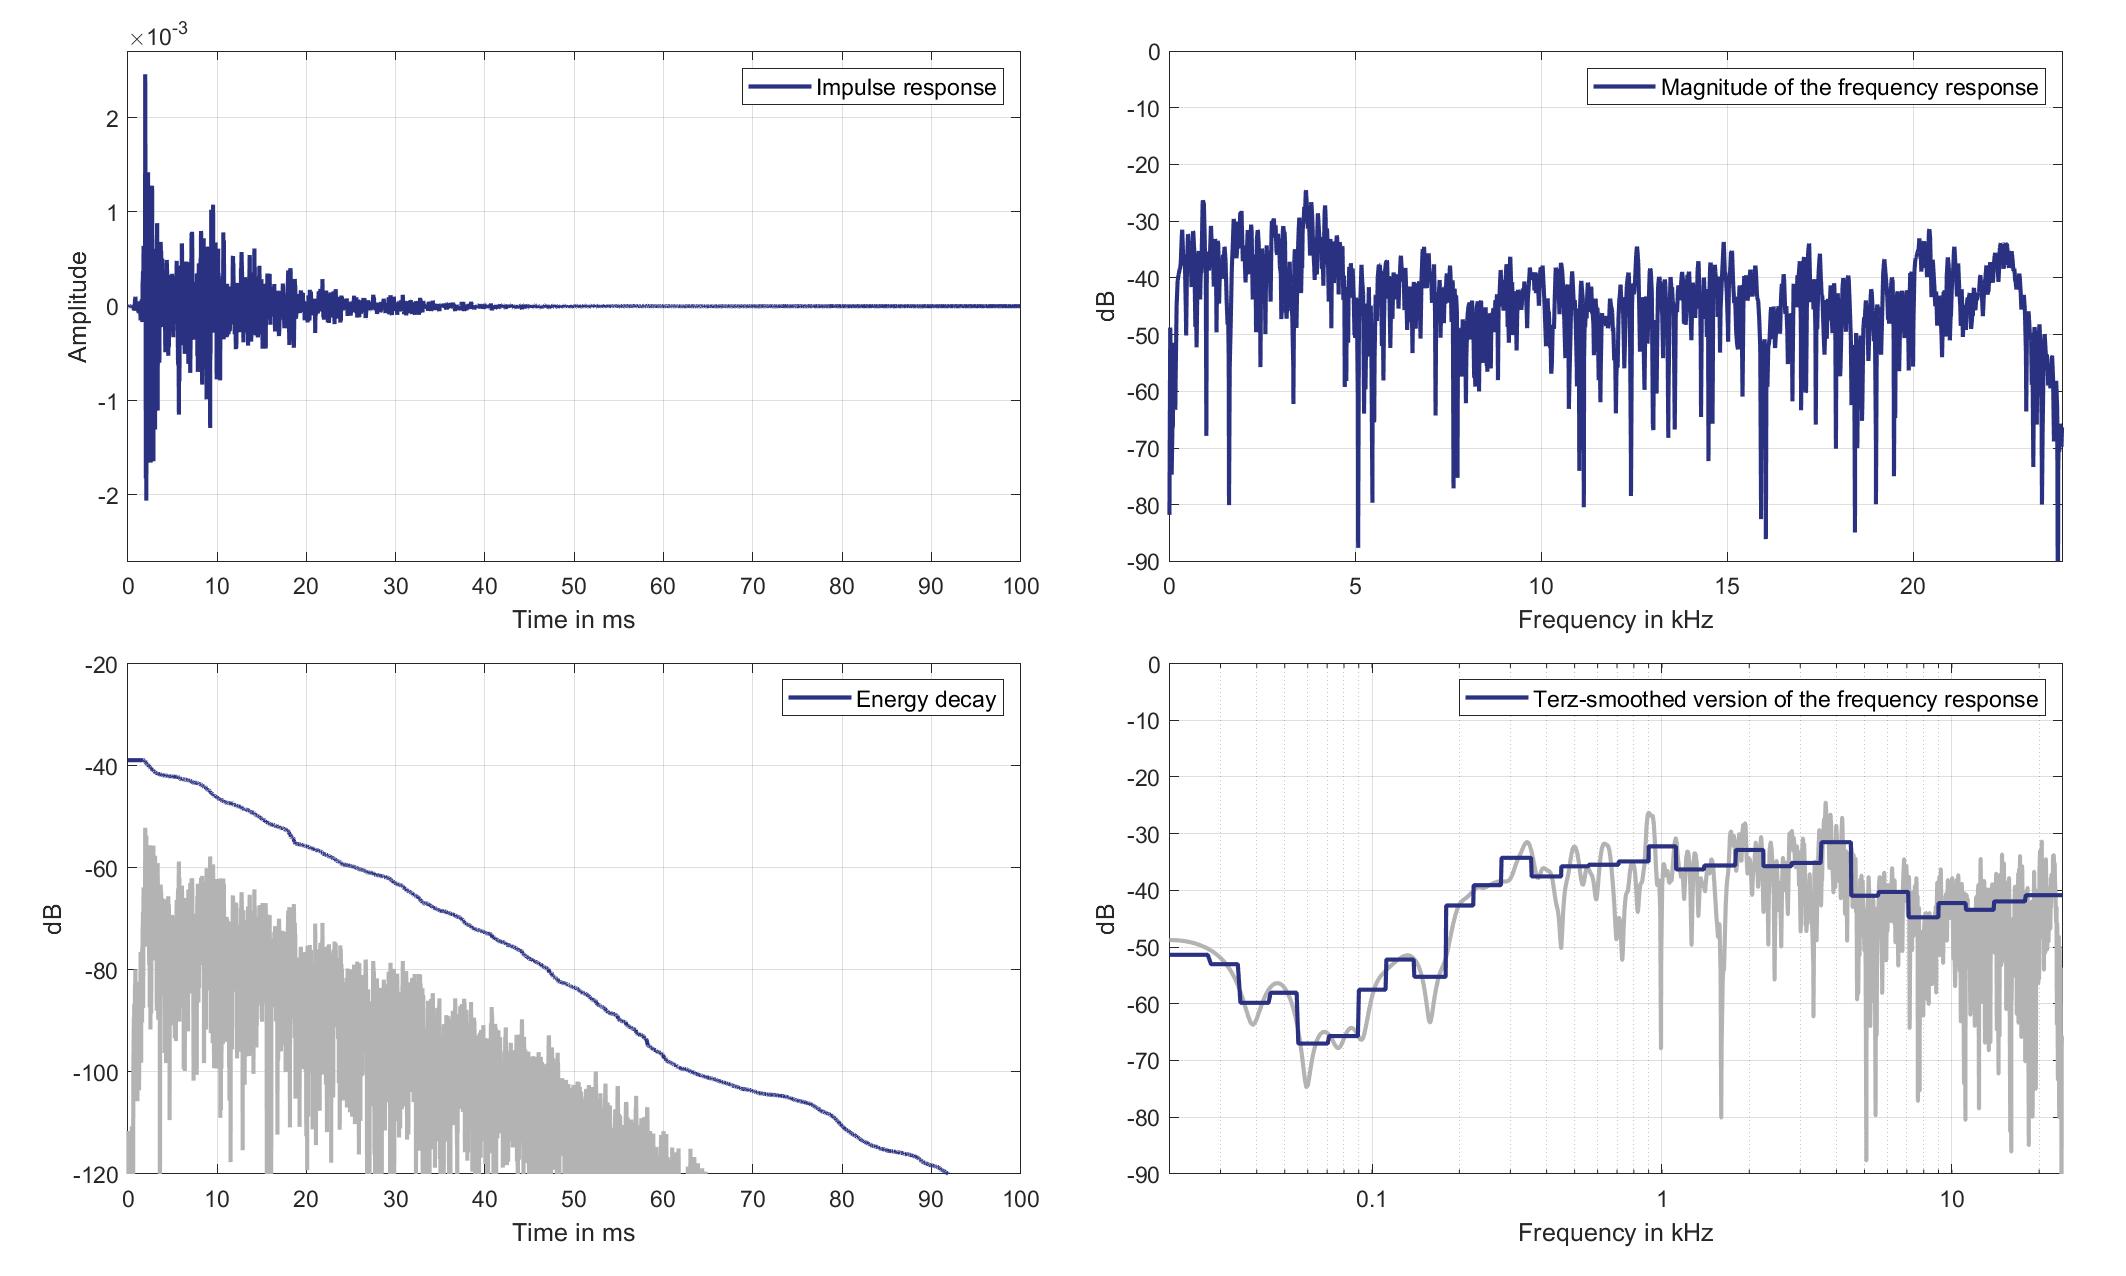
Download impulse response (in ".fir" format).
In the download section you can download all impulse response files as well as format explanation and Matlab as well as Python code examples for loading fir files.
Right lsp. - Right ear mic.
Right Headrest Loudspeaker of Zone 1 (Lsp. 1 to Right Ear Microphone of Zone 2 (Mic. 22)
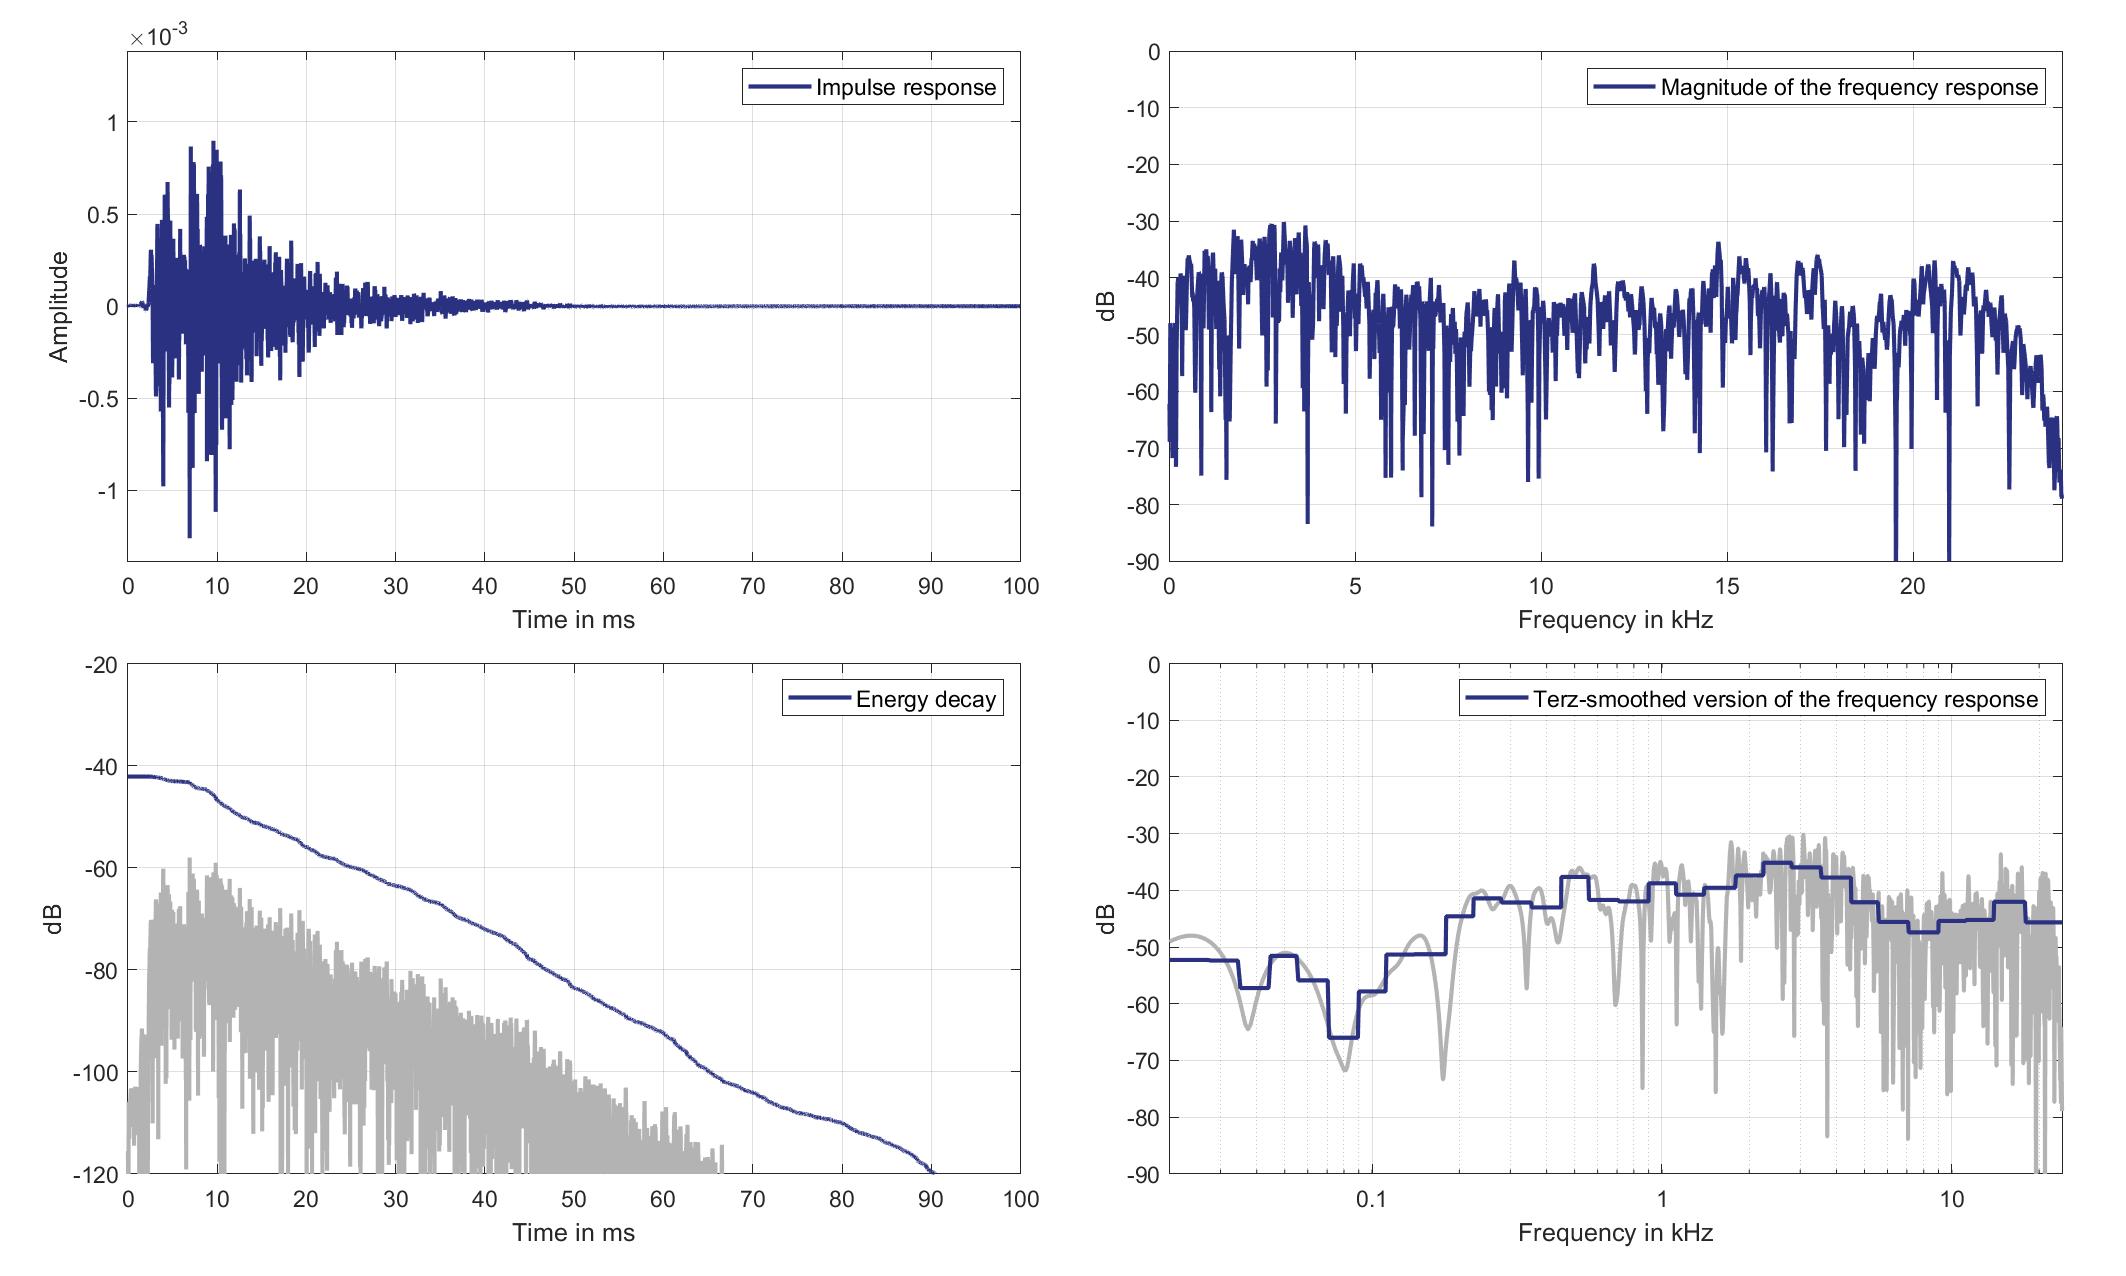
Download impulse response (in ".fir" format).
In the download section you can download all impulse response files as well as format explanation and Matlab as well as Python code examples for loading fir files.
Mics. 23/24
Left lsp. - left ear mic.
Left Headrest Loudspeaker of Zone 1 (Lsp. 0) to Left Ear Microphone of Zone 3 (Mic. 23)
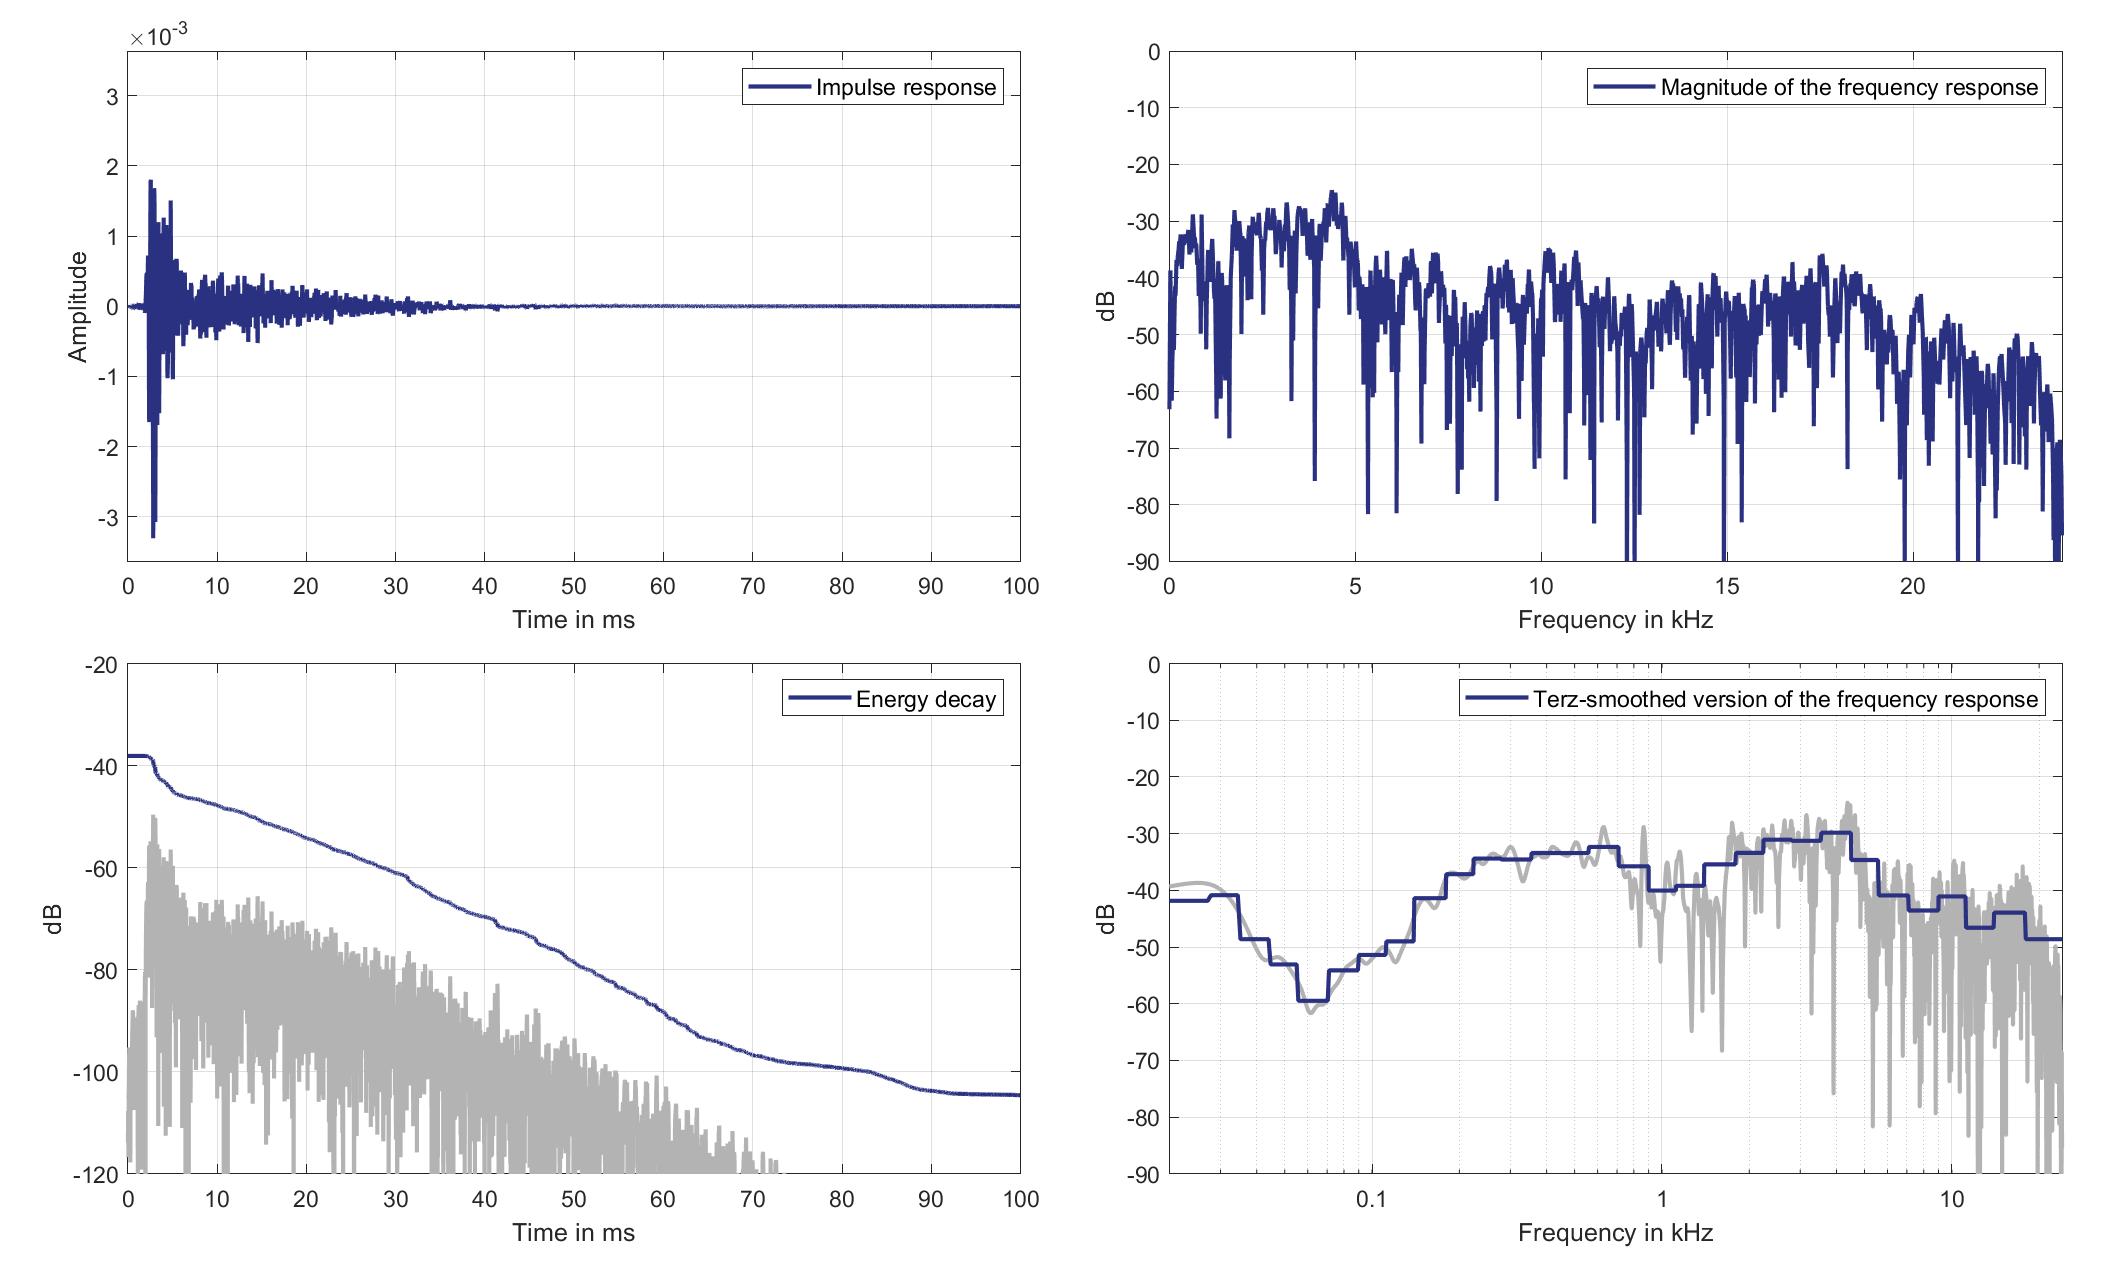
Download impulse response (in ".fir" format).
In the download section you can download all impulse response files as well as format explanation and Matlab as well as Python code examples for loading fir files.
Left lsp. - Right ear mic.
Left Headrest Loudspeaker of Zone 1 (Lsp. 0) to Right Ear Microphone of Zone 3 (Mic. 24)
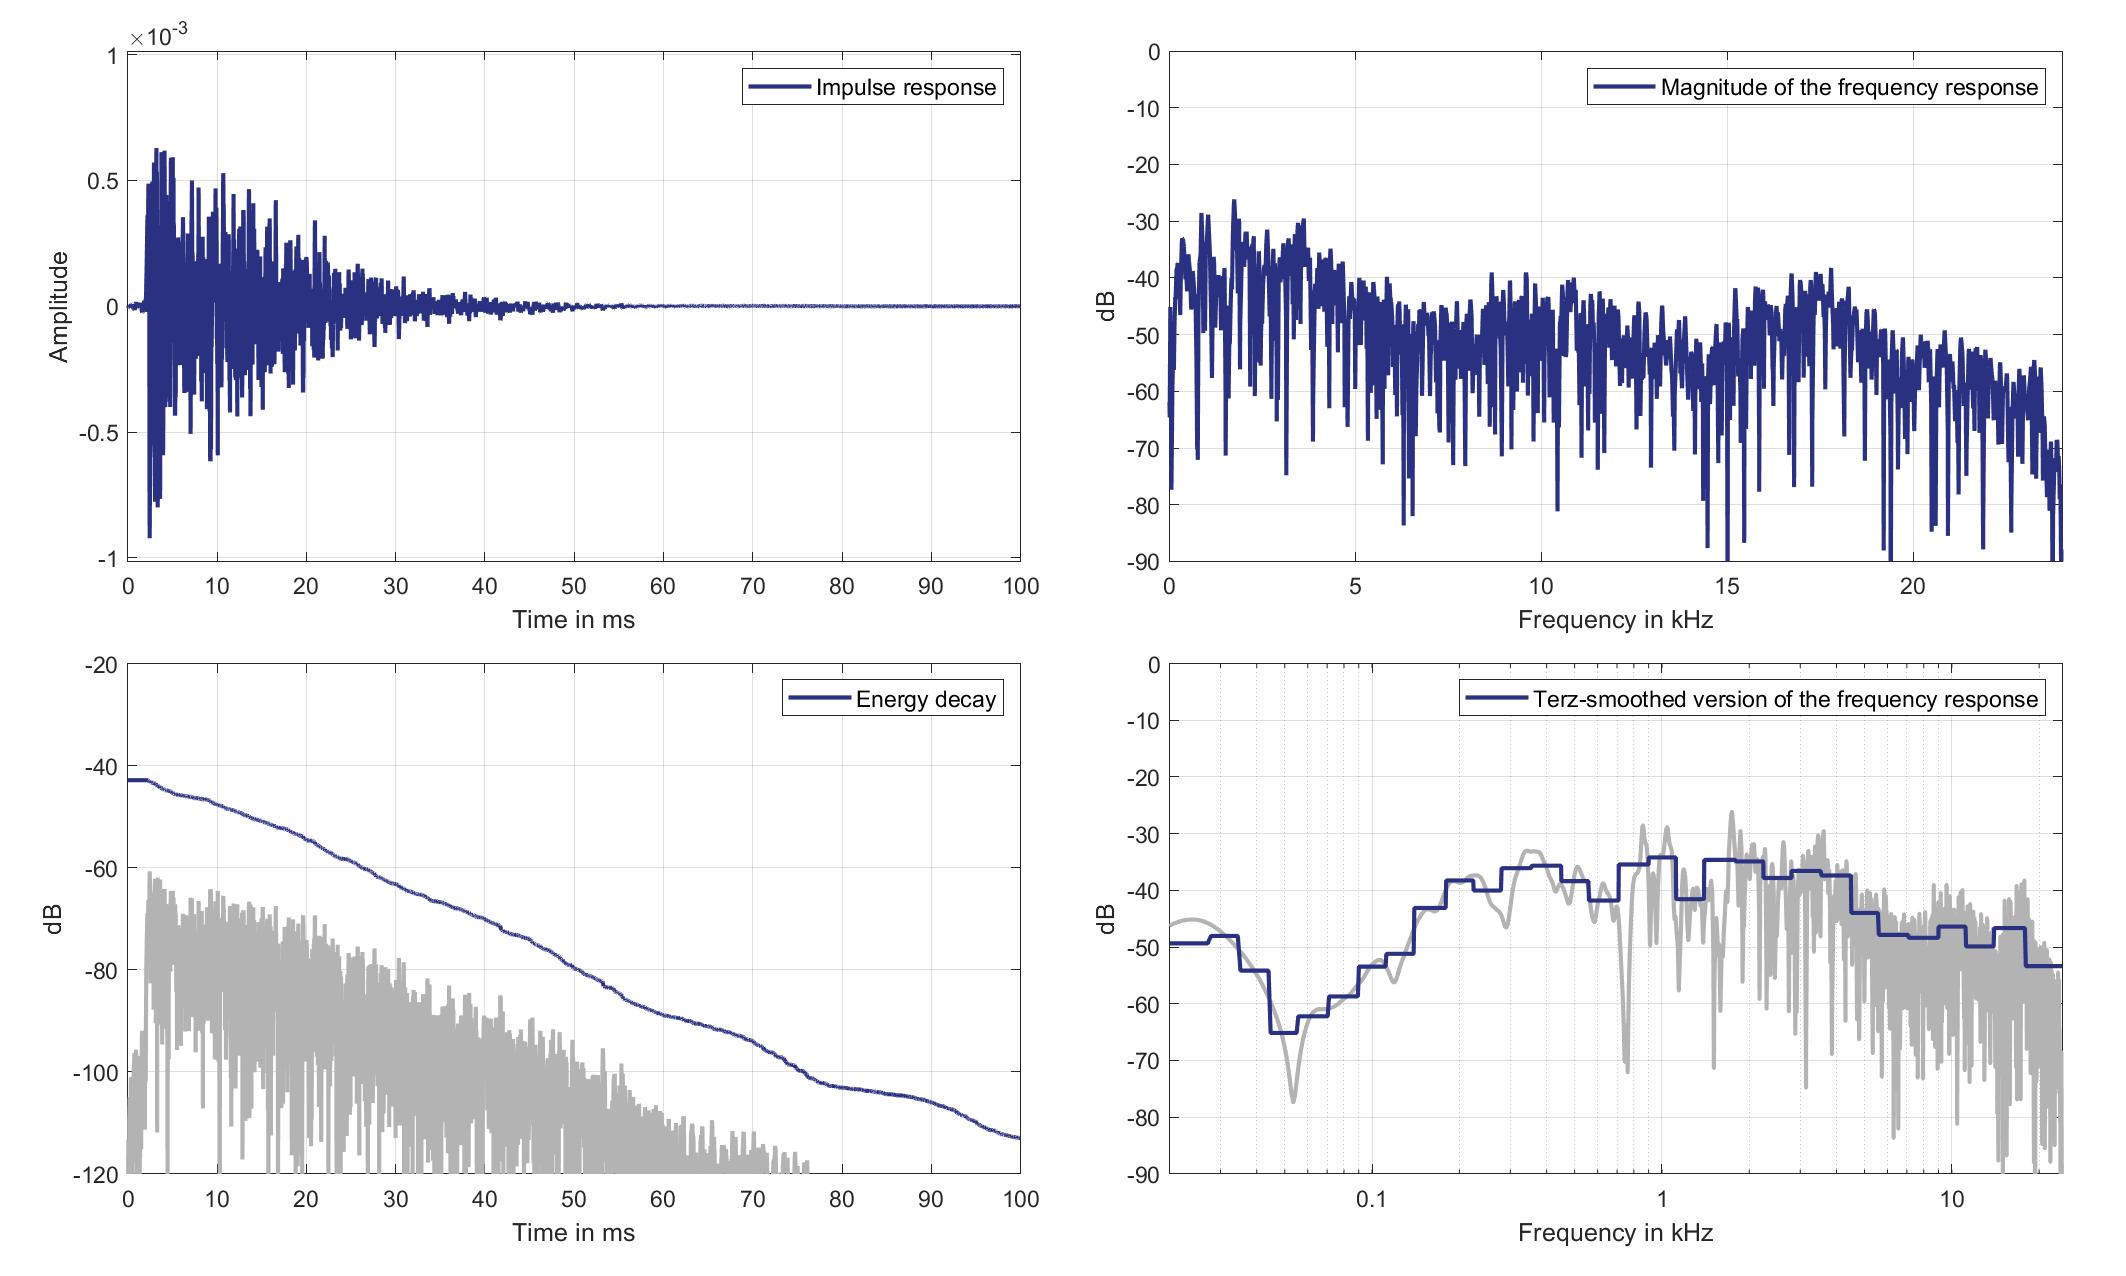
Download impulse response (in ".fir" format).
In the download section you can download all impulse response files as well as format explanation and Matlab as well as Python code examples for loading fir files.
Right lsp. - left ear mic.
Right Headrest Loudspeaker of Zone 1 (Lsp. 1) to Left Ear Microphone of Zone 3 (Mic. 23)
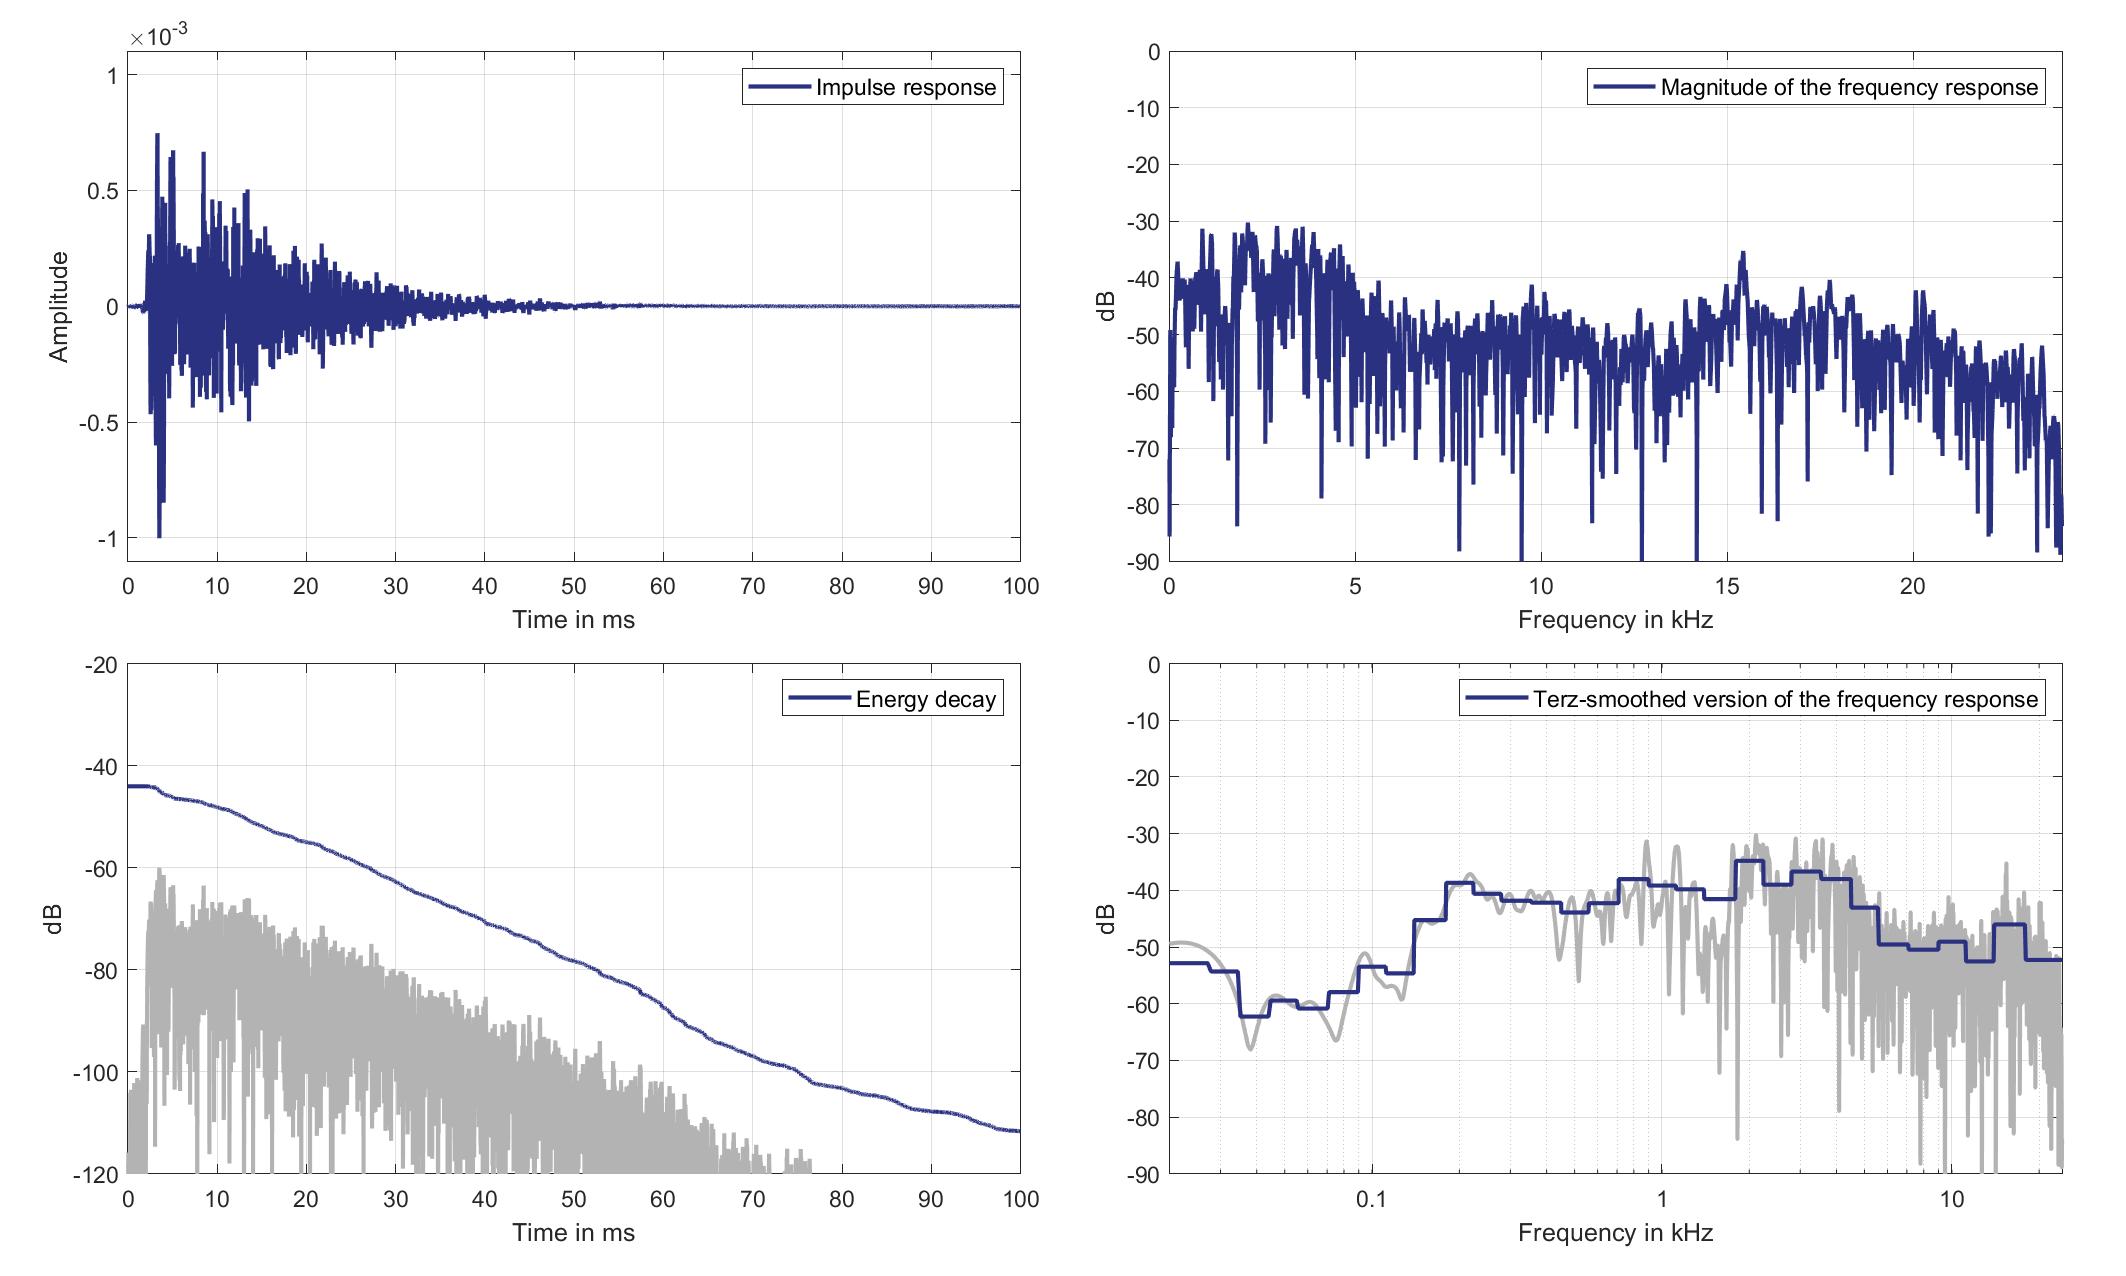
Download impulse response (in ".fir" format).
In the download section you can download all impulse response files as well as format explanation and Matlab as well as Python code examples for loading fir files.
Right lsp. - Right ear mic.
Right Headrest Loudspeaker of Zone 1 (Lsp. 1 to Right Ear Microphone of Zone 3 (Mic. 24)
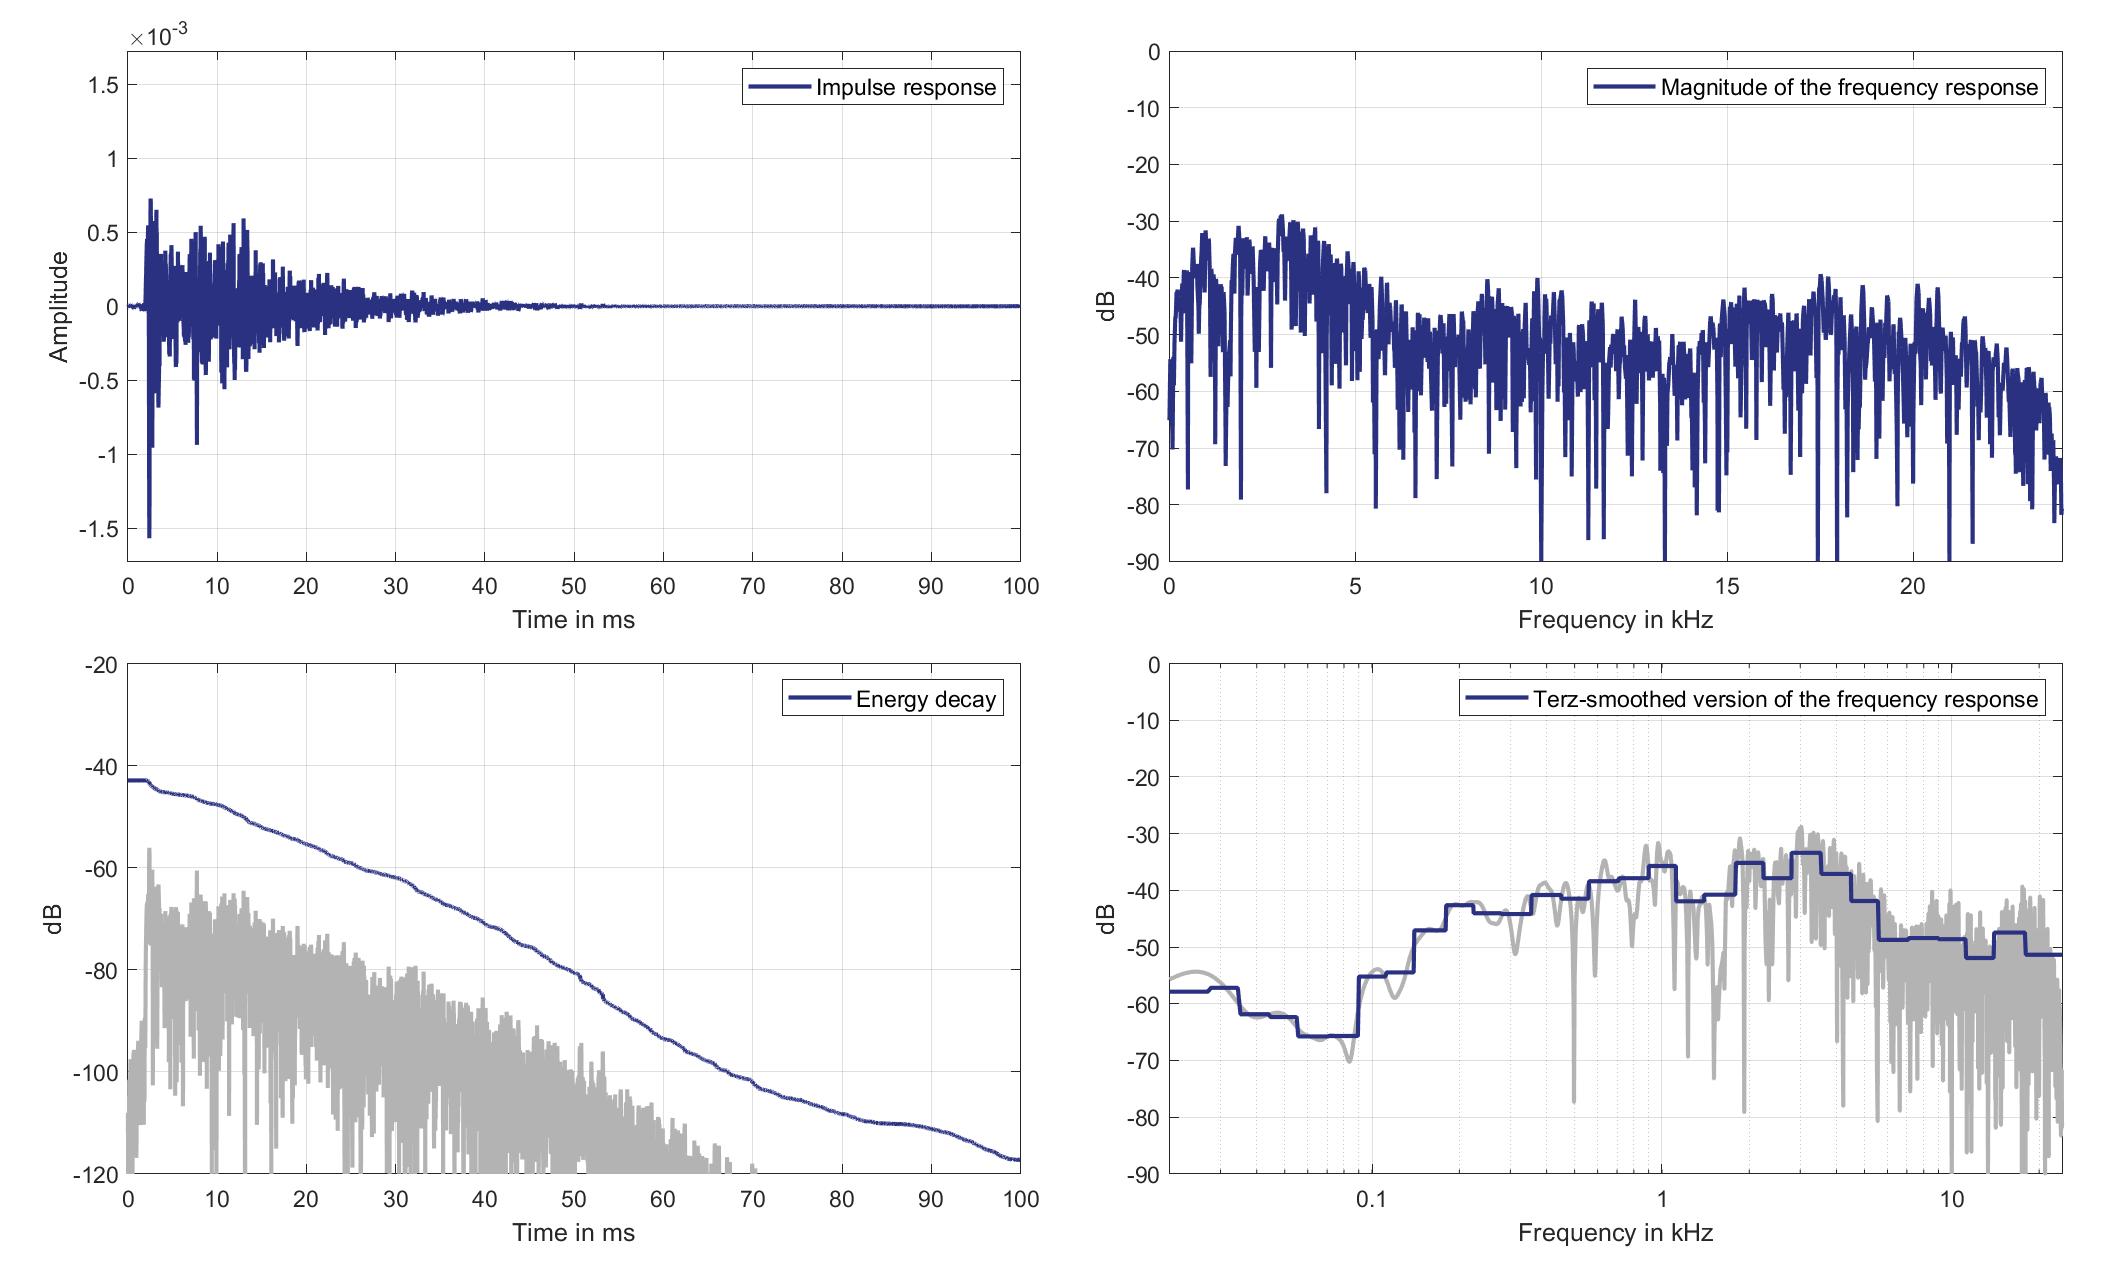
Download impulse response (in ".fir" format).
In the download section you can download all impulse response files as well as format explanation and Matlab as well as Python code examples for loading fir files.
Mics. 25/26
Left lsp. - left ear mic.
Left Headrest Loudspeaker of Zone 1 (Lsp. 0) to Left Ear Microphone of Zone 5 (Mic. 25)
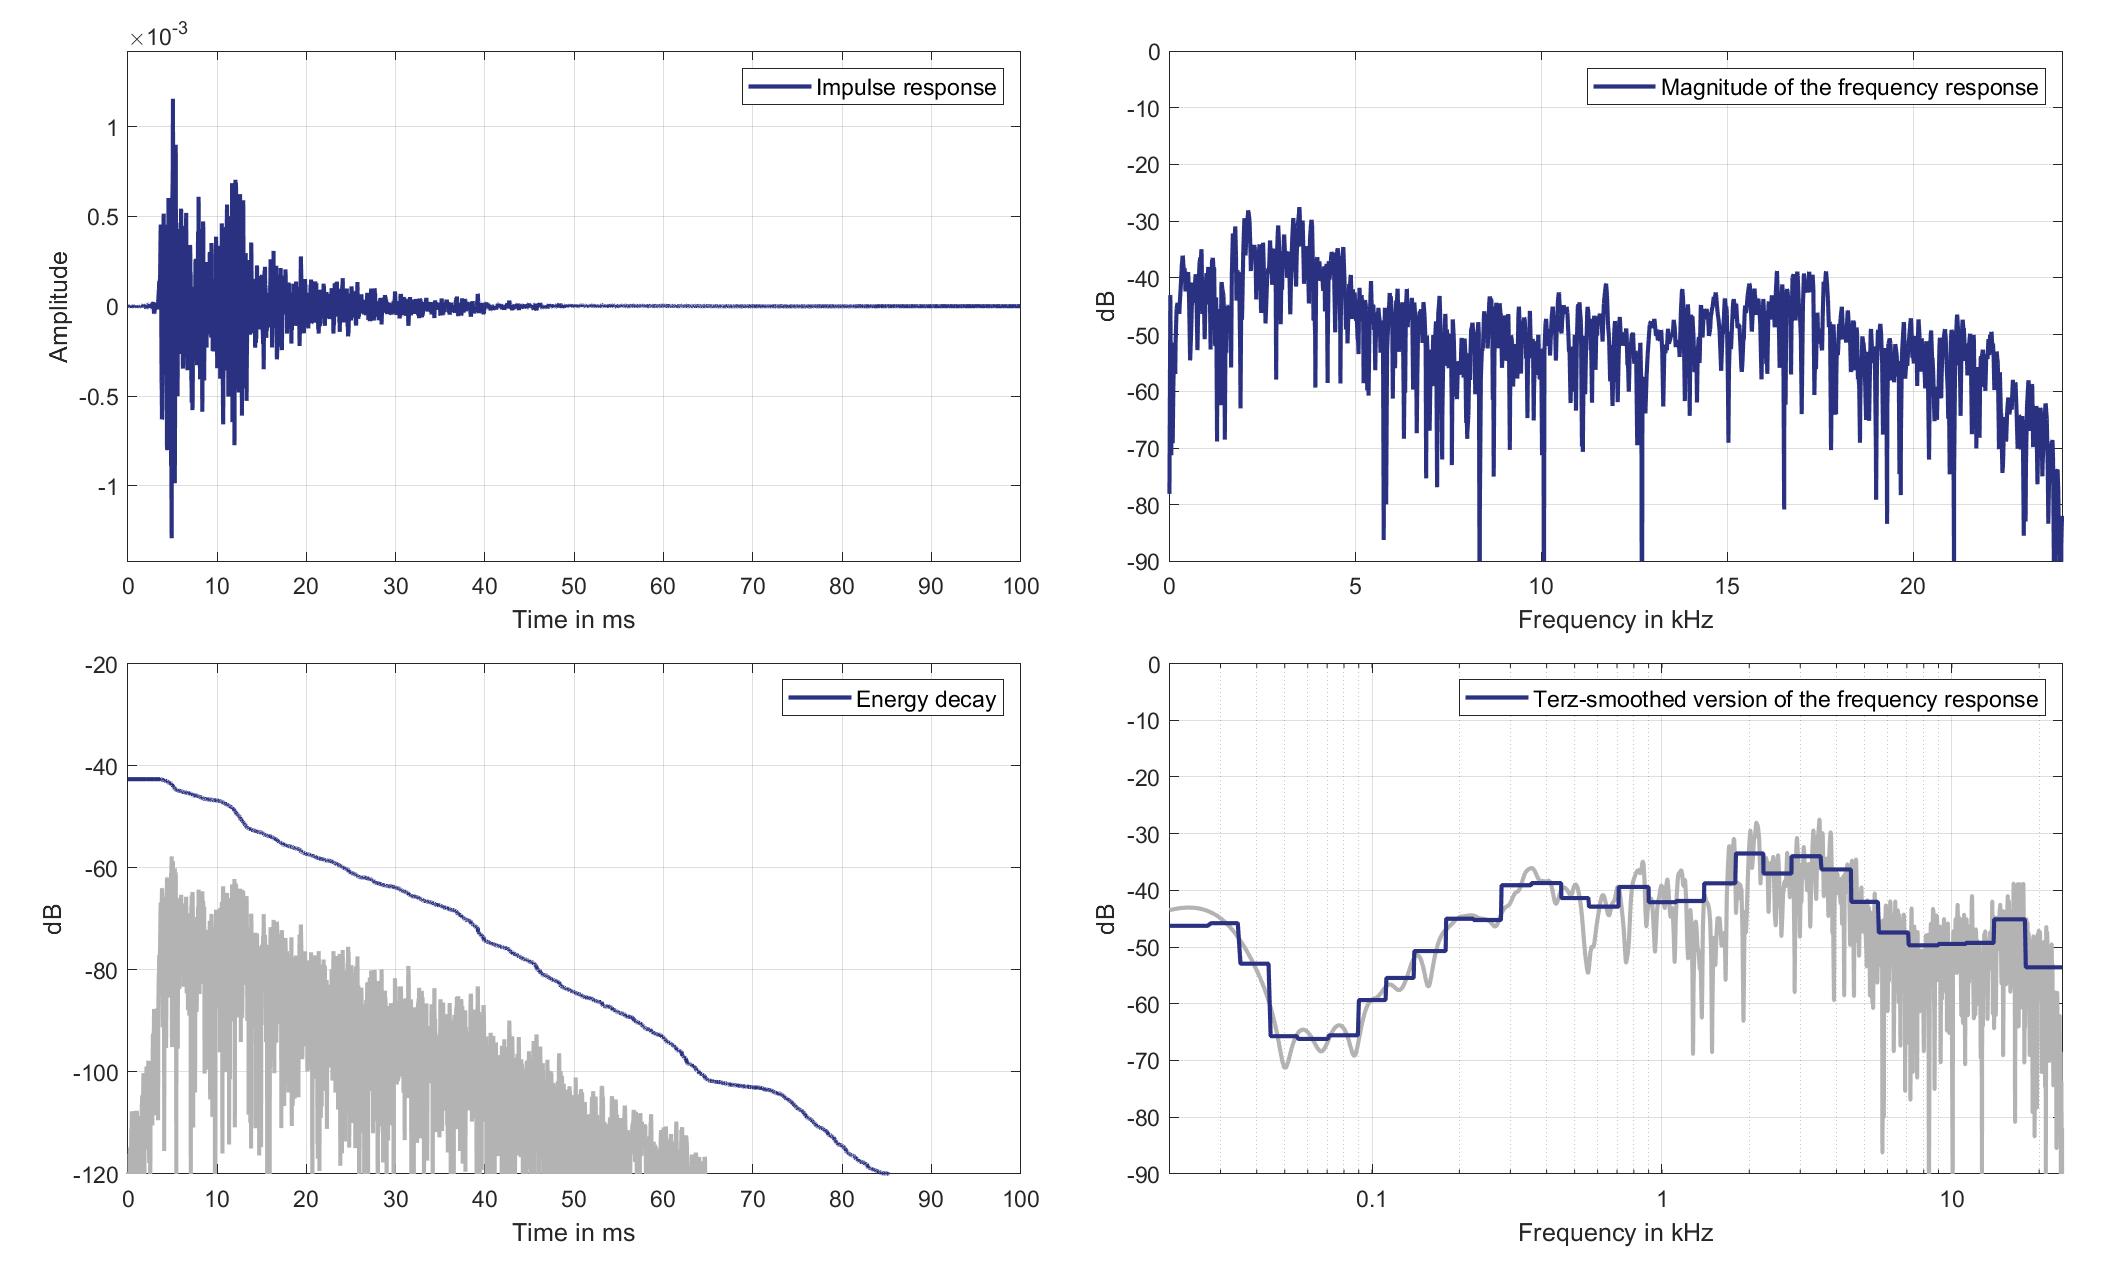
Download impulse response (in ".fir" format).
In the download section you can download all impulse response files as well as format explanation and Matlab as well as Python code examples for loading fir files.
Left lsp. - Right ear mic.
Left Headrest Loudspeaker of Zone 1 (Lsp. 0) to Right Ear Microphone of Zone 5 (Mic. 26)
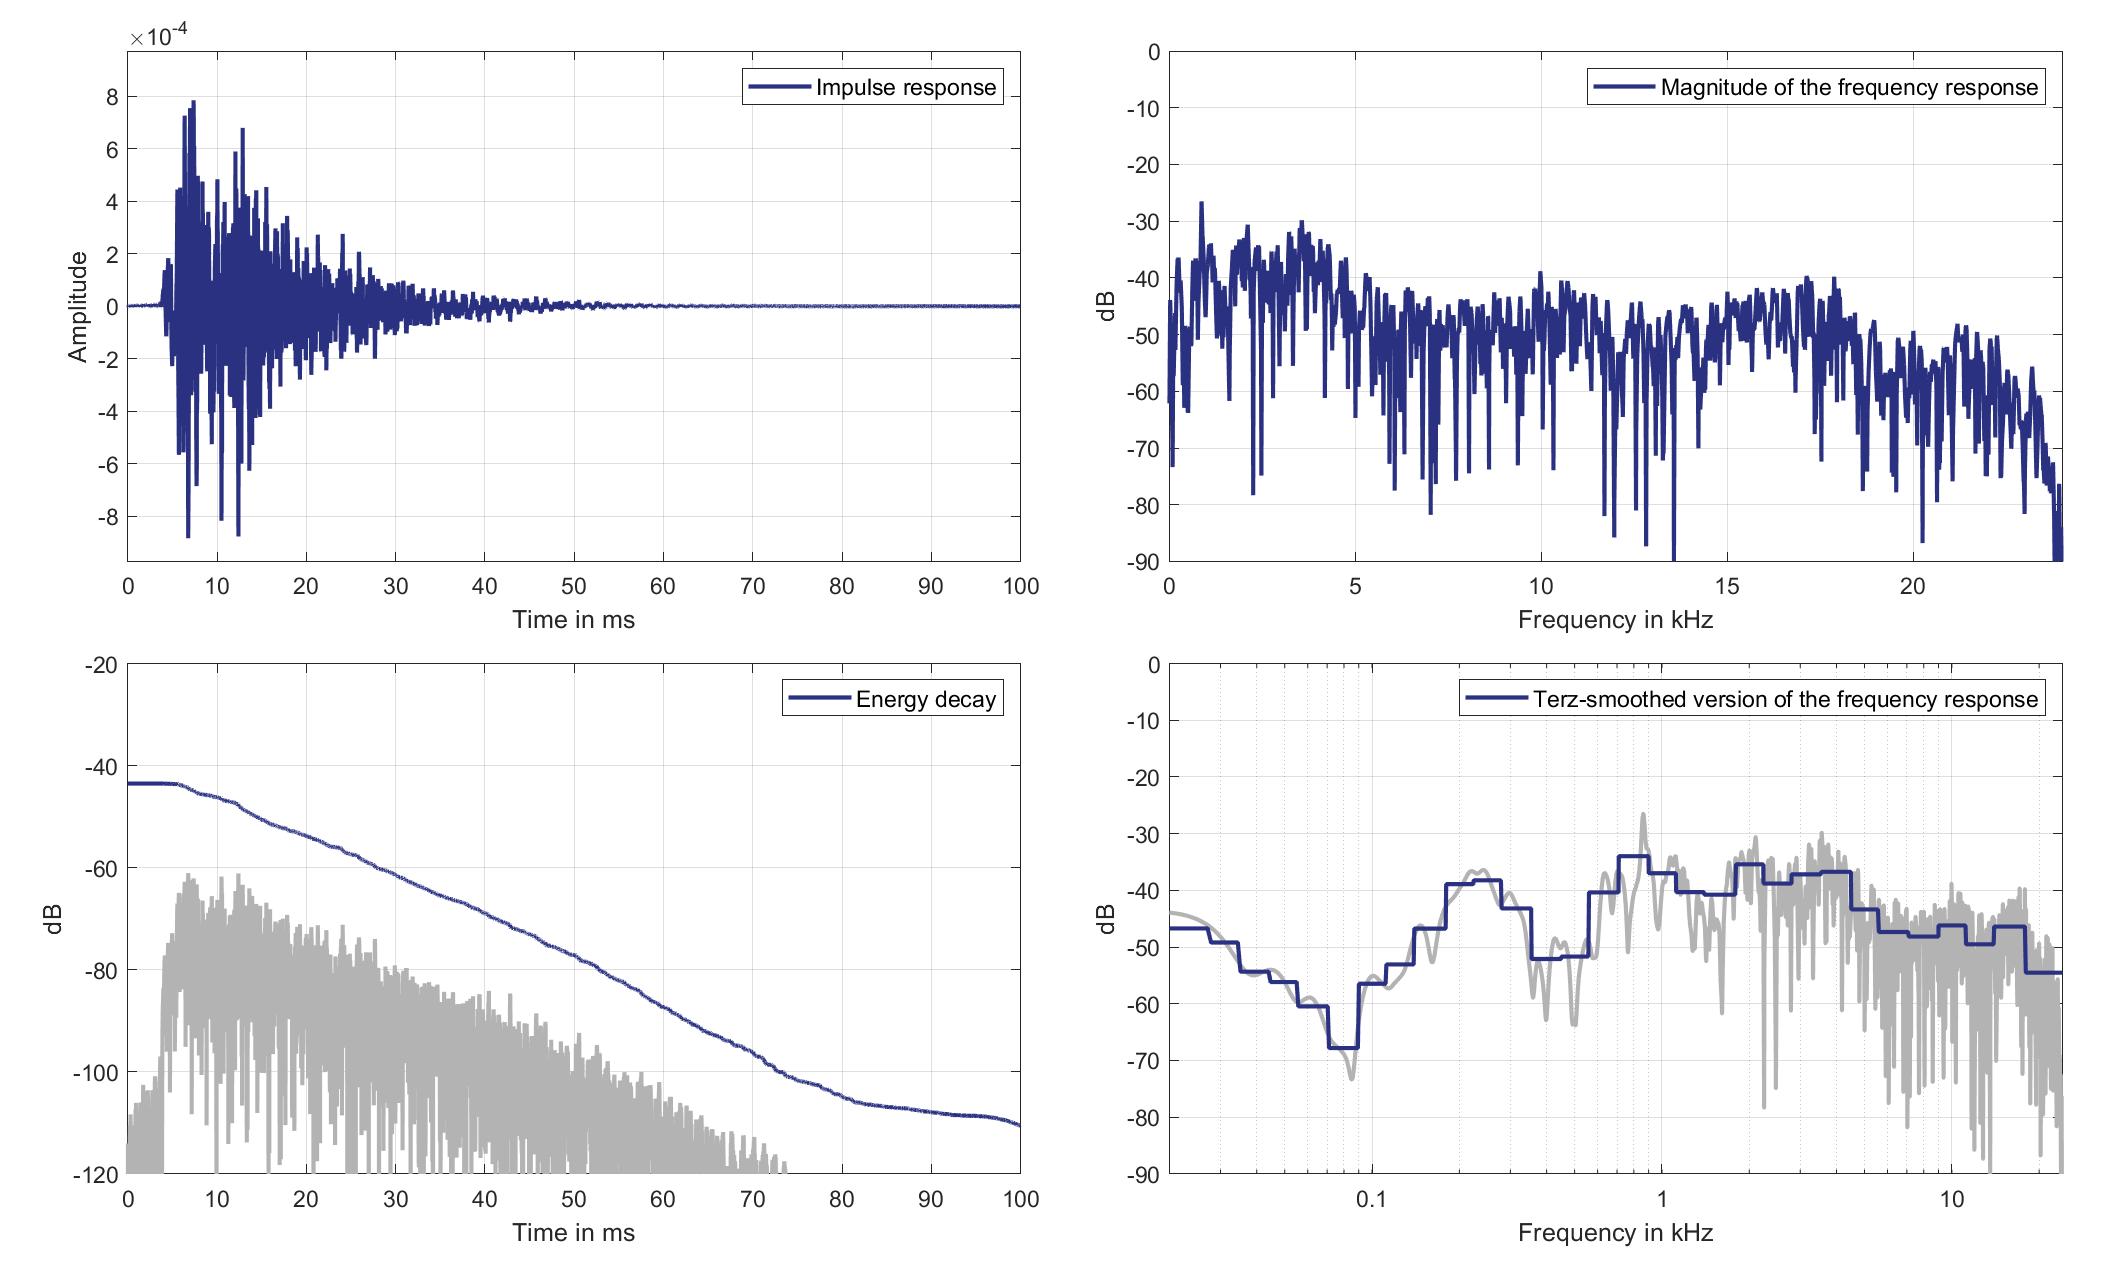
Download impulse response (in ".fir" format).
In the download section you can download all impulse response files as well as format explanation and Matlab as well as Python code examples for loading fir files.
Right lsp. - left ear mic.
Right Headrest Loudspeaker of Zone 1 (Lsp. 1) to Left Ear Microphone of Zone 5 (Mic. 25)
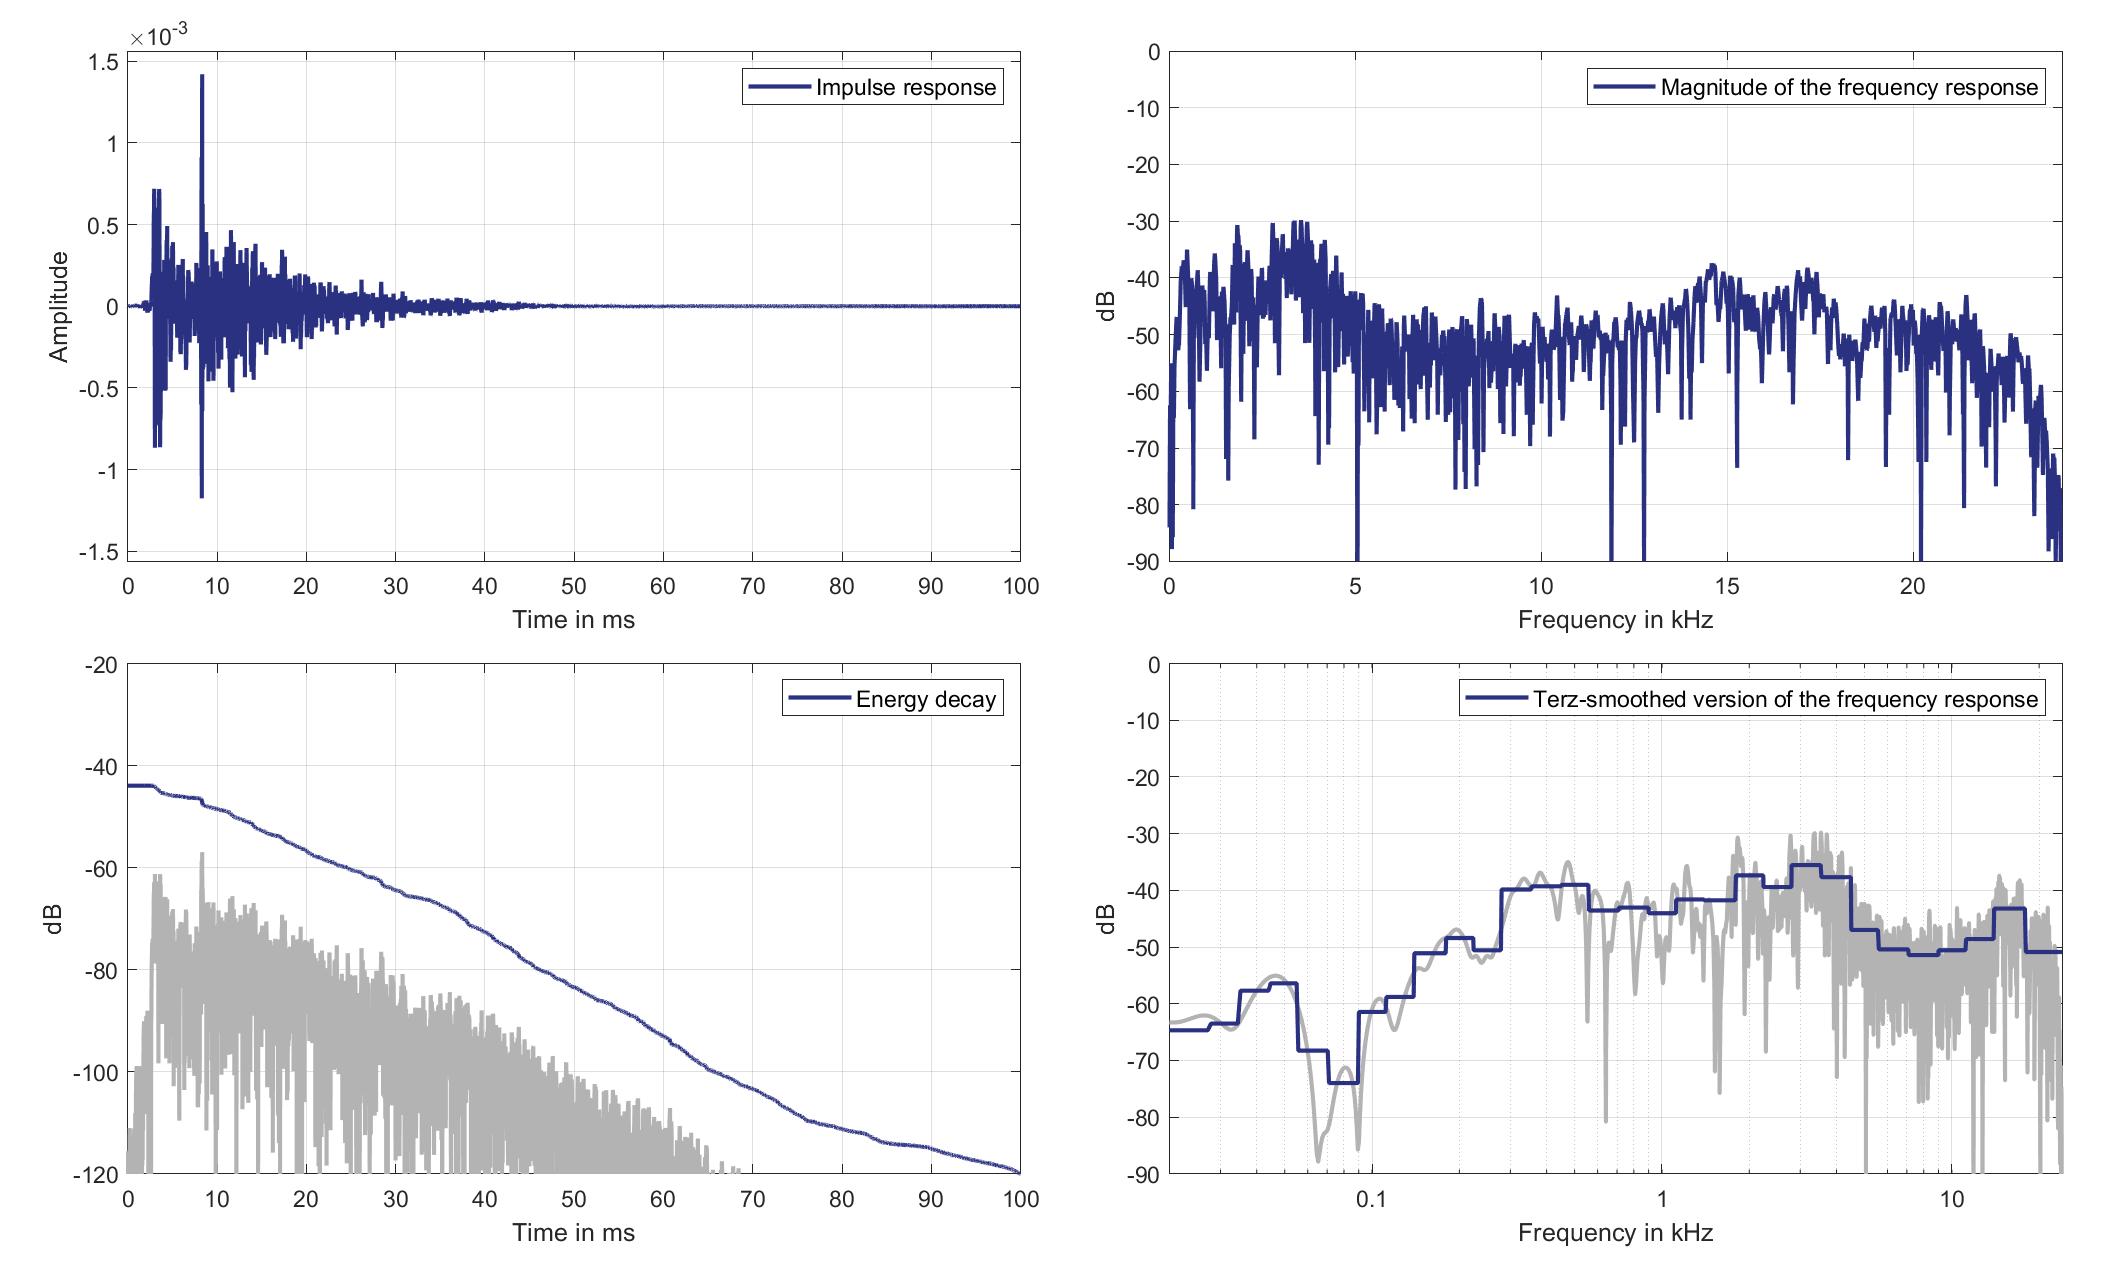
Download impulse response (in ".fir" format).
In the download section you can download all impulse response files as well as format explanation and Matlab as well as Python code examples for loading fir files.
Right lsp. - Right ear mic.
Right Headrest Loudspeaker of Zone 1 (Lsp. 1 to Right Ear Microphone of Zone 5 (Mic. 26)
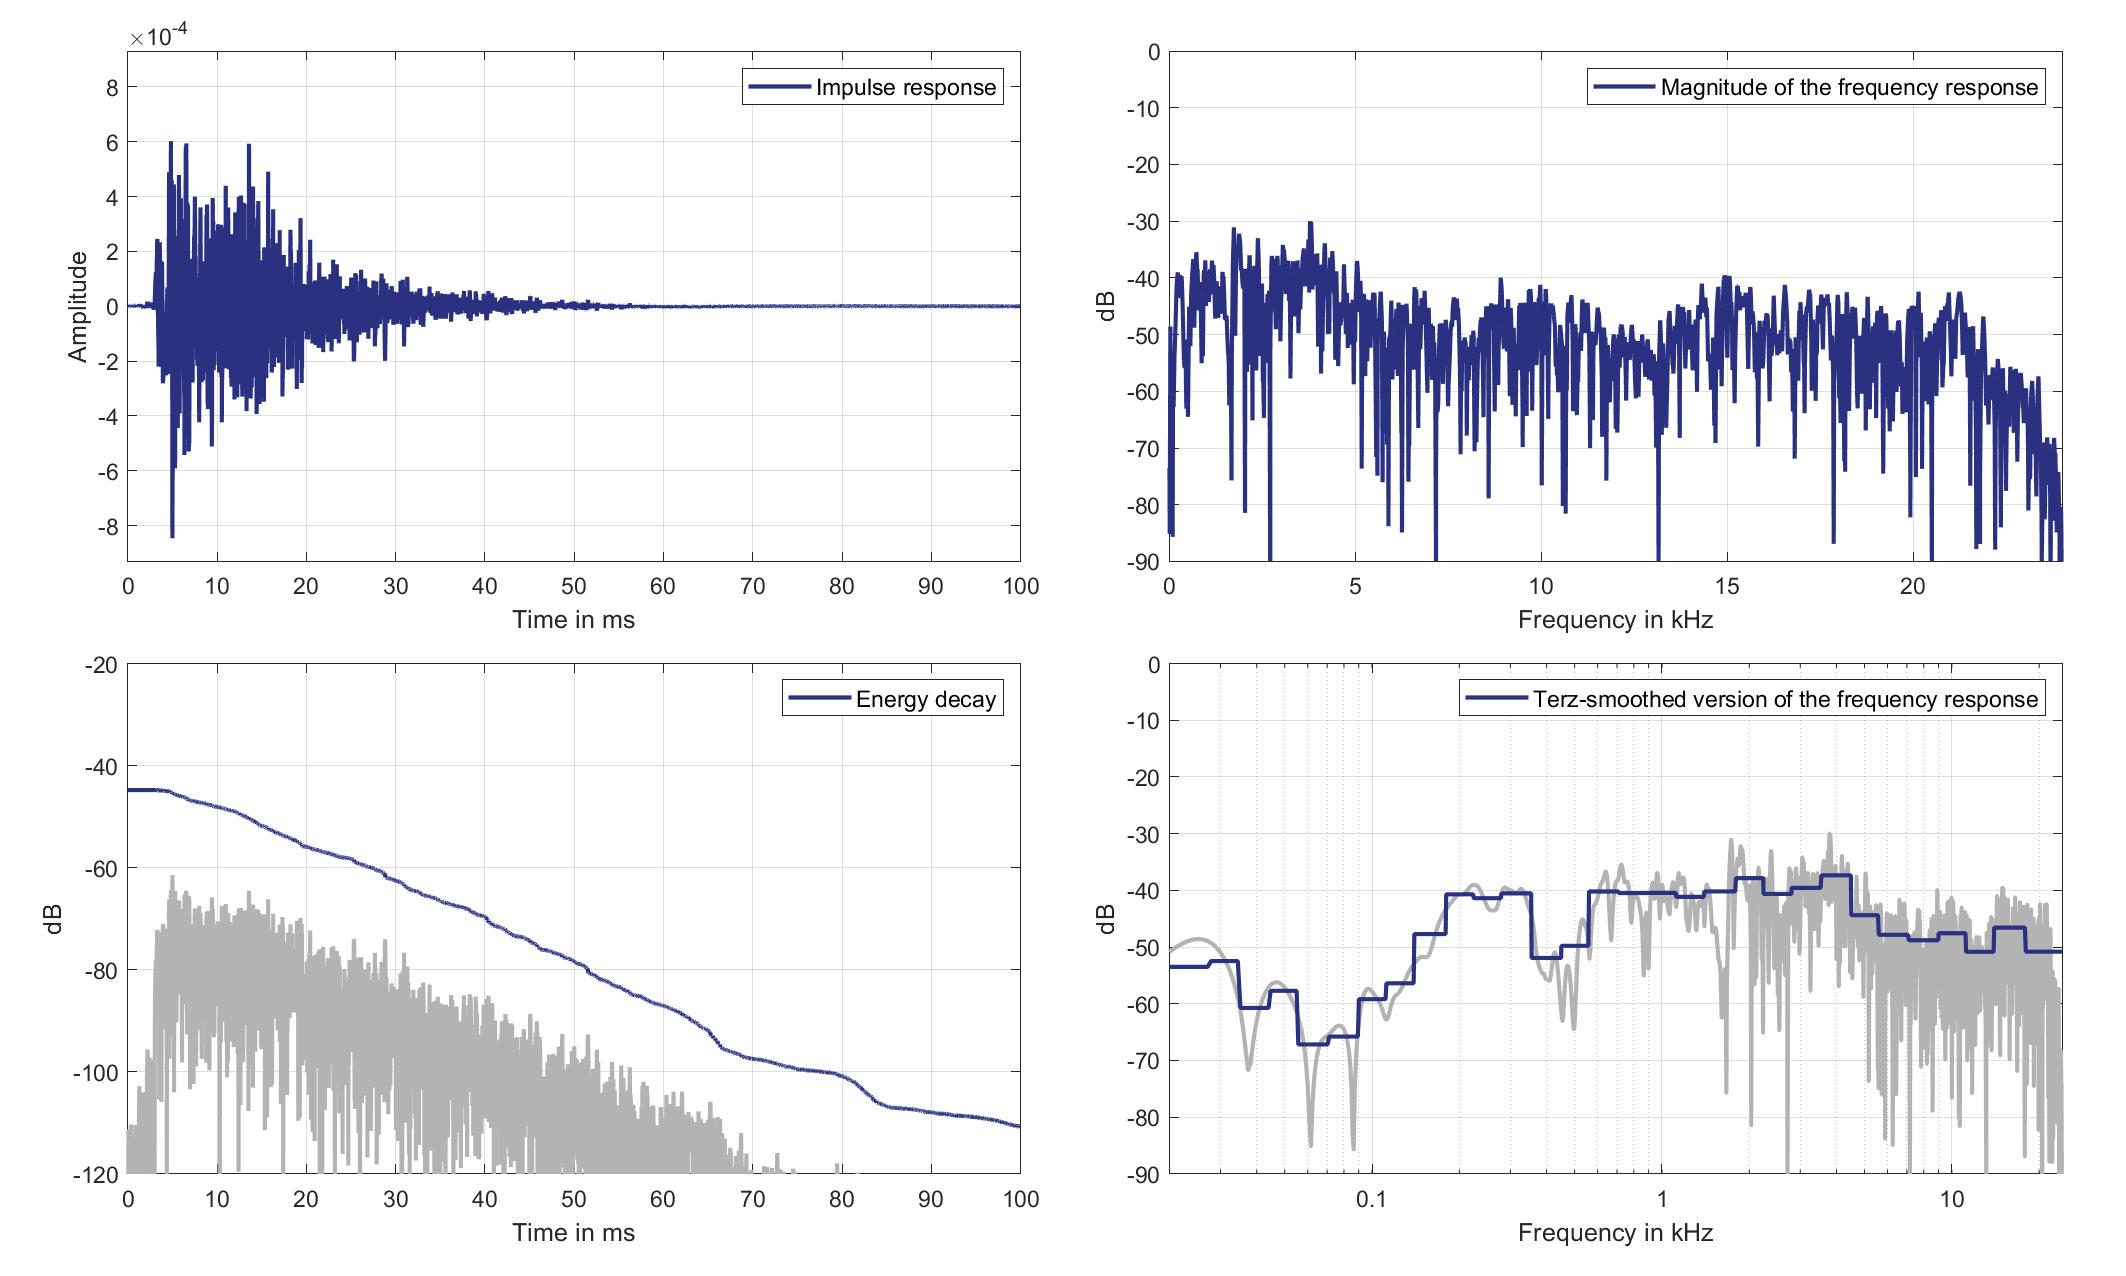
Download impulse response (in ".fir" format).
In the download section you can download all impulse response files as well as format explanation and Matlab as well as Python code examples for loading fir files.
Mics. 27/28
Left lsp. - left ear mic.
Left Headrest Loudspeaker of Zone 1 (Lsp. 0) to Left Ear Microphone of Zone 6 (Mic. 27)
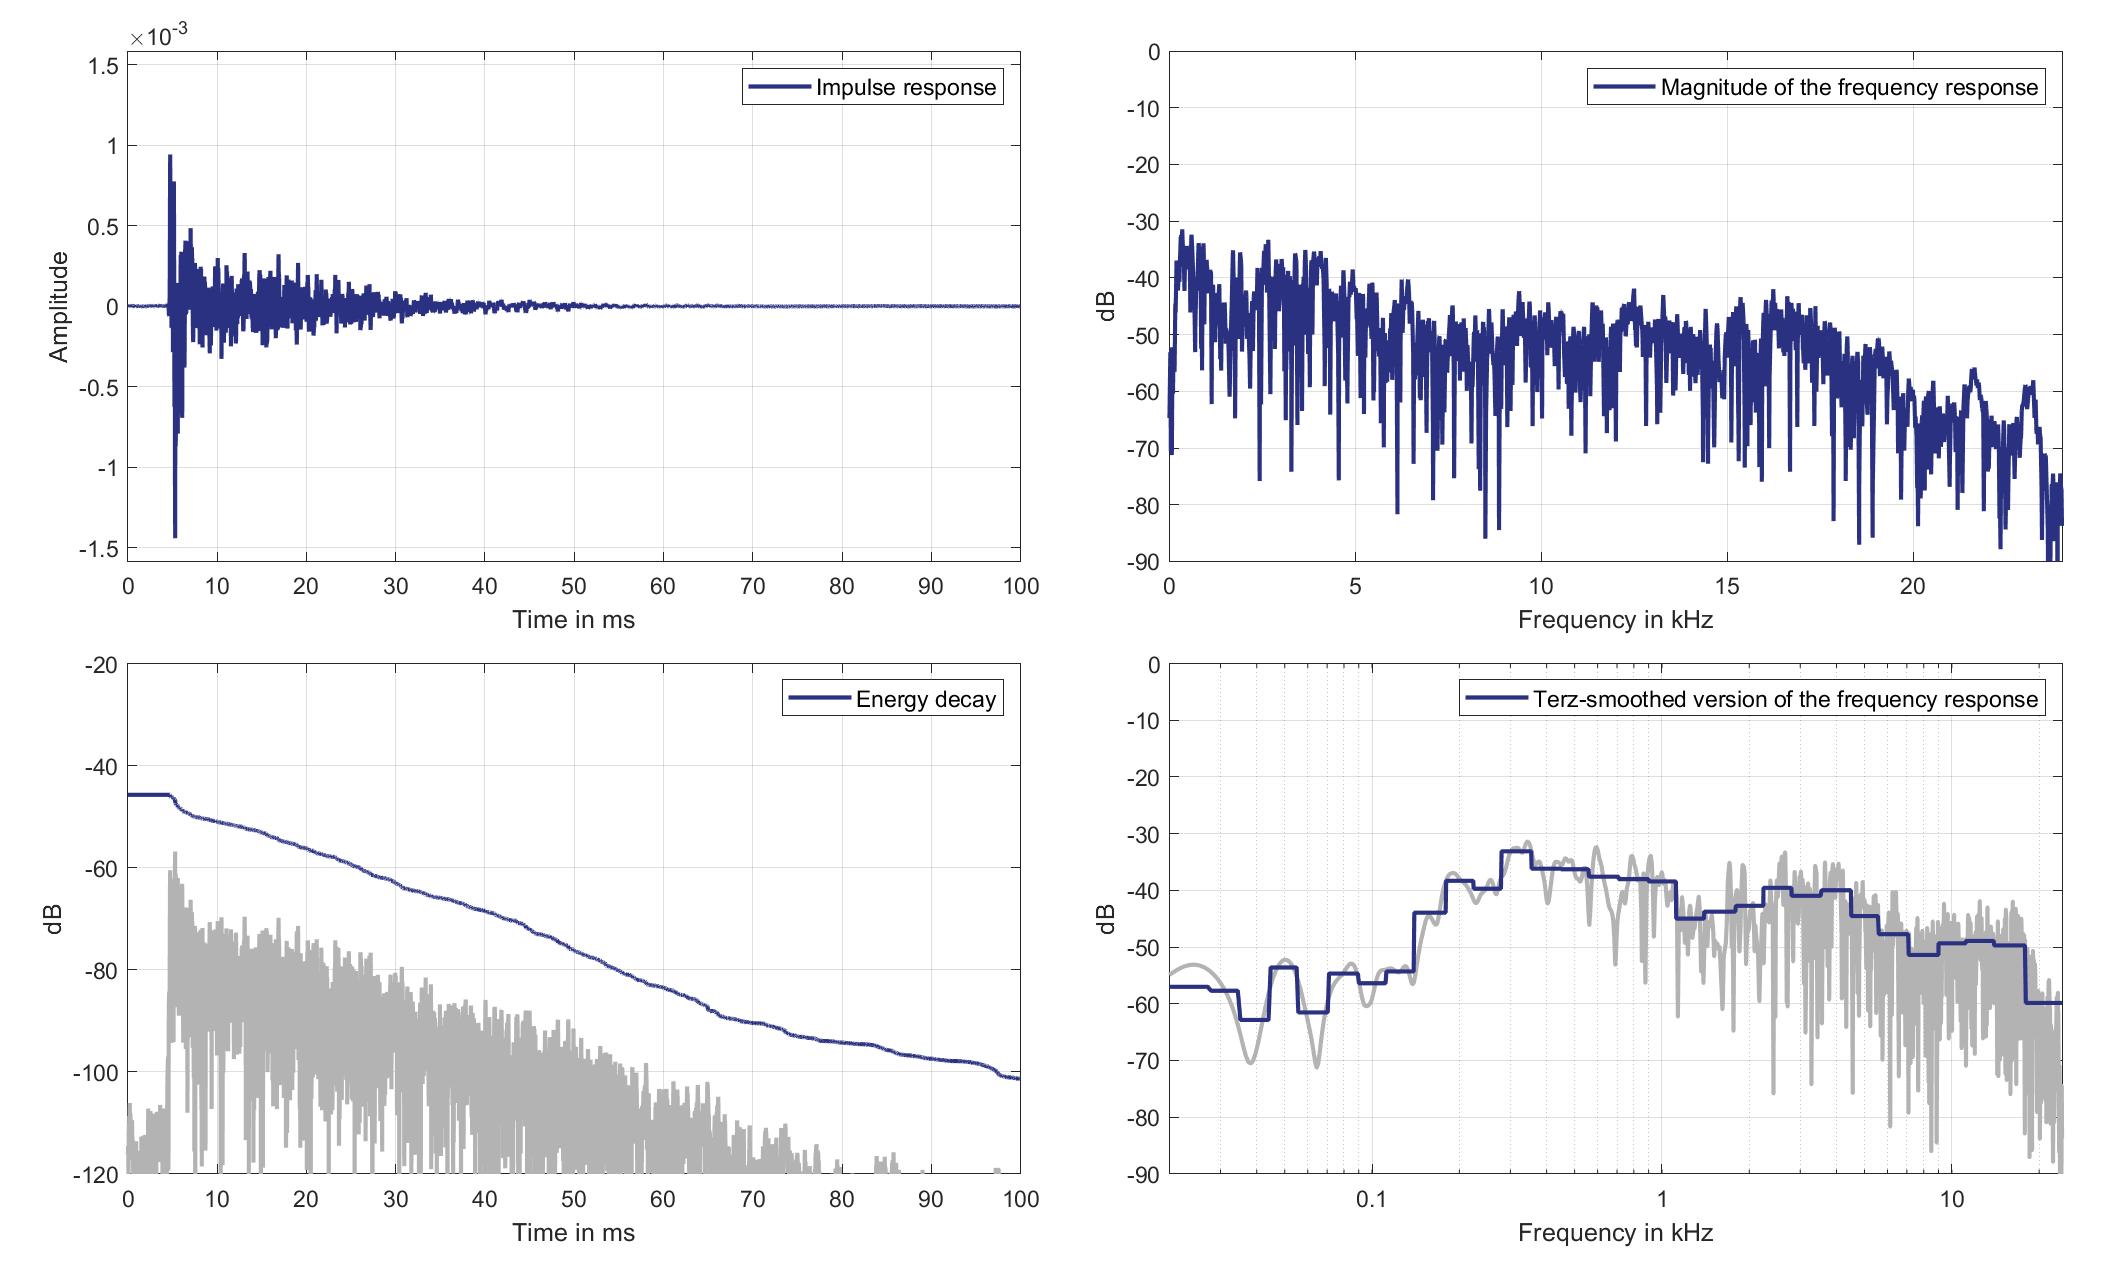
Download impulse response (in ".fir" format).
In the download section you can download all impulse response files as well as format explanation and Matlab as well as Python code examples for loading fir files.
Left lsp. - Right ear mic.
Left Headrest Loudspeaker of Zone 1 (Lsp. 0) to Right Ear Microphone of Zone 6 (Mic. 28)
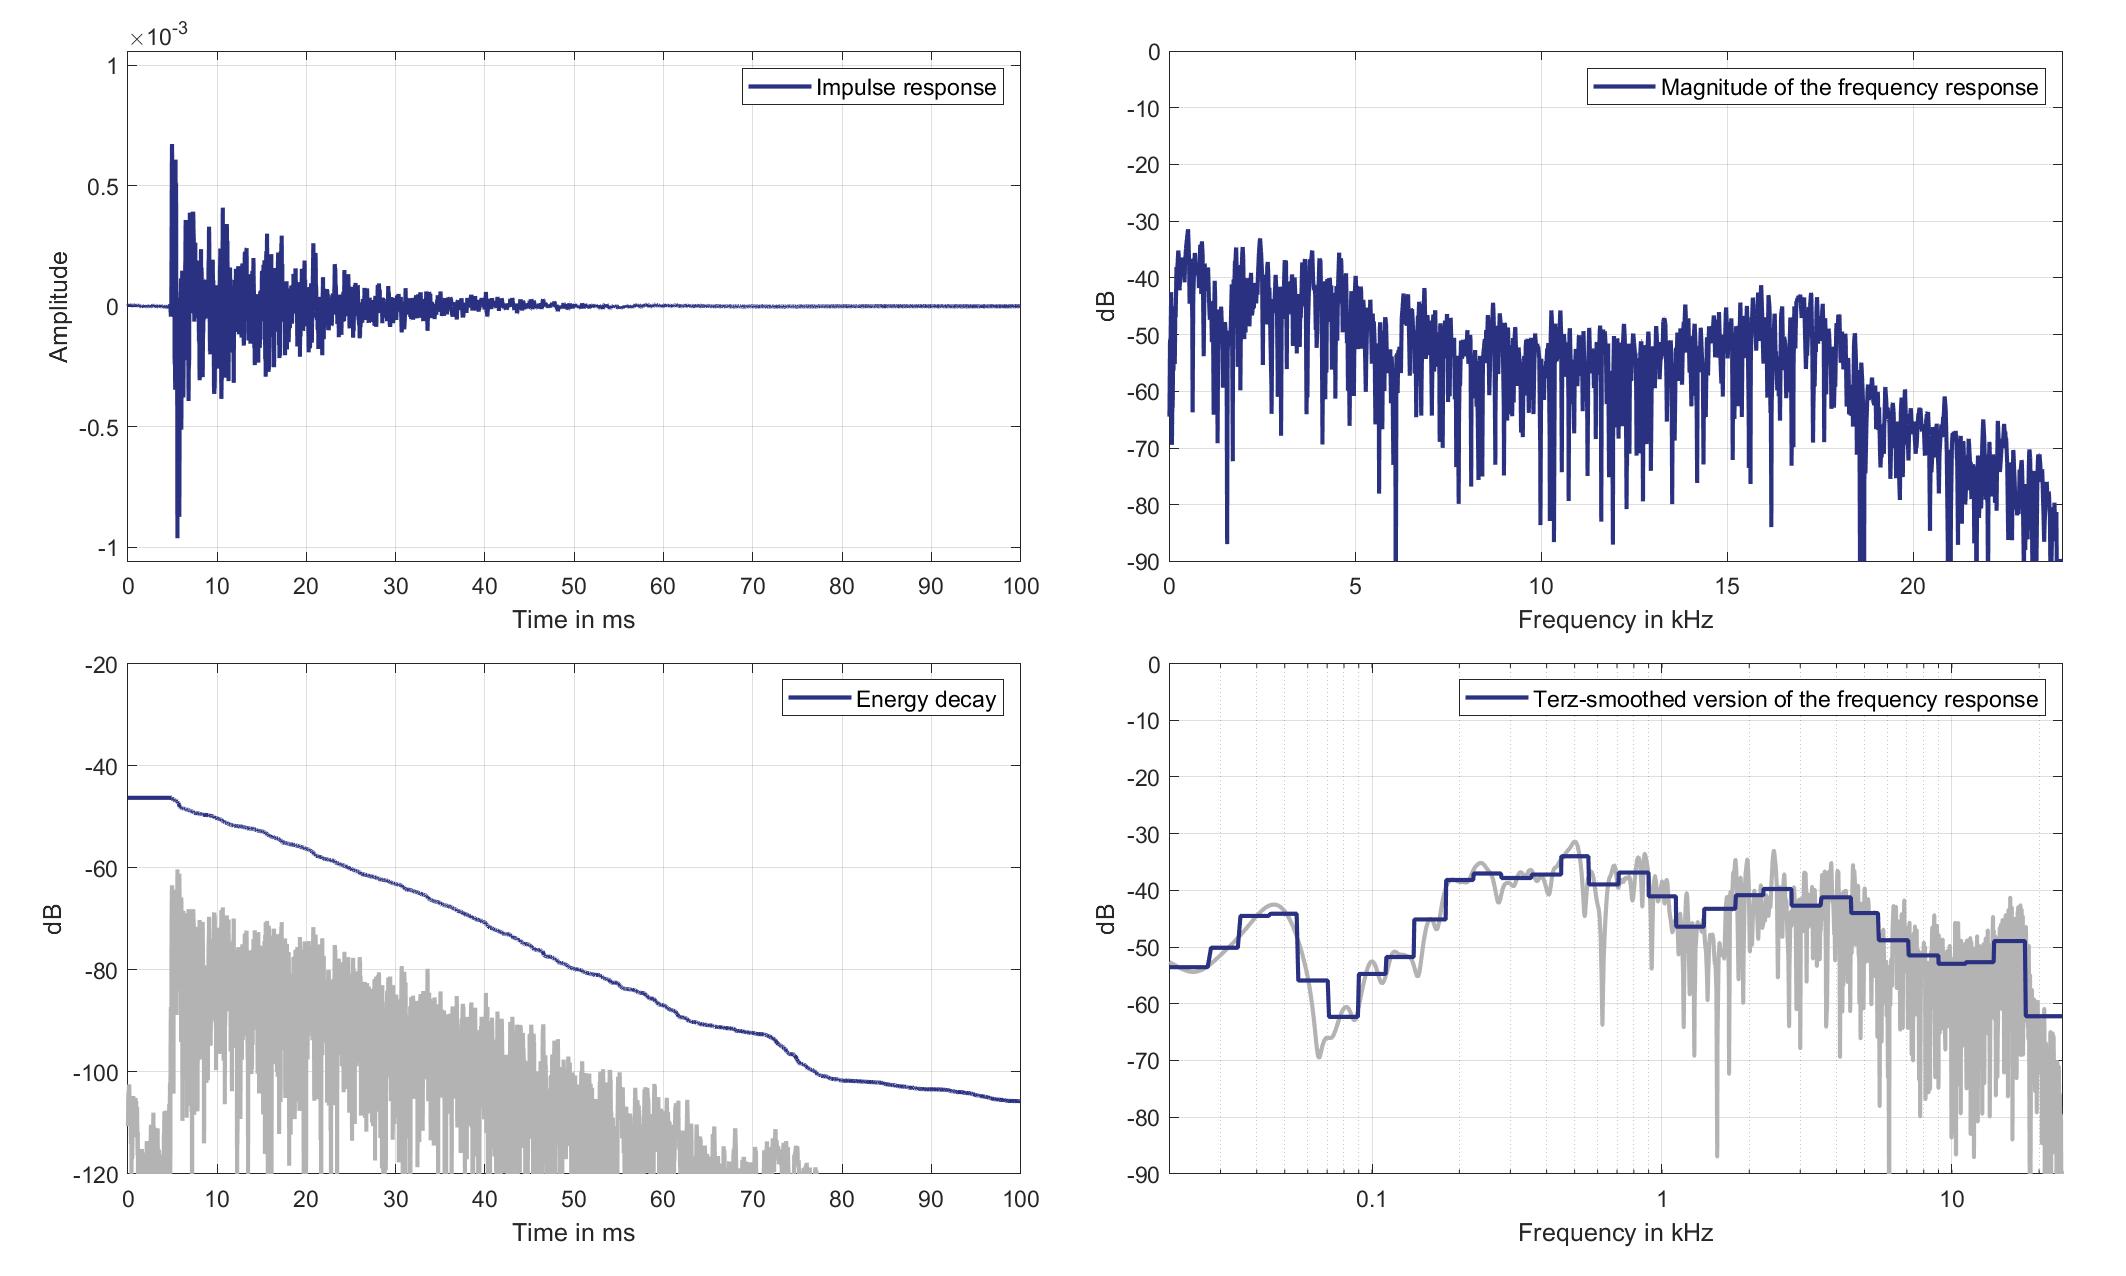
Download impulse response (in ".fir" format).
In the download section you can download all impulse response files as well as format explanation and Matlab as well as Python code examples for loading fir files.
Right lsp. - left ear mic.
Right Headrest Loudspeaker of Zone 1 (Lsp. 1) to Left Ear Microphone of Zone 6 (Mic. 27)
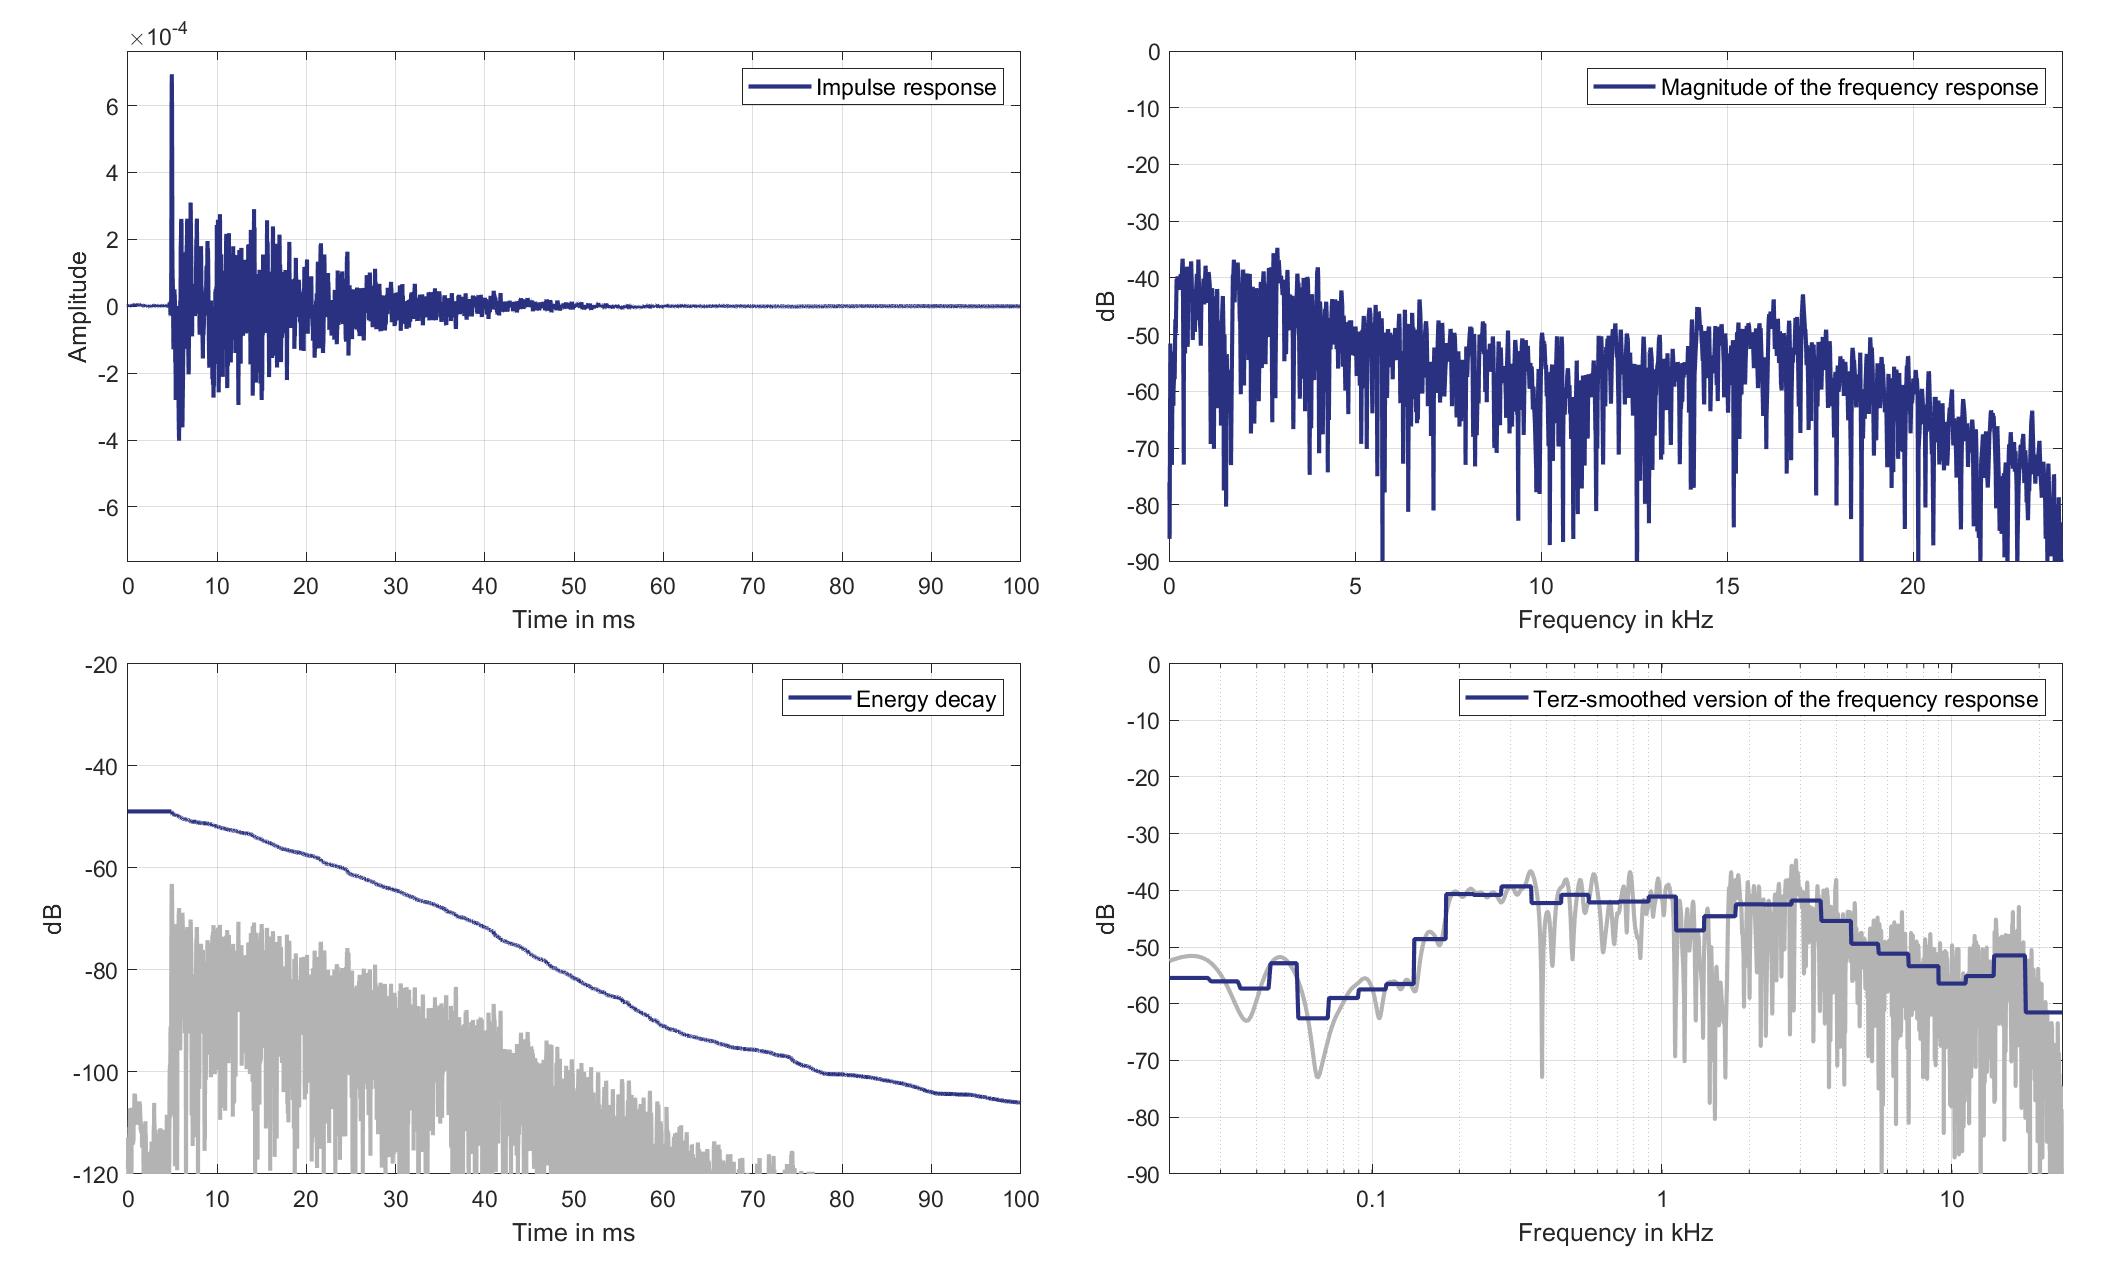
Download impulse response (in ".fir" format).
In the download section you can download all impulse response files as well as format explanation and Matlab as well as Python code examples for loading fir files.
Right lsp. - Right ear mic.
Right Headrest Loudspeaker of Zone 1 (Lsp. 1 to Right Ear Microphone of Zone 6 (Mic. 28)
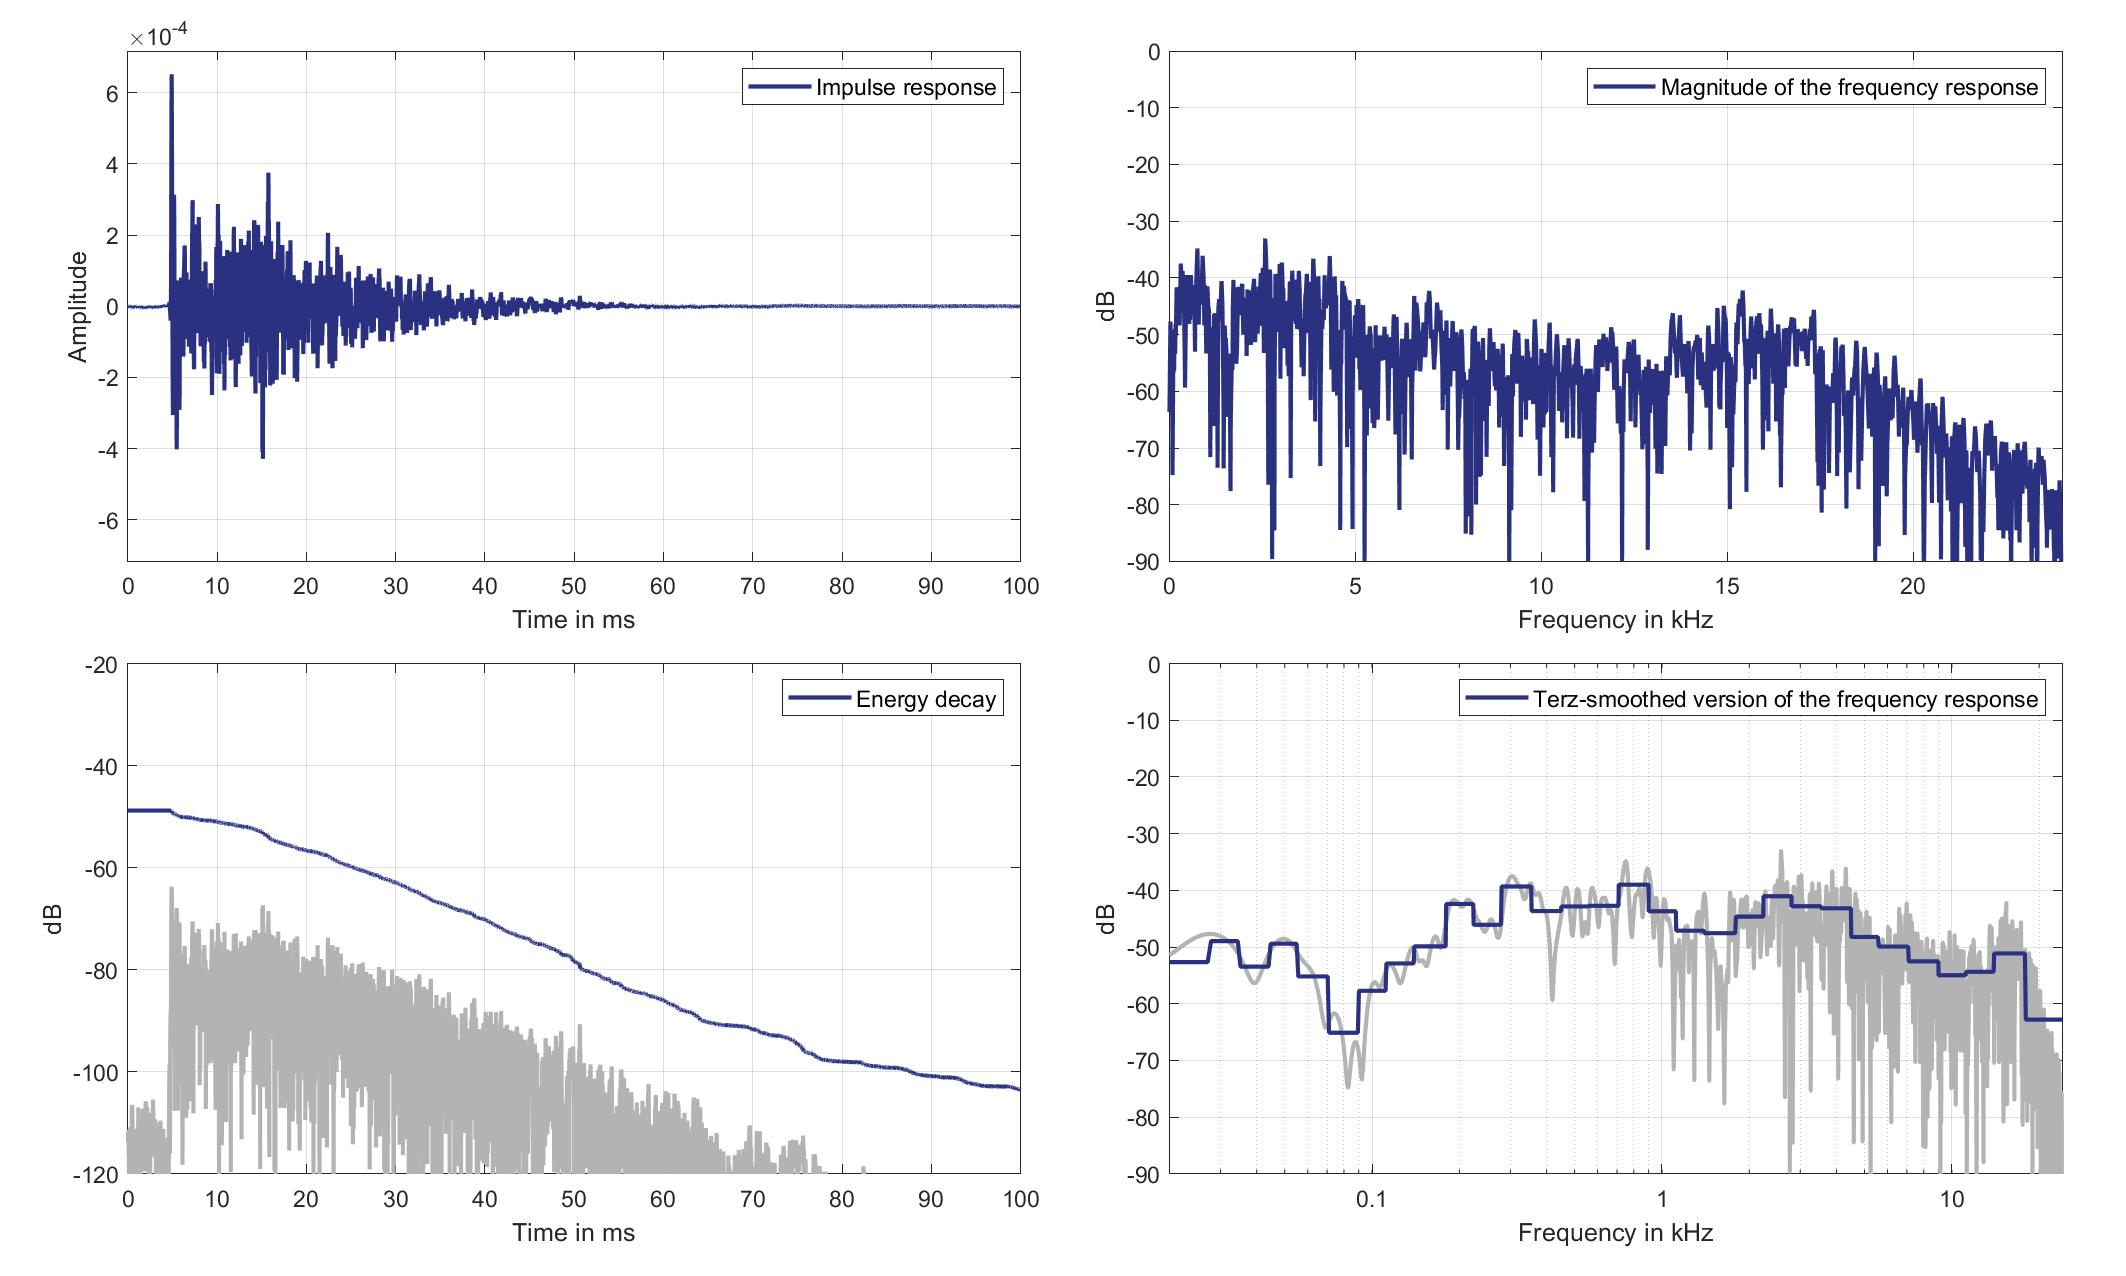
Download impulse response (in ".fir" format).
In the download section you can download all impulse response files as well as format explanation and Matlab as well as Python code examples for loading fir files.
Mics. 29/30
Left lsp. - left ear mic.
Left Headrest Loudspeaker of Zone 1 (Lsp. 0) to Left Ear Microphone of Zone 8 (Mic. 29)

Download impulse response (in ".fir" format).
In the download section you can download all impulse response files as well as format explanation and Matlab as well as Python code examples for loading fir files.
Left lsp. - Right ear mic.
Left Headrest Loudspeaker of Zone 1 (Lsp. 0) to Right Ear Microphone of Zone 8 (Mic. 30)
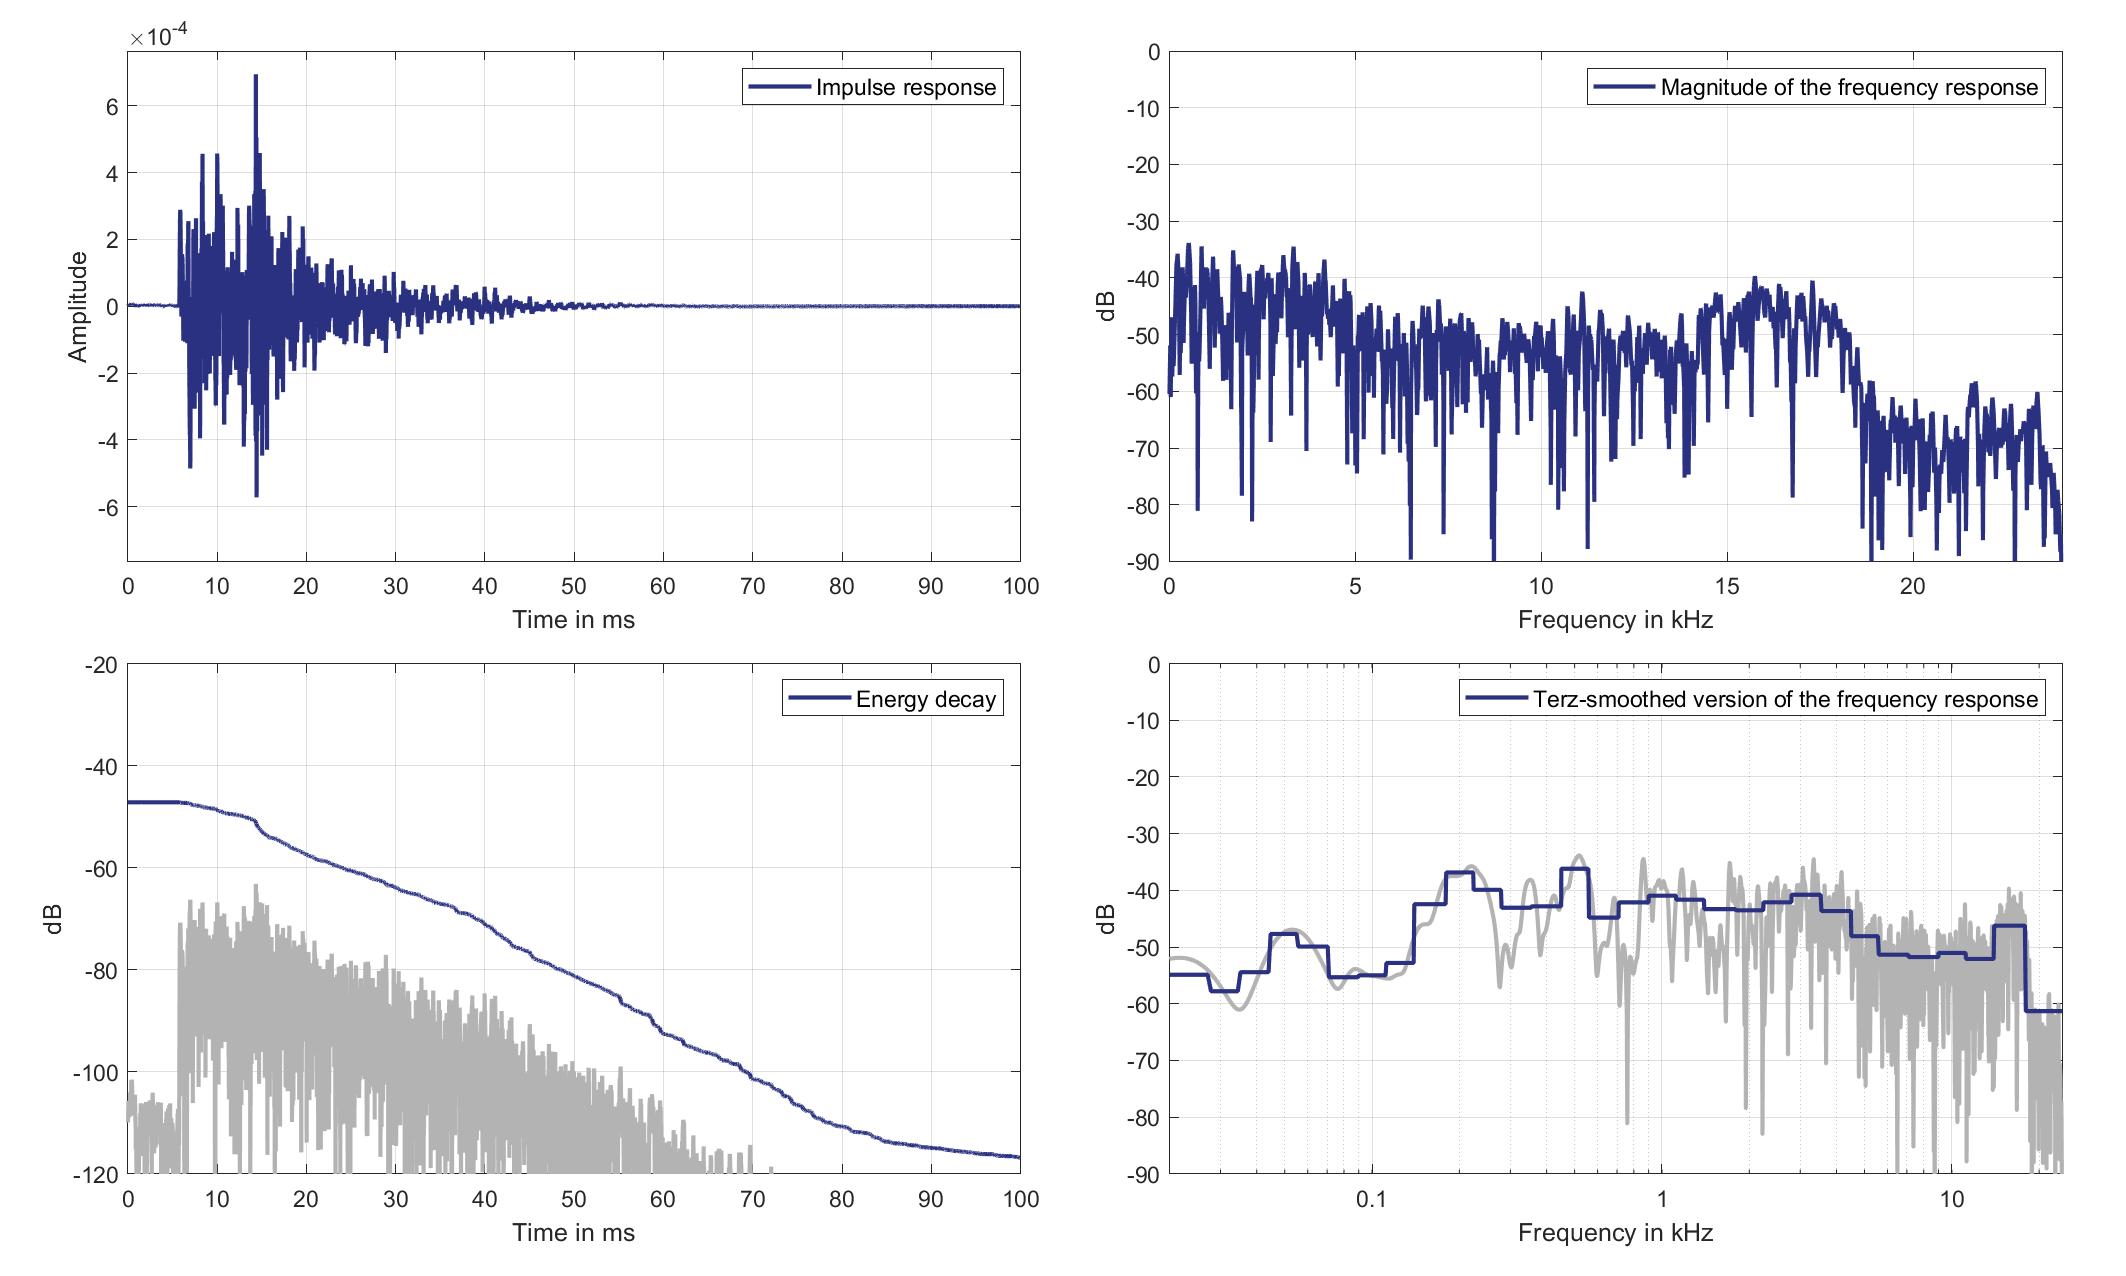
Download impulse response (in ".fir" format).
In the download section you can download all impulse response files as well as format explanation and Matlab as well as Python code examples for loading fir files.
Right lsp. - left ear mic.
Right Headrest Loudspeaker of Zone 1 (Lsp. 1) to Left Ear Microphone of Zone 8 (Mic. 29)
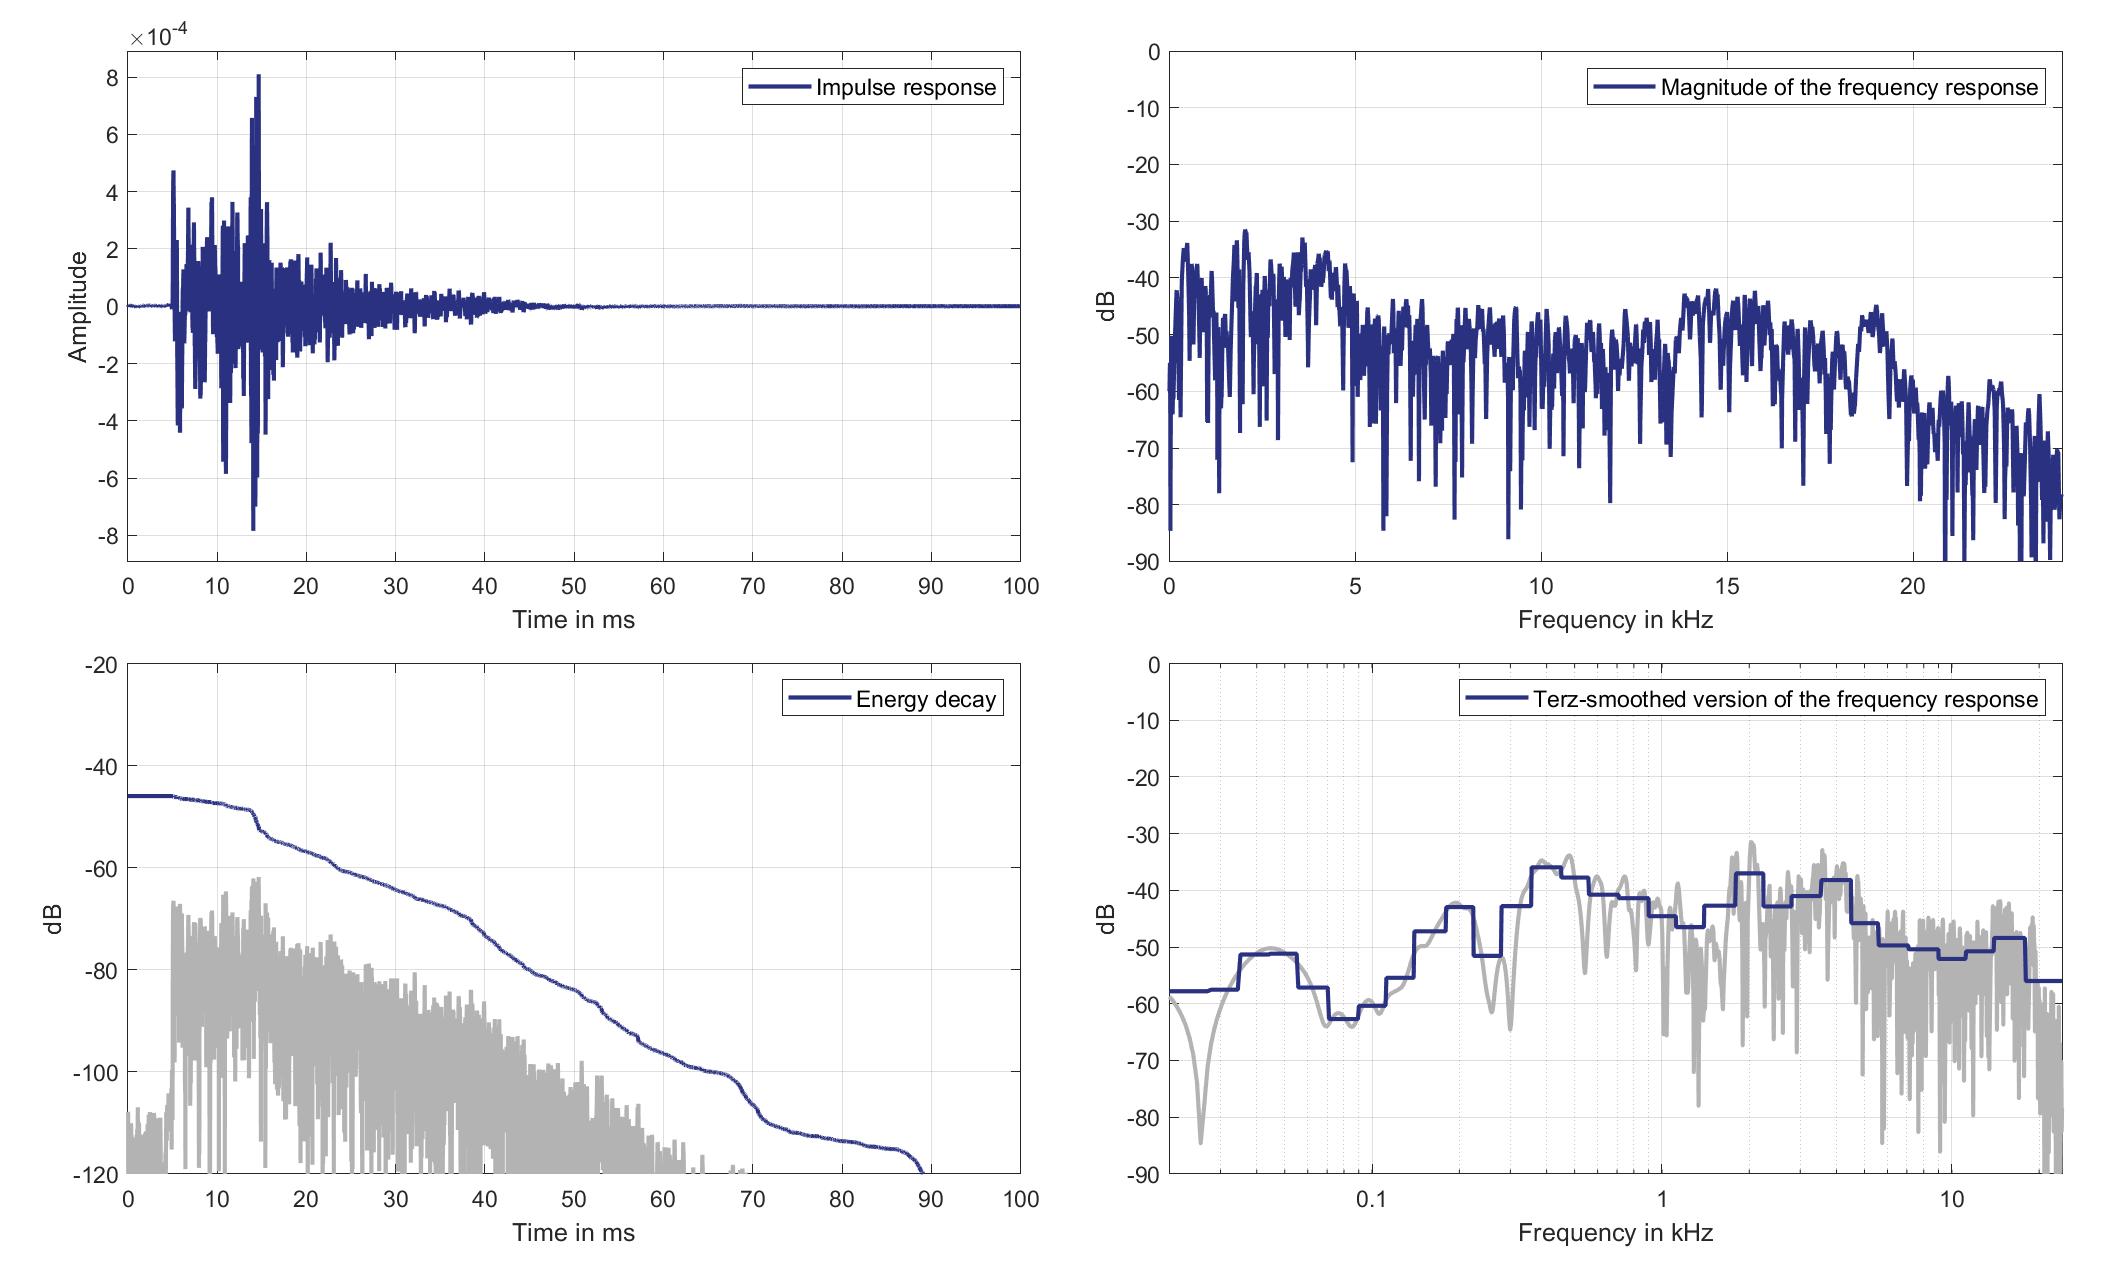
Download impulse response (in ".fir" format).
In the download section you can download all impulse response files as well as format explanation and Matlab as well as Python code examples for loading fir files.
Right lsp. - Right ear mic.
Right Headrest Loudspeaker of Zone 1 (Lsp. 1 to Right Ear Microphone of Zone 8 (Mic. 30)
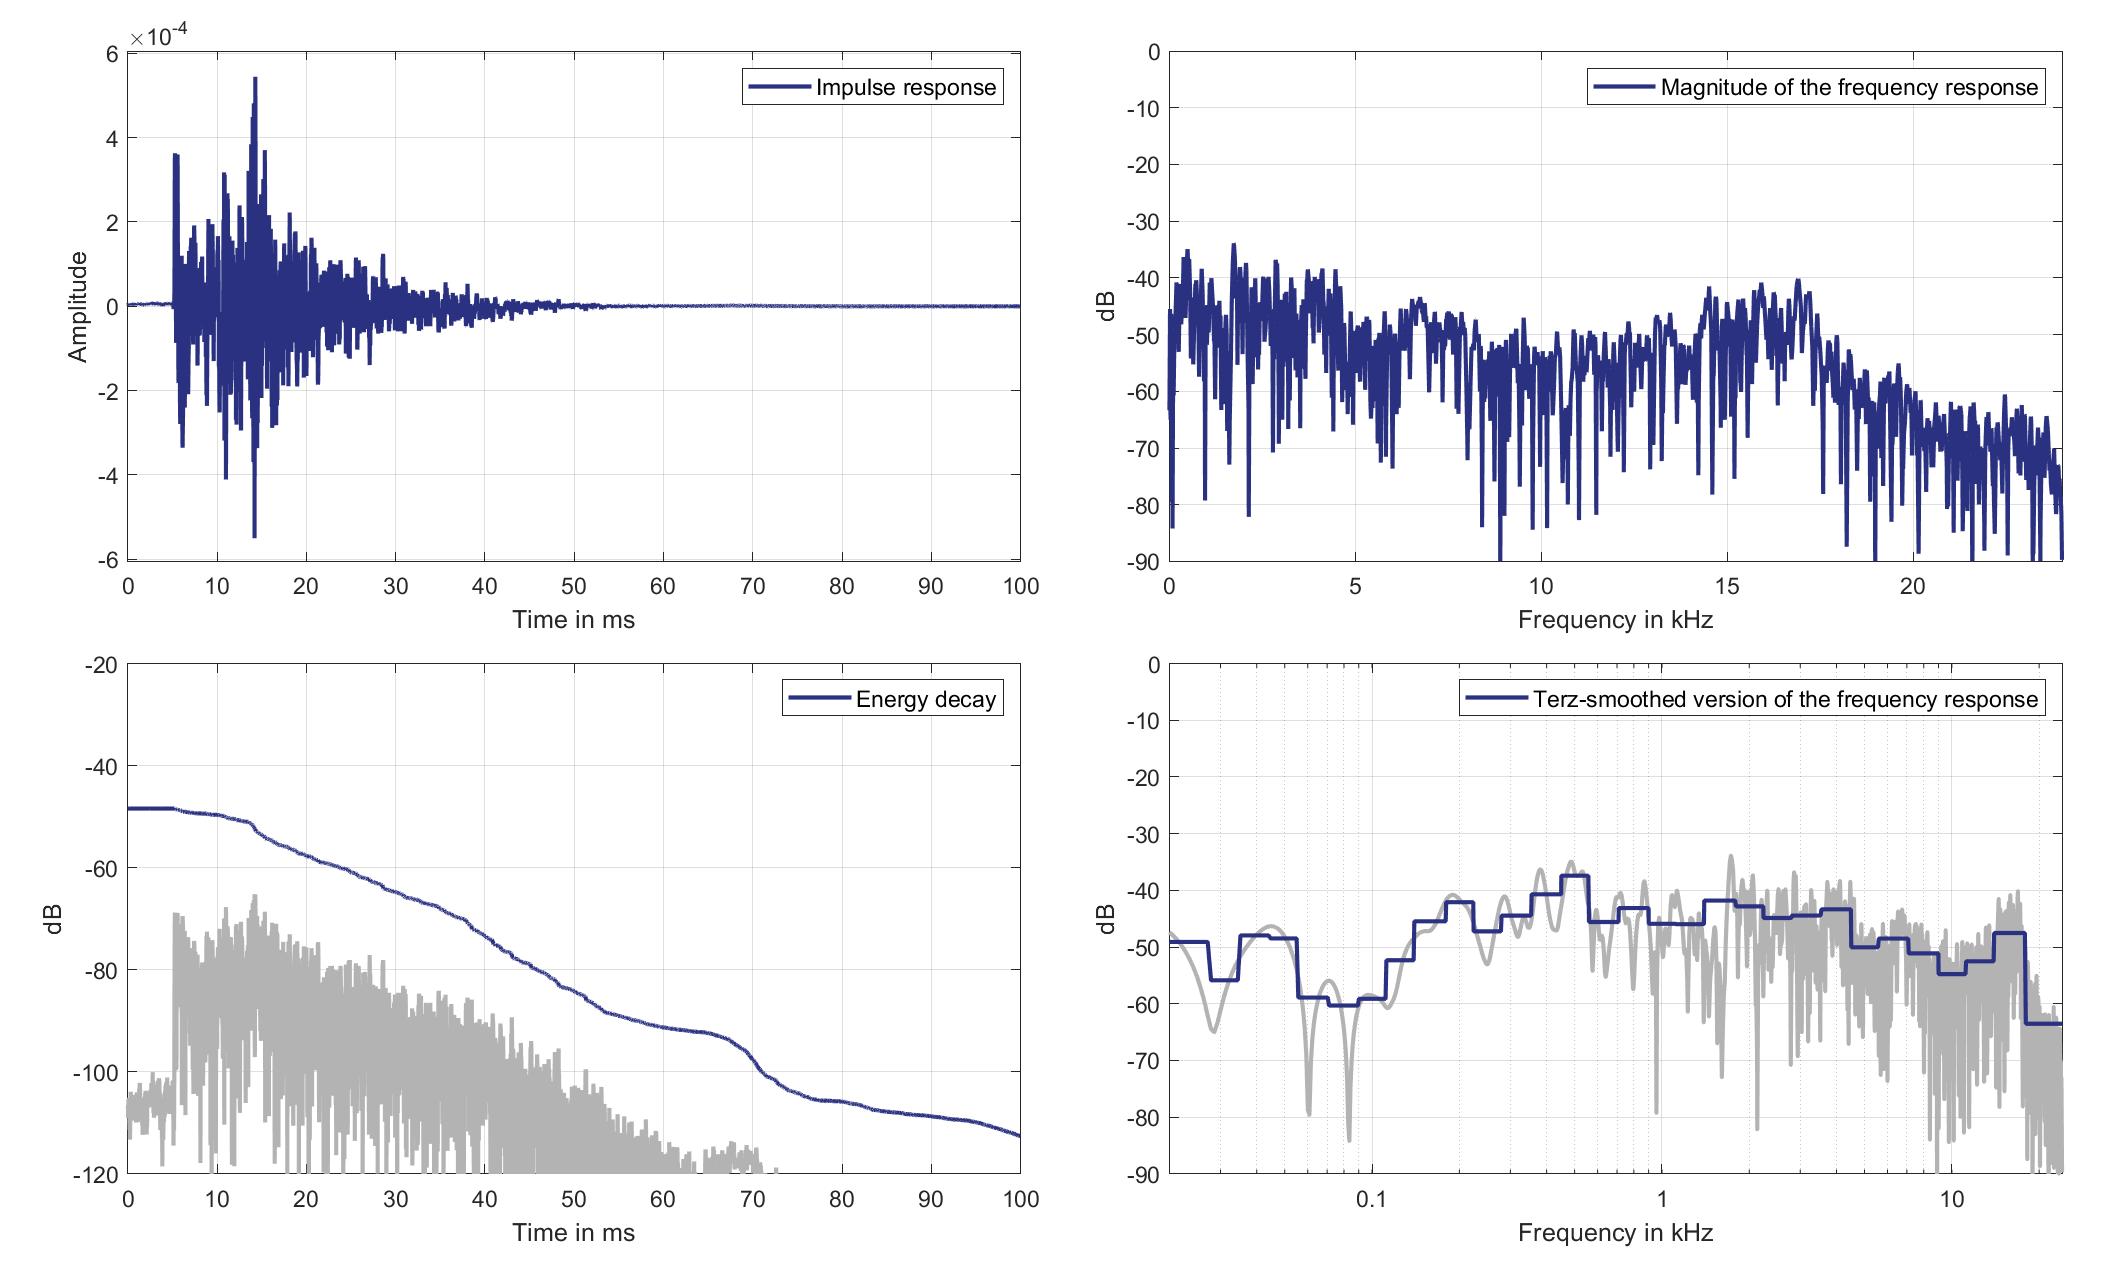
Download impulse response (in ".fir" format).
In the download section you can download all impulse response files as well as format explanation and Matlab as well as Python code examples for loading fir files.
Lsps. 2/3
Mics. 19/20
Left lsp. - left ear mic.
Left Headrest Loudspeaker of Zone 2 (Lsp. 2) to Left Ear Microphone of Zone 1 (Mic. 19)
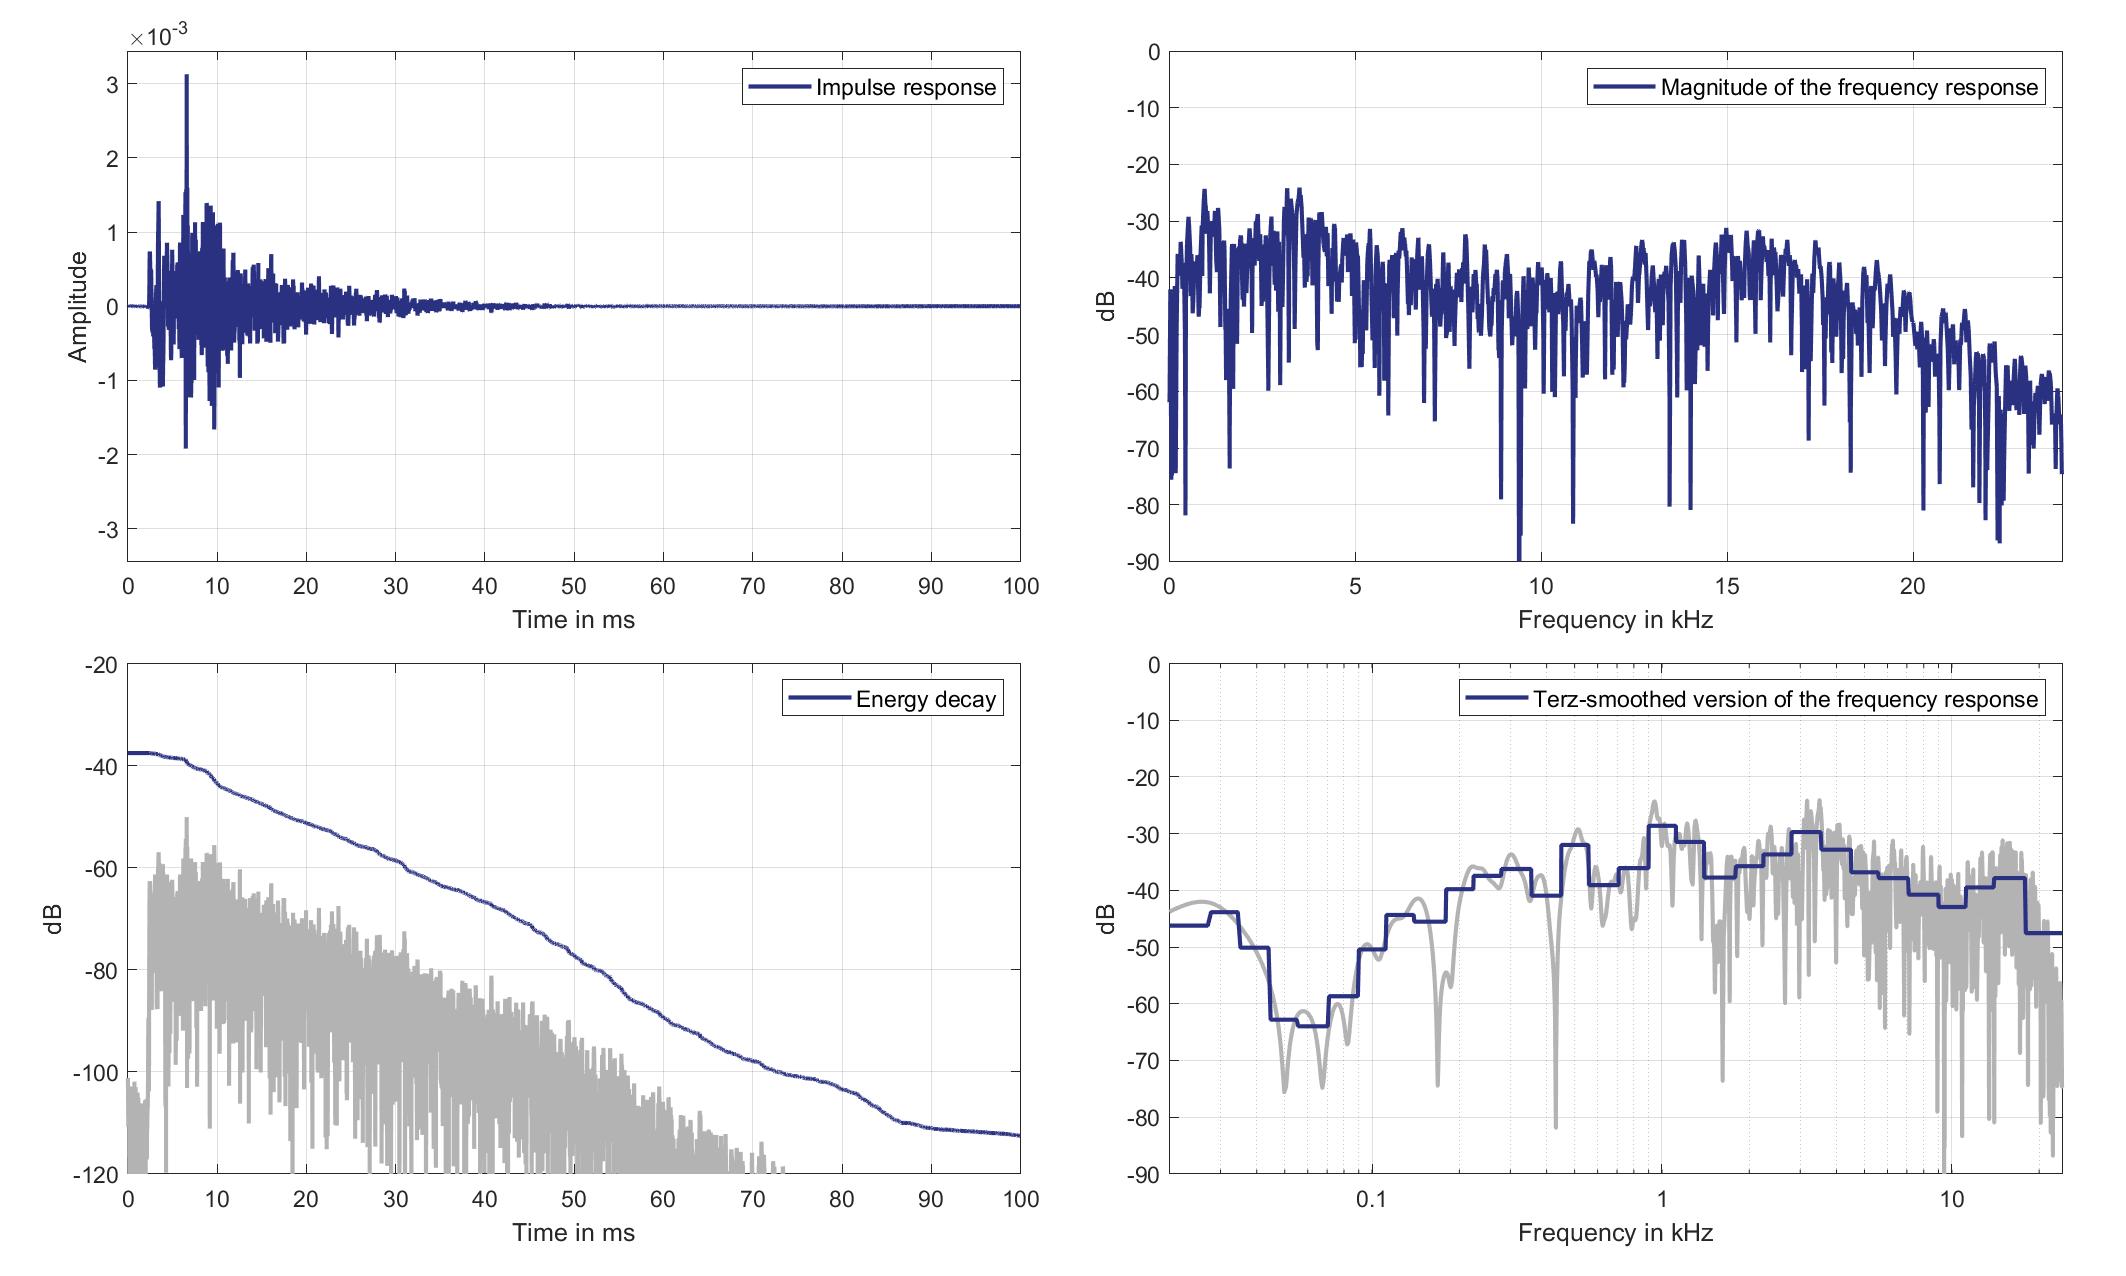
Download impulse response (in ".fir" format).
In the download section you can download all impulse response files as well as format explanation and Matlab as well as Python code examples for loading fir files.
Left lsp. - Right ear mic.
Left Headrest Loudspeaker of Zone 2 (Lsp. 2) to Right Ear Microphone of Zone 1 (Mic. 20)
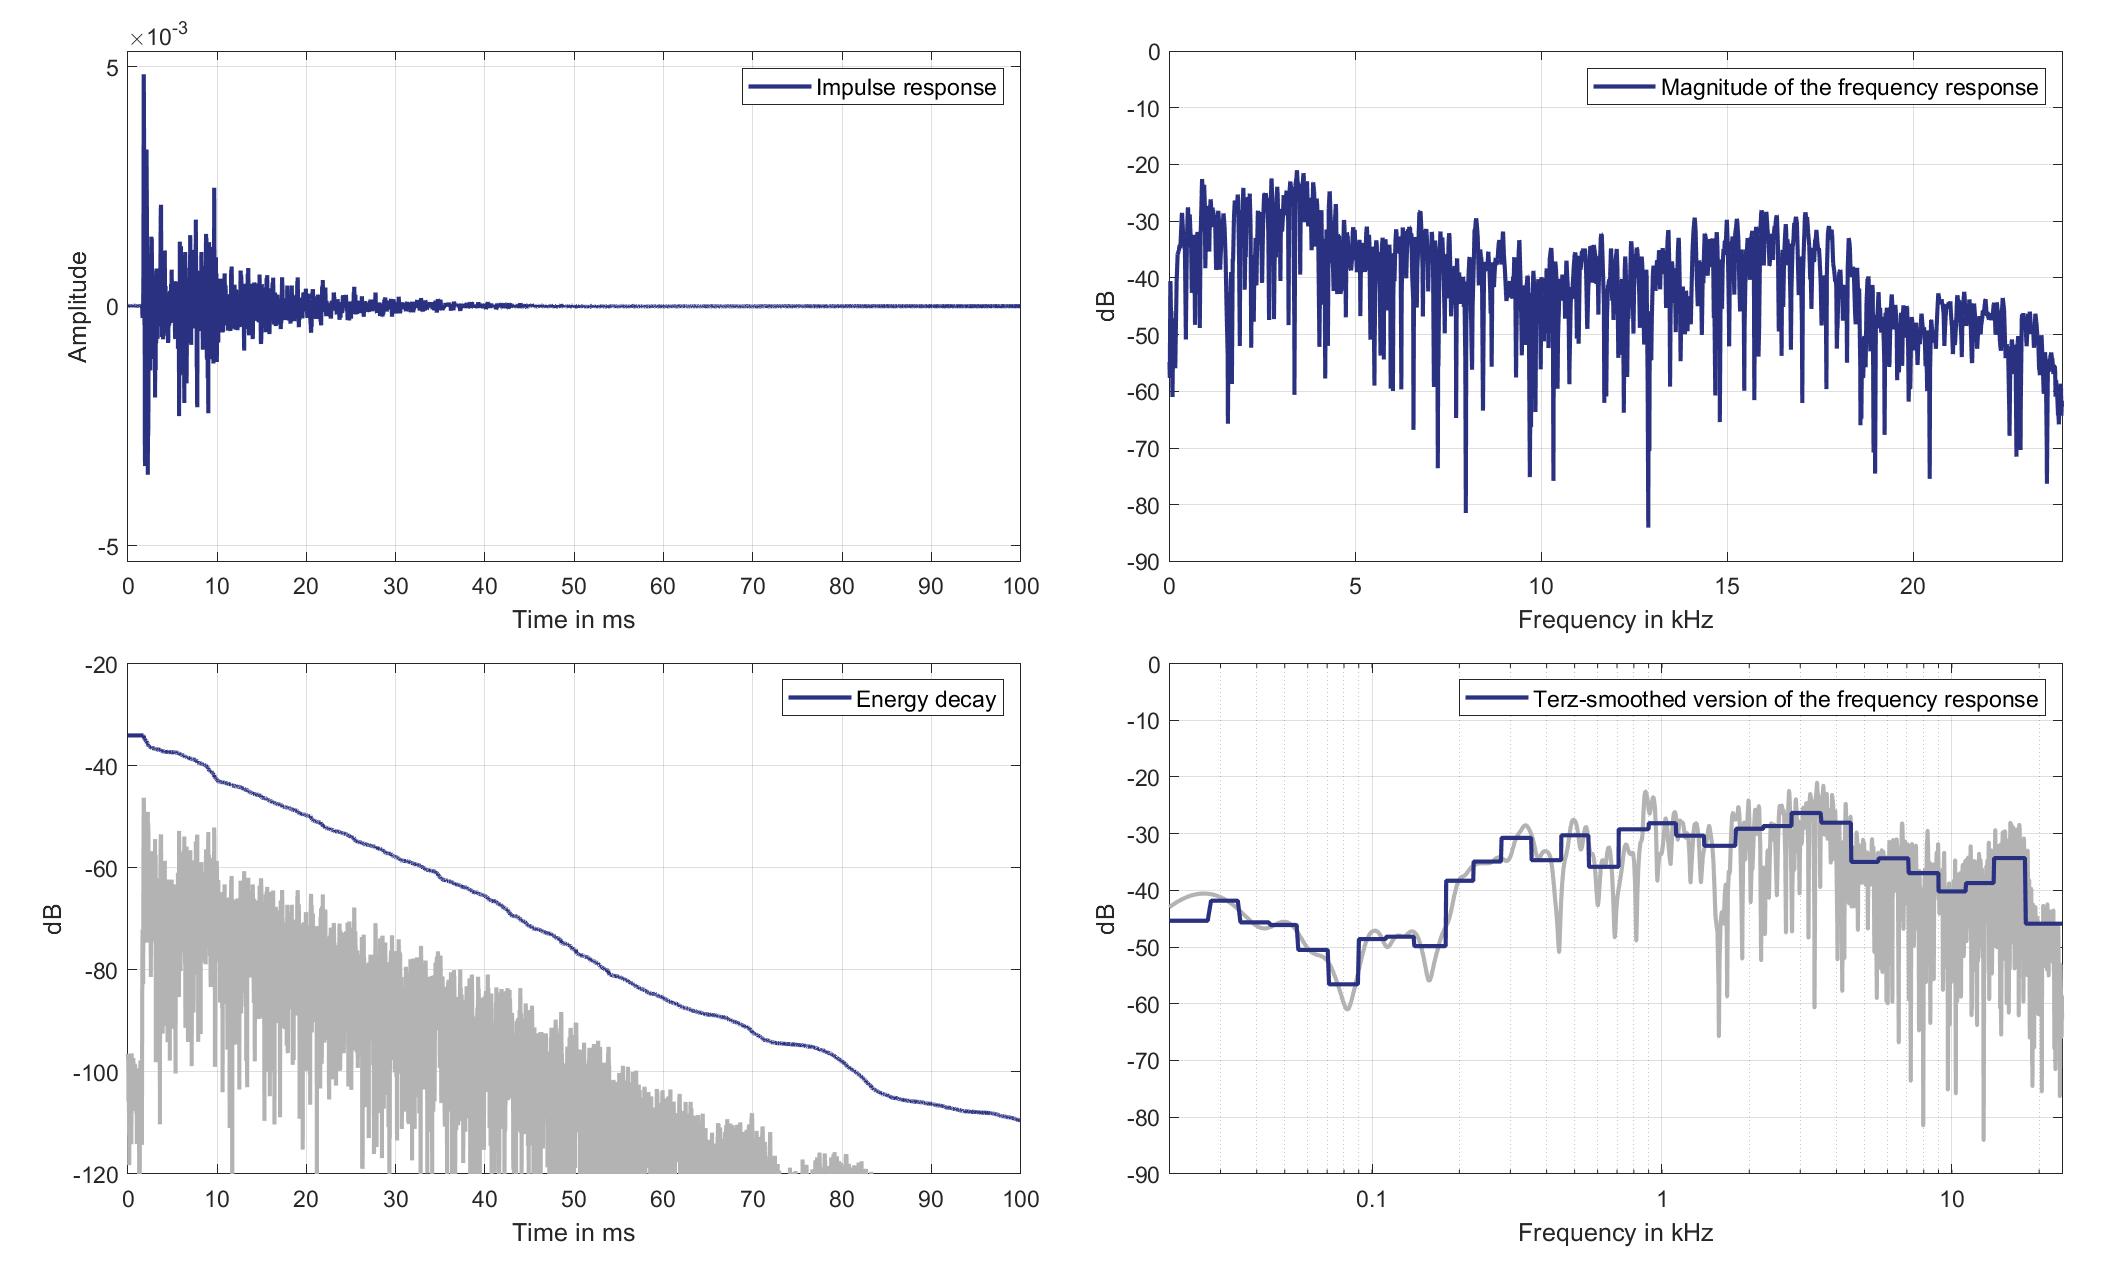
Download impulse response (in ".fir" format).
In the download section you can download all impulse response files as well as format explanation and Matlab as well as Python code examples for loading fir files.
Right lsp. - left ear mic.
Right Headrest Loudspeaker of Zone 2 (Lsp. 3) to Left Ear Microphone of Zone 1 (Mic. 19)
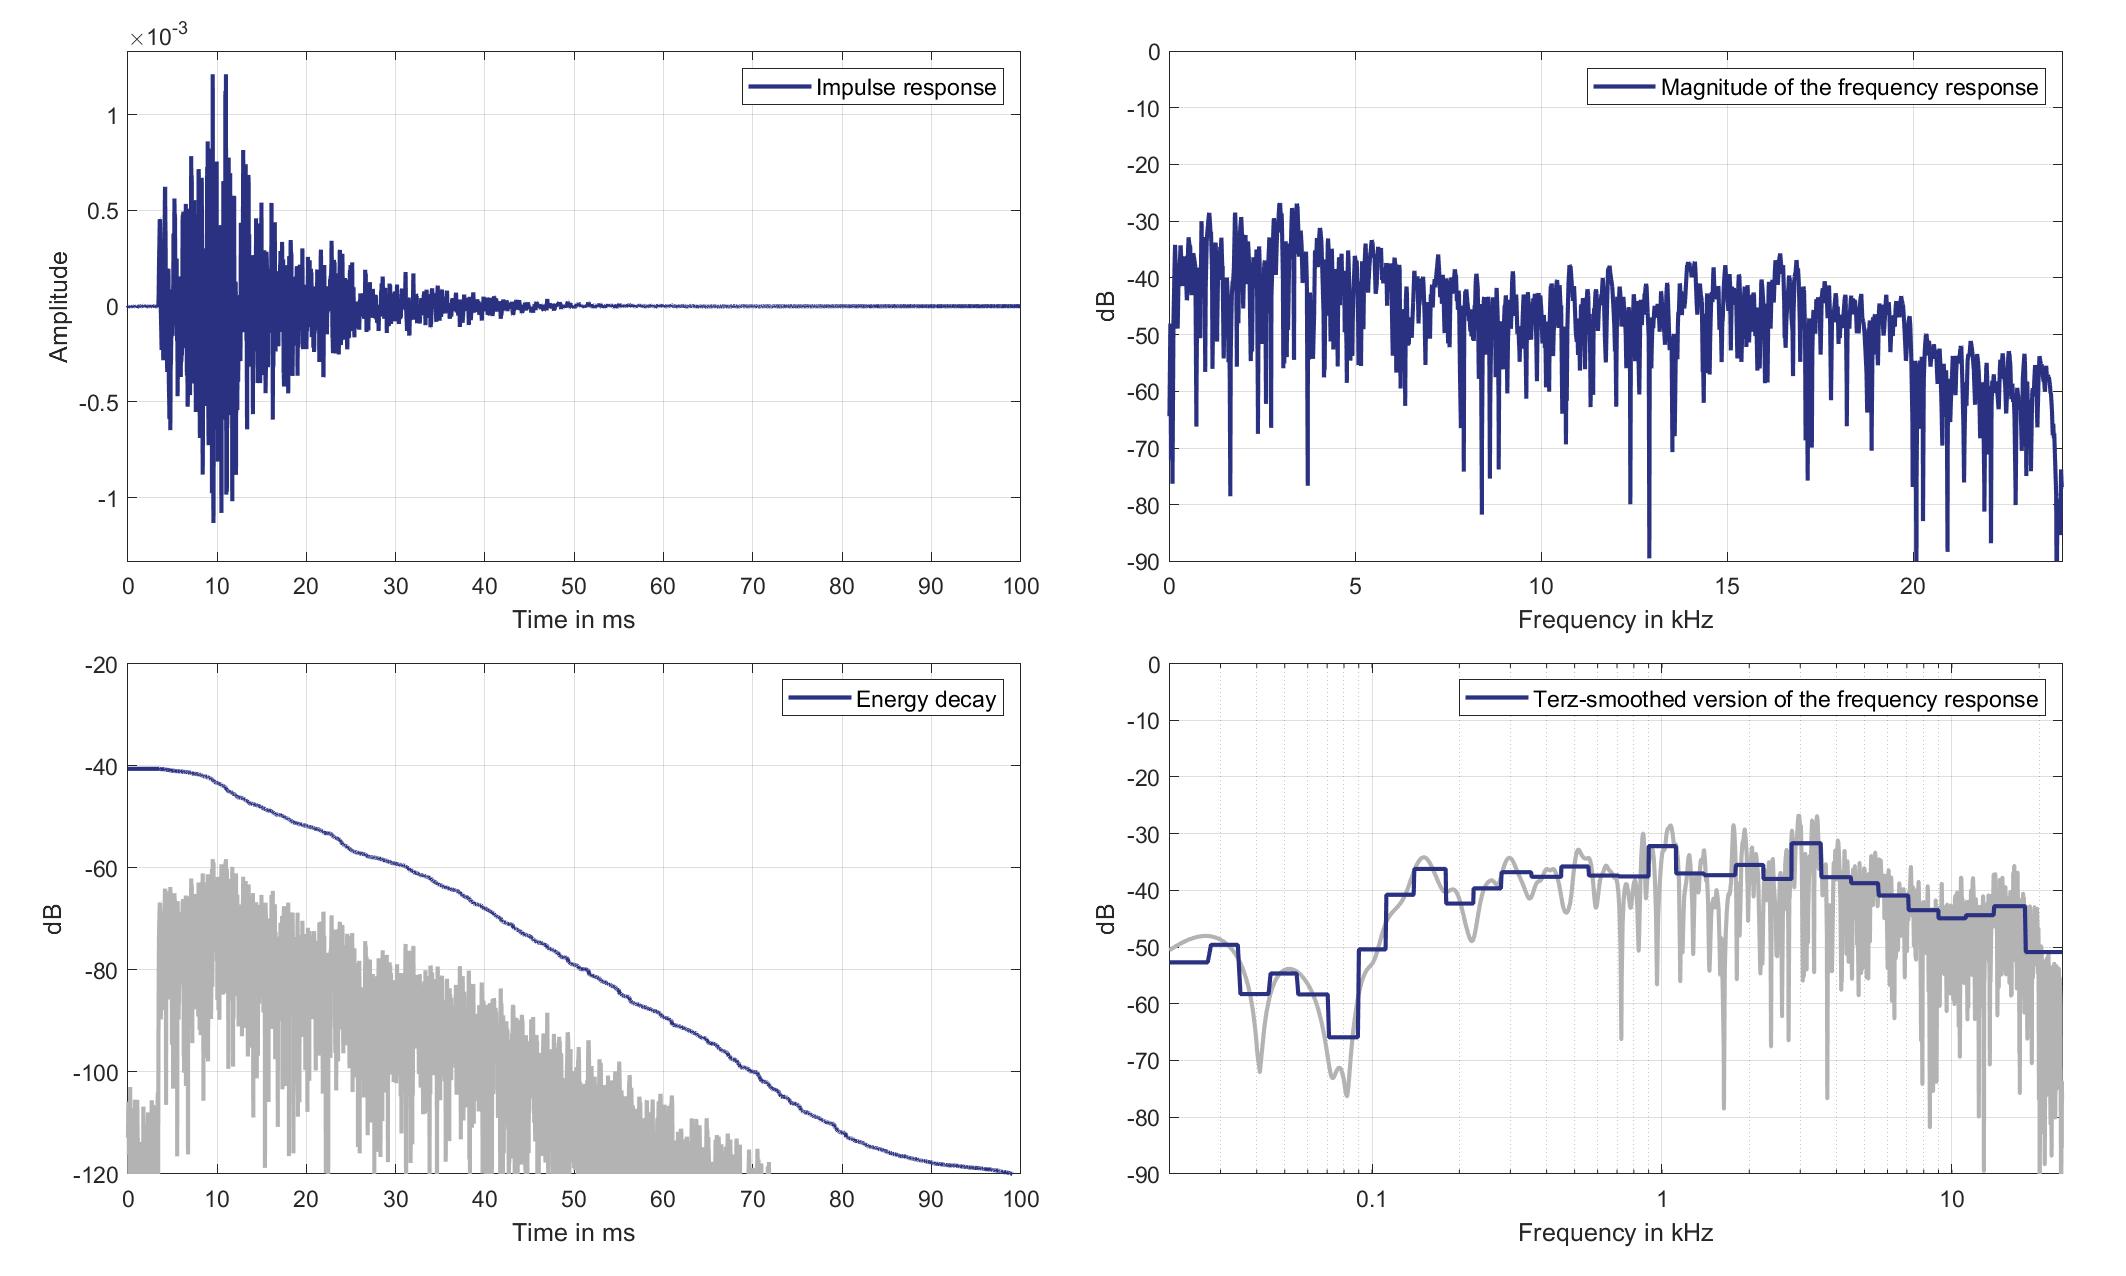
Download impulse response (in ".fir" format).
In the download section you can download all impulse response files as well as format explanation and Matlab as well as Python code examples for loading fir files.
Right lsp. - Right ear mic.
Right Headrest Loudspeaker of Zone 2 (Lsp. 3 to Right Ear Microphone of Zone 1 (Mic. 20)
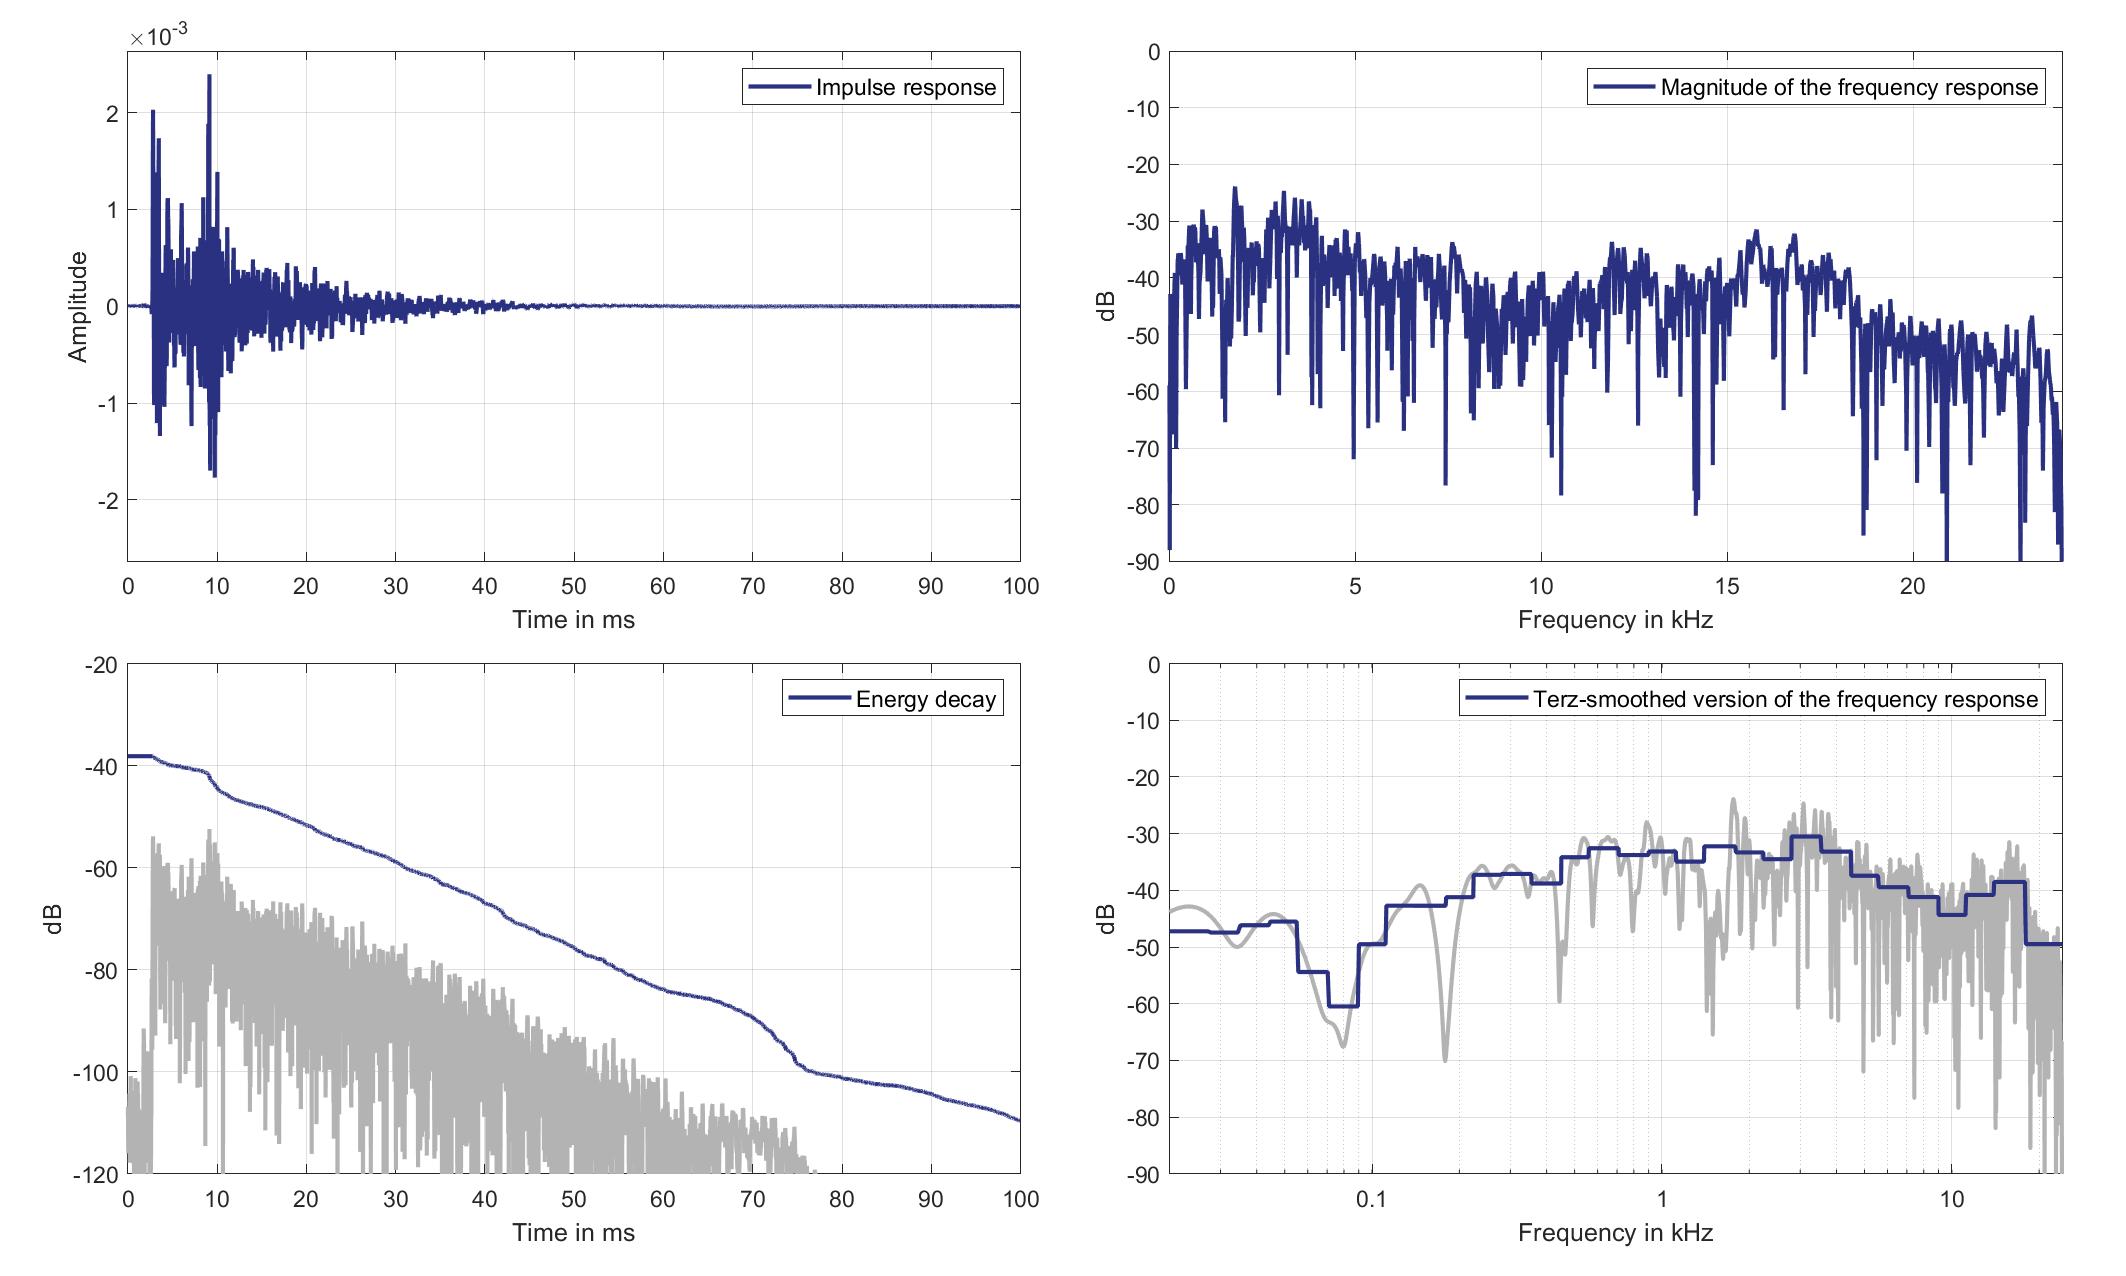
Download impulse response (in ".fir" format).
In the download section you can download all impulse response files as well as format explanation and Matlab as well as Python code examples for loading fir files.
Mics. 21/22
Left lsp. - left ear mic.
Left Headrest Loudspeaker of Zone 2 (Lsp. 2) to Left Ear Microphone of Zone 2 (Mic. 21)
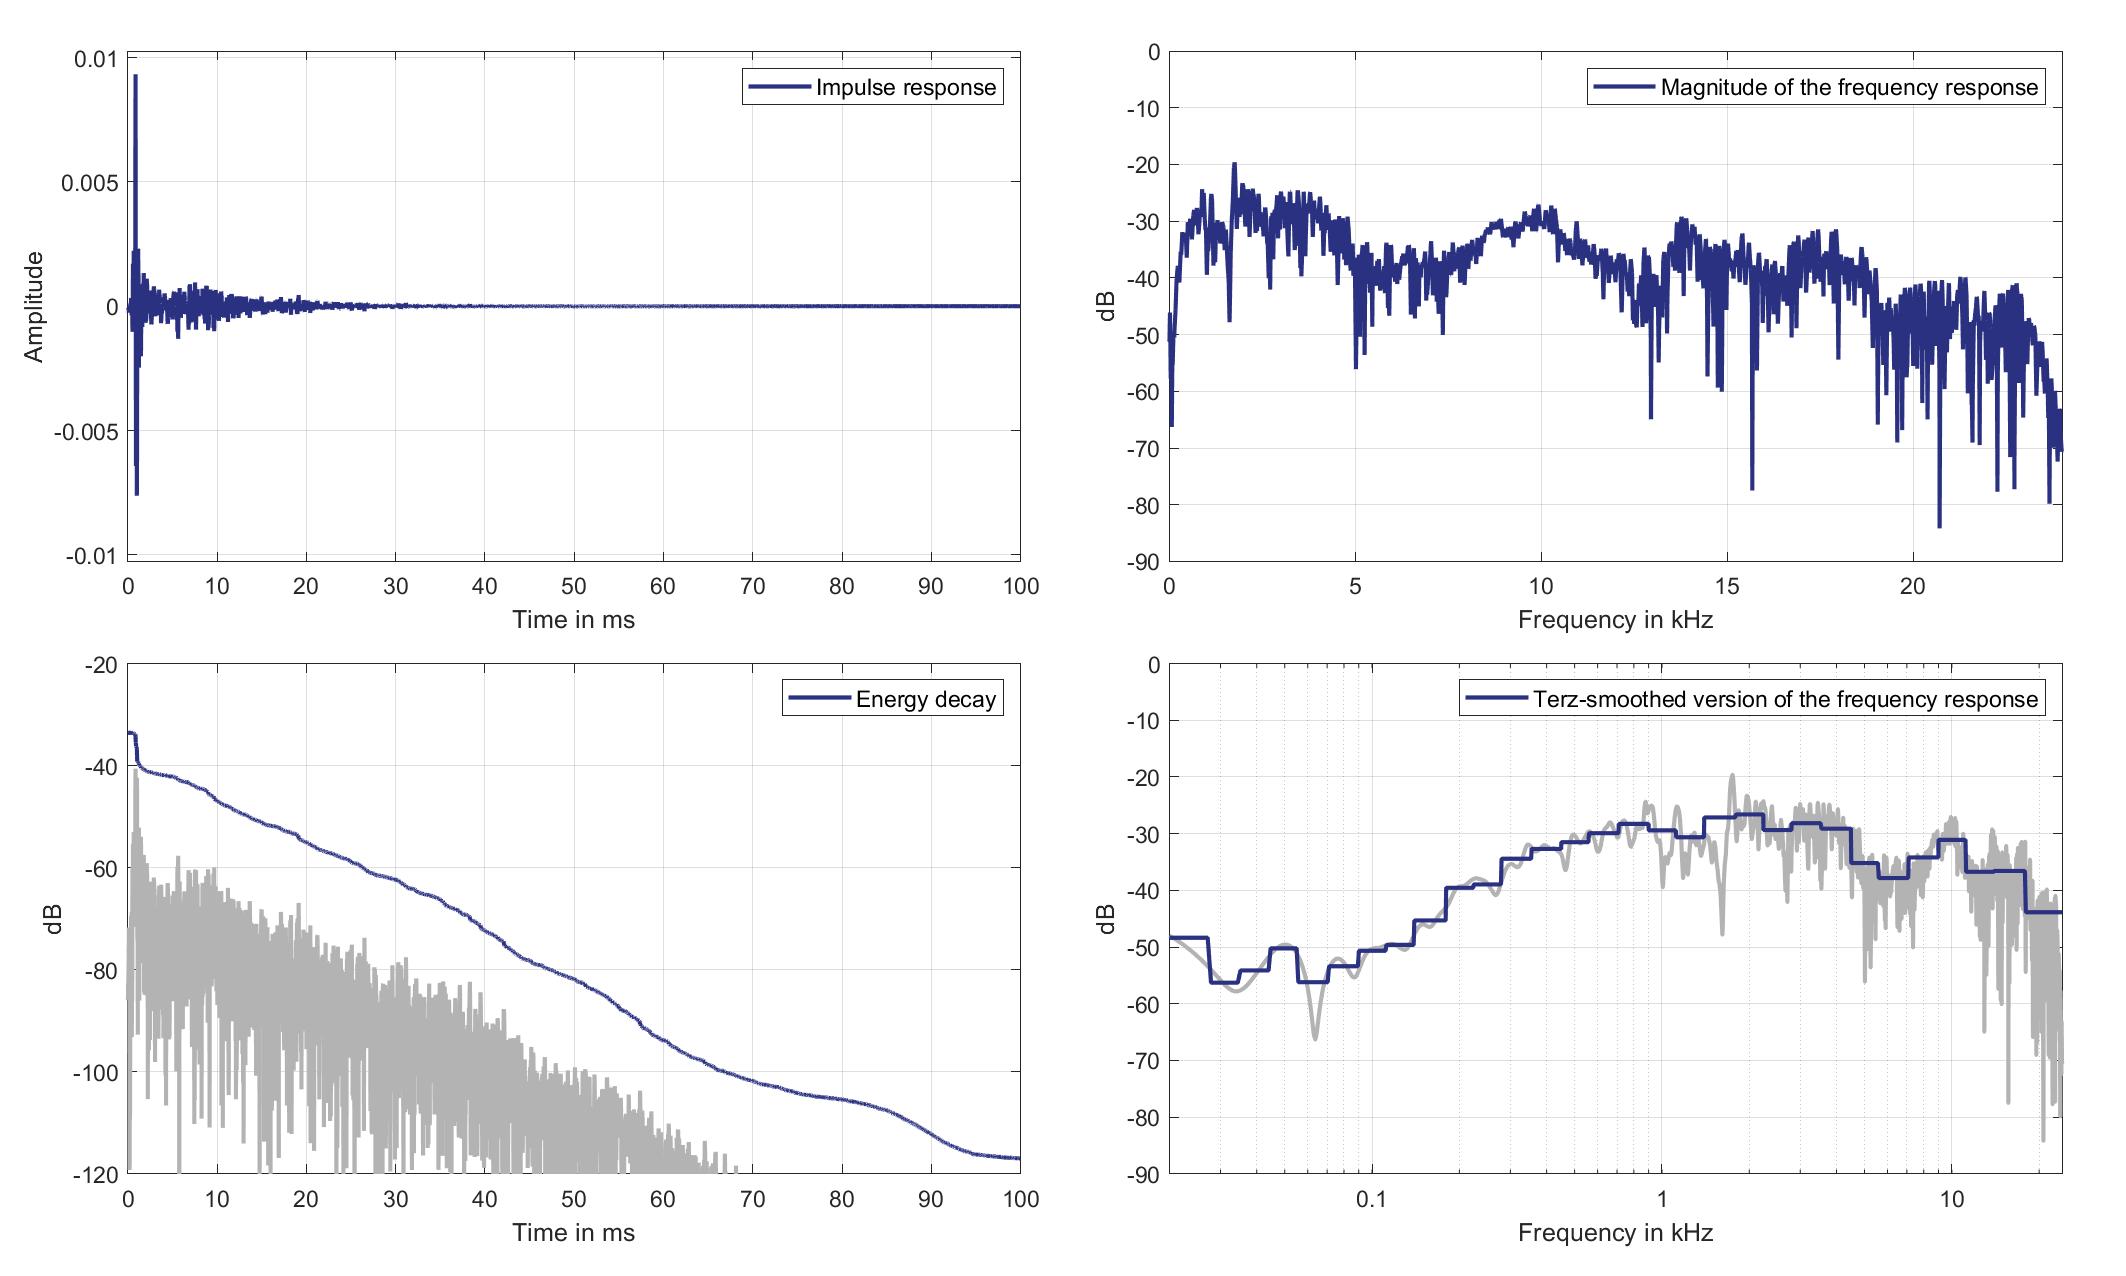
Download impulse response (in ".fir" format).
In the download section you can download all impulse response files as well as format explanation and Matlab as well as Python code examples for loading fir files.
Left lsp. - Right ear mic.
Left Headrest Loudspeaker of Zone 2 (Lsp. 2) to Right Ear Microphone of Zone 2 (Mic. 22)
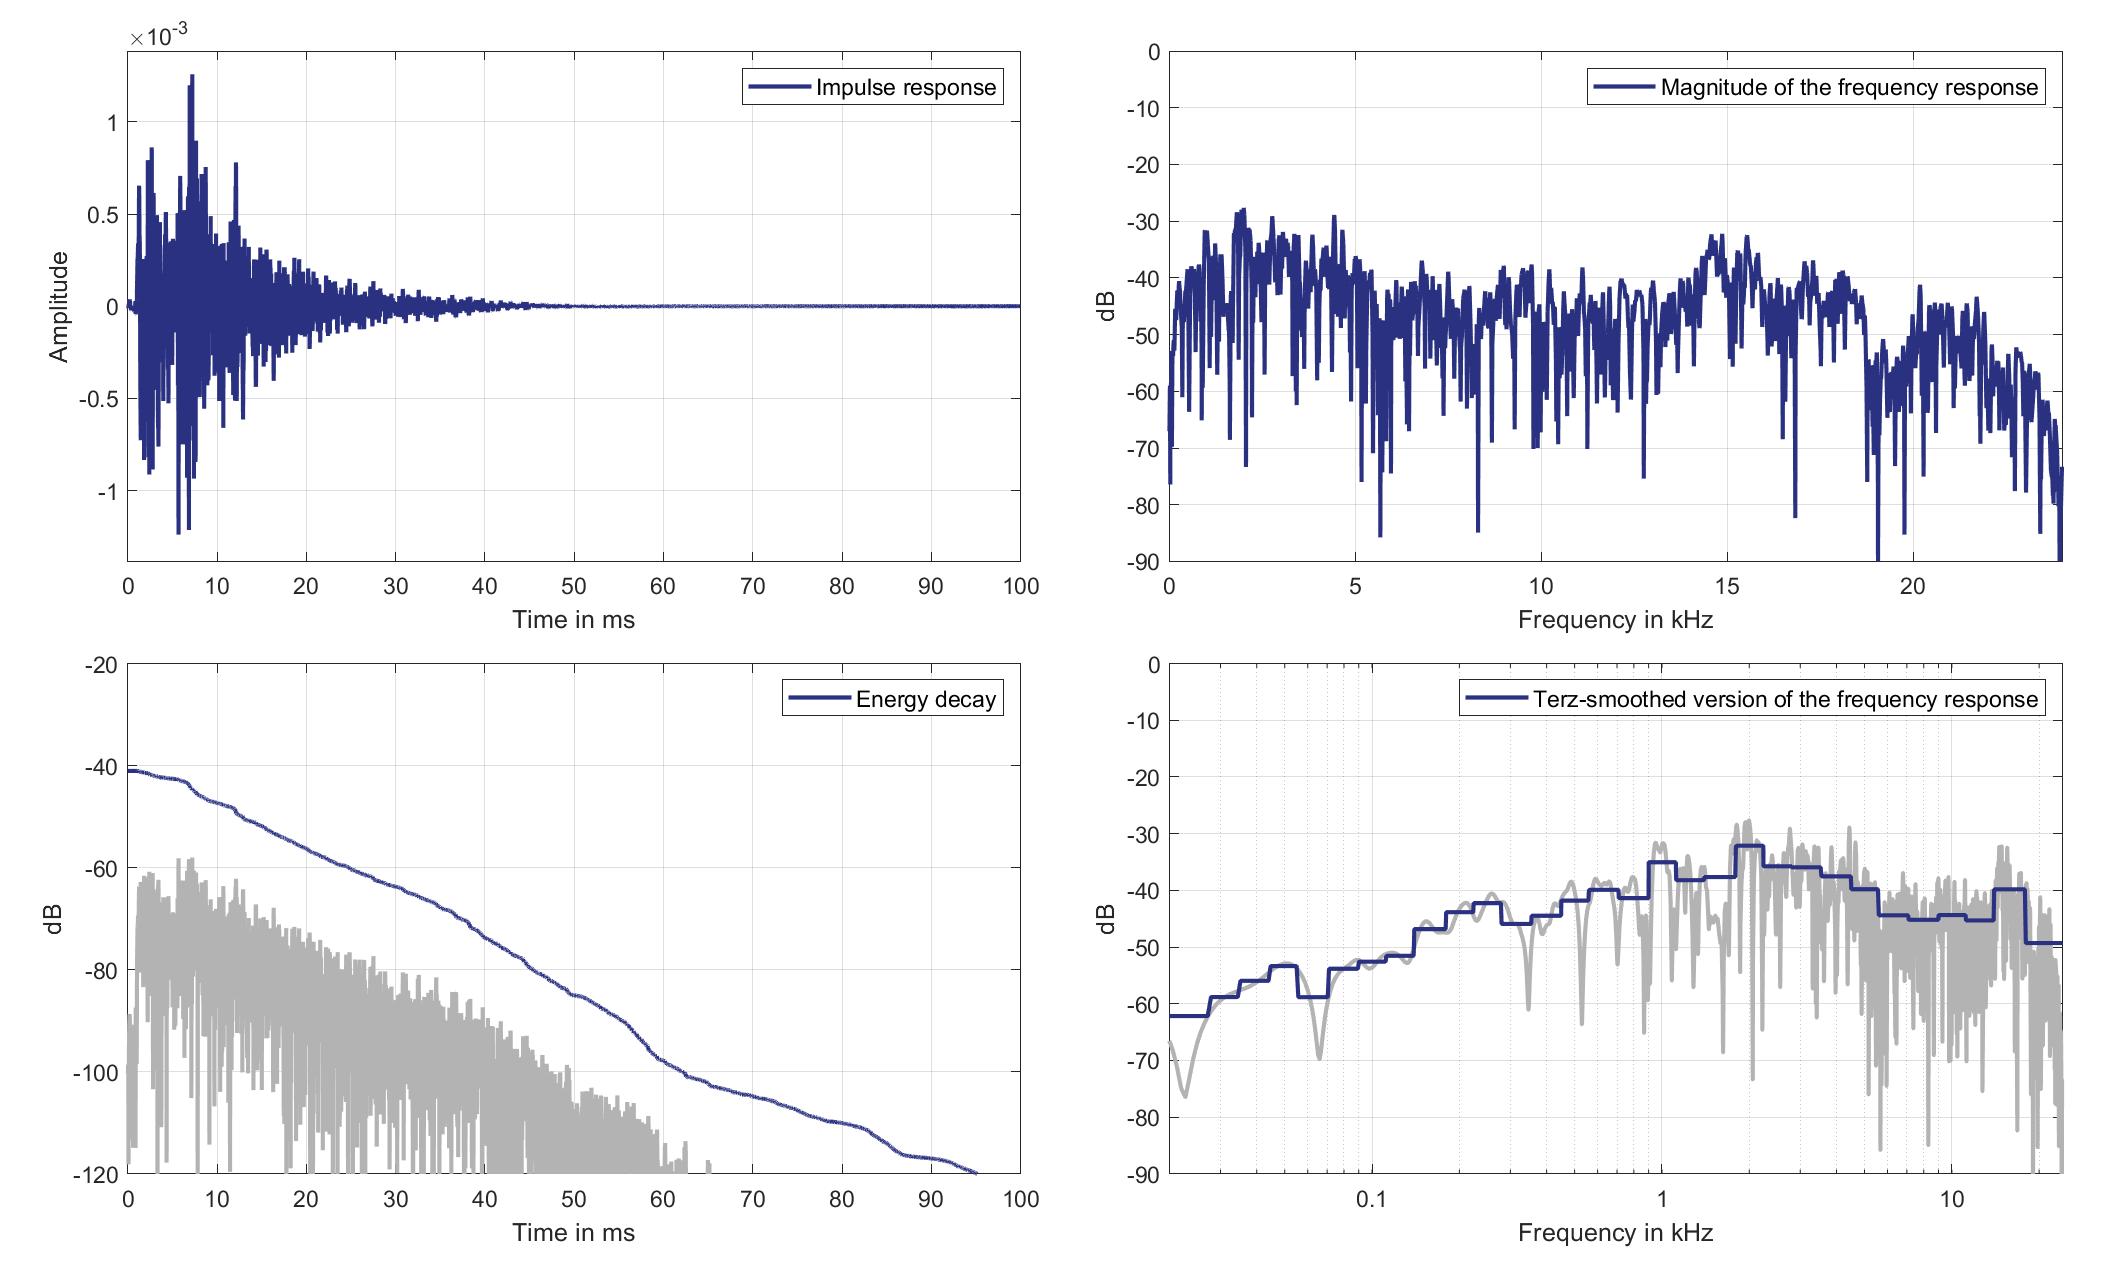
Download impulse response (in ".fir" format).
In the download section you can download all impulse response files as well as format explanation and Matlab as well as Python code examples for loading fir files.
Right lsp. - left ear mic.
Right Headrest Loudspeaker of Zone 2 (Lsp. 3) to Left Ear Microphone of Zone 2 (Mic. 21)
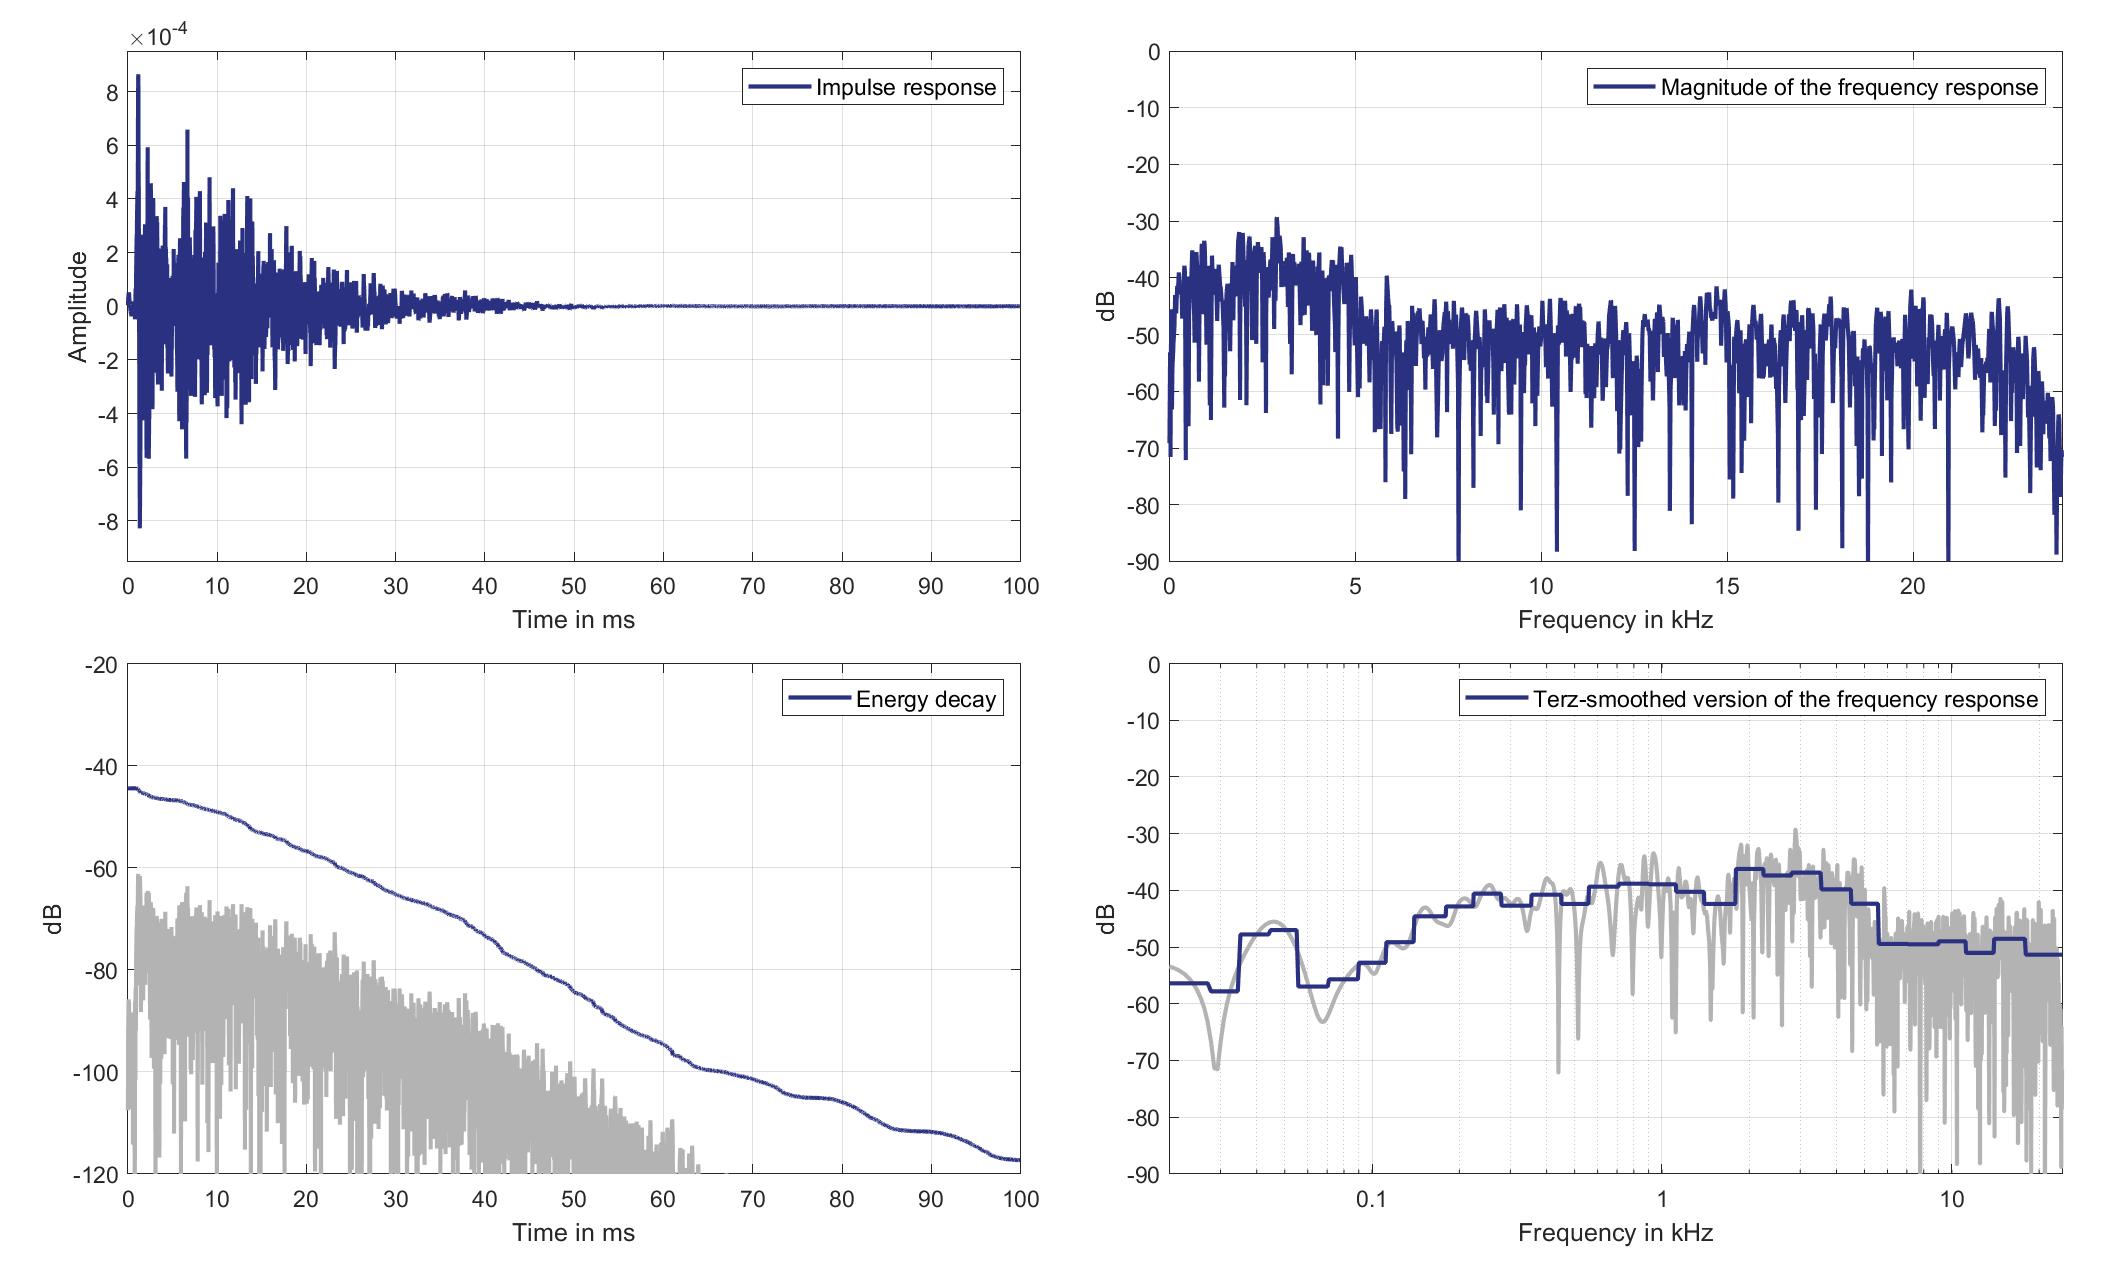
Download impulse response (in ".fir" format).
In the download section you can download all impulse response files as well as format explanation and Matlab as well as Python code examples for loading fir files.
Right lsp. - Right ear mic.
Right Headrest Loudspeaker of Zone 2 (Lsp. 3 to Right Ear Microphone of Zone 2 (Mic. 22)
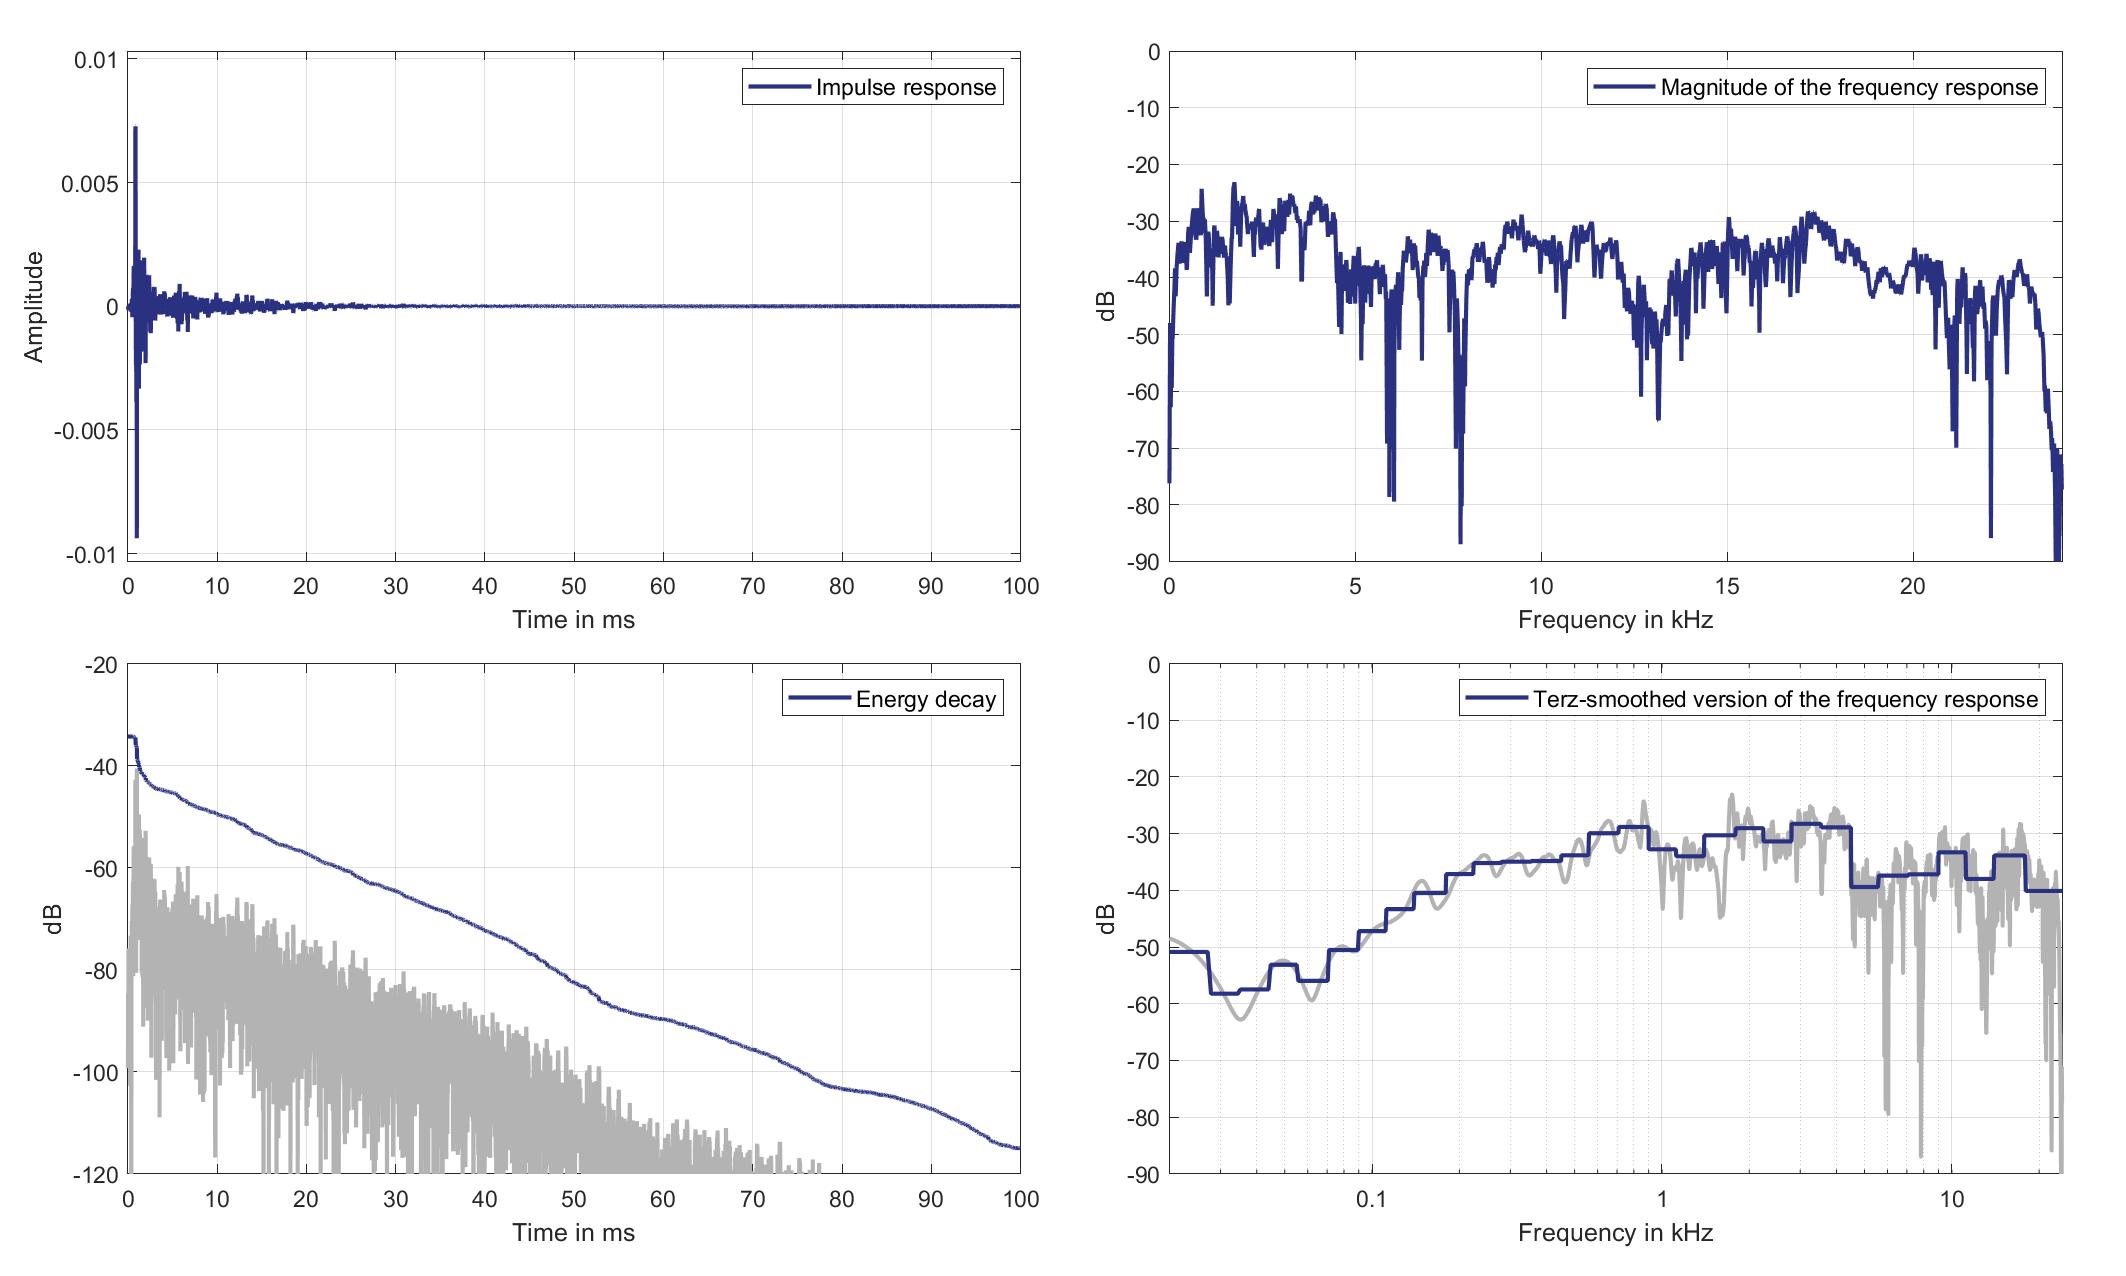
Download impulse response (in ".fir" format).
In the download section you can download all impulse response files as well as format explanation and Matlab as well as Python code examples for loading fir files.
Mics. 23/24
Left lsp. - left ear mic.
Left Headrest Loudspeaker of Zone 2 (Lsp. 2) to Left Ear Microphone of Zone 3 (Mic. 23)
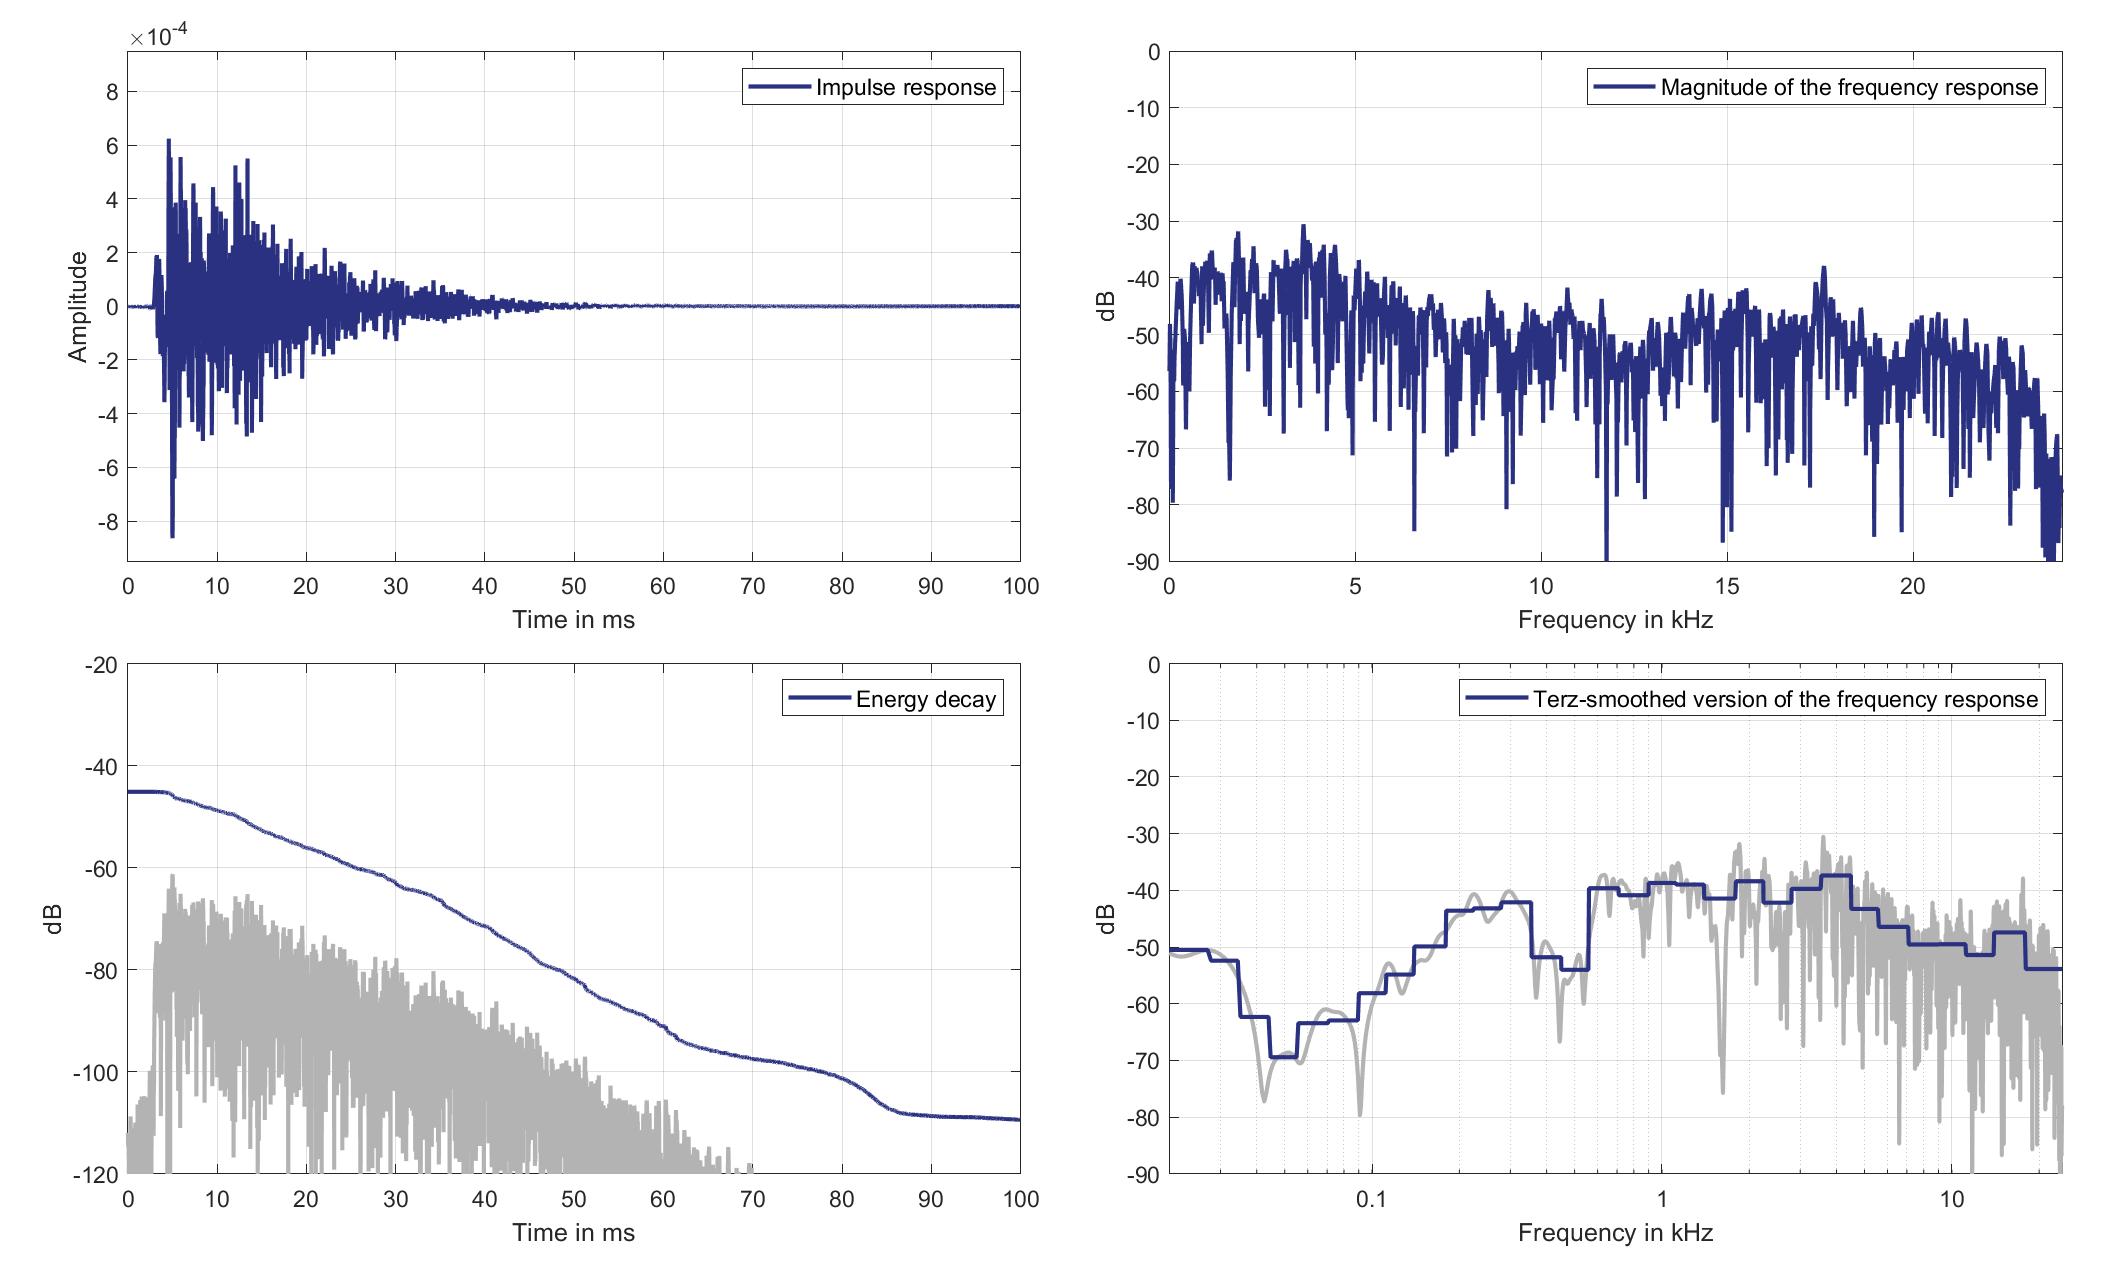
Download impulse response (in ".fir" format).
In the download section you can download all impulse response files as well as format explanation and Matlab as well as Python code examples for loading fir files.
Left lsp. - Right ear mic.
Left Headrest Loudspeaker of Zone 2 (Lsp. 2) to Right Ear Microphone of Zone 3 (Mic. 24)
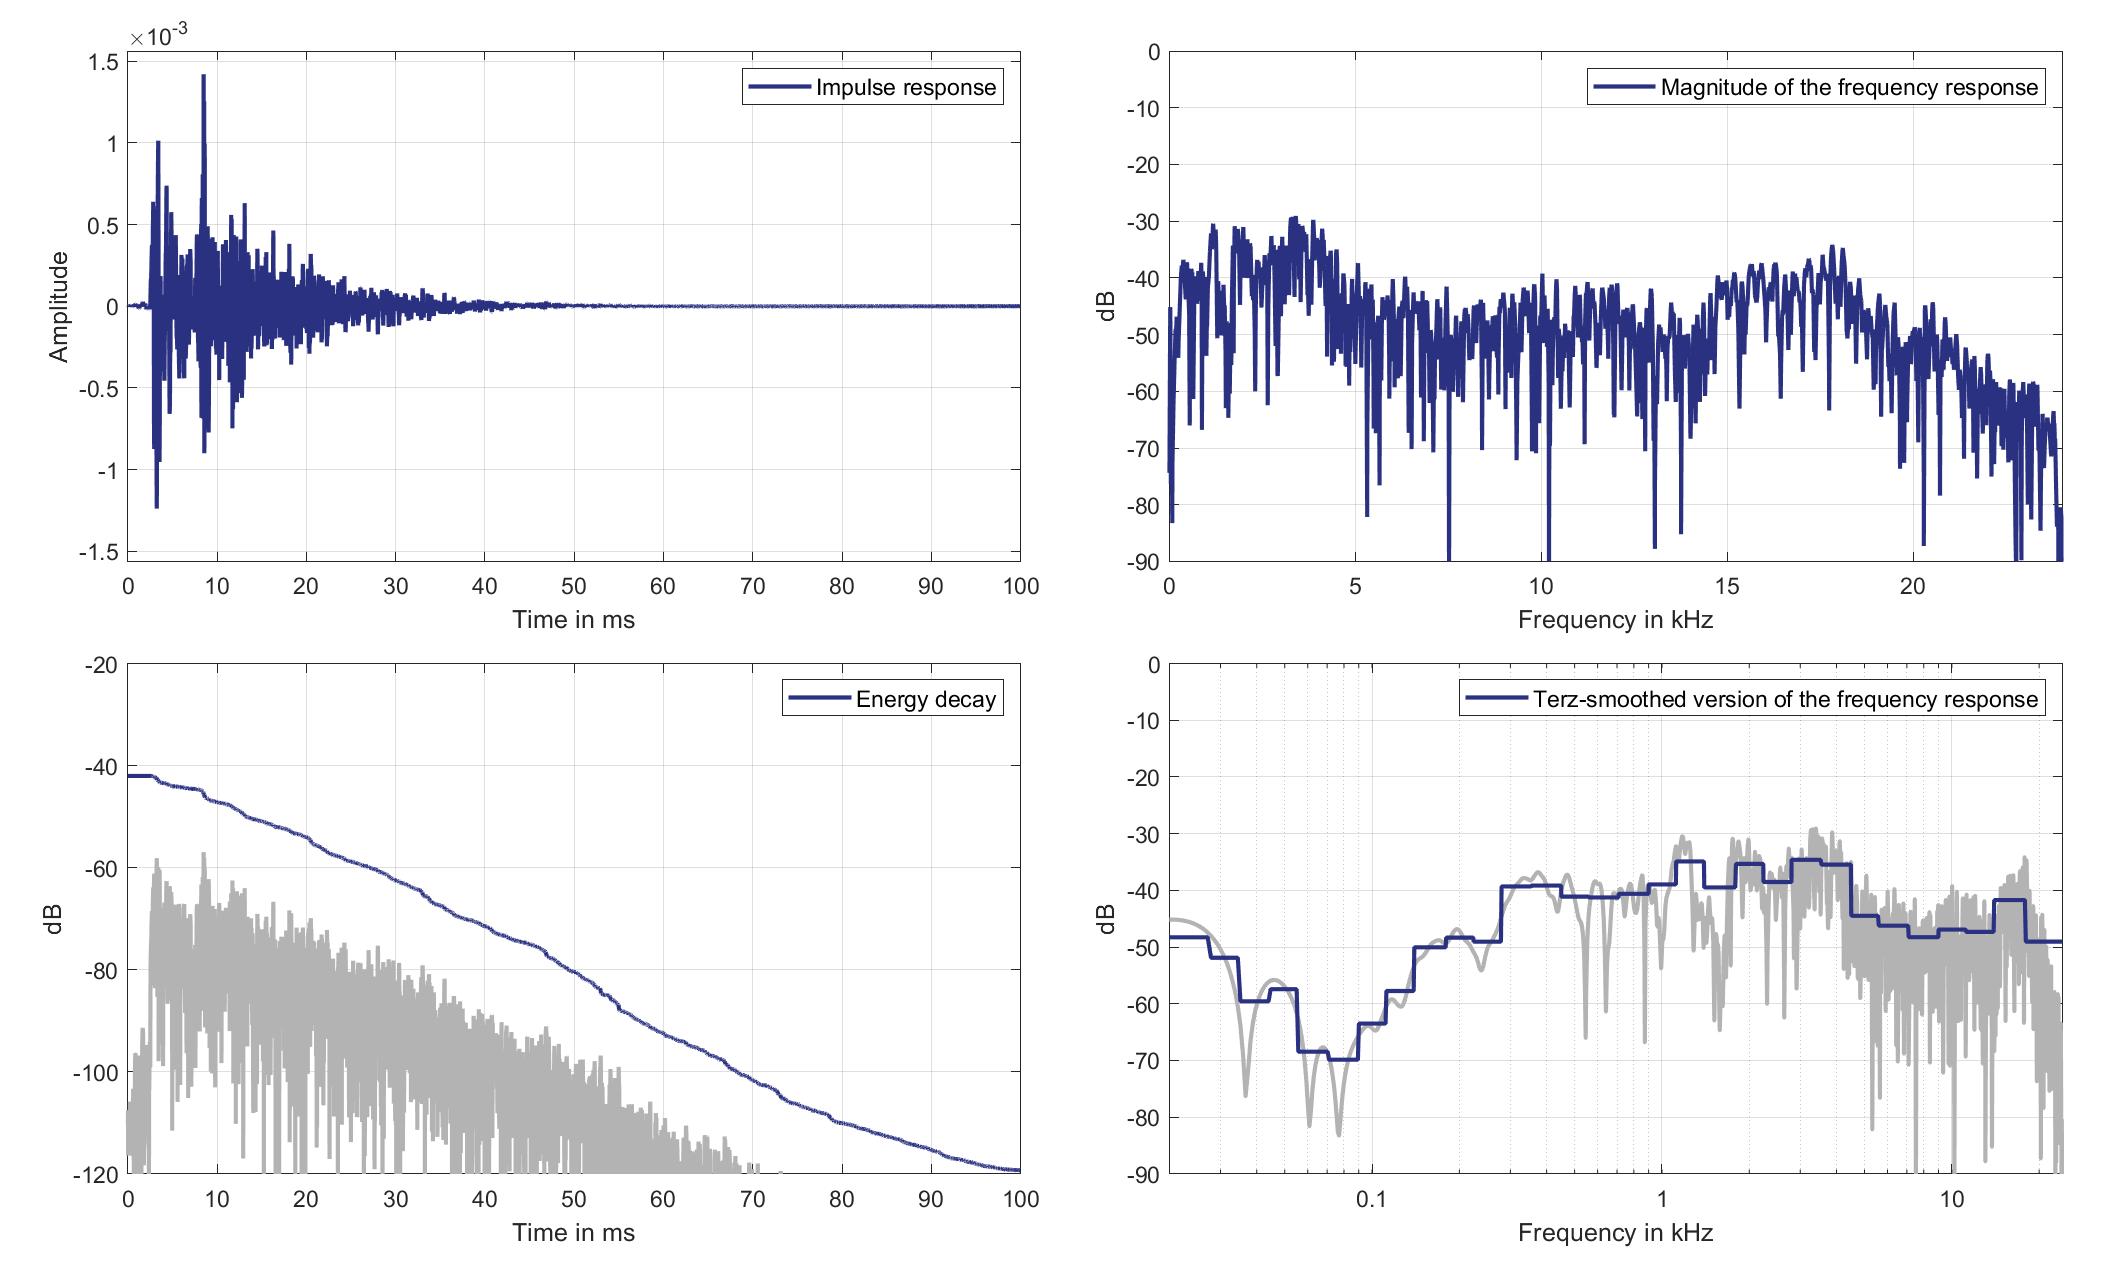
Download impulse response (in ".fir" format).
In the download section you can download all impulse response files as well as format explanation and Matlab as well as Python code examples for loading fir files.
Right lsp. - left ear mic.
Right Headrest Loudspeaker of Zone 2 (Lsp. 3) to Left Ear Microphone of Zone 3 (Mic. 23)
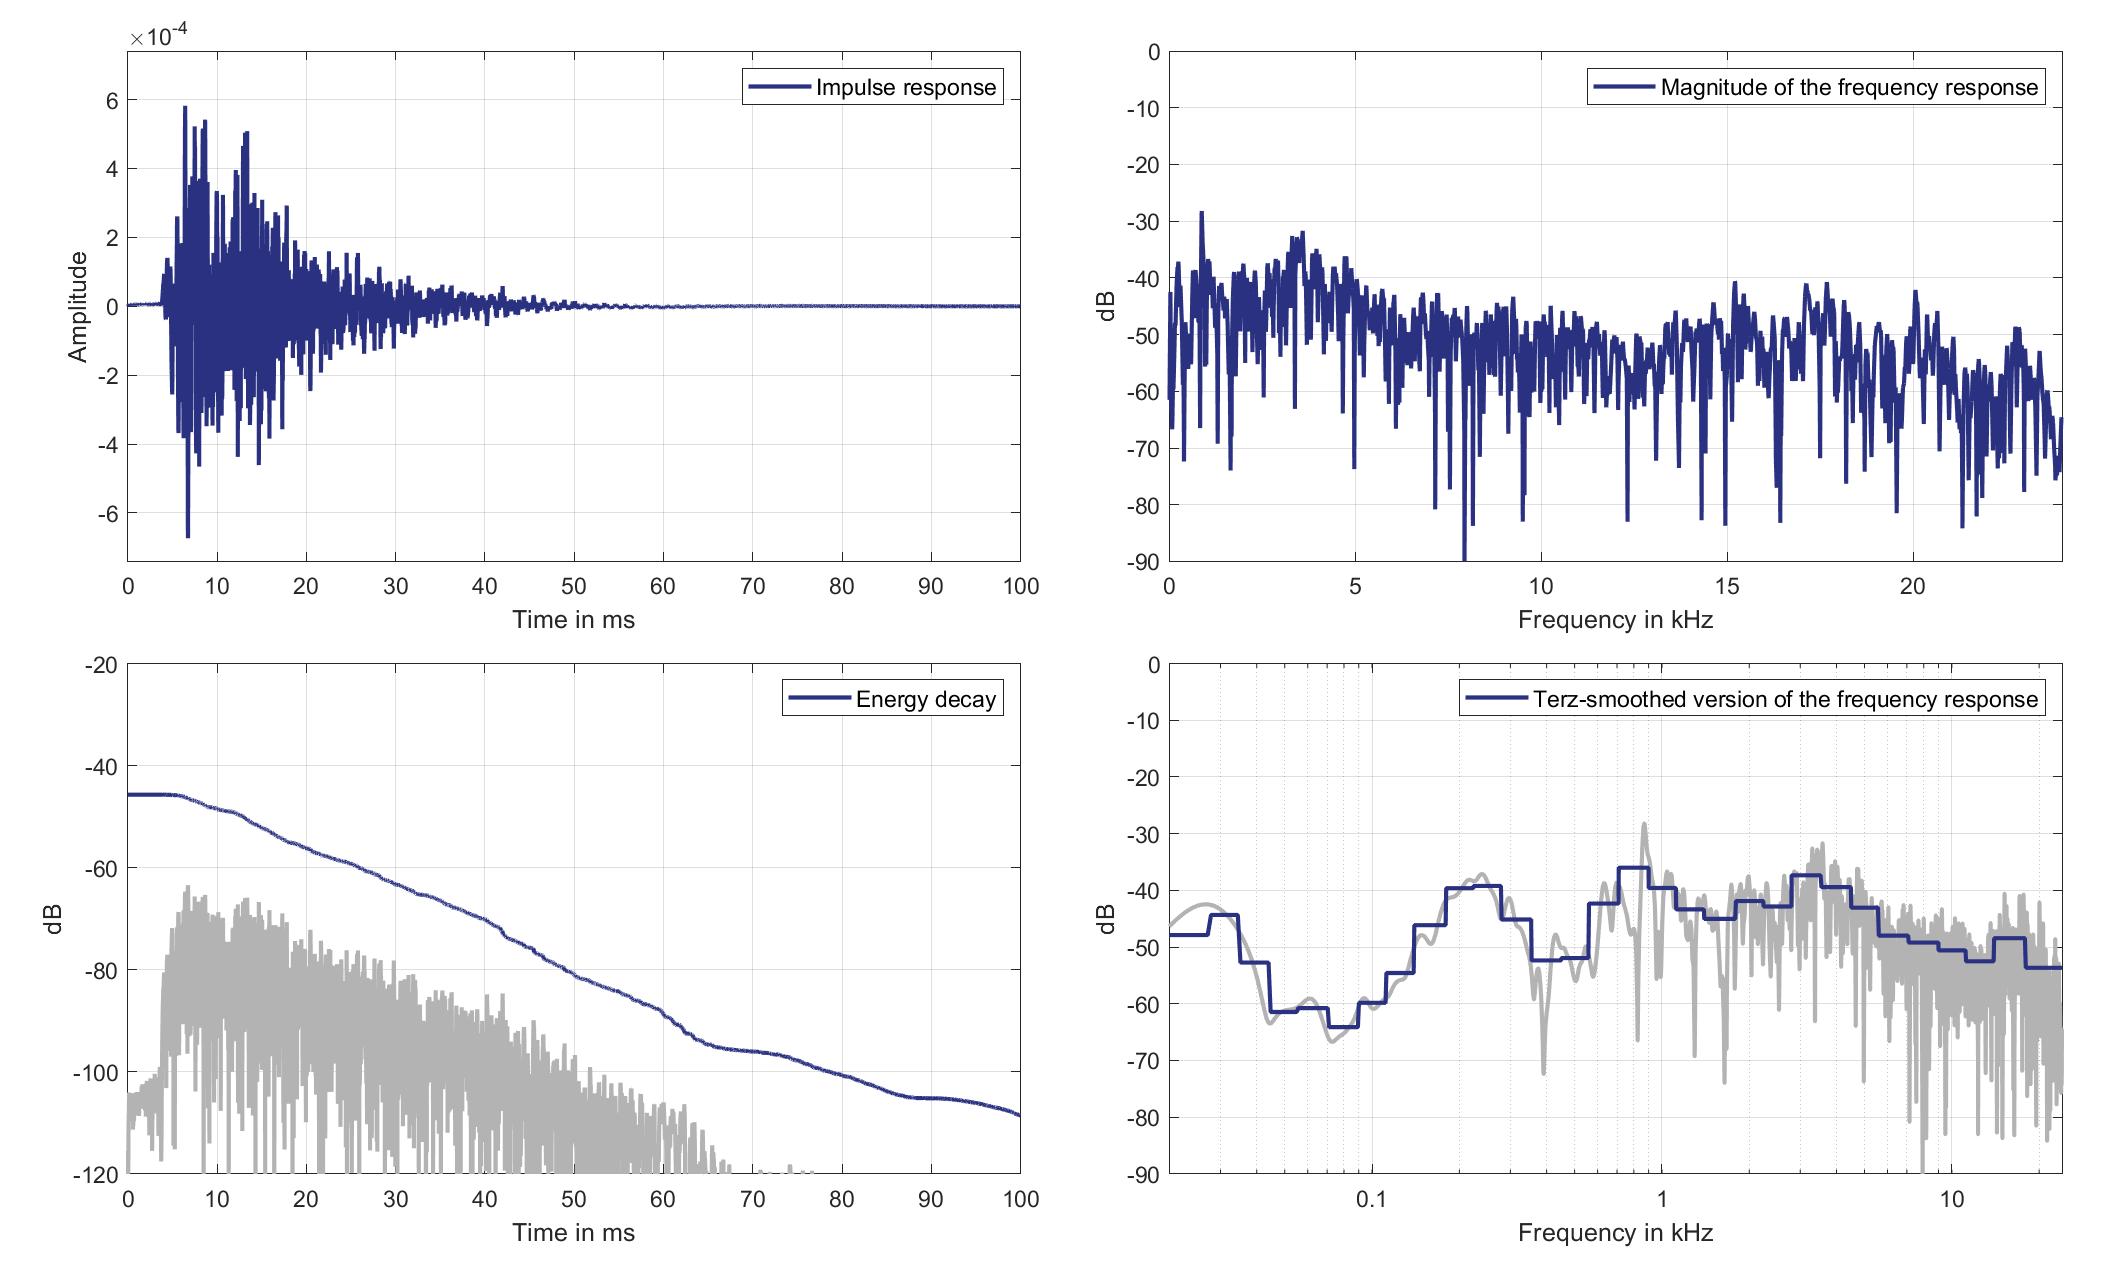
Download impulse response (in ".fir" format).
In the download section you can download all impulse response files as well as format explanation and Matlab as well as Python code examples for loading fir files.
Right lsp. - Right ear mic.
Right Headrest Loudspeaker of Zone 2 (Lsp. 3 to Right Ear Microphone of Zone 3 (Mic. 24)
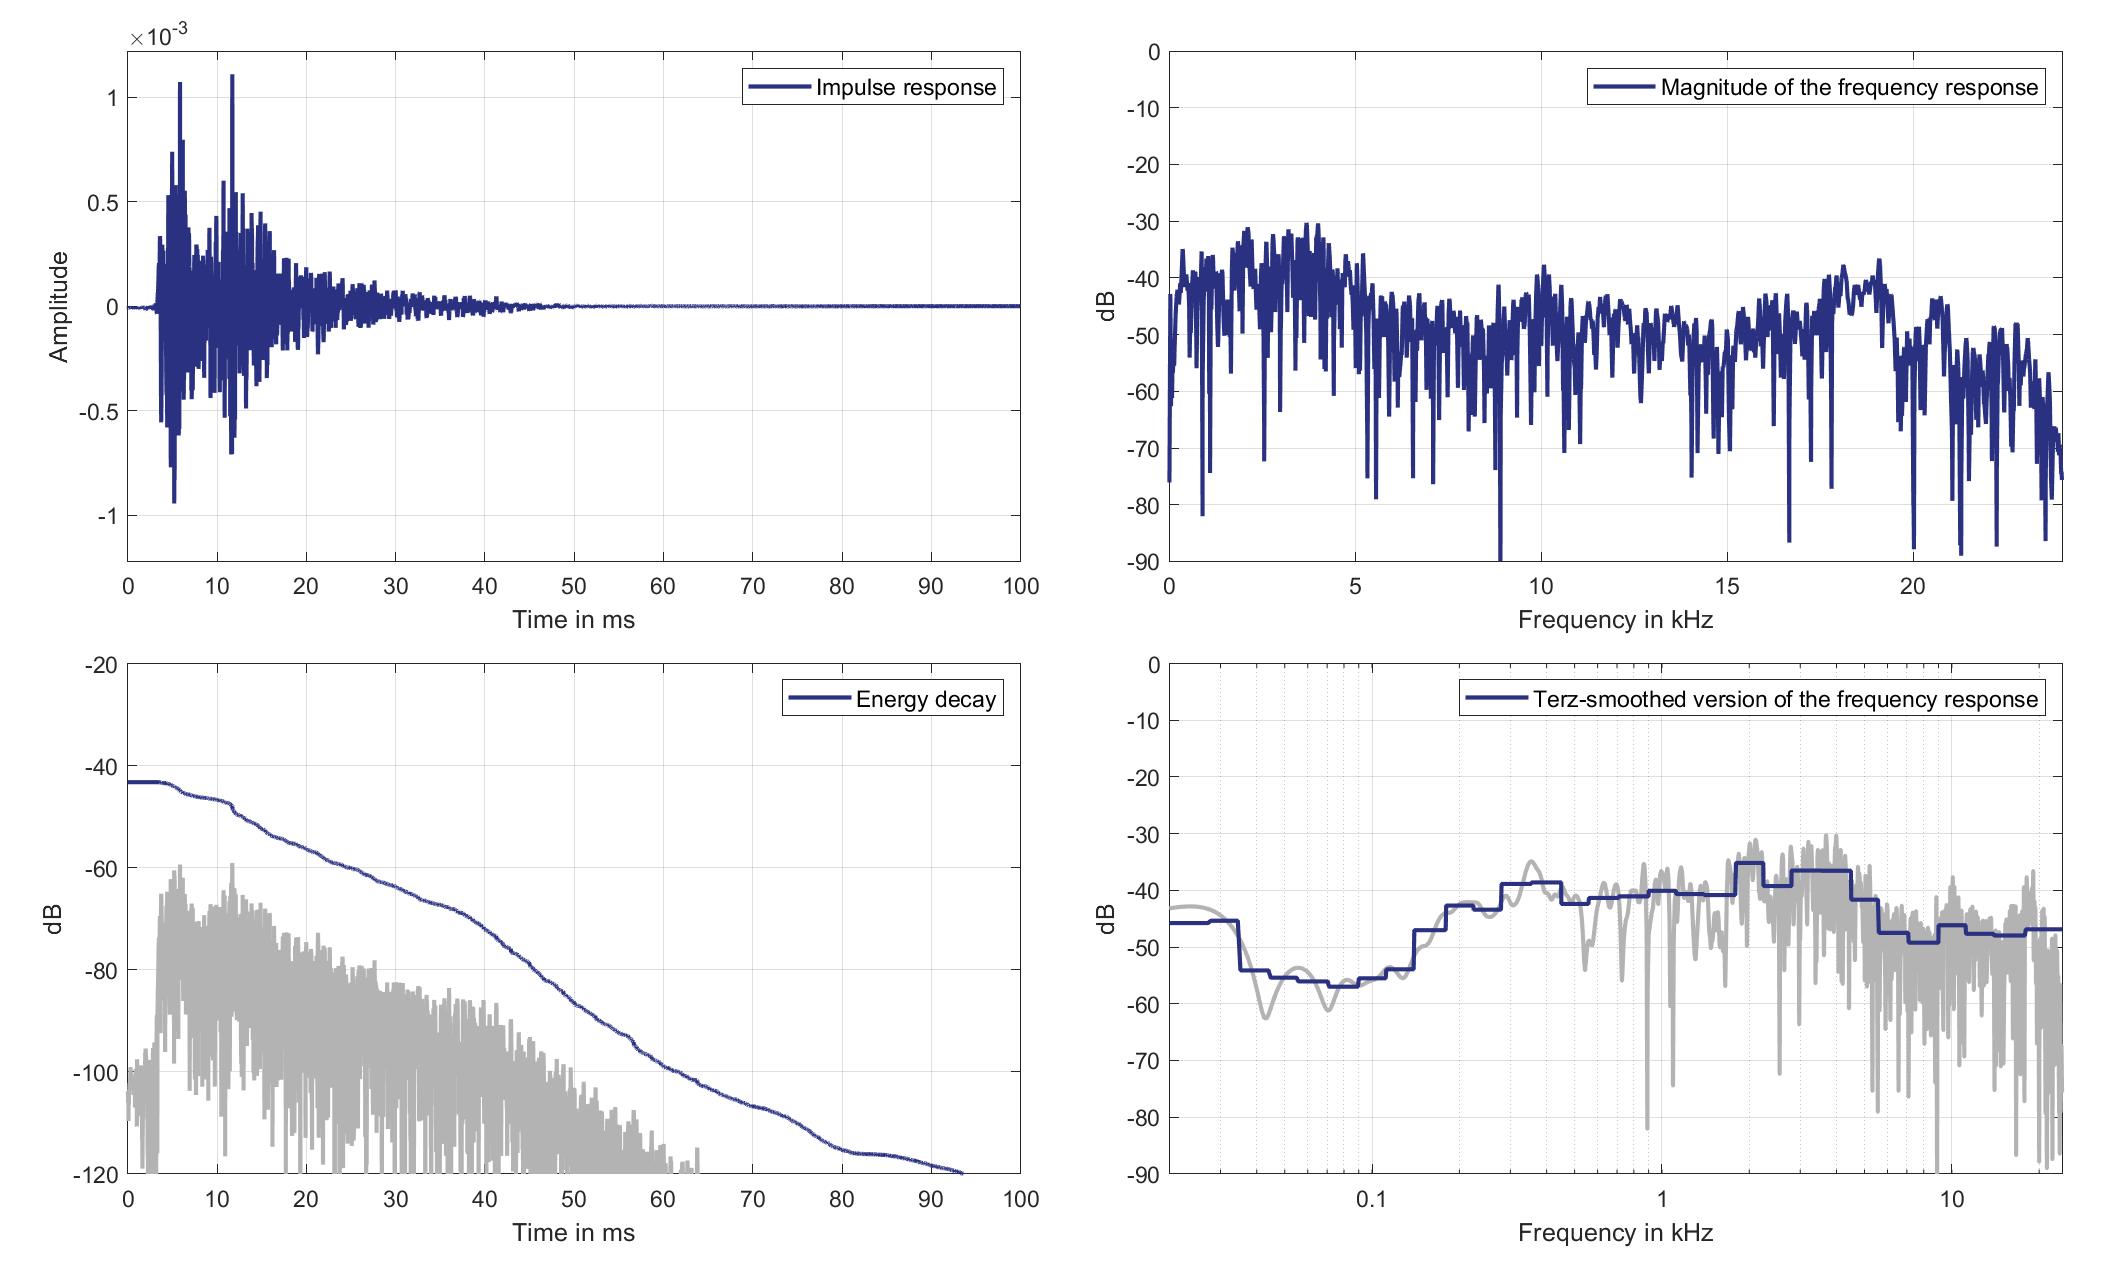
Download impulse response (in ".fir" format).
In the download section you can download all impulse response files as well as format explanation and Matlab as well as Python code examples for loading fir files.
Mics. 25/26
Left lsp. - left ear mic.
Left Headrest Loudspeaker of Zone 2 (Lsp. 2) to Left Ear Microphone of Zone 5 (Mic. 25)

Download impulse response (in ".fir" format).
In the download section you can download all impulse response files as well as format explanation and Matlab as well as Python code examples for loading fir files.
Left lsp. - Right ear mic.
Left Headrest Loudspeaker of Zone 2 (Lsp. 2) to Right Ear Microphone of Zone 5 (Mic. 26)
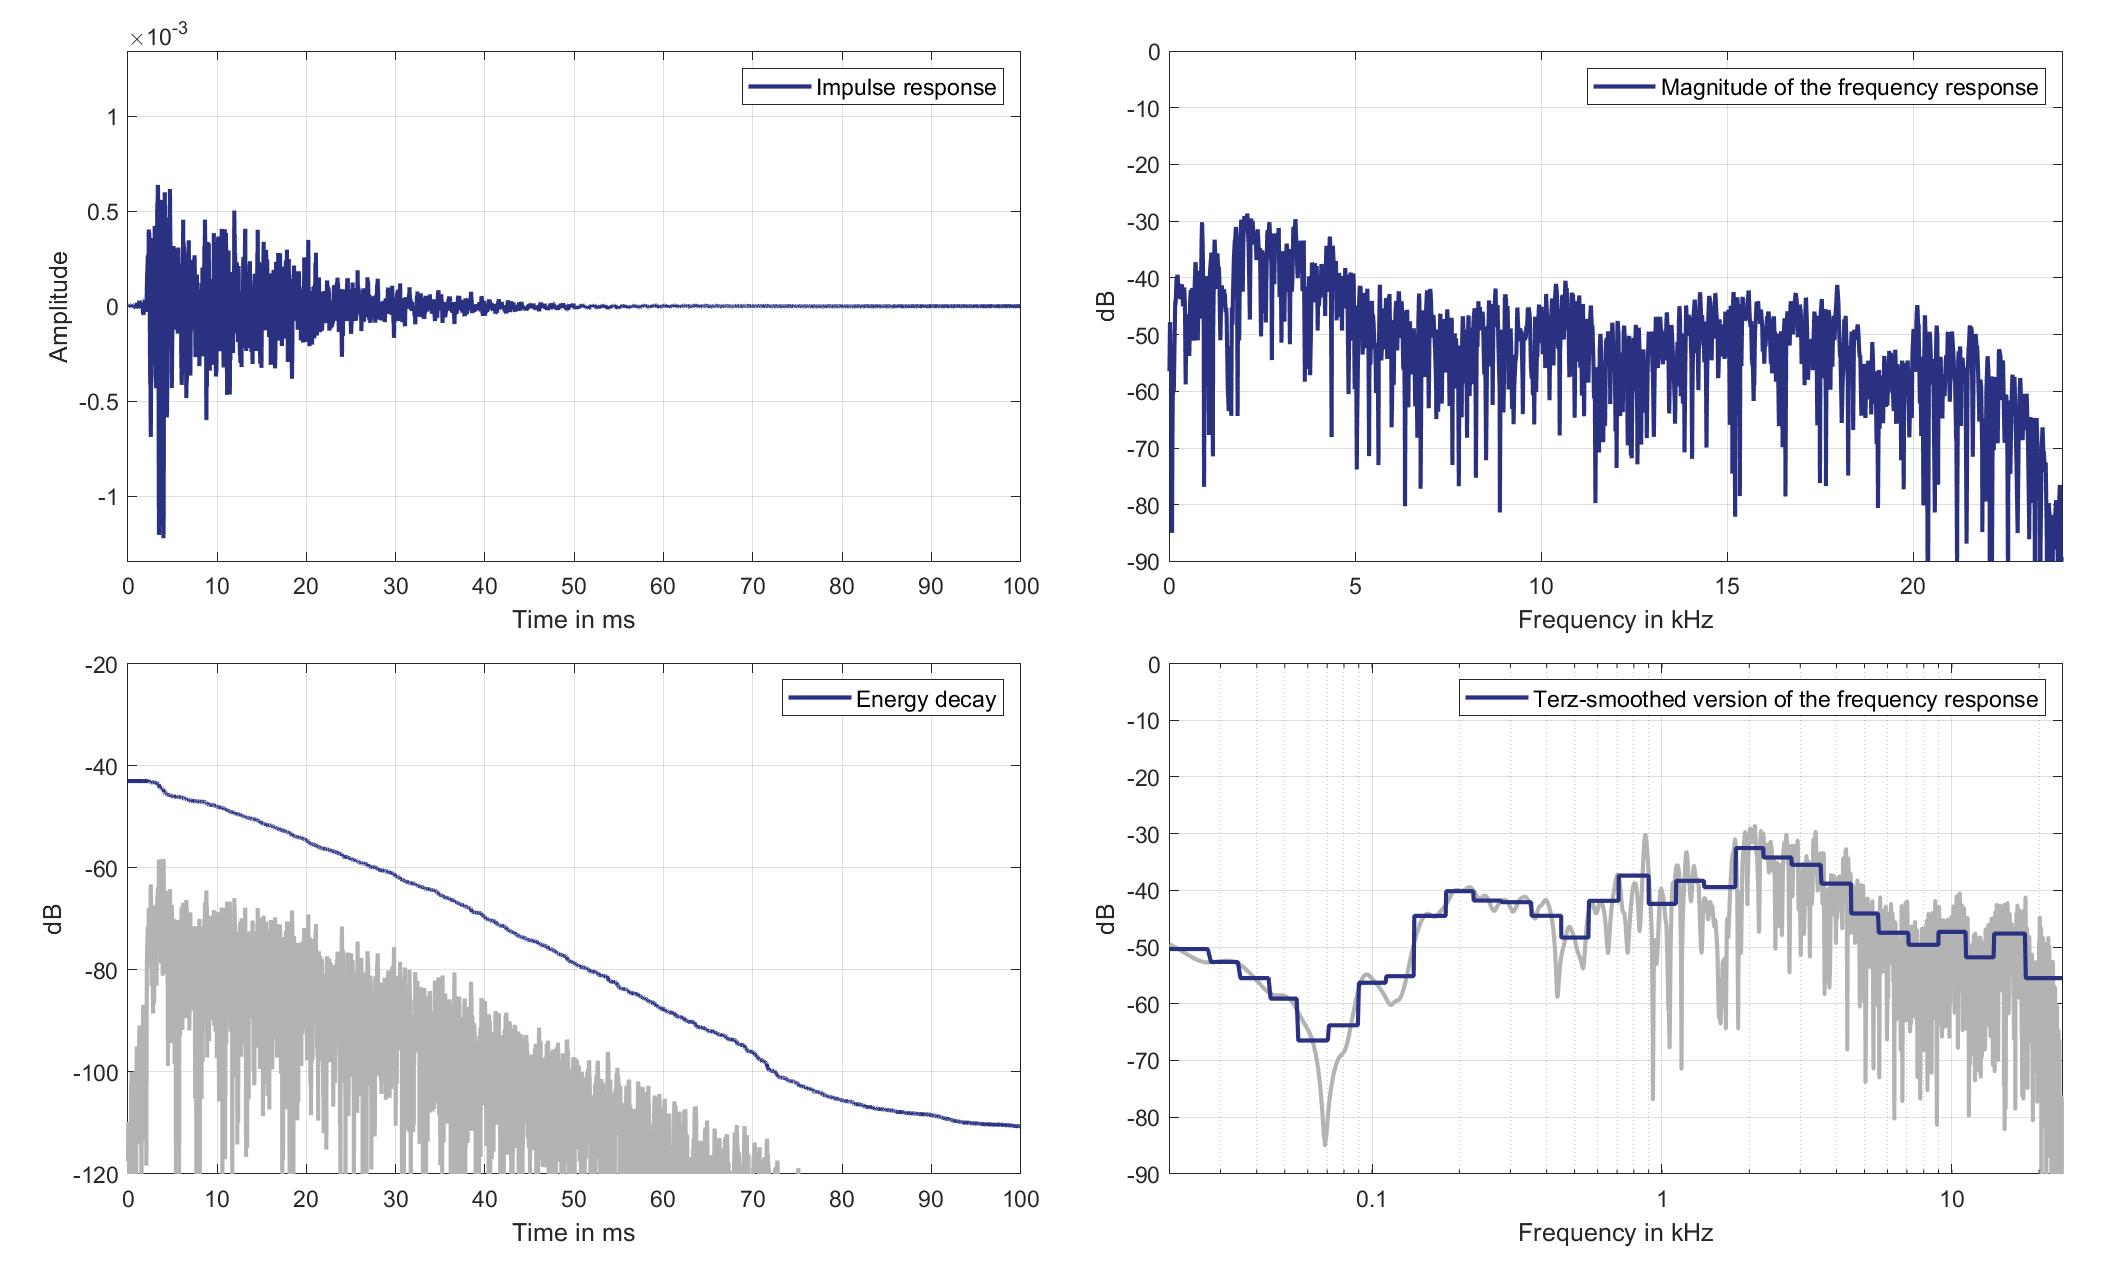
Download impulse response (in ".fir" format).
In the download section you can download all impulse response files as well as format explanation and Matlab as well as Python code examples for loading fir files.
Right lsp. - left ear mic.
Right Headrest Loudspeaker of Zone 2 (Lsp. 3) to Left Ear Microphone of Zone 5 (Mic. 25)
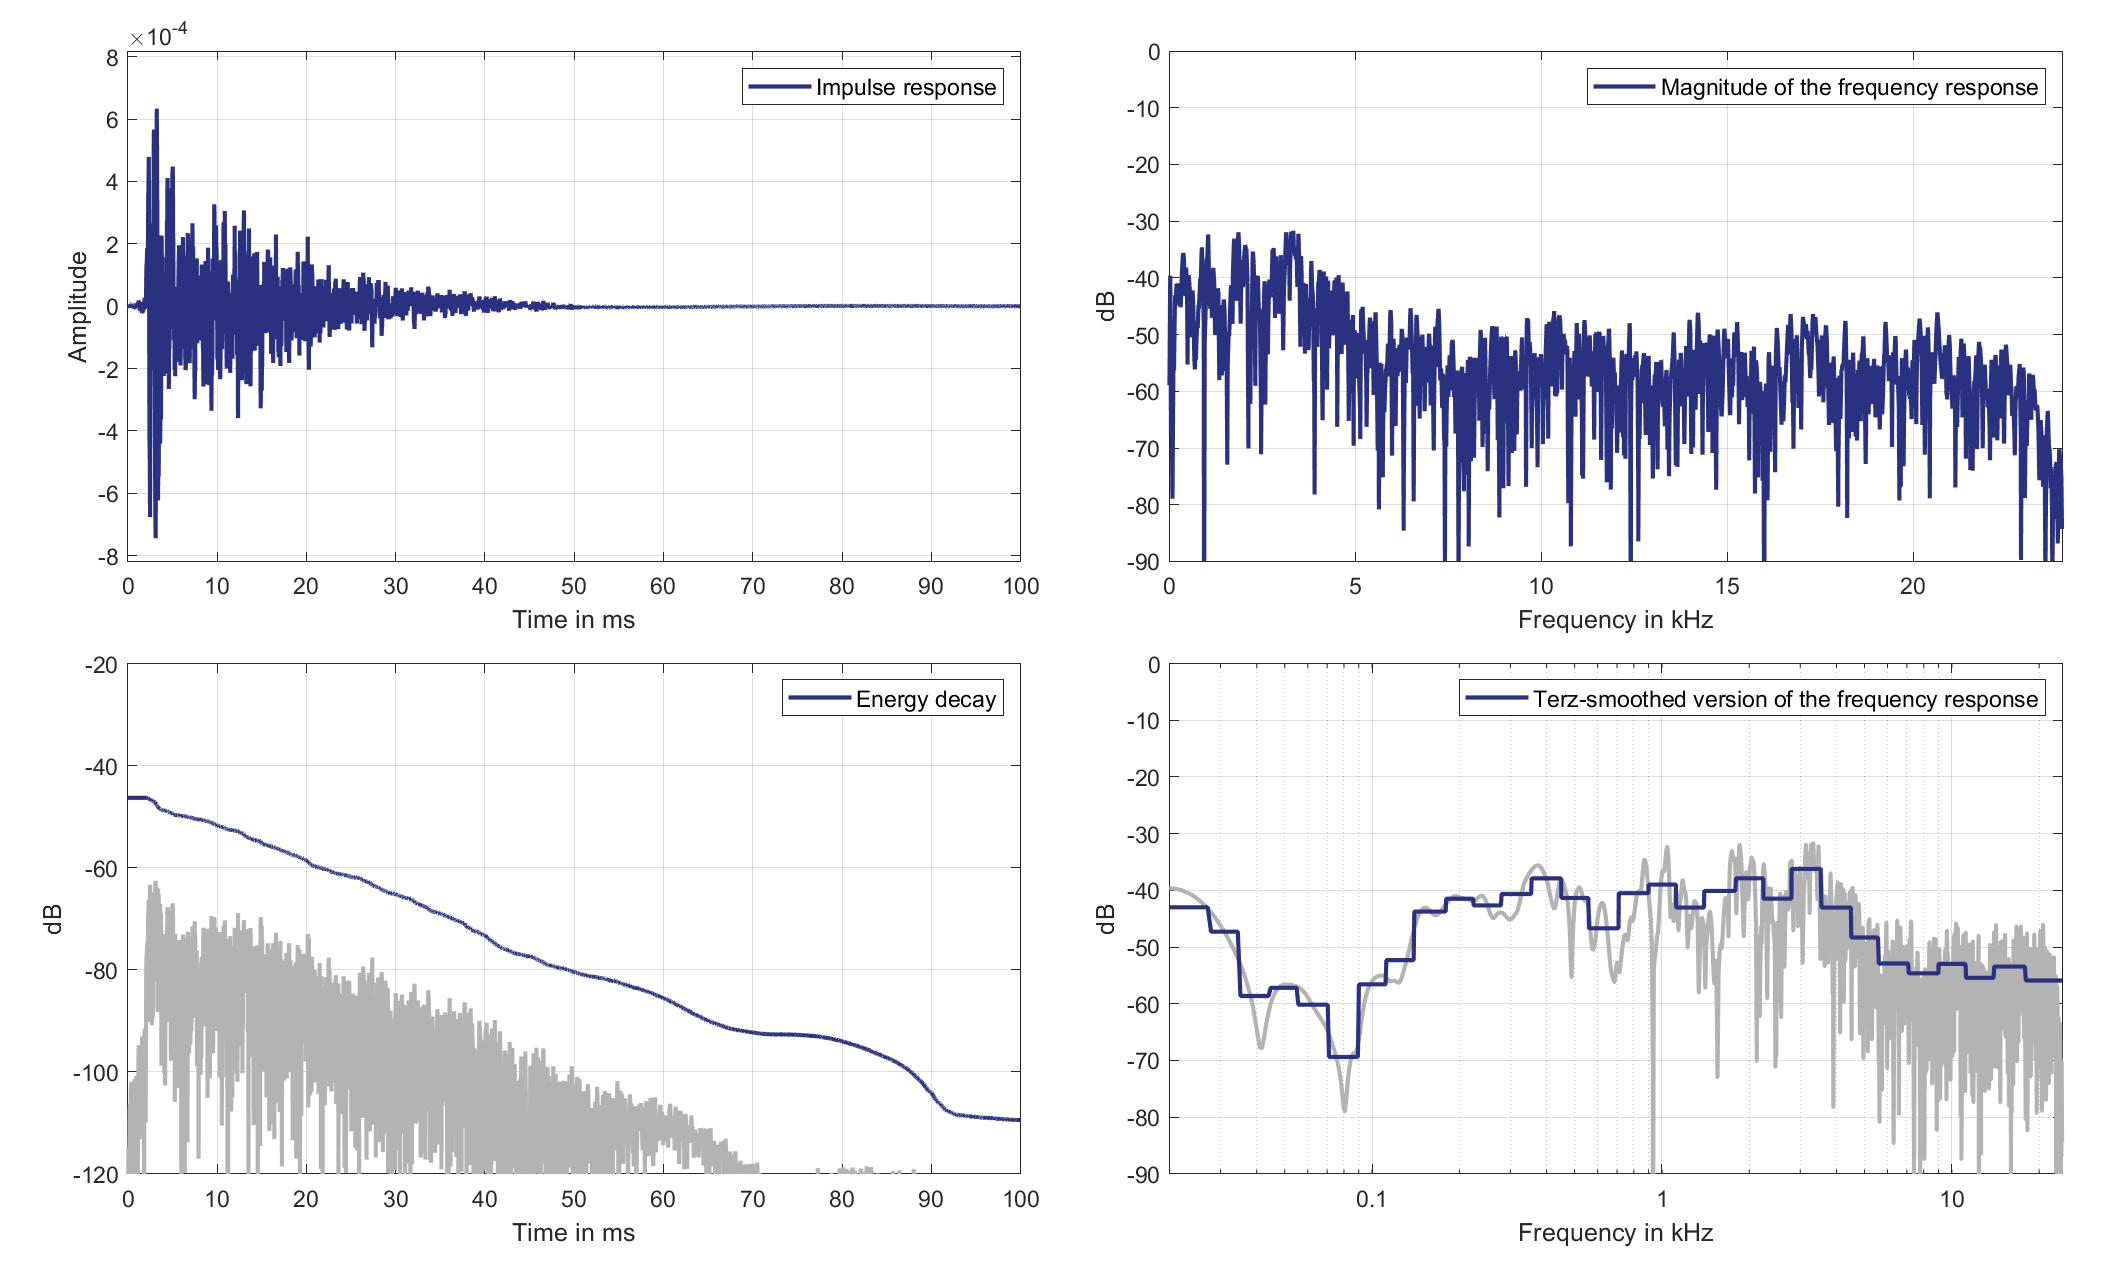
Download impulse response (in ".fir" format).
In the download section you can download all impulse response files as well as format explanation and Matlab as well as Python code examples for loading fir files.
Right lsp. - Right ear mic.
Right Headrest Loudspeaker of Zone 2 (Lsp. 3 to Right Ear Microphone of Zone 5 (Mic. 26)
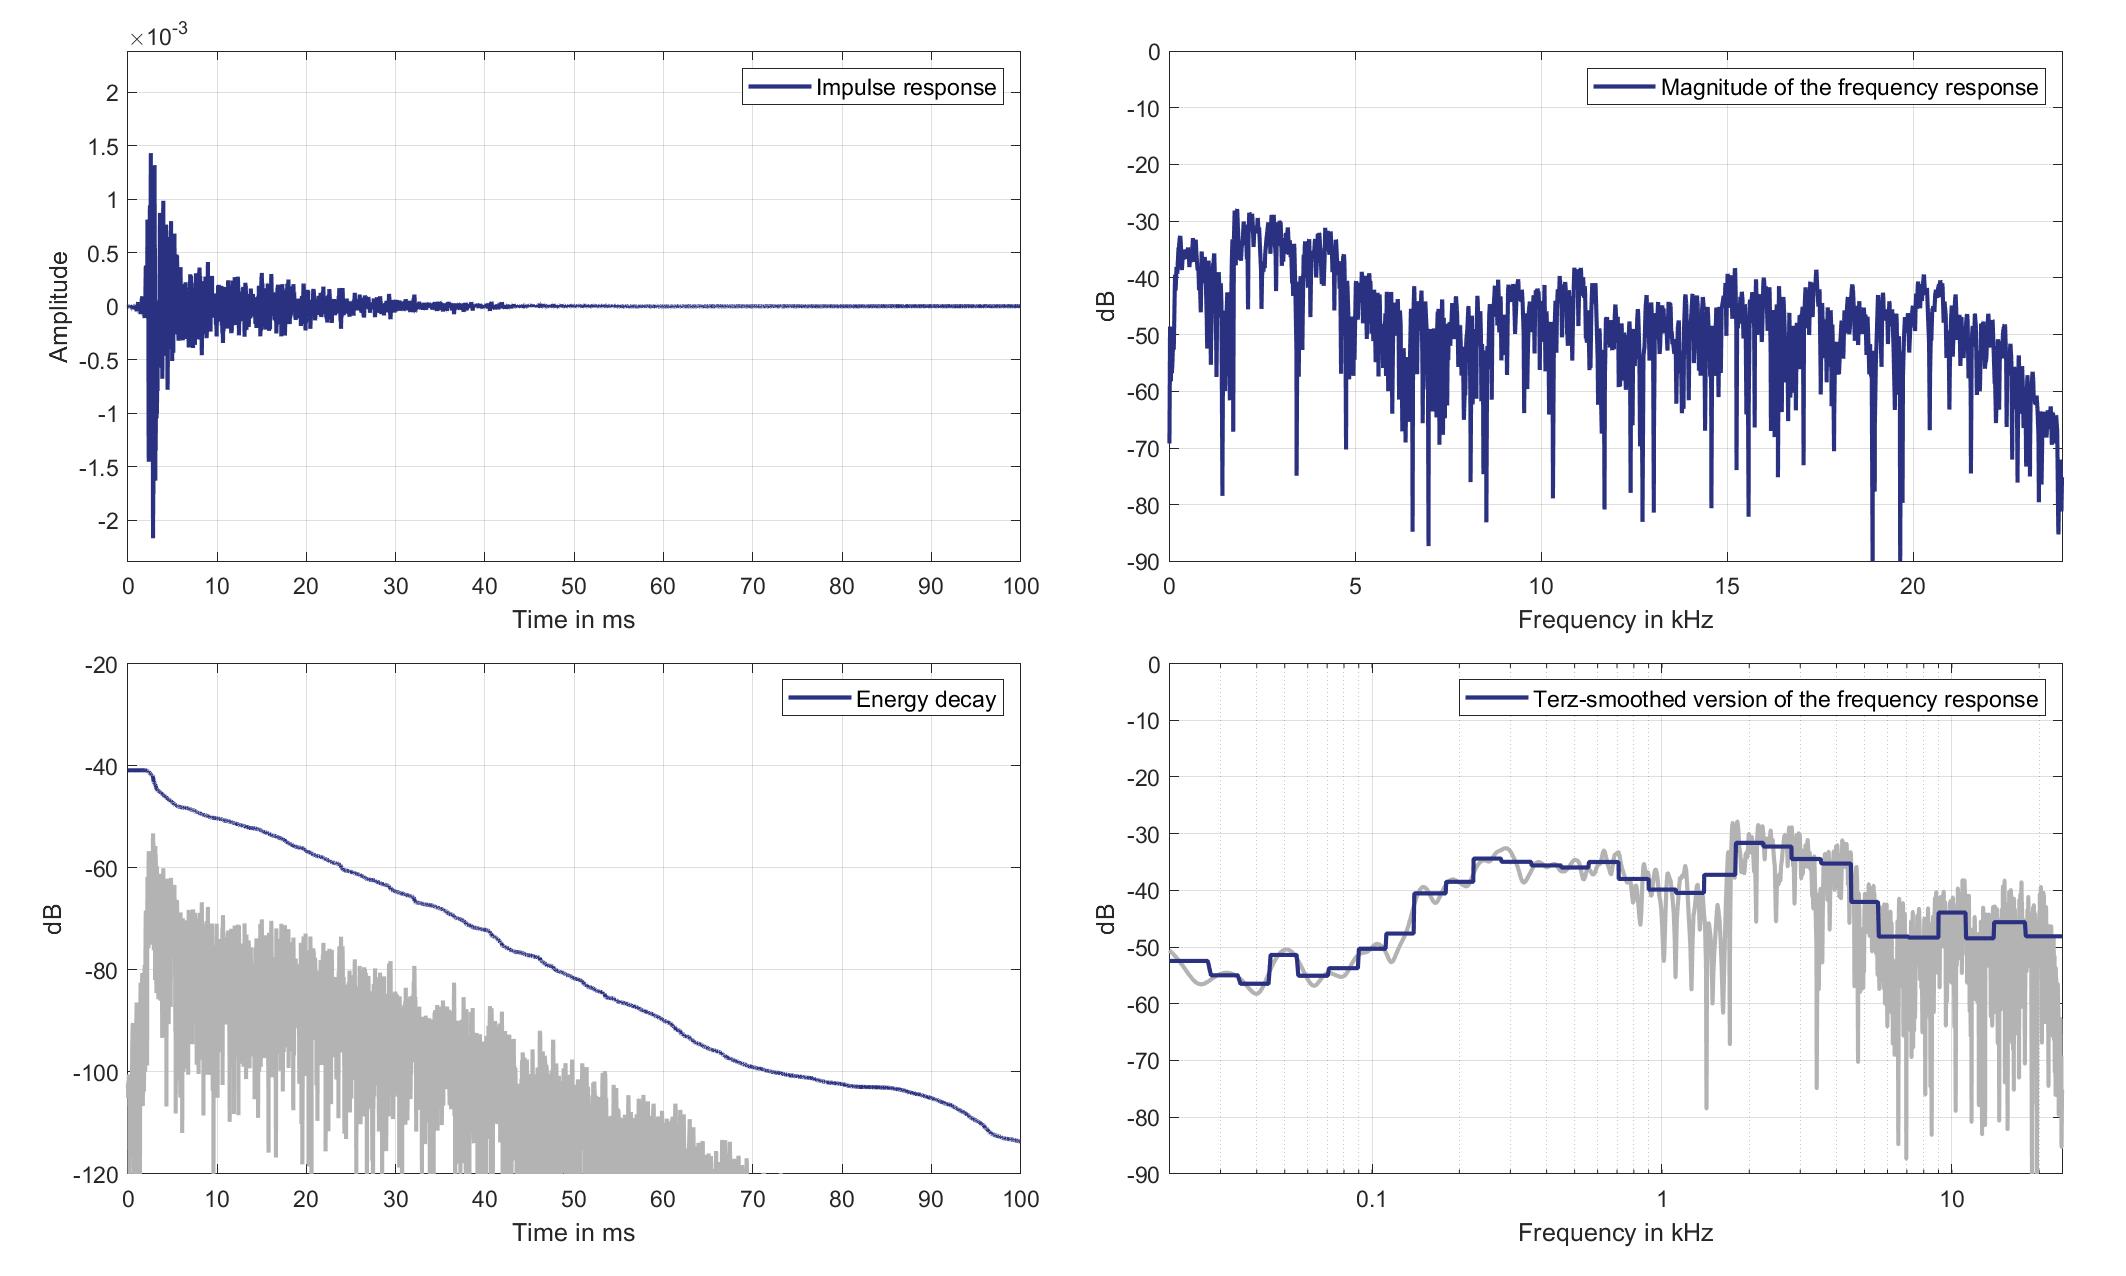
Download impulse response (in ".fir" format).
In the download section you can download all impulse response files as well as format explanation and Matlab as well as Python code examples for loading fir files.
Mics. 27/28
Left lsp. - left ear mic.
Left Headrest Loudspeaker of Zone 2 (Lsp. 2) to Left Ear Microphone of Zone 6 (Mic. 27)
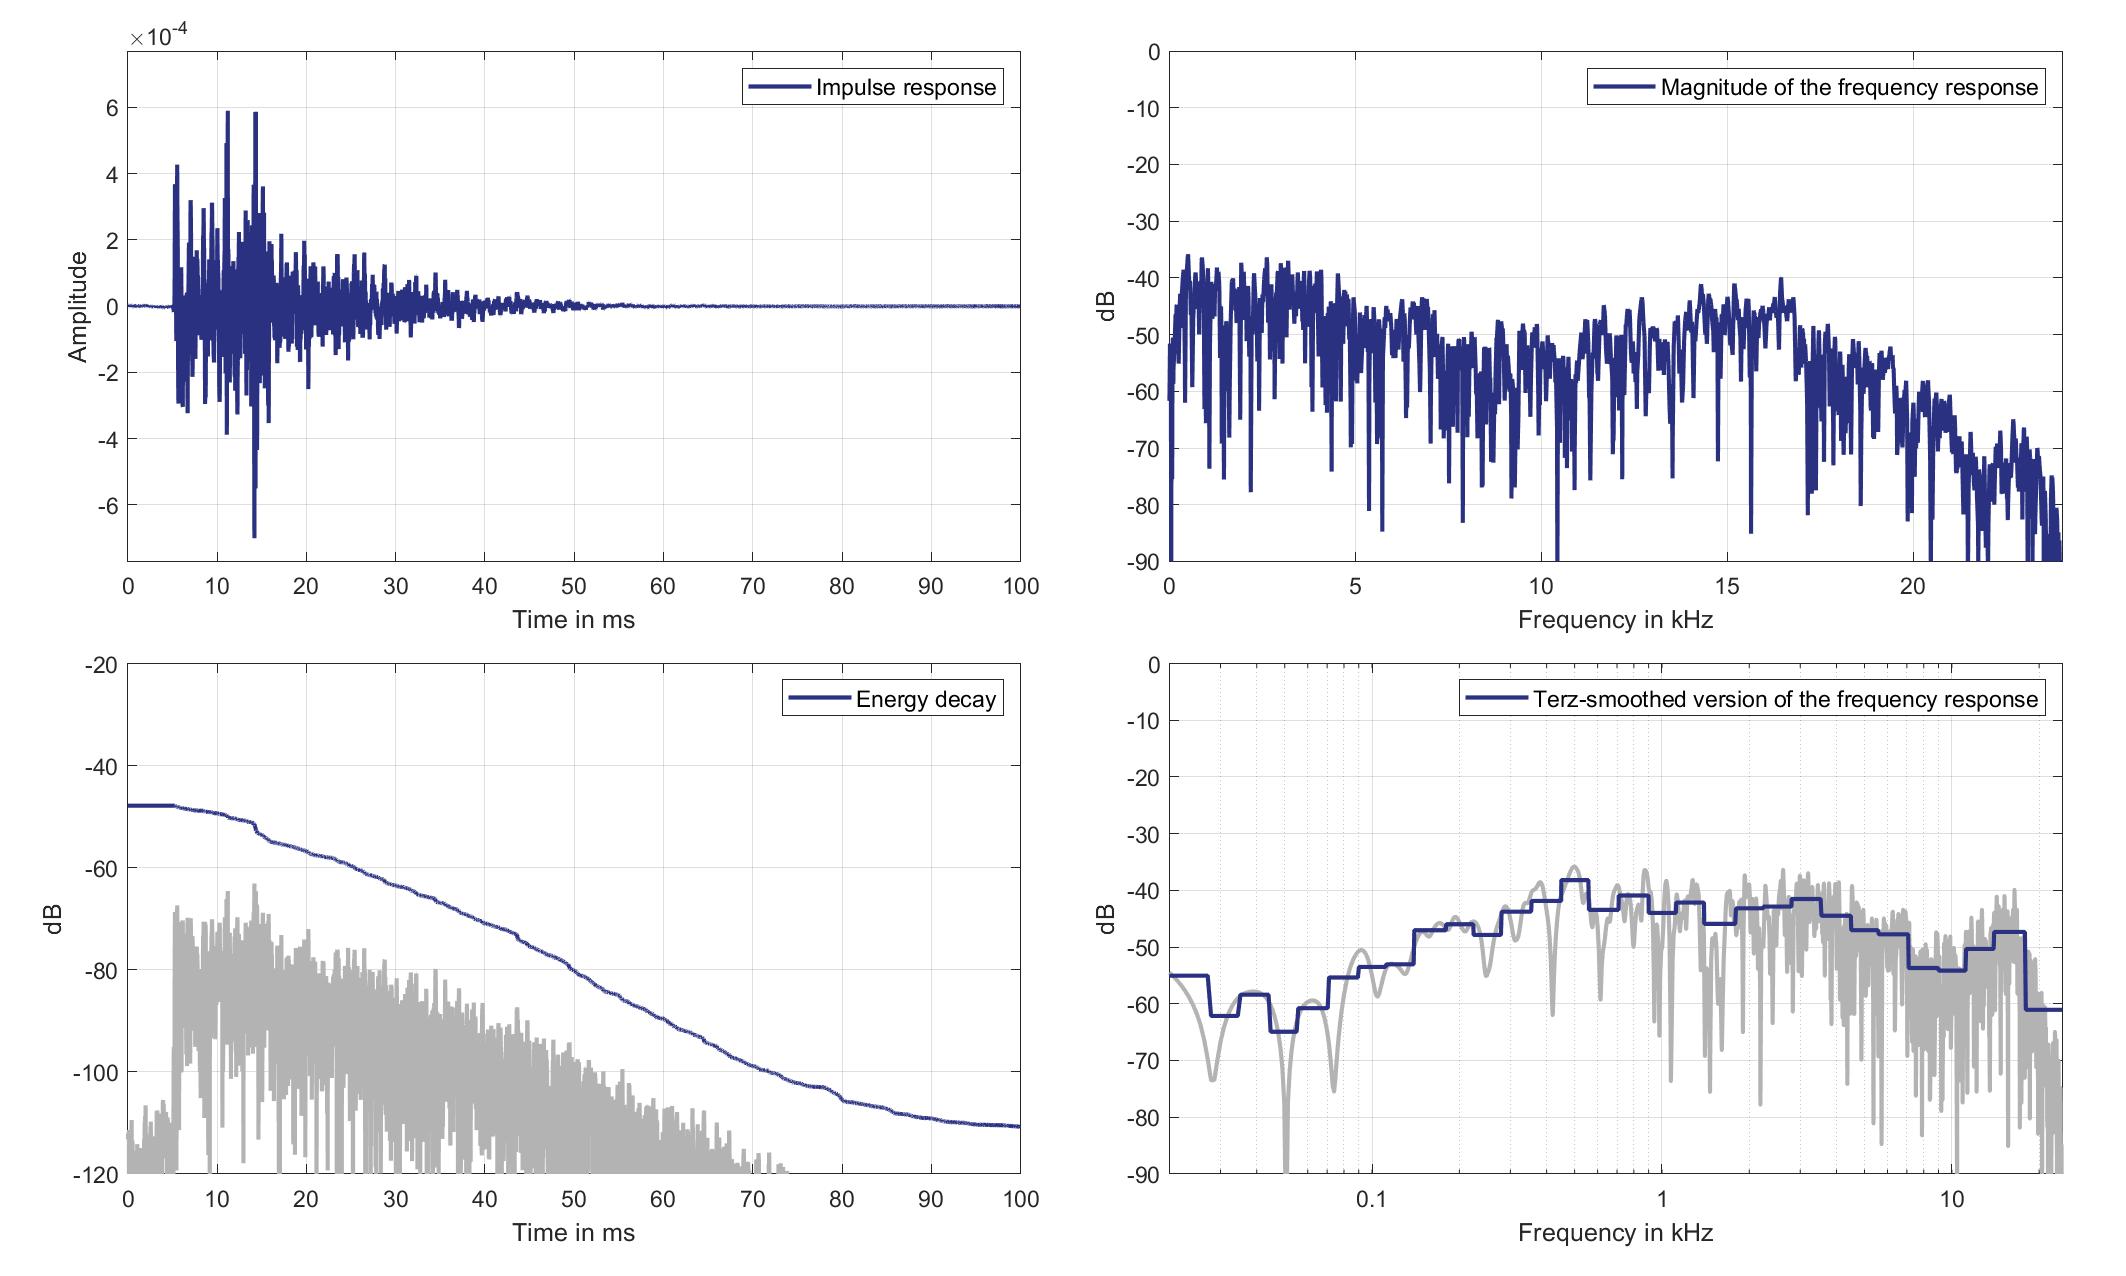
Download impulse response (in ".fir" format).
In the download section you can download all impulse response files as well as format explanation and Matlab as well as Python code examples for loading fir files.
Left lsp. - Right ear mic.
Left Headrest Loudspeaker of Zone 2 (Lsp. 2) to Right Ear Microphone of Zone 6 (Mic. 28)
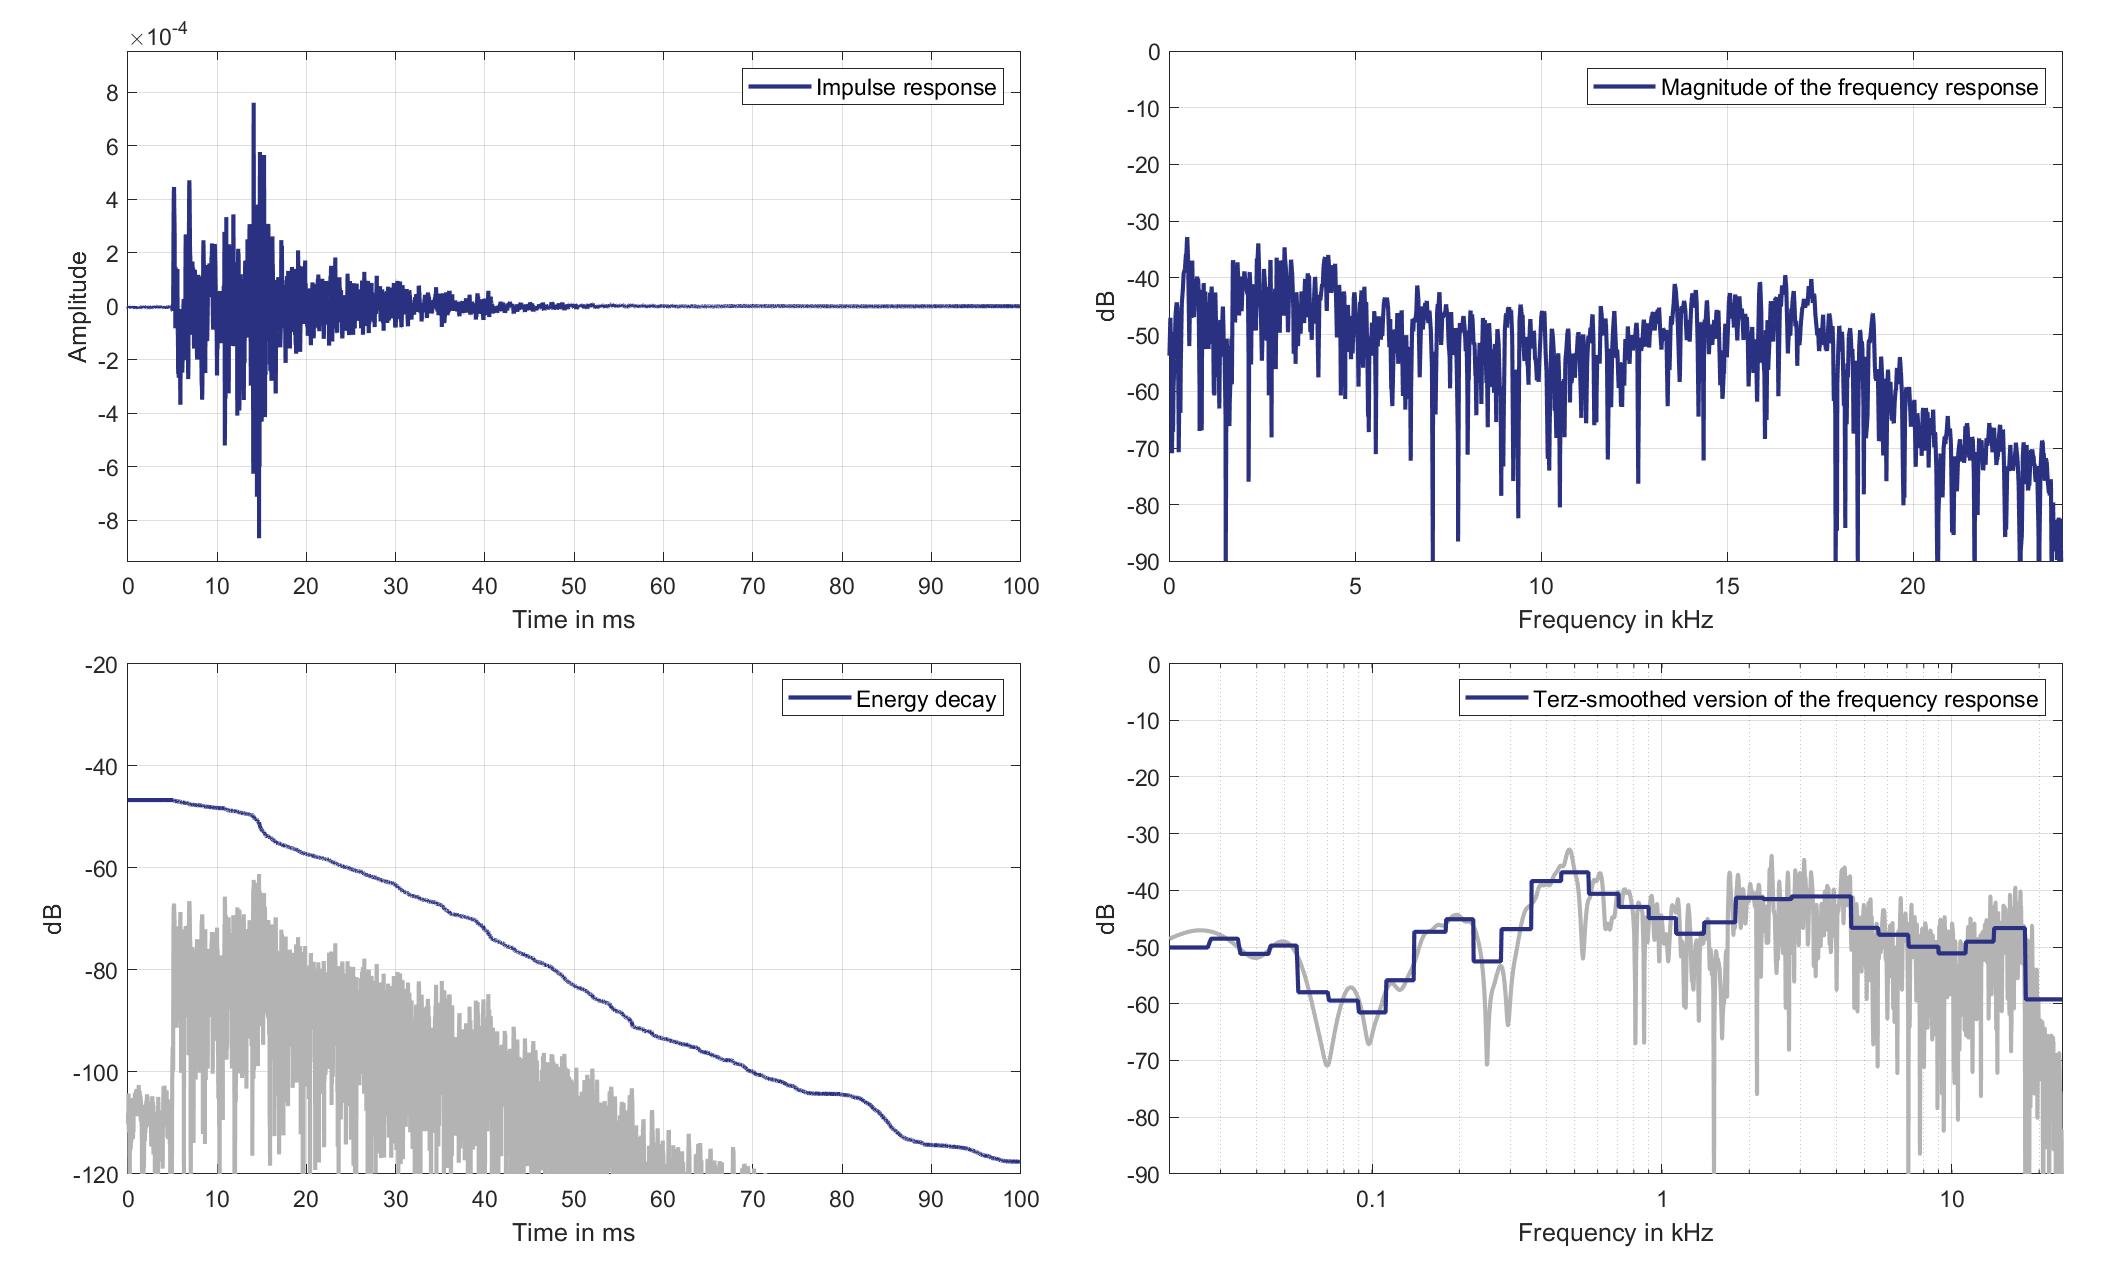
Download impulse response (in ".fir" format).
In the download section you can download all impulse response files as well as format explanation and Matlab as well as Python code examples for loading fir files.
Right lsp. - left ear mic.
Right Headrest Loudspeaker of Zone 2 (Lsp. 3) to Left Ear Microphone of Zone 6 (Mic. 27)
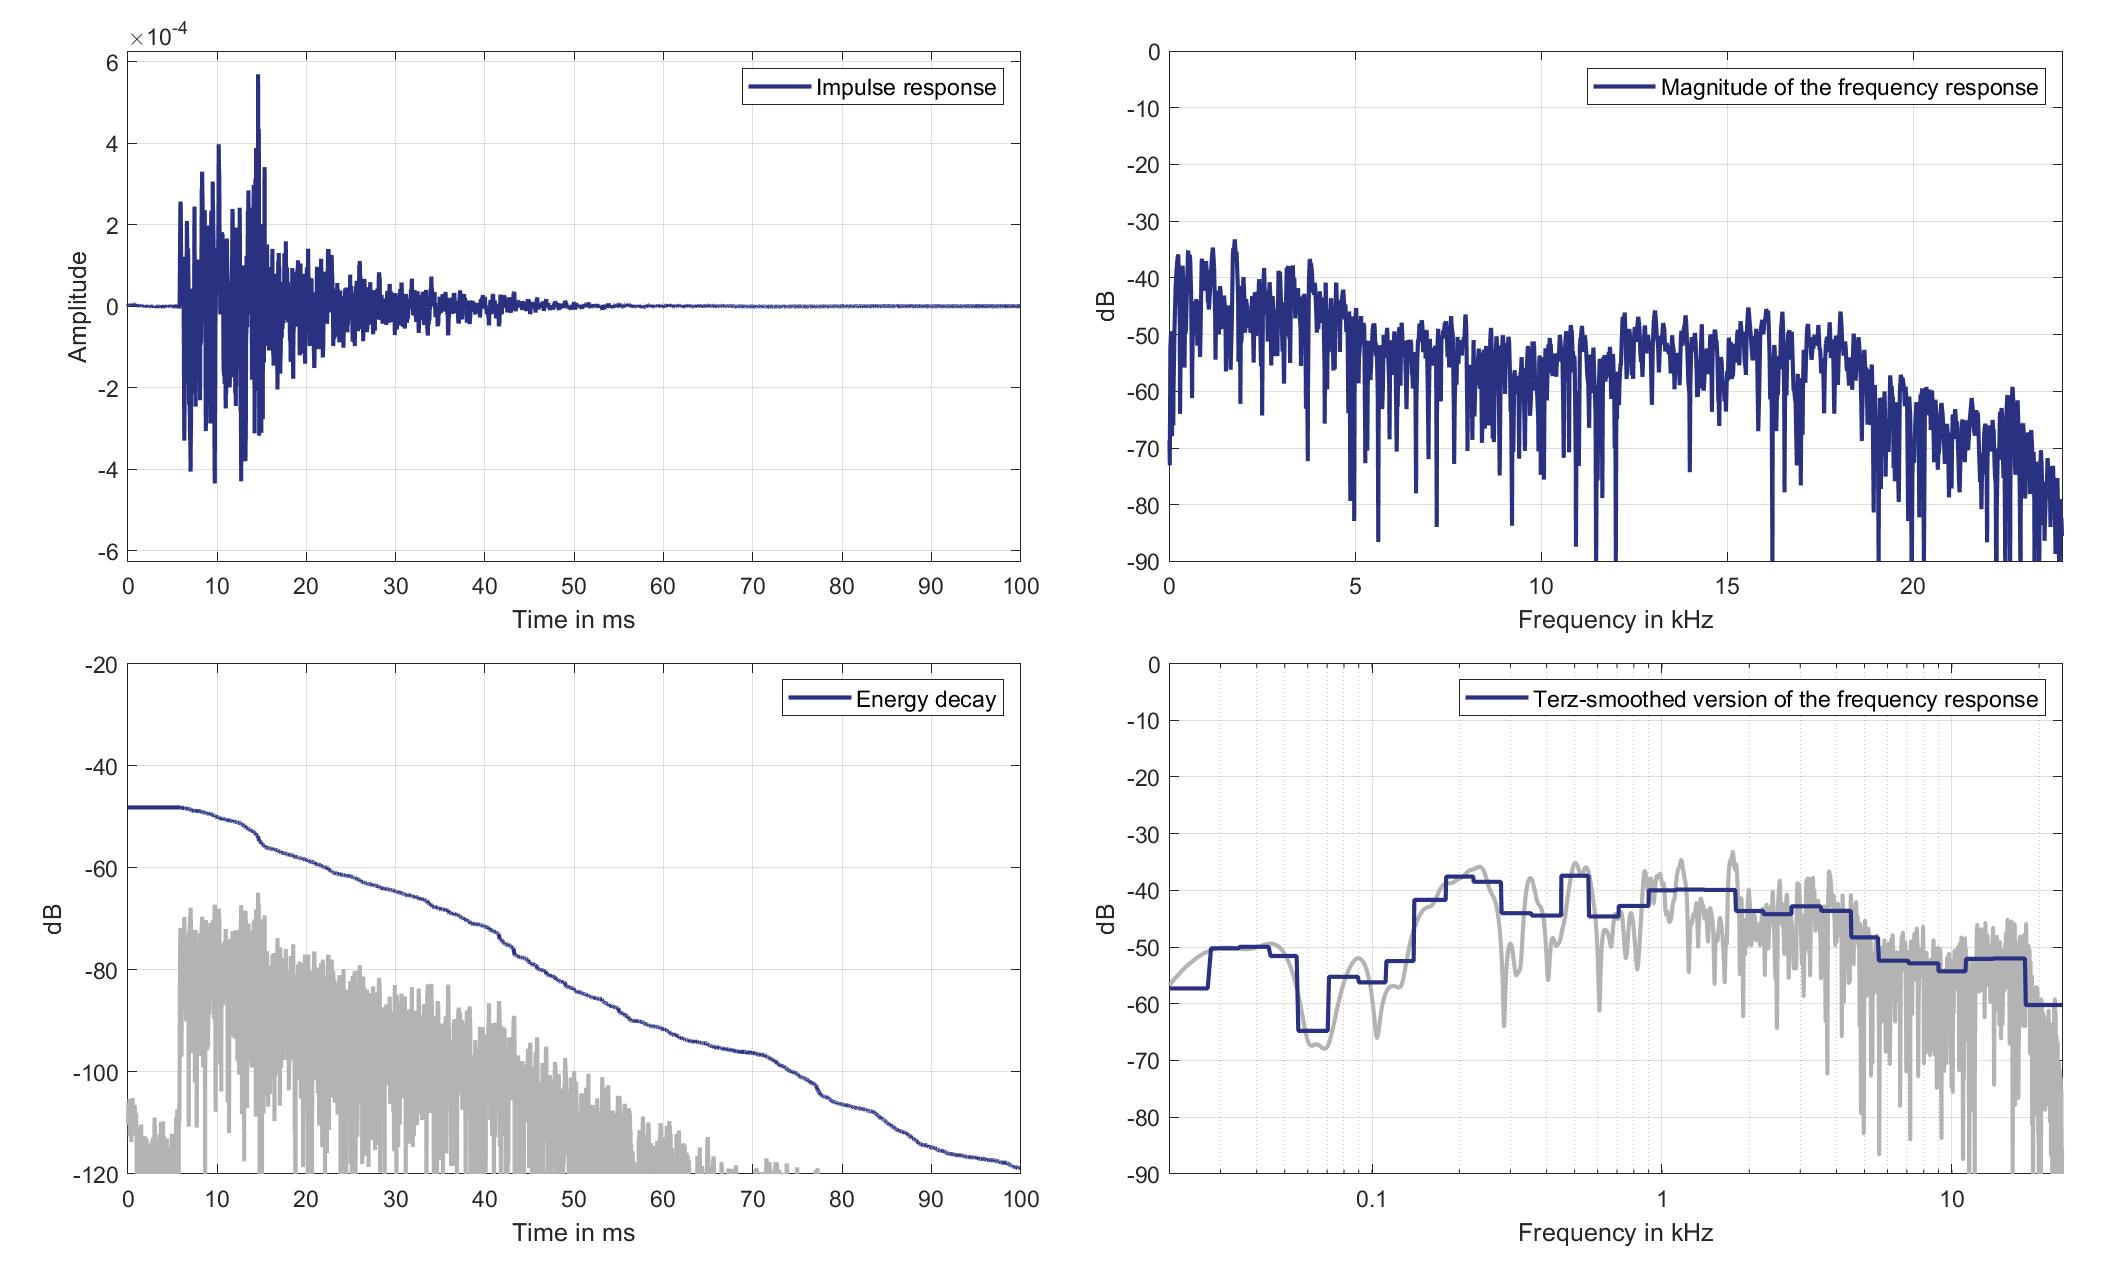
Download impulse response (in ".fir" format).
In the download section you can download all impulse response files as well as format explanation and Matlab as well as Python code examples for loading fir files.
Right lsp. - Right ear mic.
Right Headrest Loudspeaker of Zone 2 (Lsp. 3 to Right Ear Microphone of Zone 6 (Mic. 28)
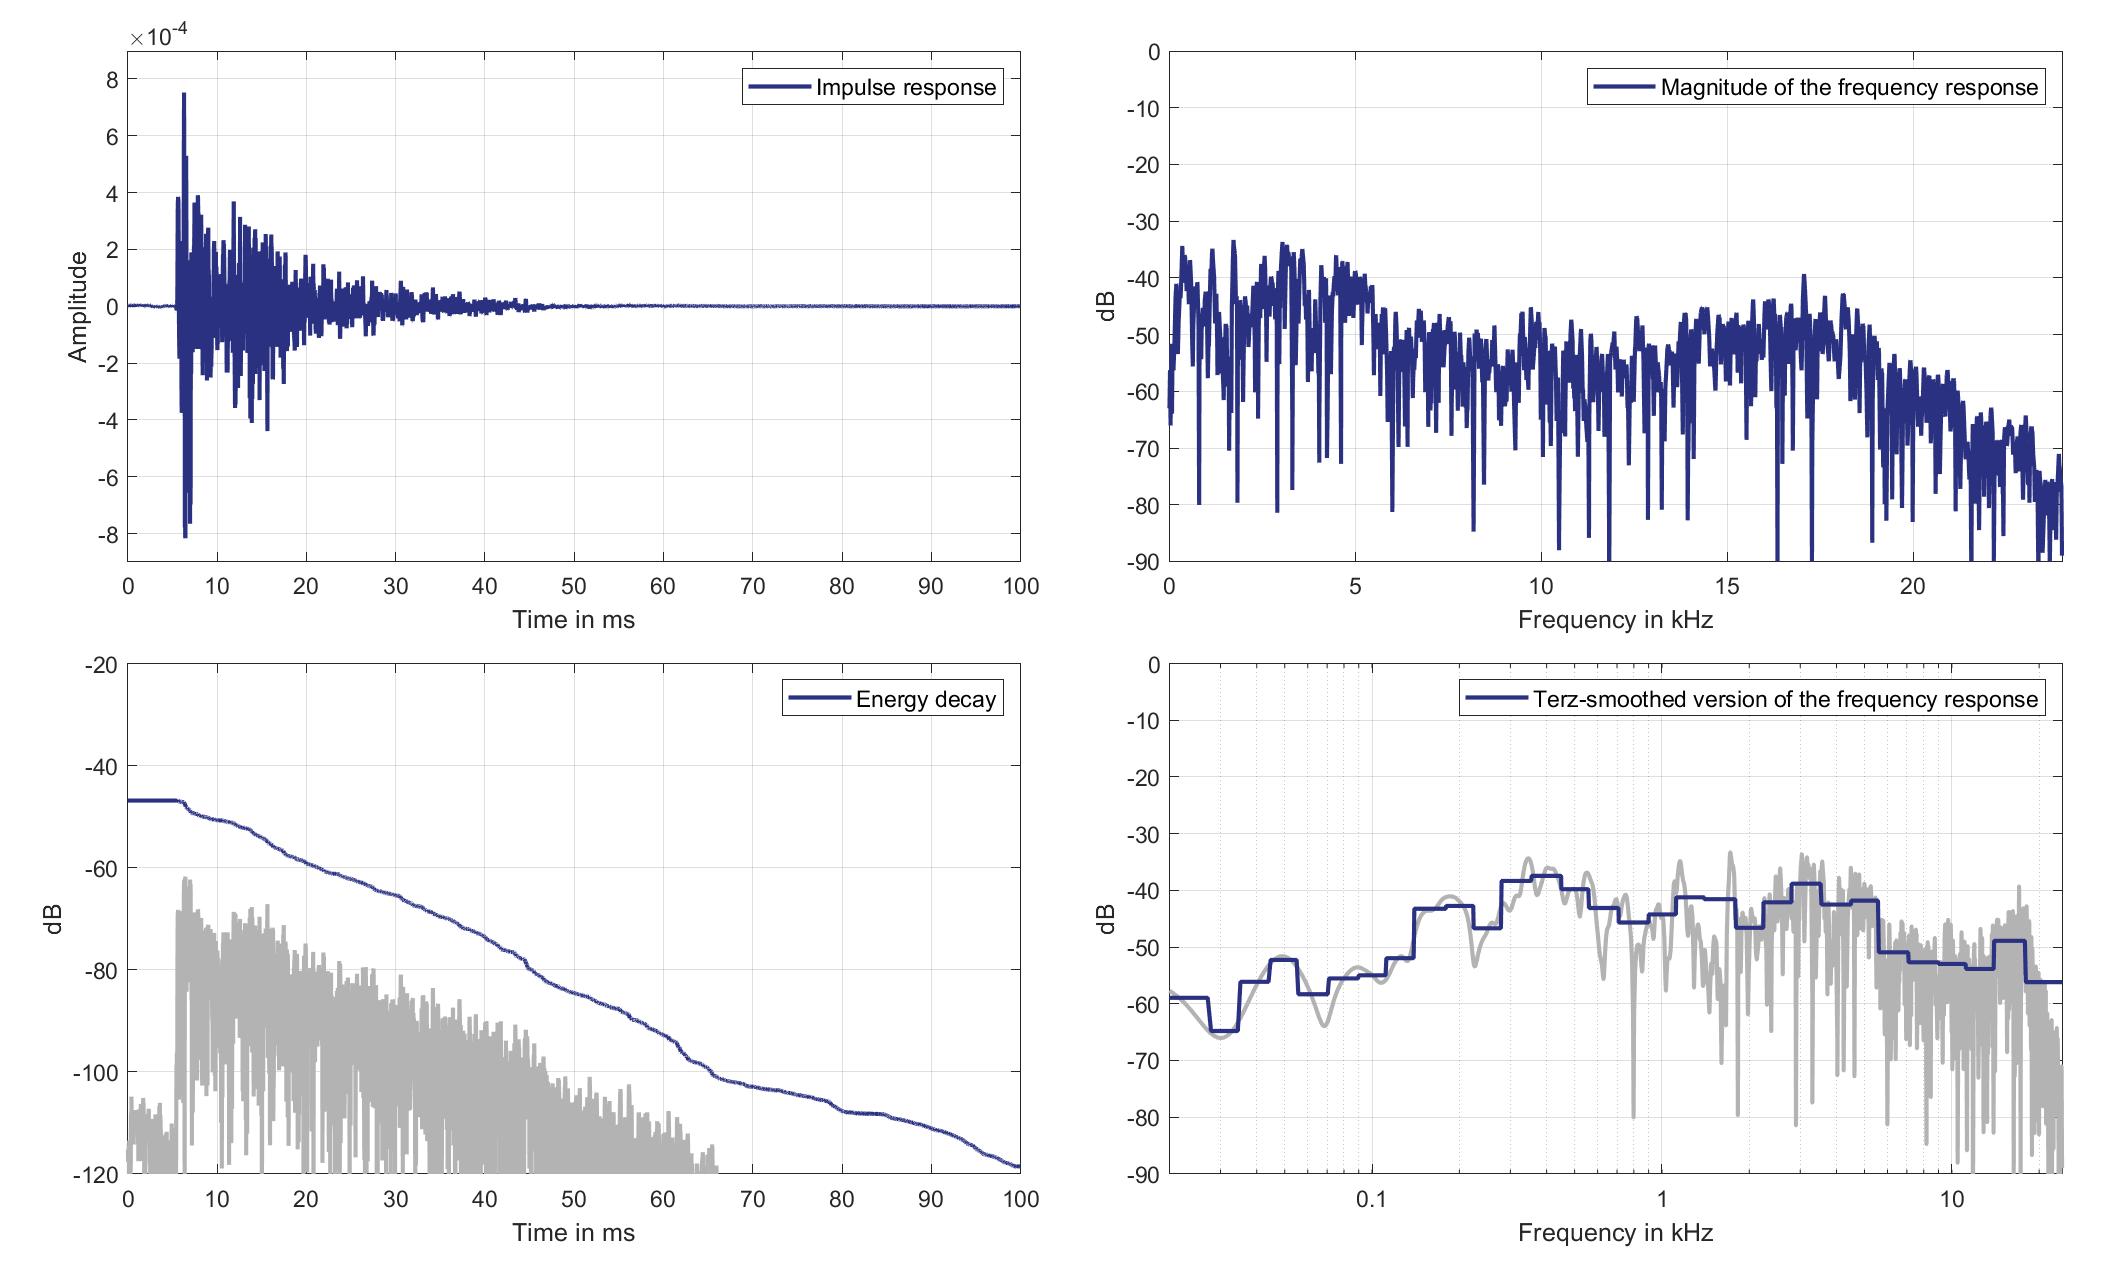
Download impulse response (in ".fir" format).
In the download section you can download all impulse response files as well as format explanation and Matlab as well as Python code examples for loading fir files.
Mics. 29/30
Left lsp. - left ear mic.
Left Headrest Loudspeaker of Zone 2 (Lsp. 2) to Left Ear Microphone of Zone 8 (Mic. 29)
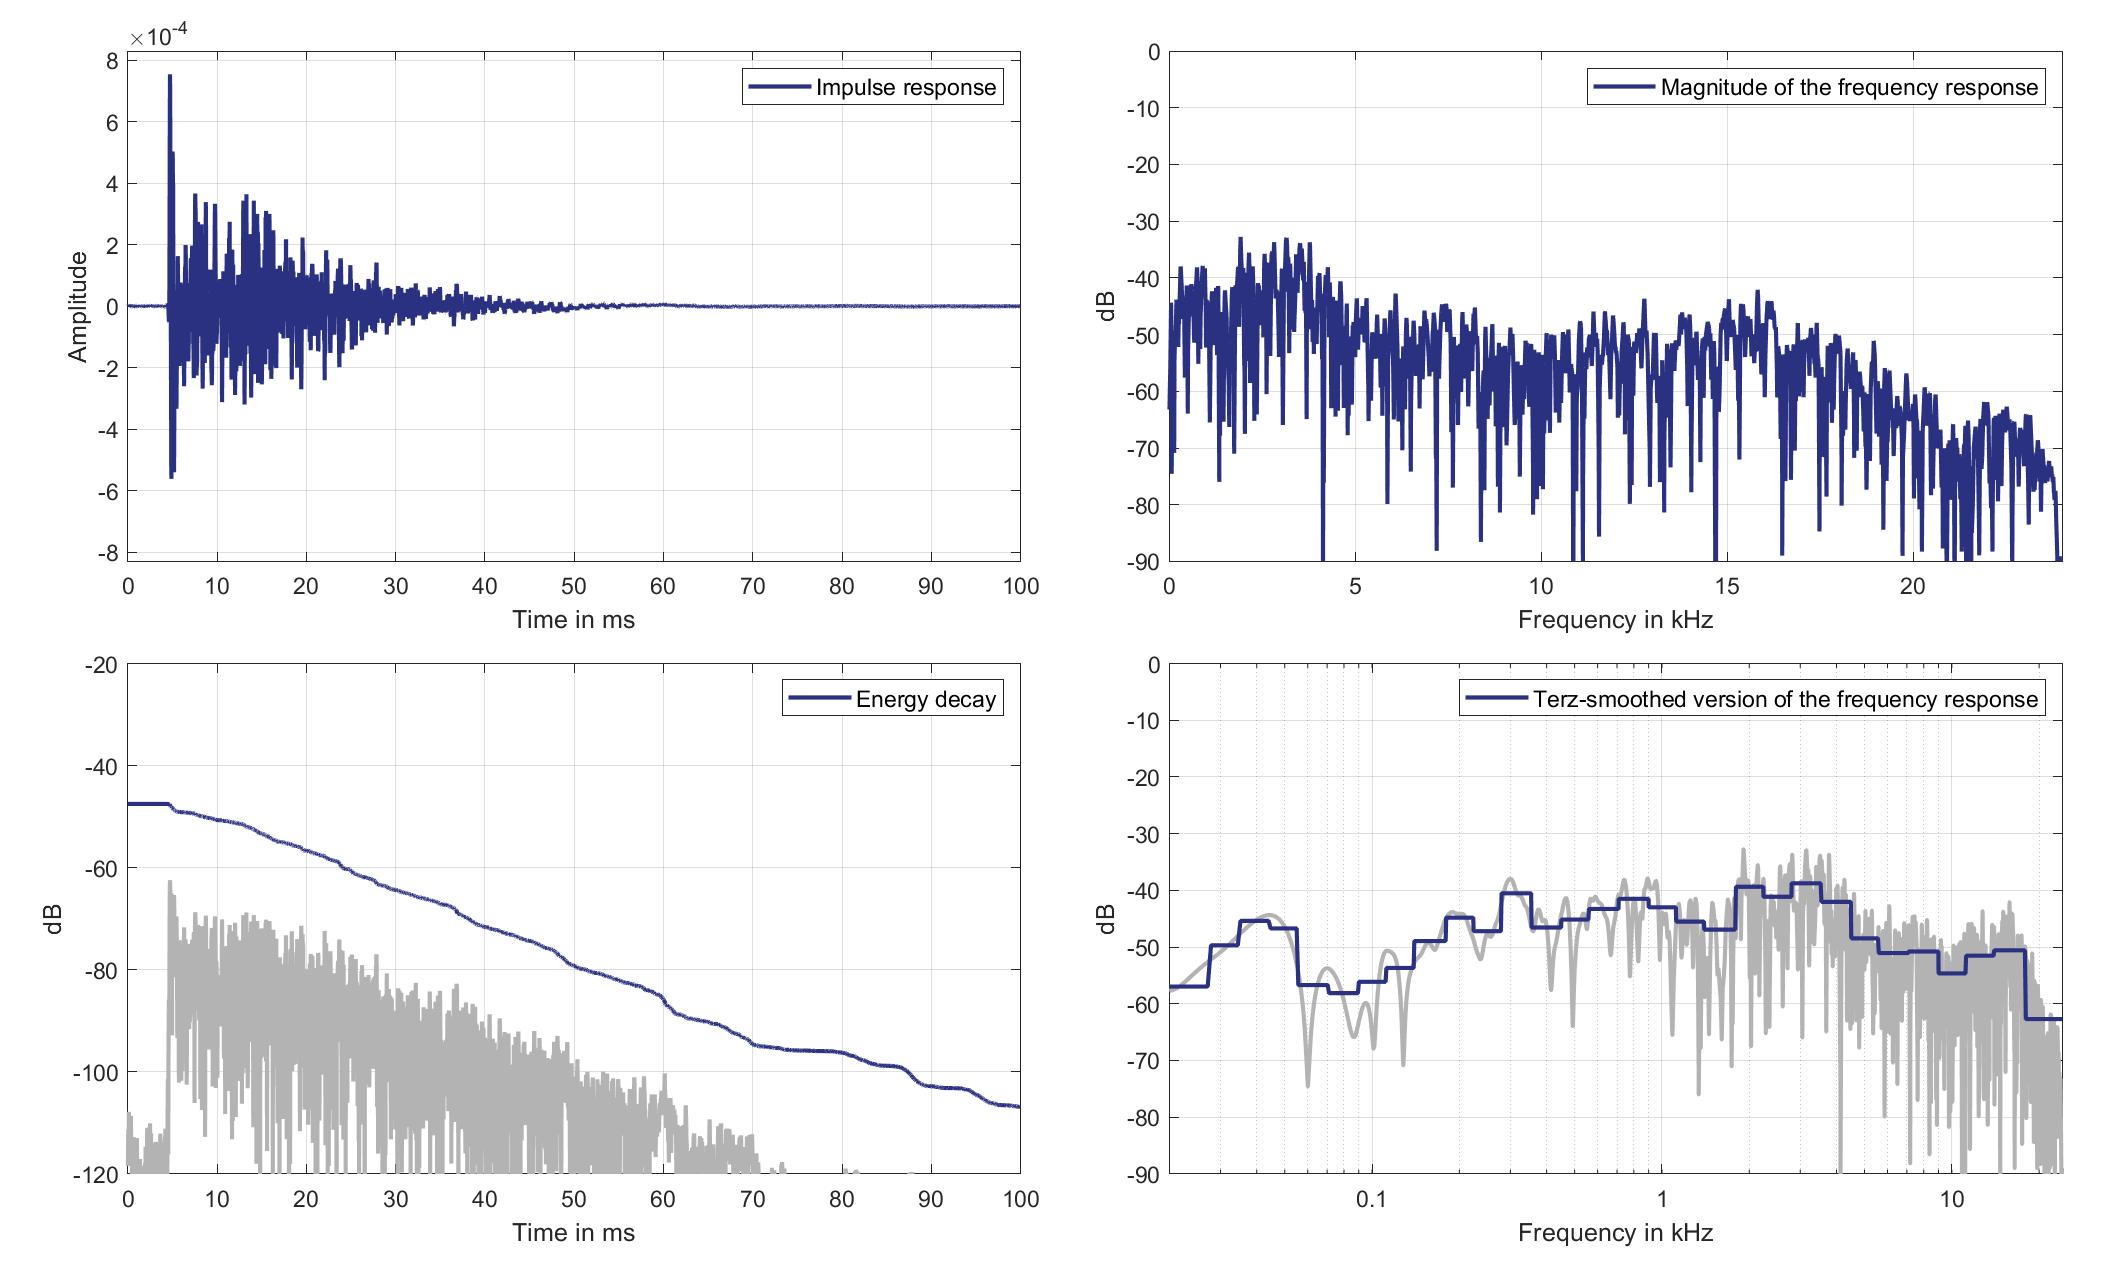
Download impulse response (in ".fir" format).
In the download section you can download all impulse response files as well as format explanation and Matlab as well as Python code examples for loading fir files.
Left lsp. - Right ear mic.
Left Headrest Loudspeaker of Zone 2 (Lsp. 2) to Right Ear Microphone of Zone 8 (Mic. 30)
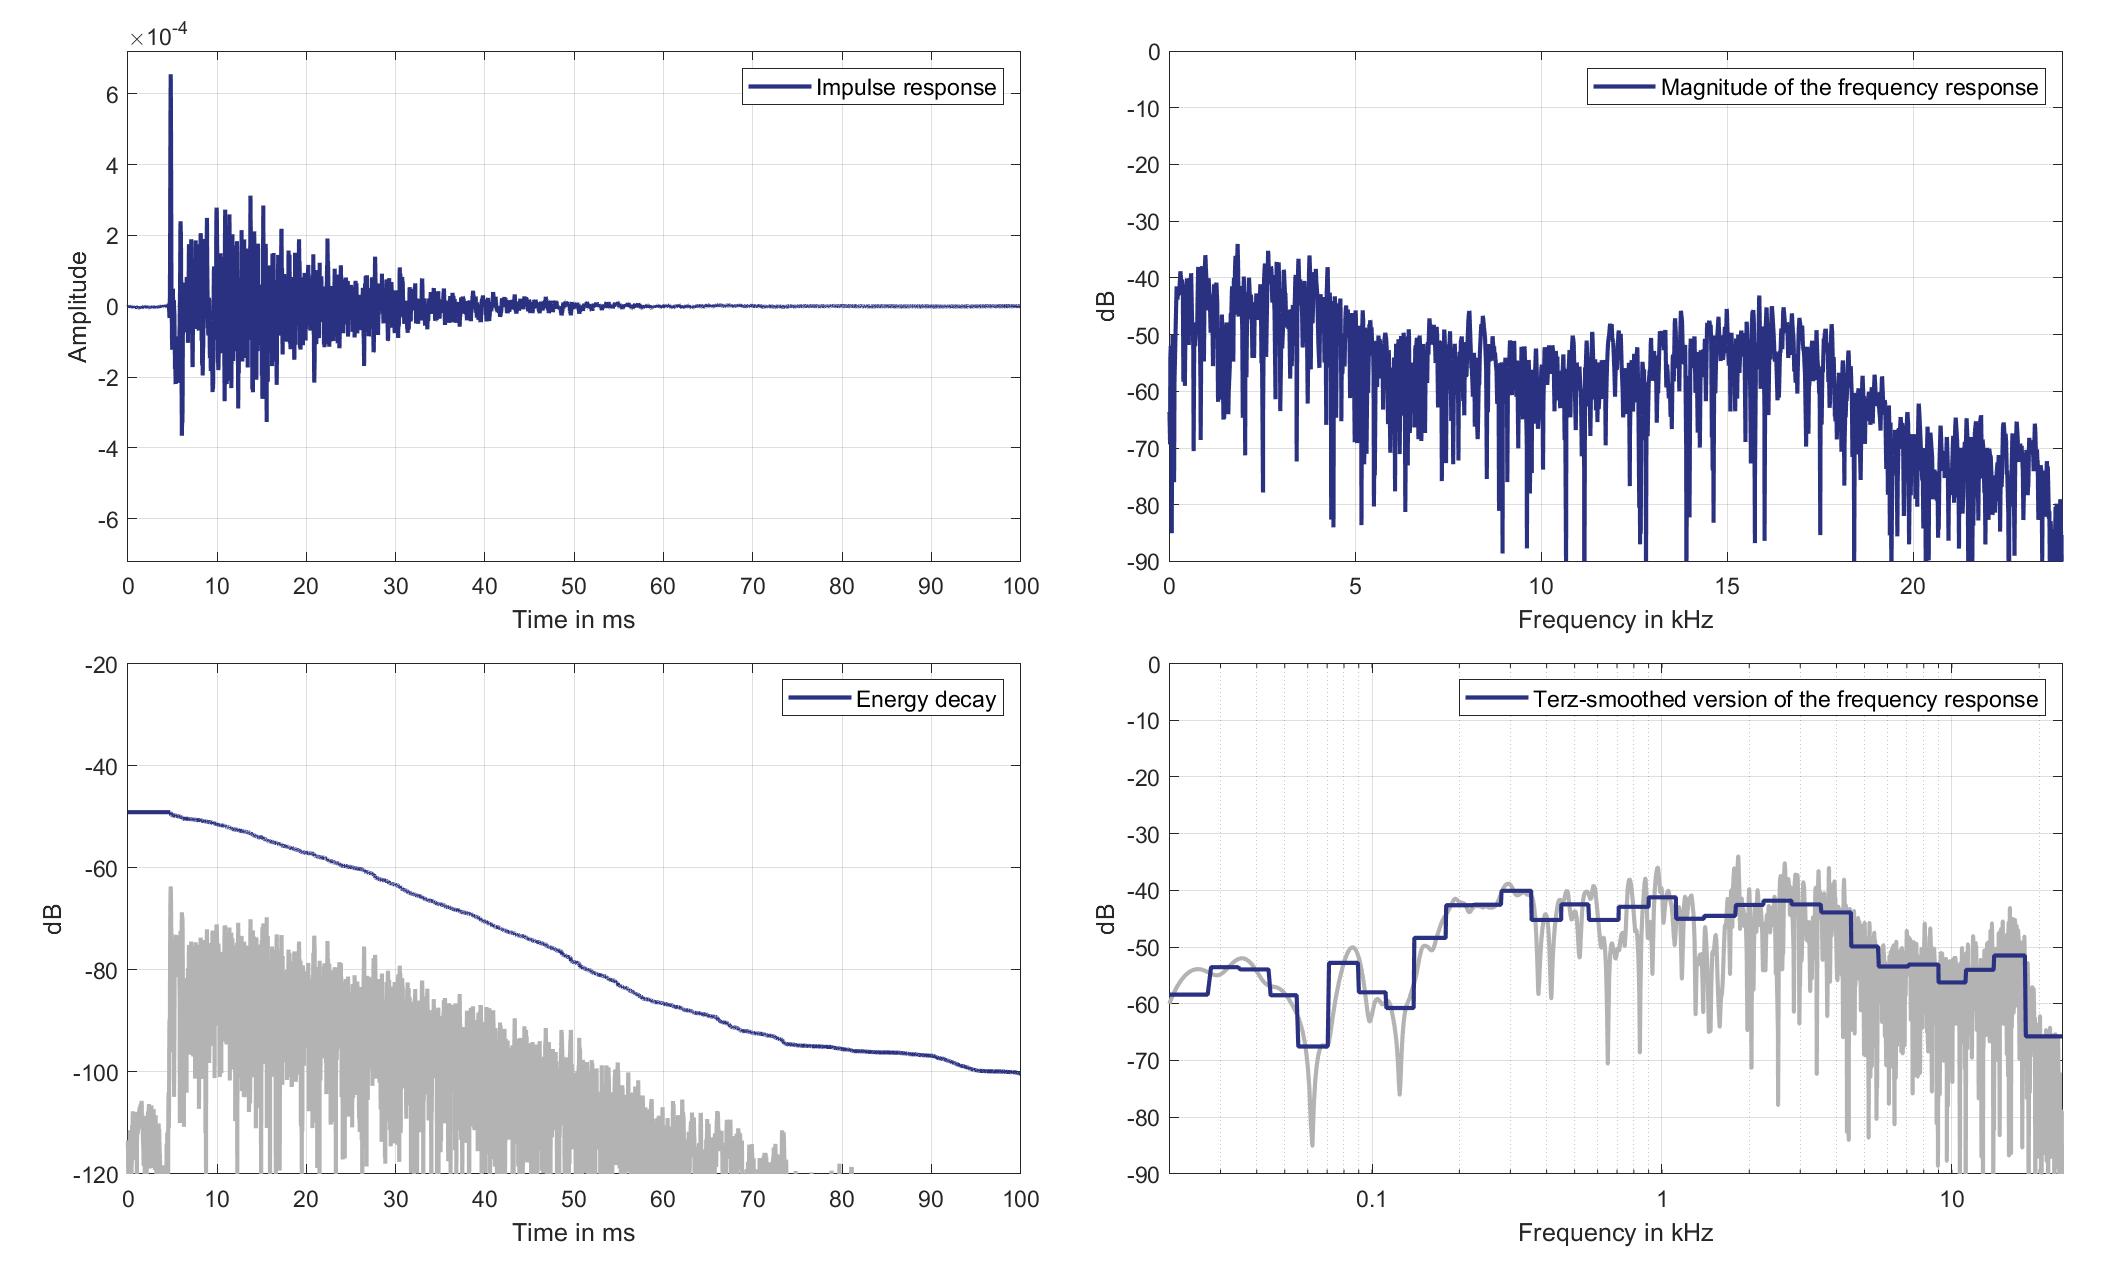
Download impulse response (in ".fir" format).
In the download section you can download all impulse response files as well as format explanation and Matlab as well as Python code examples for loading fir files.
Right lsp. - left ear mic.
Right Headrest Loudspeaker of Zone 2 (Lsp. 3) to Left Ear Microphone of Zone 8 (Mic. 29)
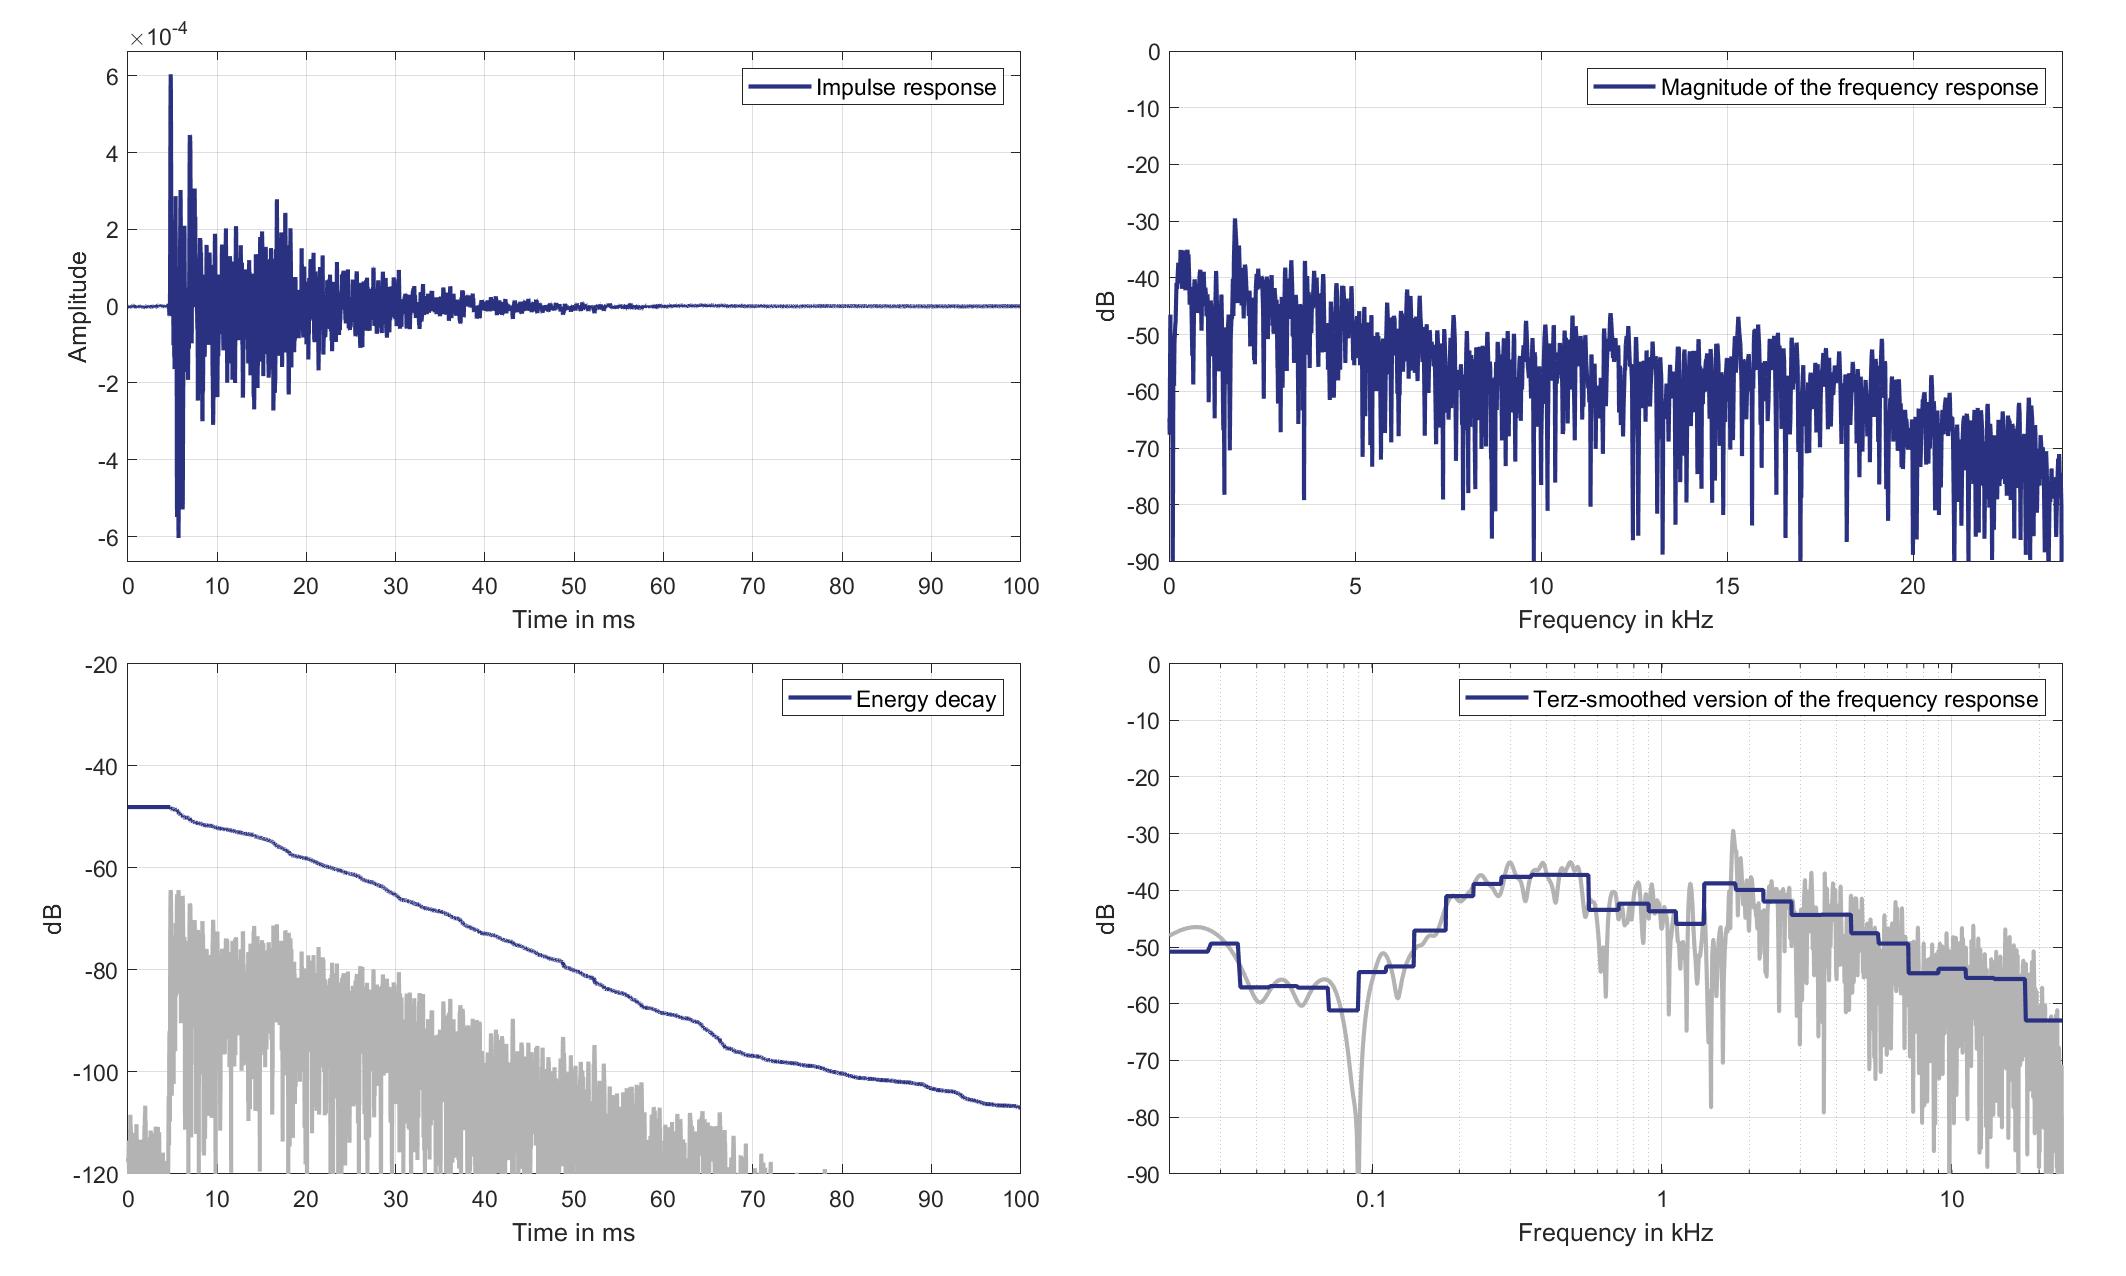
Download impulse response (in ".fir" format).
In the download section you can download all impulse response files as well as format explanation and Matlab as well as Python code examples for loading fir files.
Right lsp. - Right ear mic.
Right Headrest Loudspeaker of Zone 2 (Lsp. 3 to Right Ear Microphone of Zone 8 (Mic. 30)
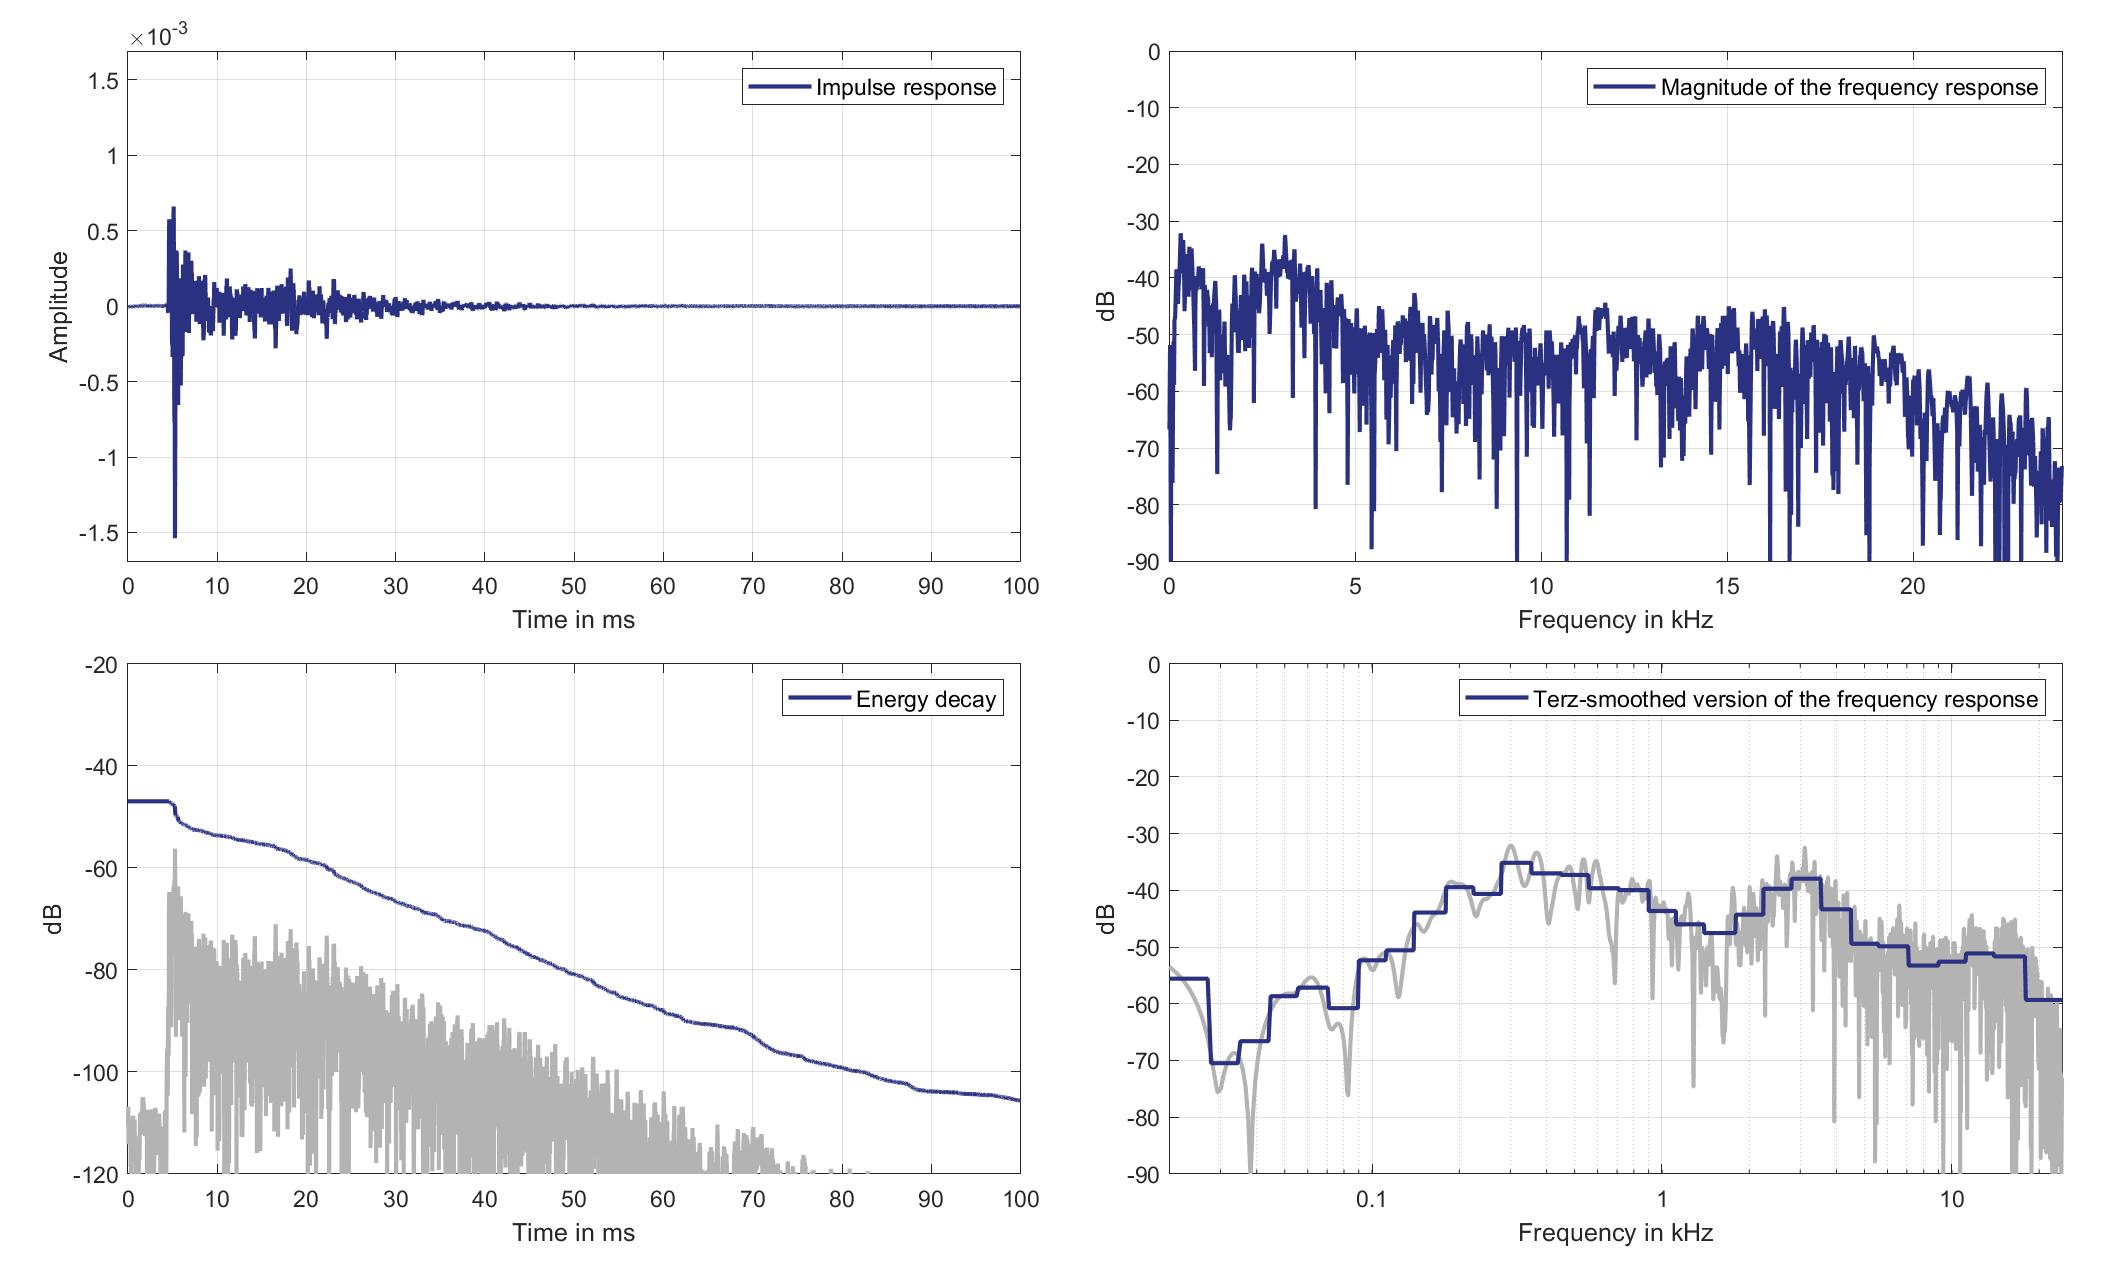
Download impulse response (in ".fir" format).
In the download section you can download all impulse response files as well as format explanation and Matlab as well as Python code examples for loading fir files.
Lsps. 4/5
Mics. 19/20
Left lsp. - left ear mic.
Left Headrest Loudspeaker of Zone 3 (Lsp. 4) to Left Ear Microphone of Zone 1 (Mic. 19)
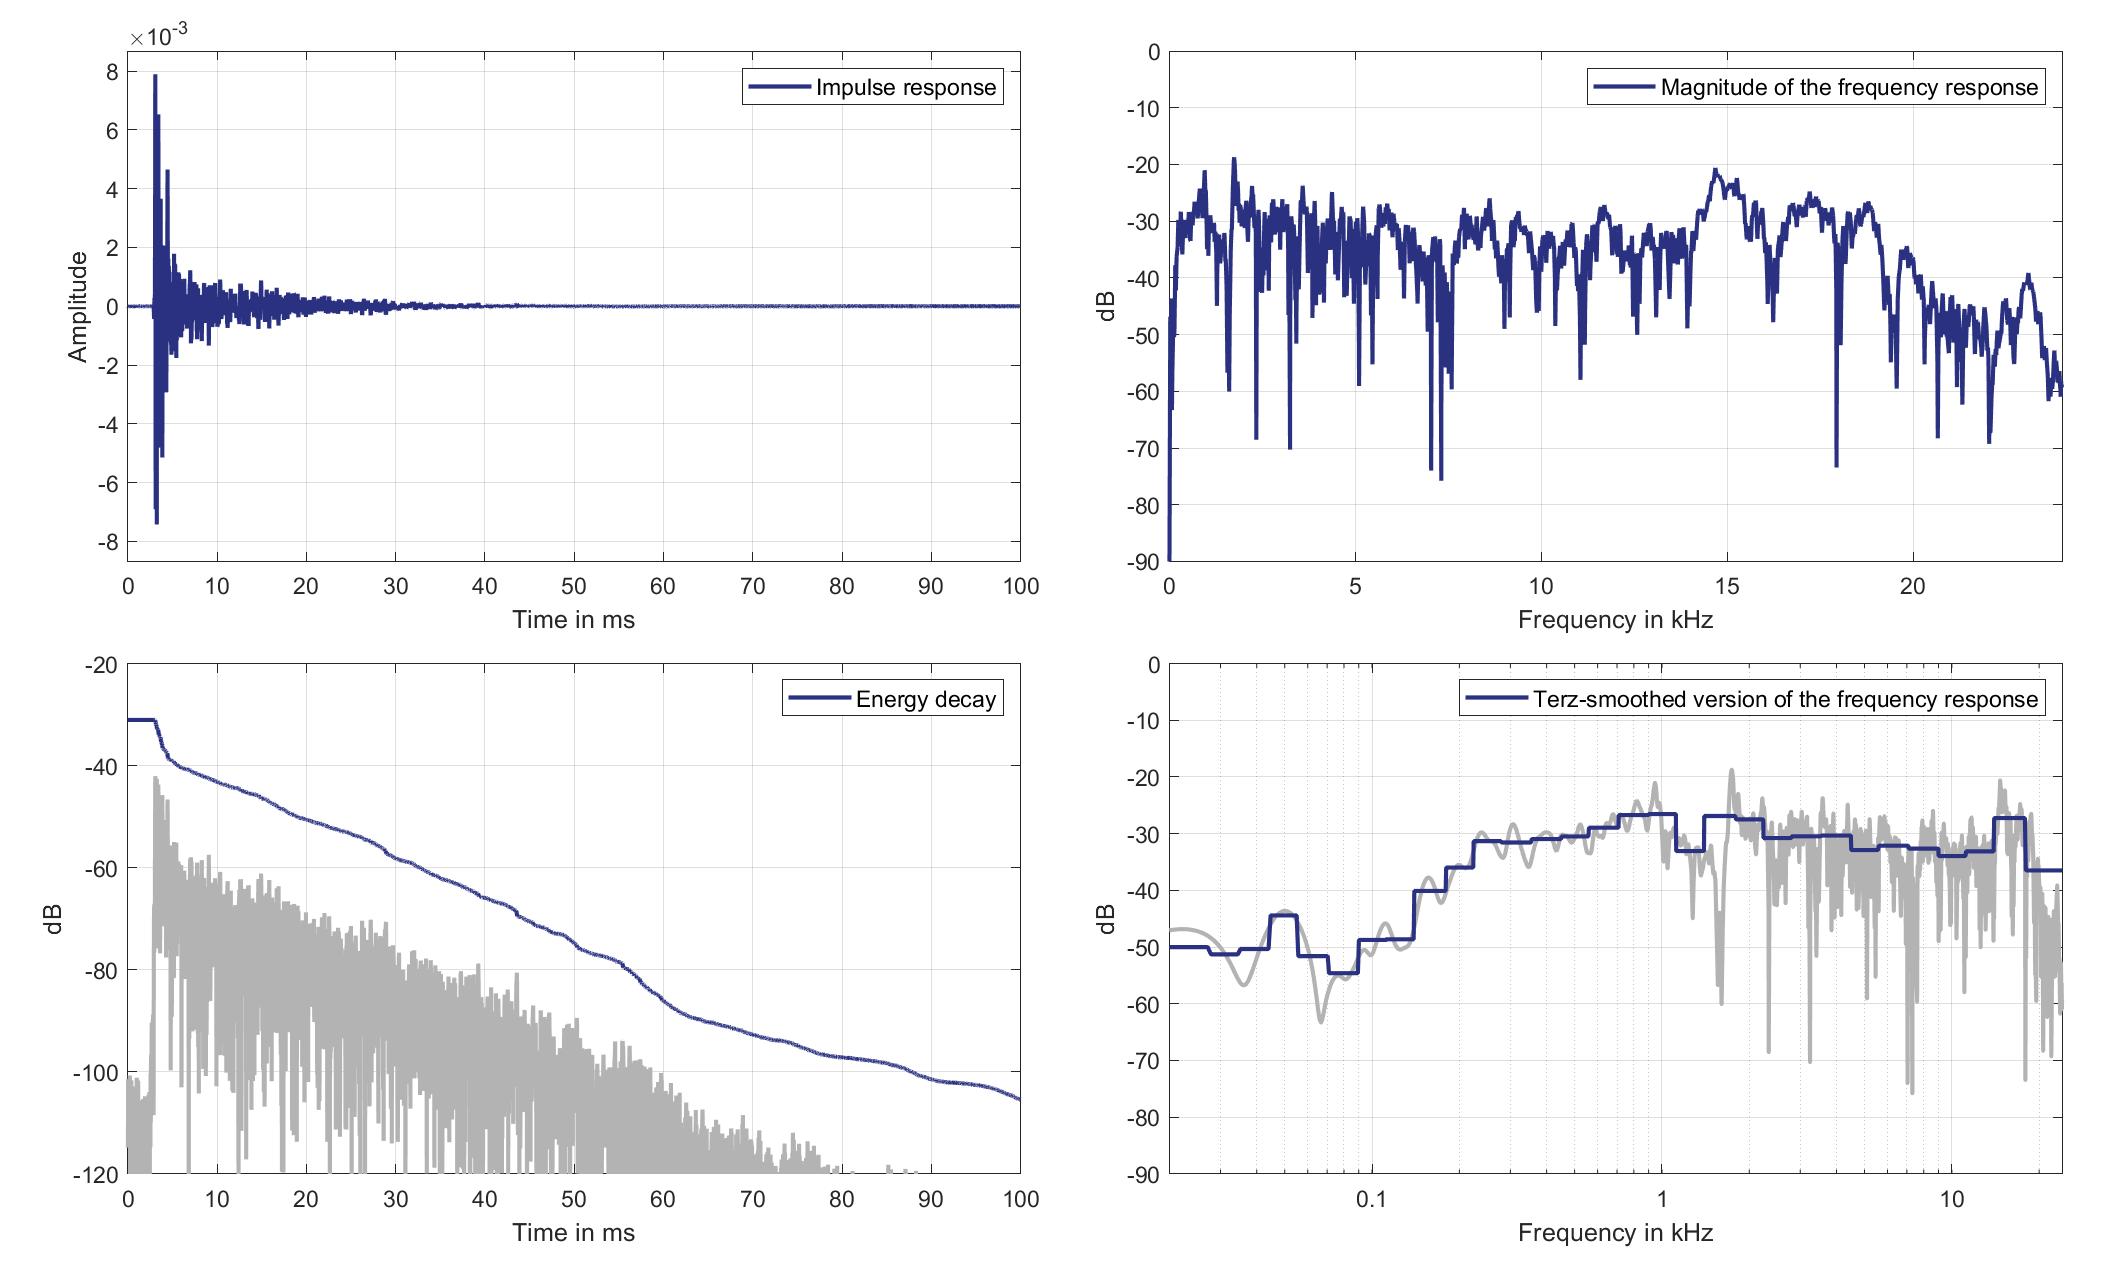
Download impulse response (in ".fir" format).
In the download section you can download all impulse response files as well as format explanation and Matlab as well as Python code examples for loading fir files.
Left lsp. - Right ear mic.
Left Headrest Loudspeaker of Zone 3 (Lsp. 4) to Right Ear Microphone of Zone 1 (Mic. 20)
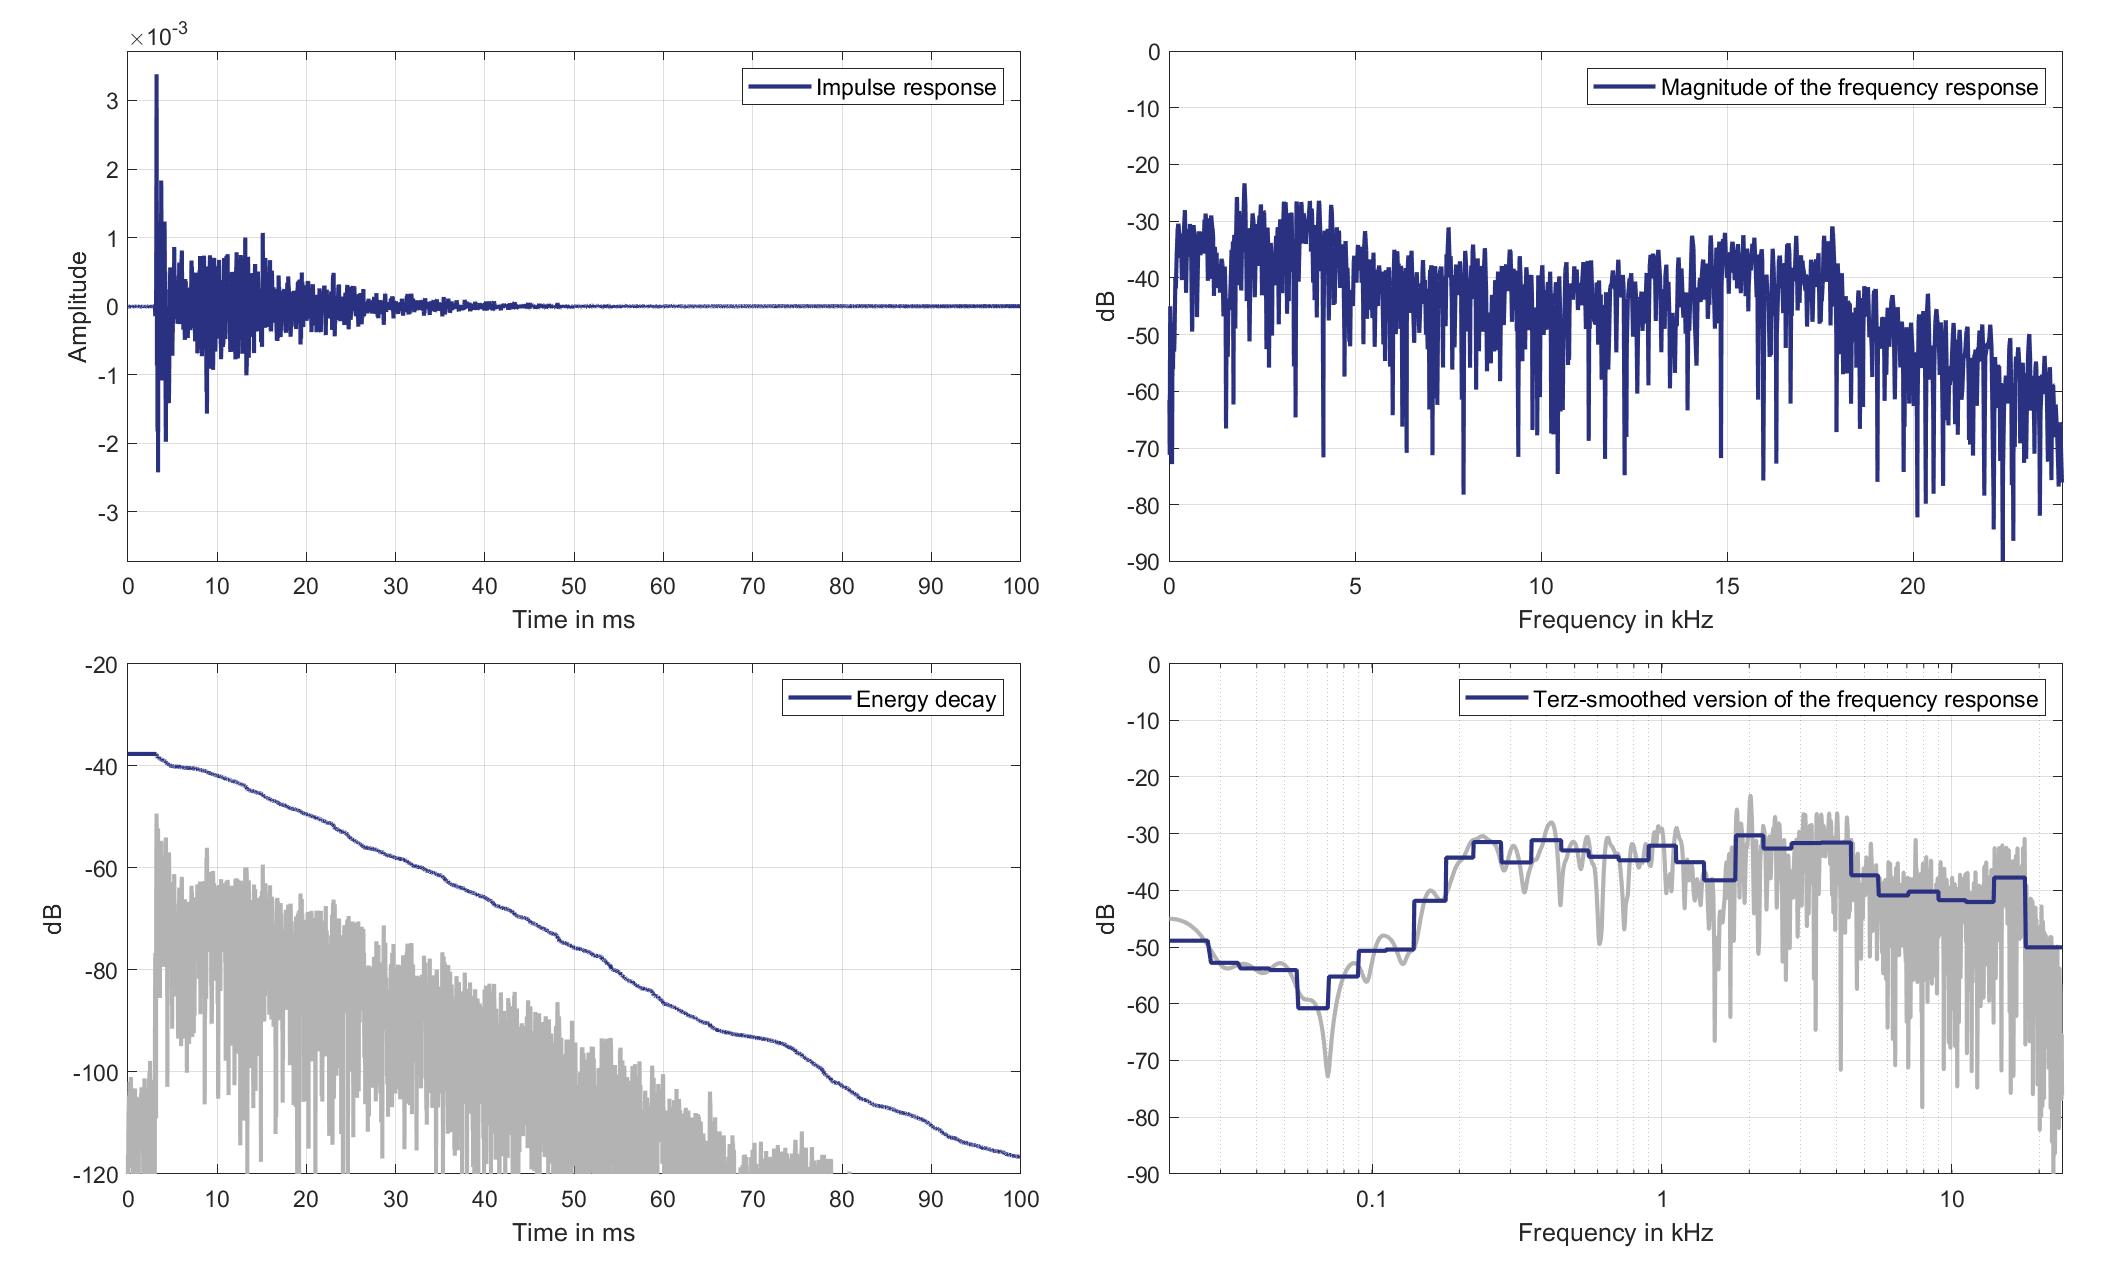
Download impulse response (in ".fir" format).
In the download section you can download all impulse response files as well as format explanation and Matlab as well as Python code examples for loading fir files.
Right lsp. - left ear mic.
Right Headrest Loudspeaker of Zone 3 (Lsp. 5) to Left Ear Microphone of Zone 1 (Mic. 19)
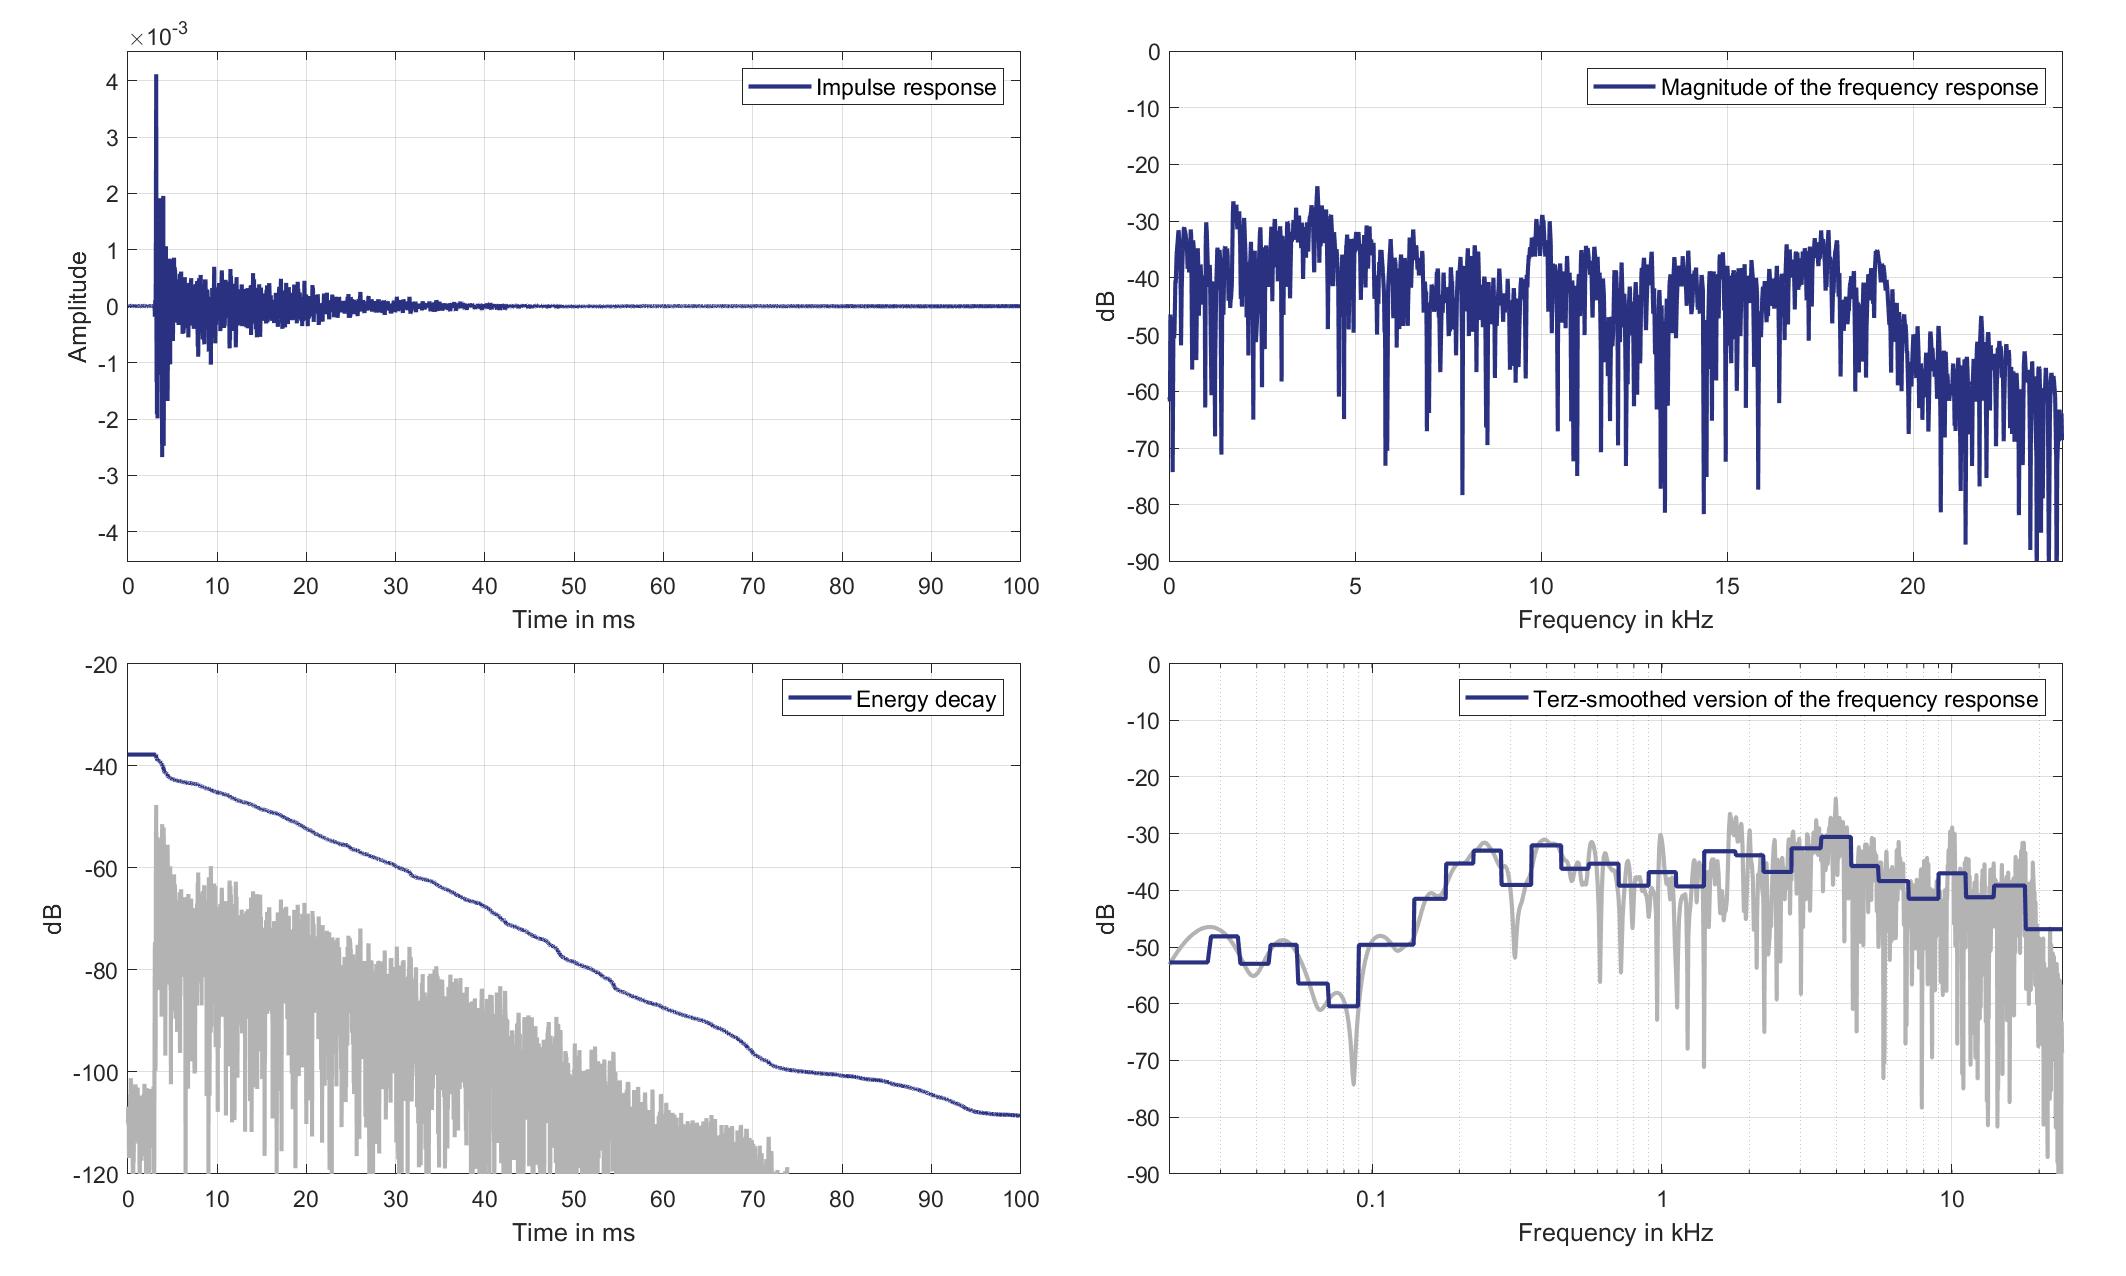
Download impulse response (in ".fir" format).
In the download section you can download all impulse response files as well as format explanation and Matlab as well as Python code examples for loading fir files.
Right lsp. - Right ear mic.
Right Headrest Loudspeaker of Zone 3 (Lsp. 5 to Right Ear Microphone of Zone 1 (Mic. 20)
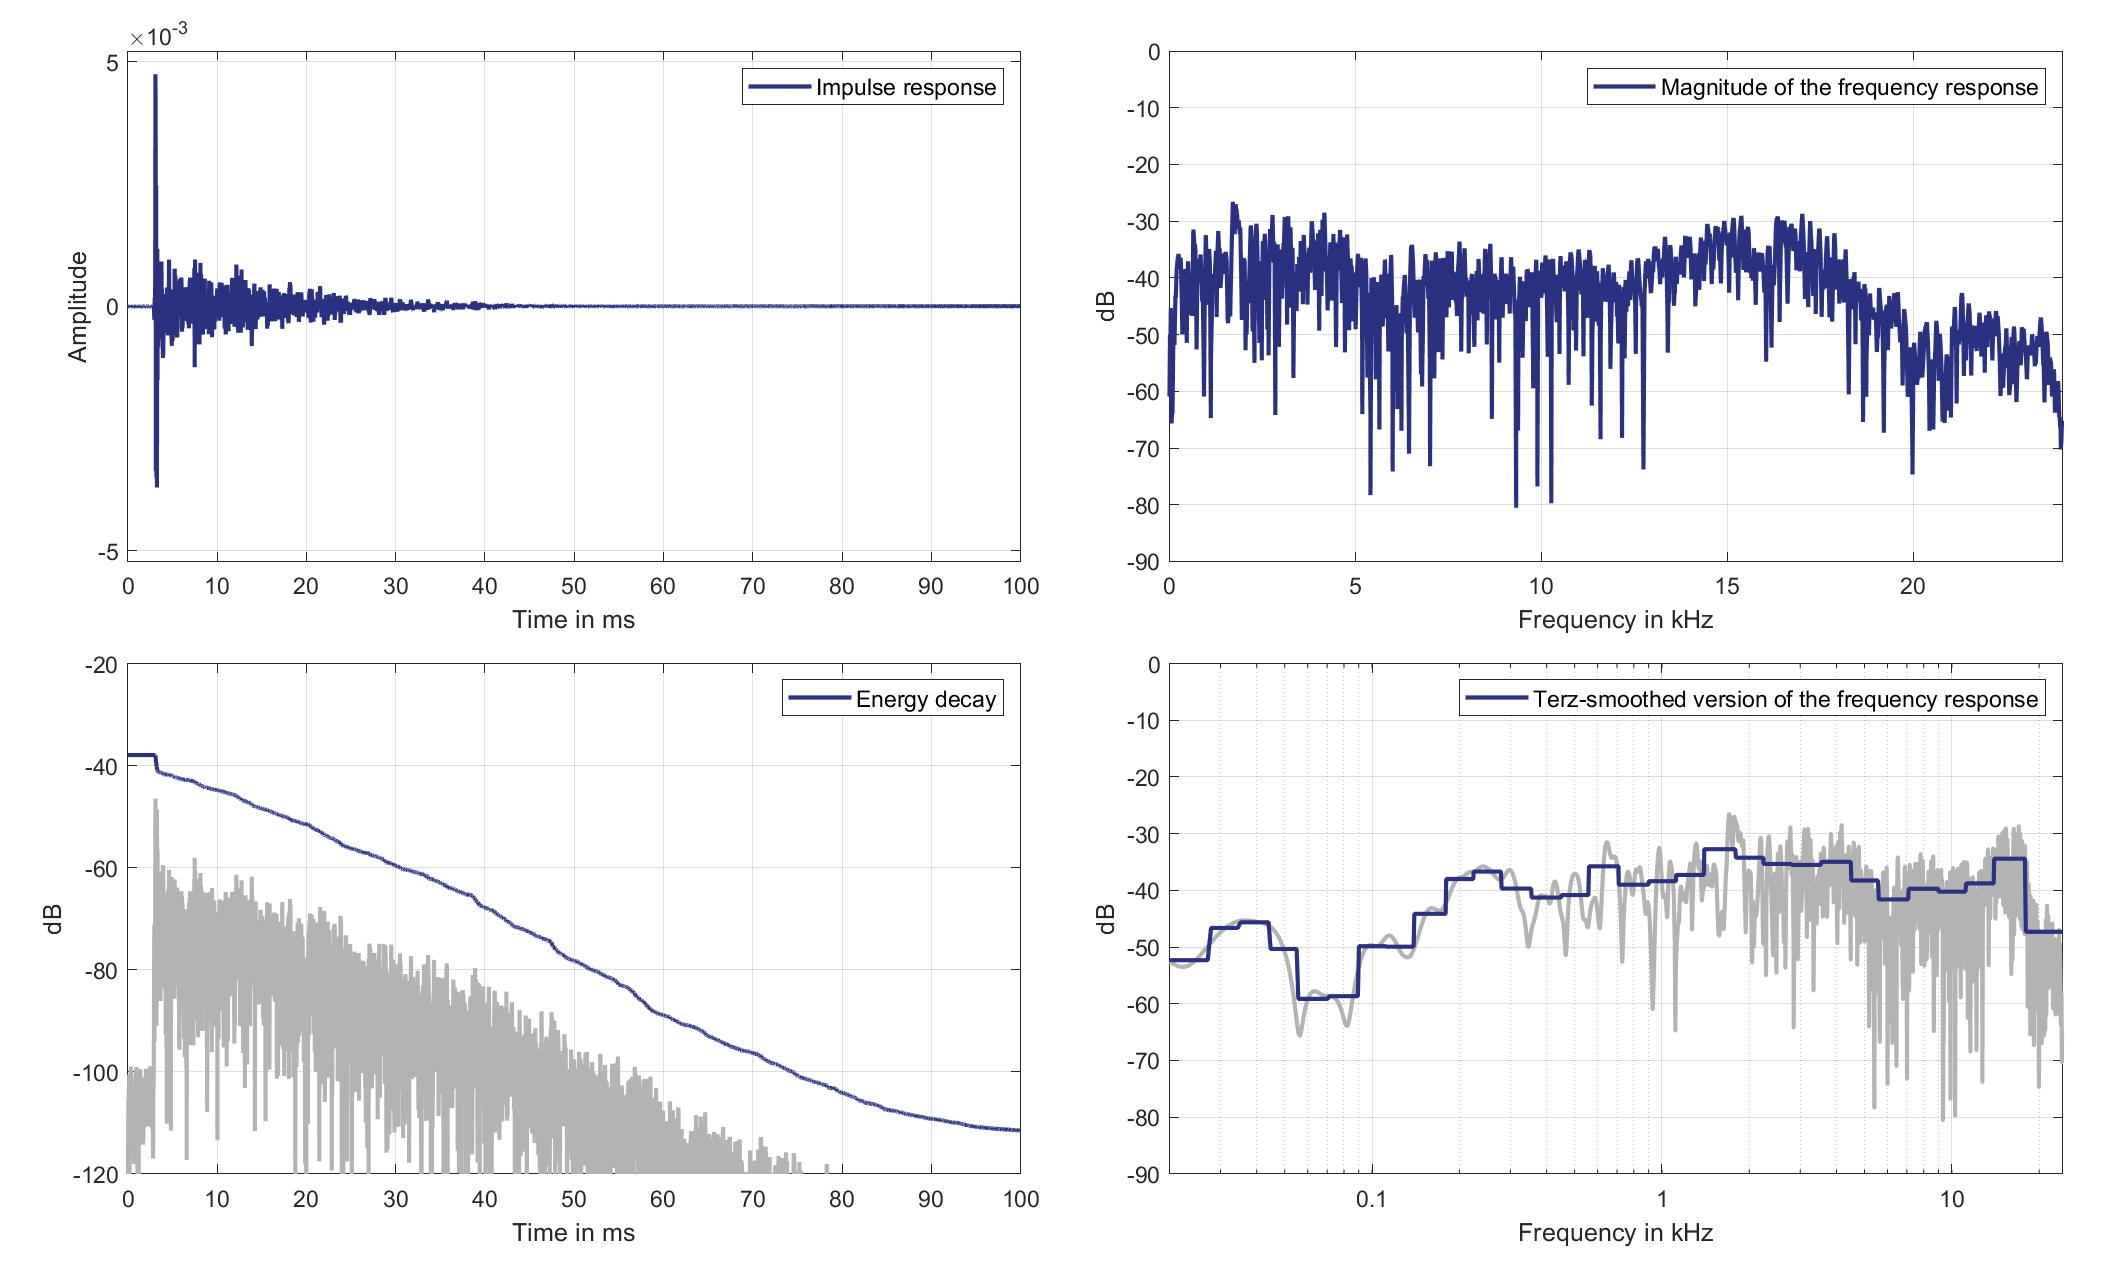
Download impulse response (in ".fir" format).
In the download section you can download all impulse response files as well as format explanation and Matlab as well as Python code examples for loading fir files.
Mics. 21/22
Left lsp. - left ear mic.
Left Headrest Loudspeaker of Zone 3 (Lsp. 4) to Left Ear Microphone of Zone 2 (Mic. 21)
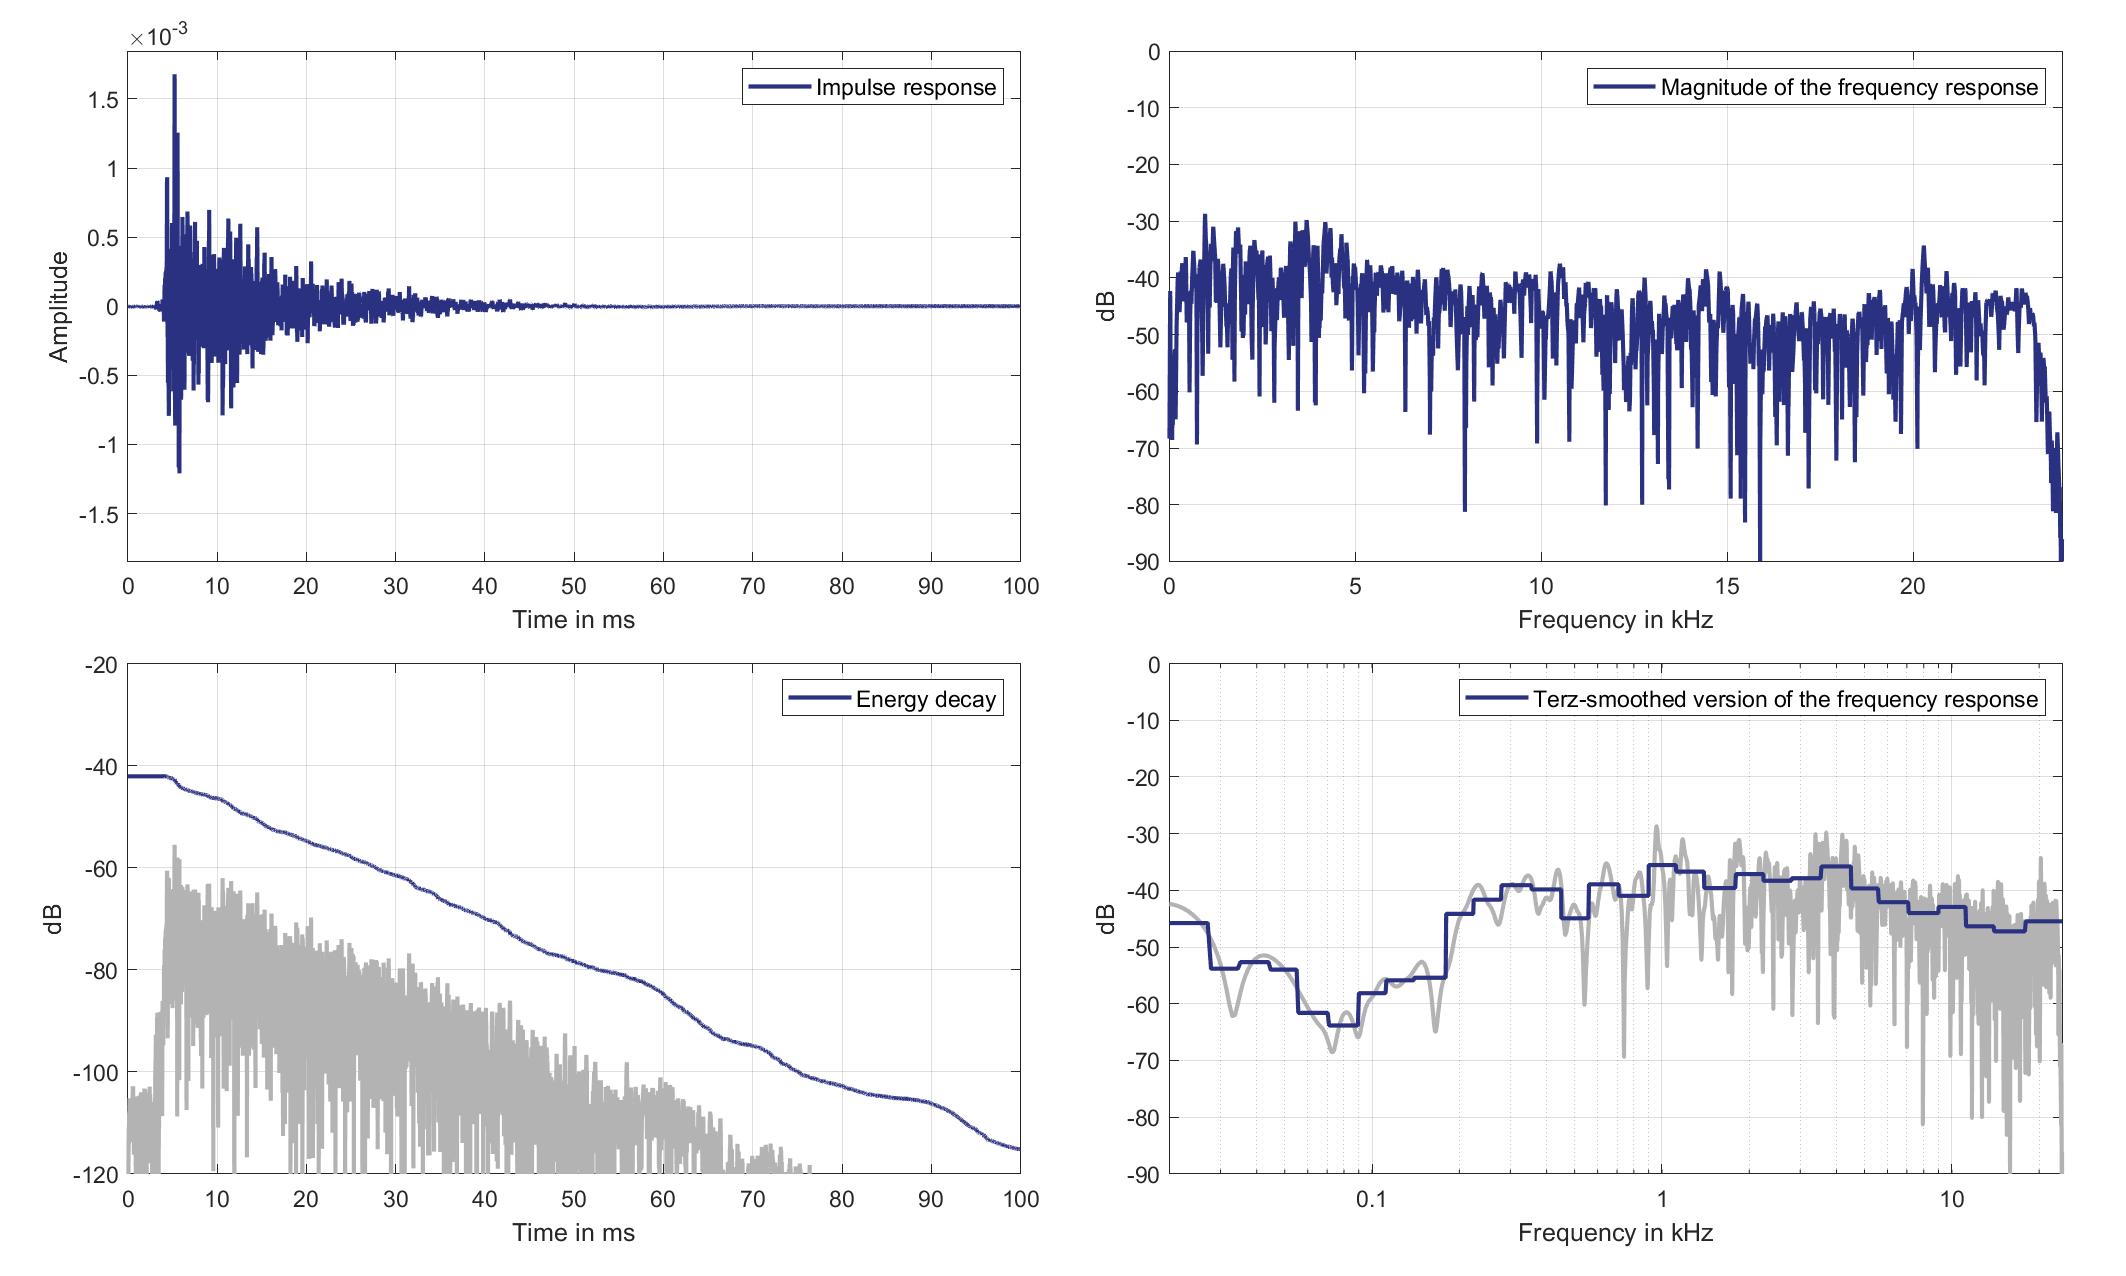
Download impulse response (in ".fir" format).
In the download section you can download all impulse response files as well as format explanation and Matlab as well as Python code examples for loading fir files.
Left lsp. - Right ear mic.
Left Headrest Loudspeaker of Zone 3 (Lsp. 4) to Right Ear Microphone of Zone 2 (Mic. 22)
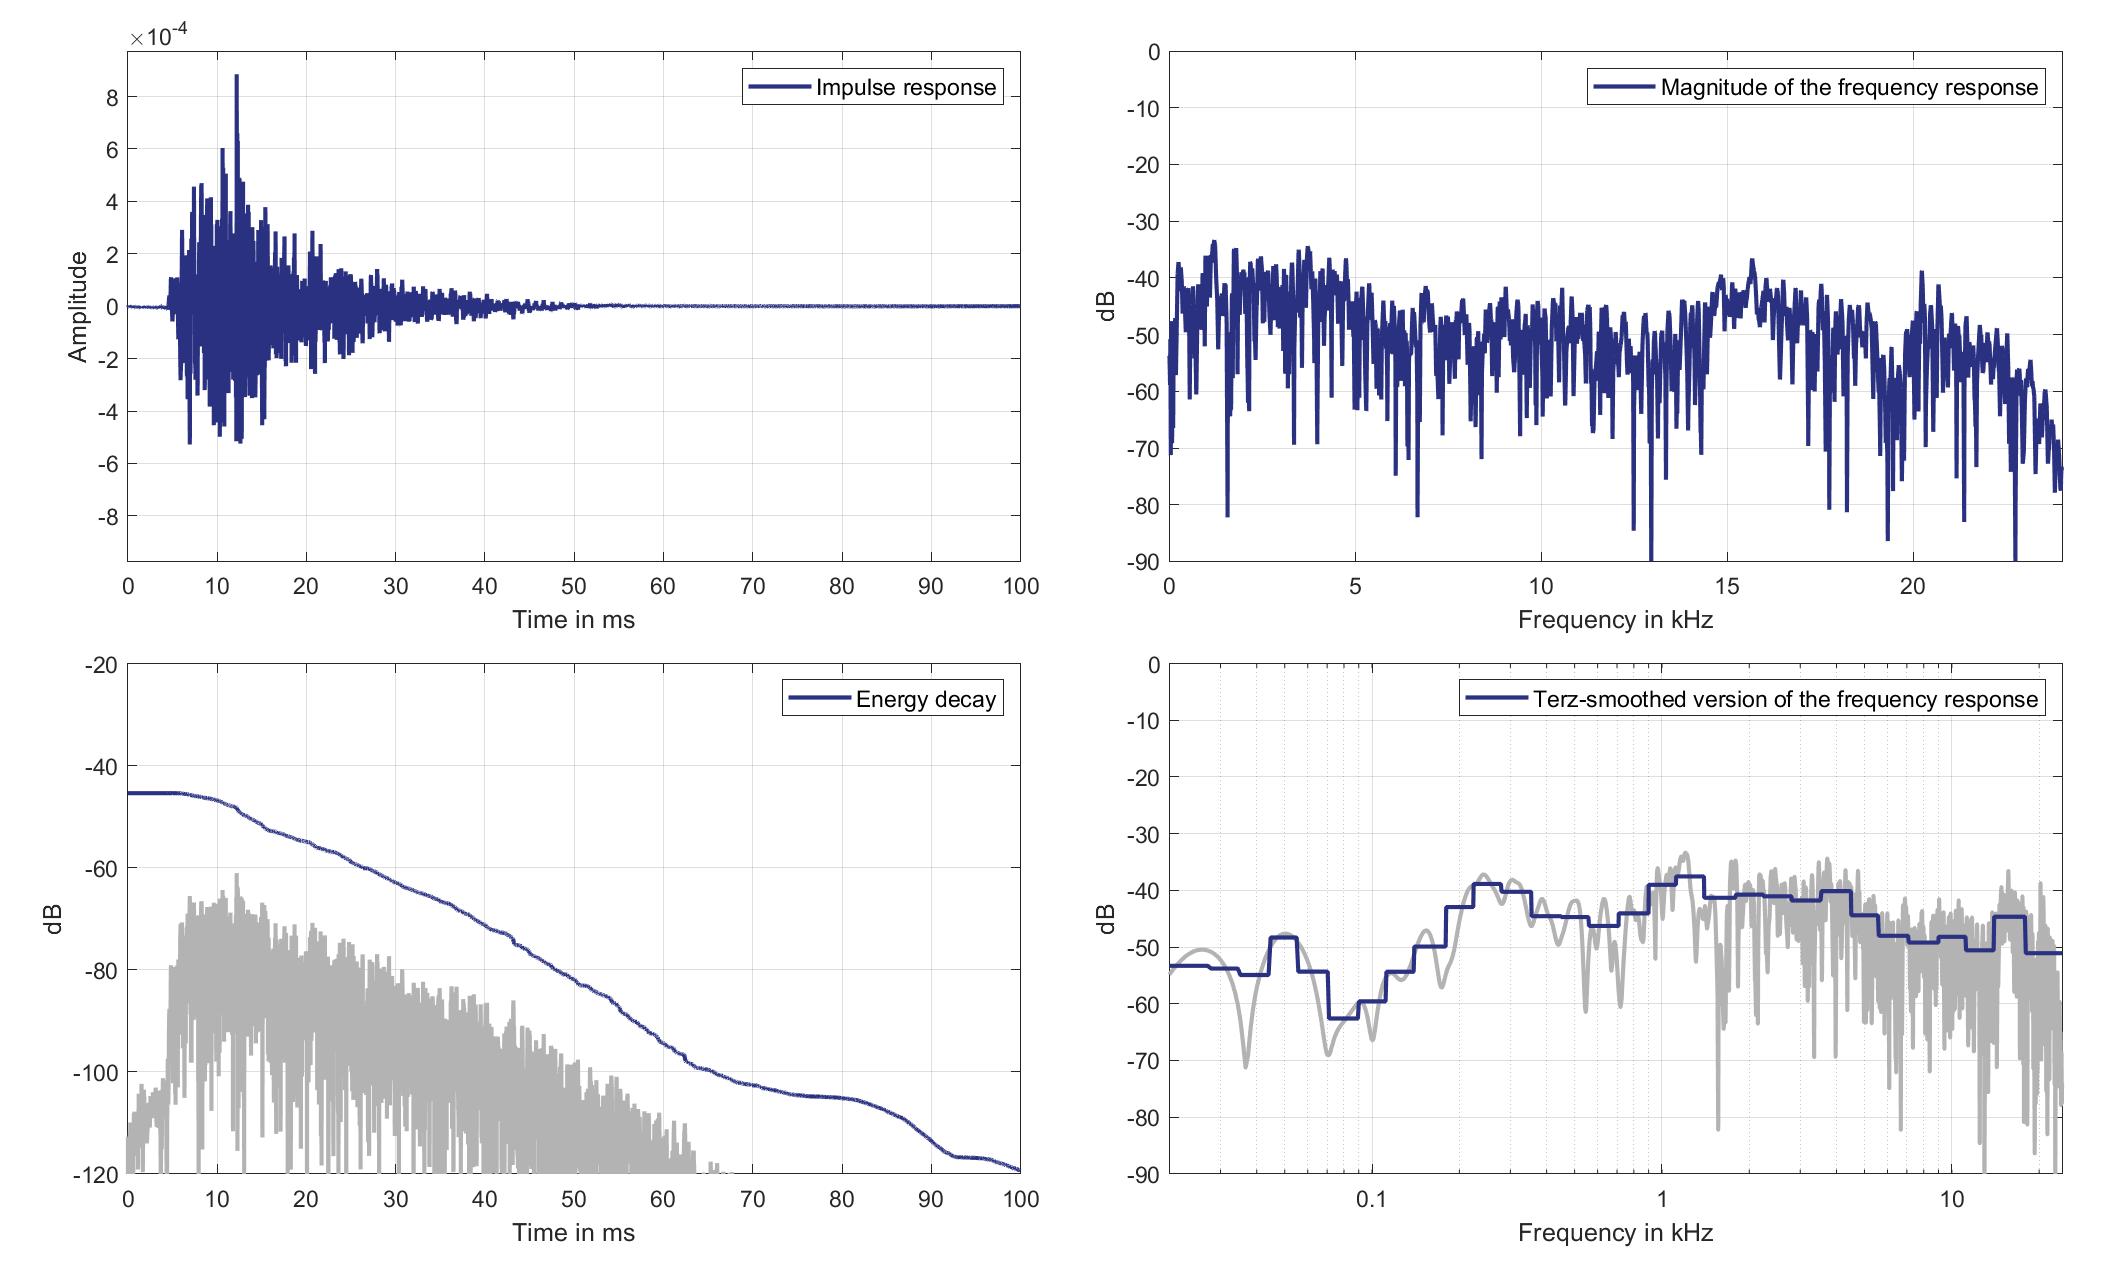
Download impulse response (in ".fir" format).
In the download section you can download all impulse response files as well as format explanation and Matlab as well as Python code examples for loading fir files.
Right lsp. - left ear mic.
Right Headrest Loudspeaker of Zone 3 (Lsp. 5) to Left Ear Microphone of Zone 2 (Mic. 21)
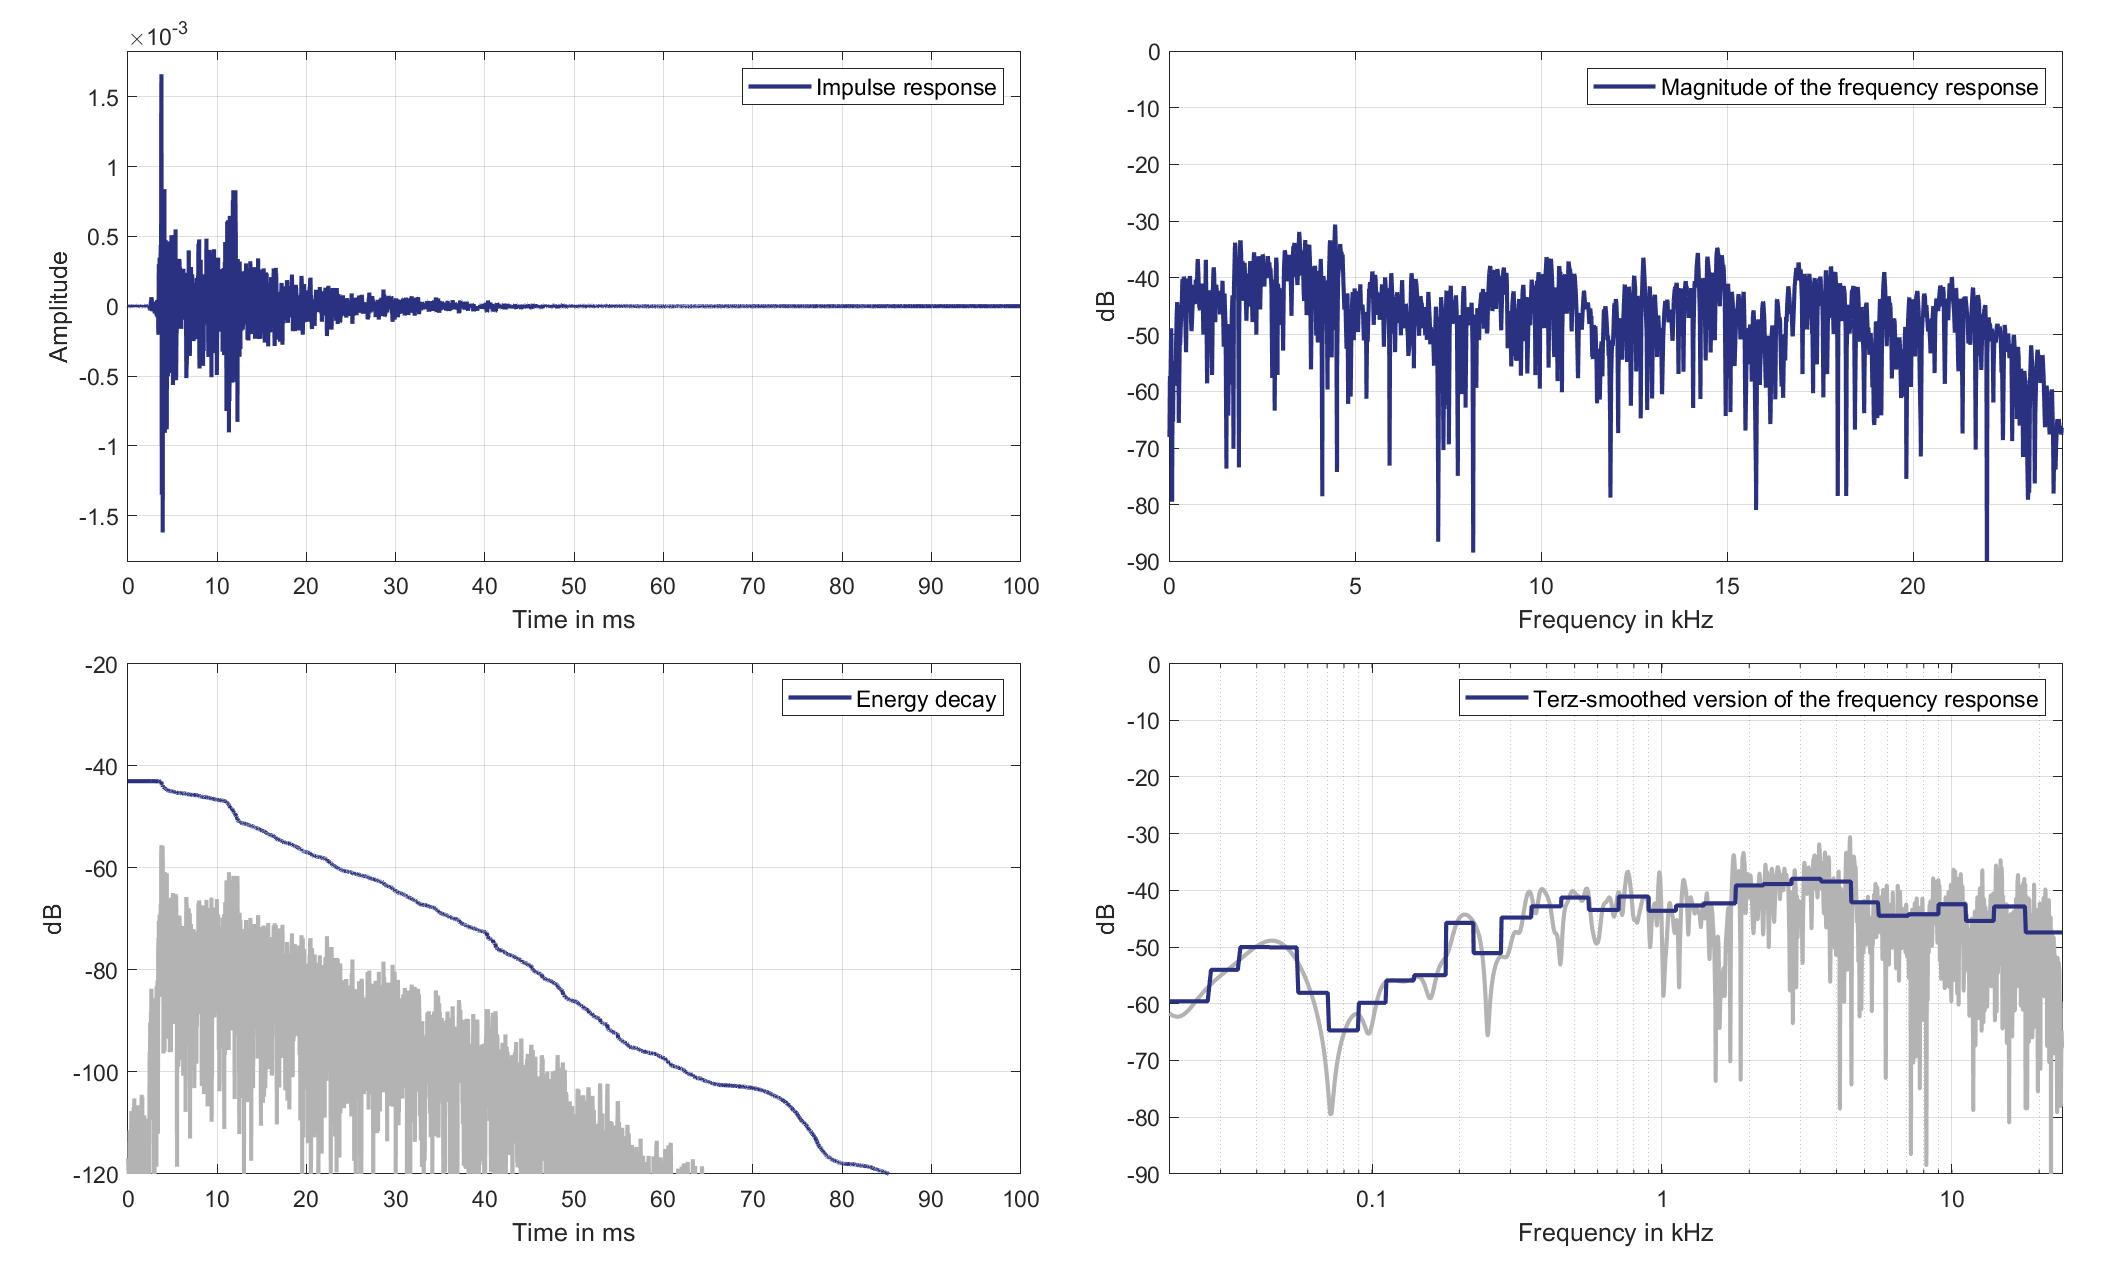
Download impulse response (in ".fir" format).
In the download section you can download all impulse response files as well as format explanation and Matlab as well as Python code examples for loading fir files.
Right lsp. - Right ear mic.
Right Headrest Loudspeaker of Zone 3 (Lsp. 5 to Right Ear Microphone of Zone 2 (Mic. 22)
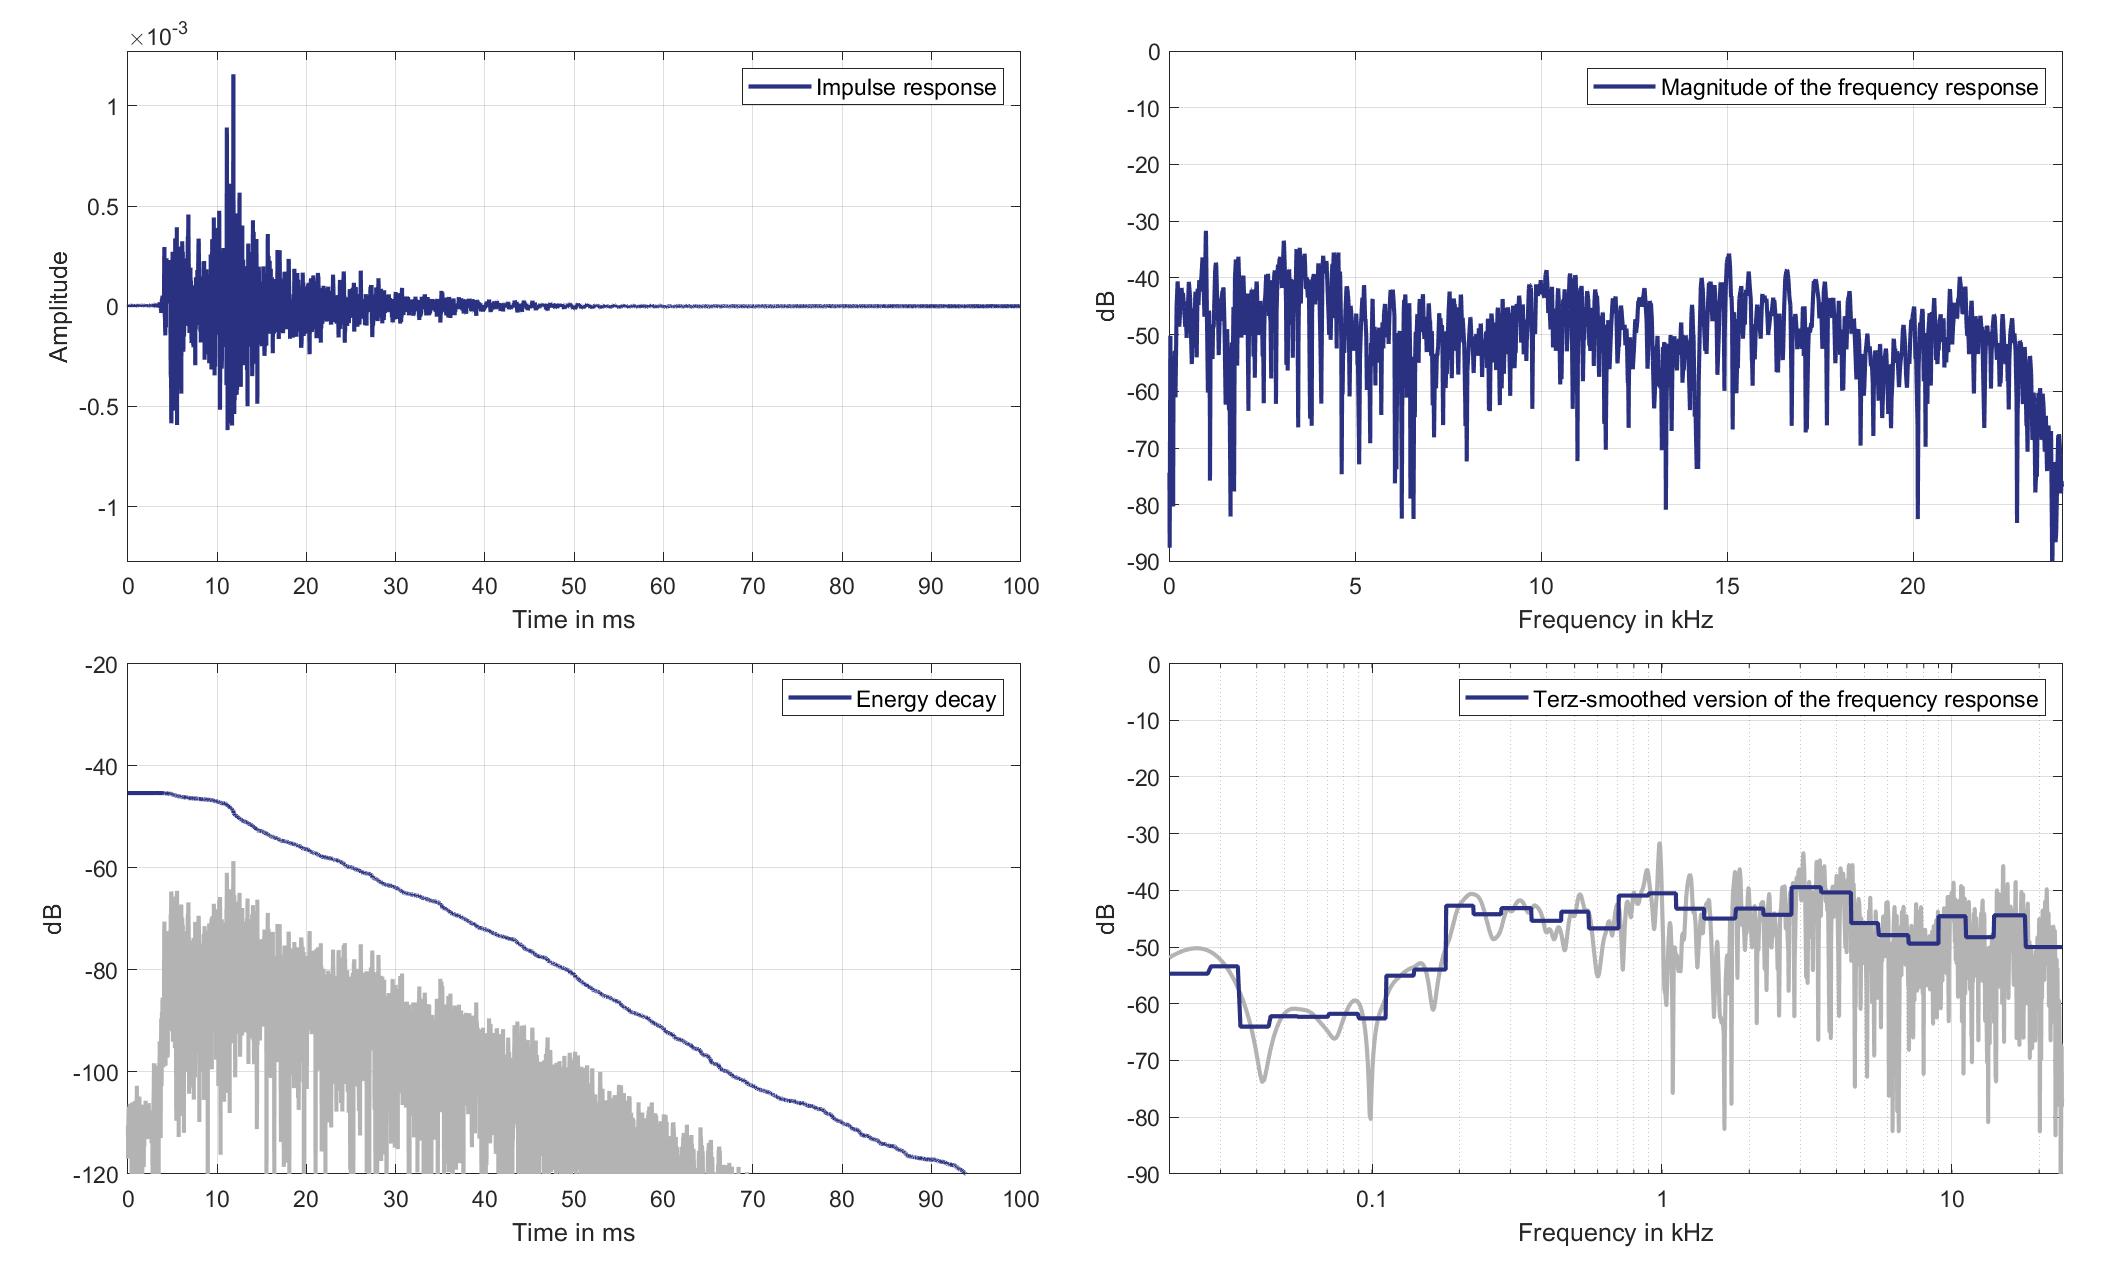
Download impulse response (in ".fir" format).
In the download section you can download all impulse response files as well as format explanation and Matlab as well as Python code examples for loading fir files.
Mics. 23/24
Left lsp. - left ear mic.
Left Headrest Loudspeaker of Zone 3 (Lsp. 4) to Left Ear Microphone of Zone 3 (Mic. 23)
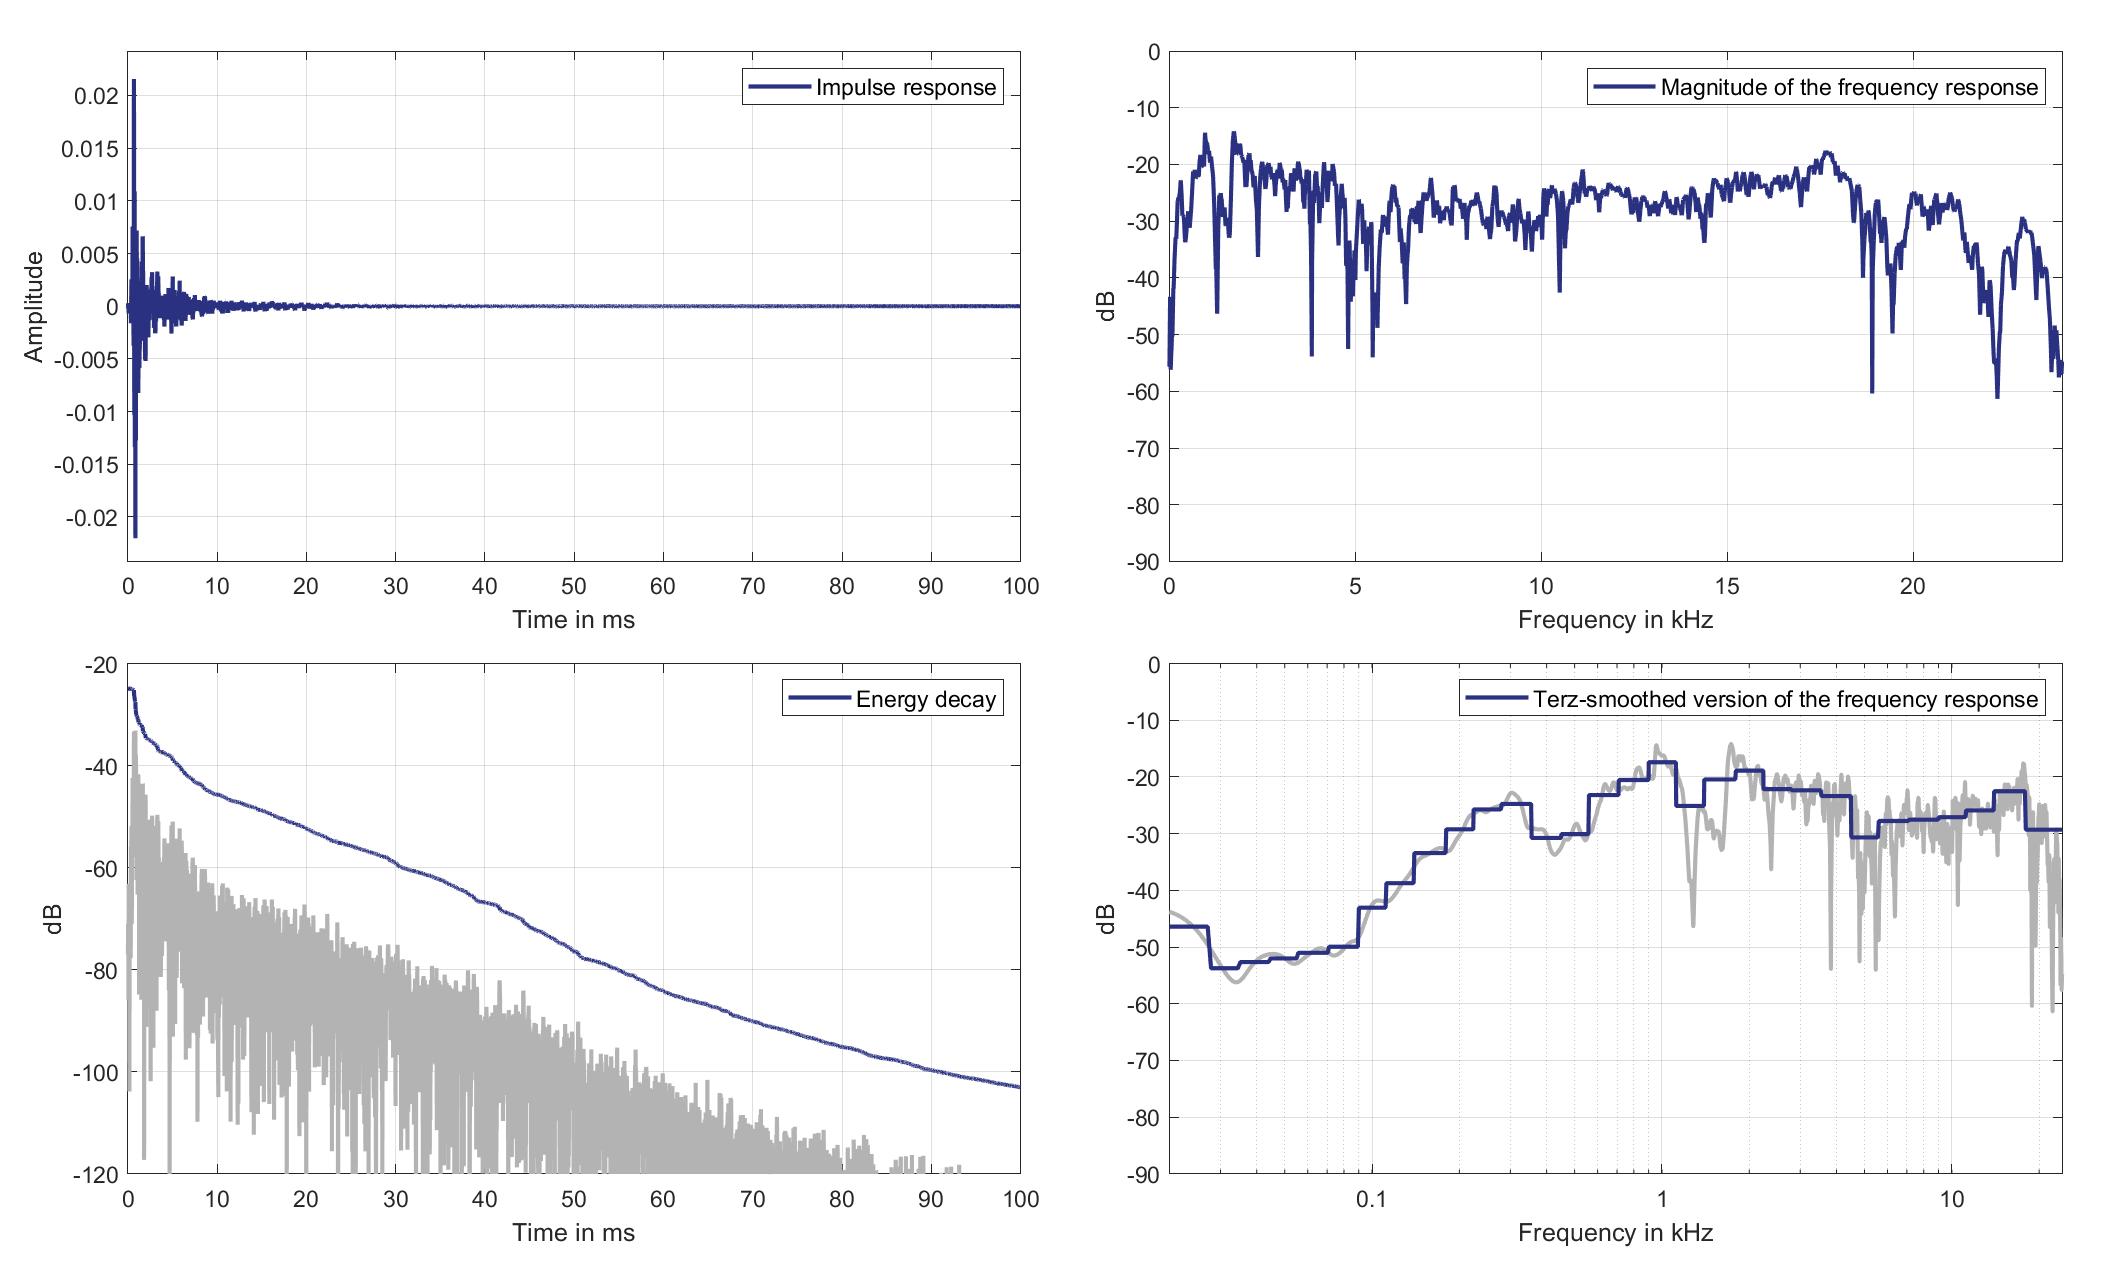
Download impulse response (in ".fir" format).
In the download section you can download all impulse response files as well as format explanation and Matlab as well as Python code examples for loading fir files.
Left lsp. - Right ear mic.
Left Headrest Loudspeaker of Zone 3 (Lsp. 4) to Right Ear Microphone of Zone 3 (Mic. 24)
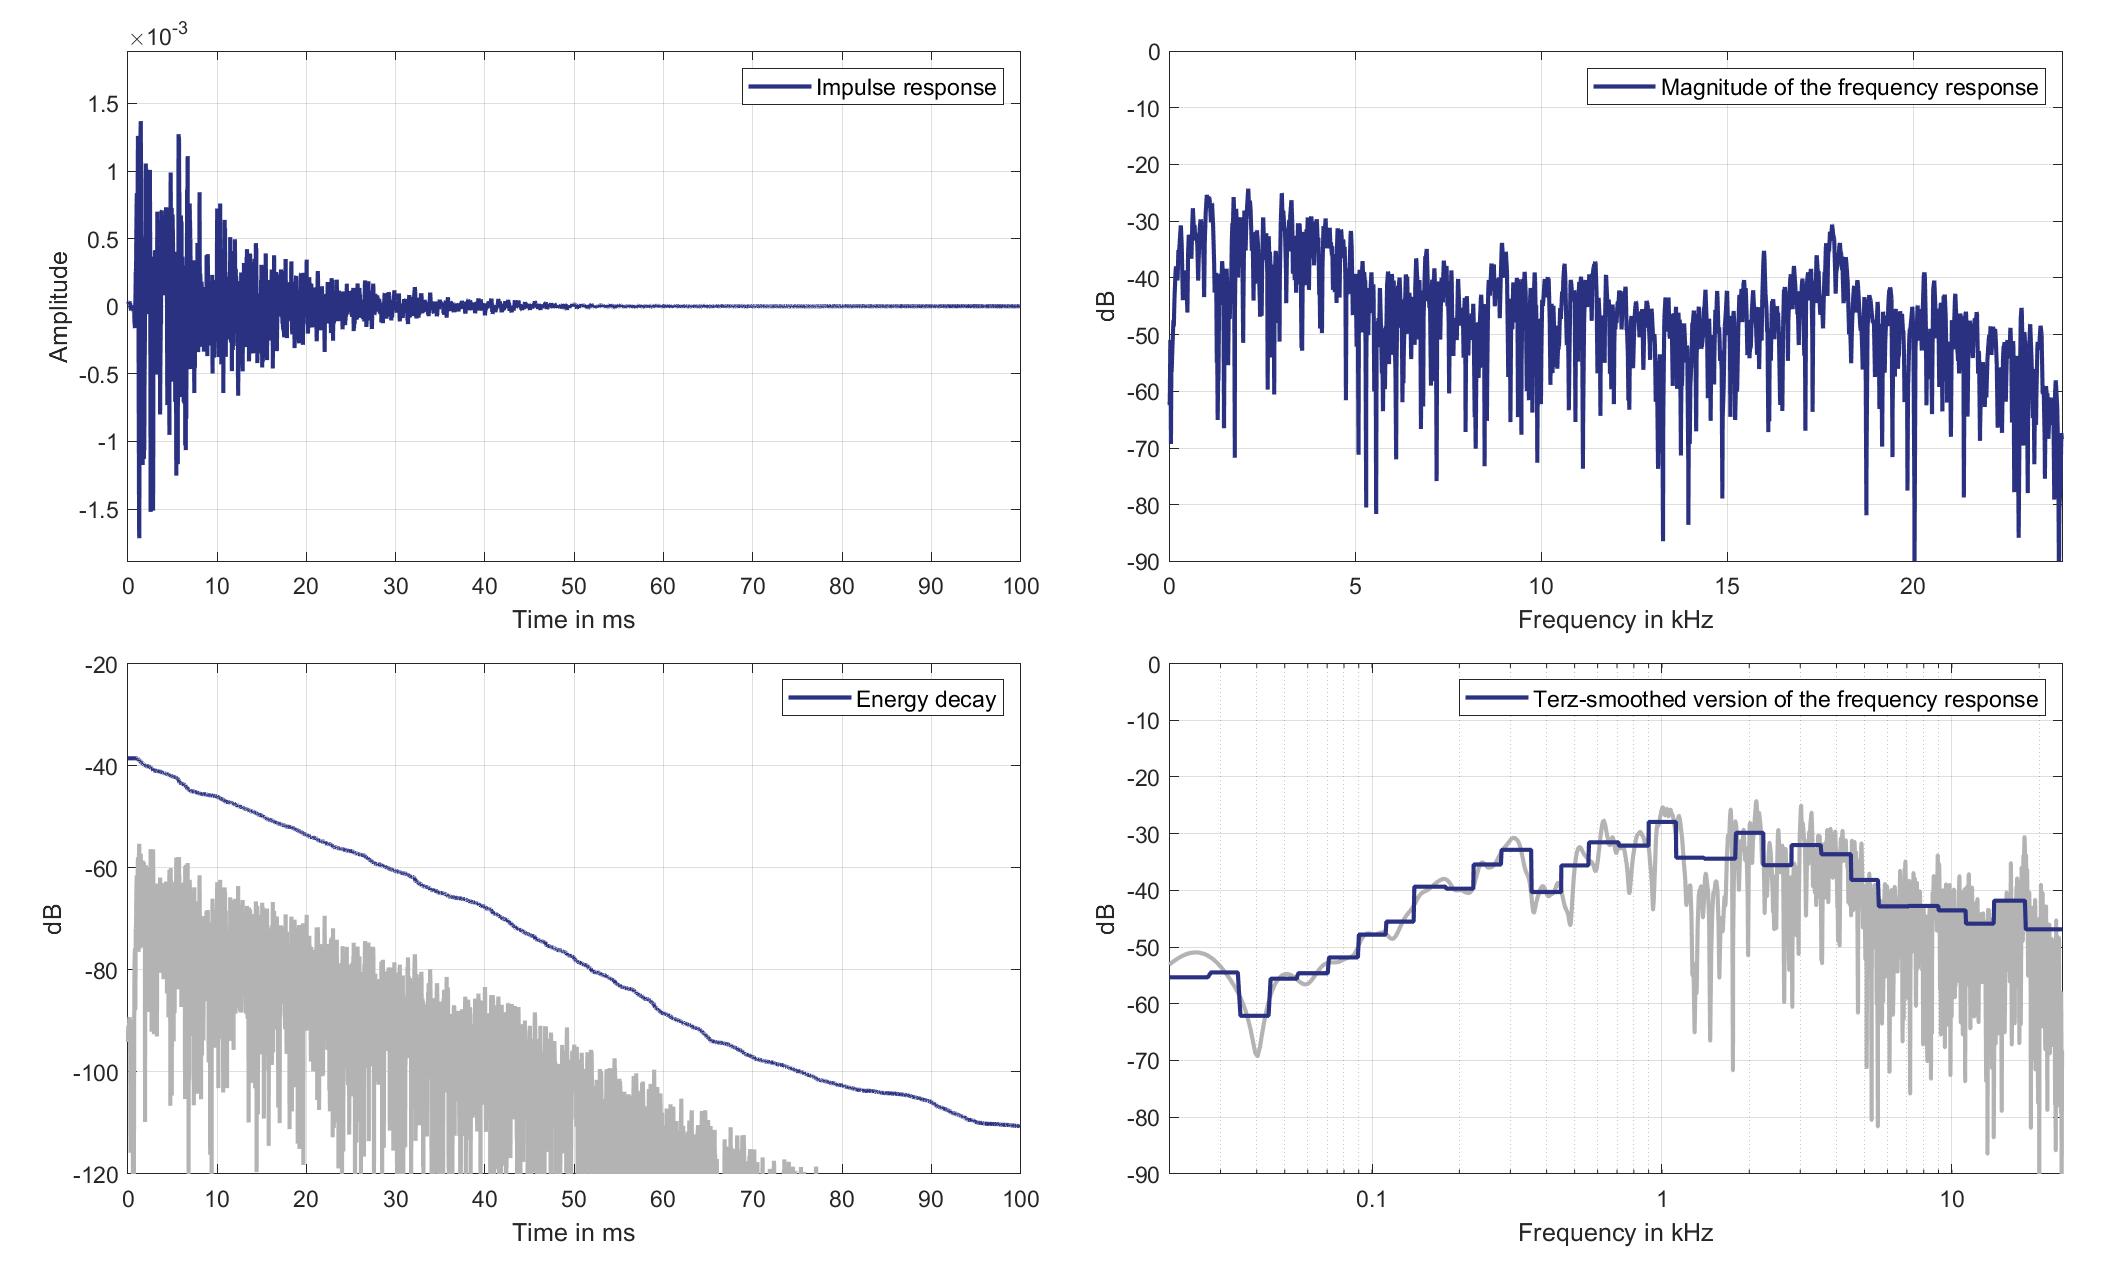
Download impulse response (in ".fir" format).
In the download section you can download all impulse response files as well as format explanation and Matlab as well as Python code examples for loading fir files.
Right lsp. - left ear mic.
Right Headrest Loudspeaker of Zone 3 (Lsp. 5) to Left Ear Microphone of Zone 3 (Mic. 23)
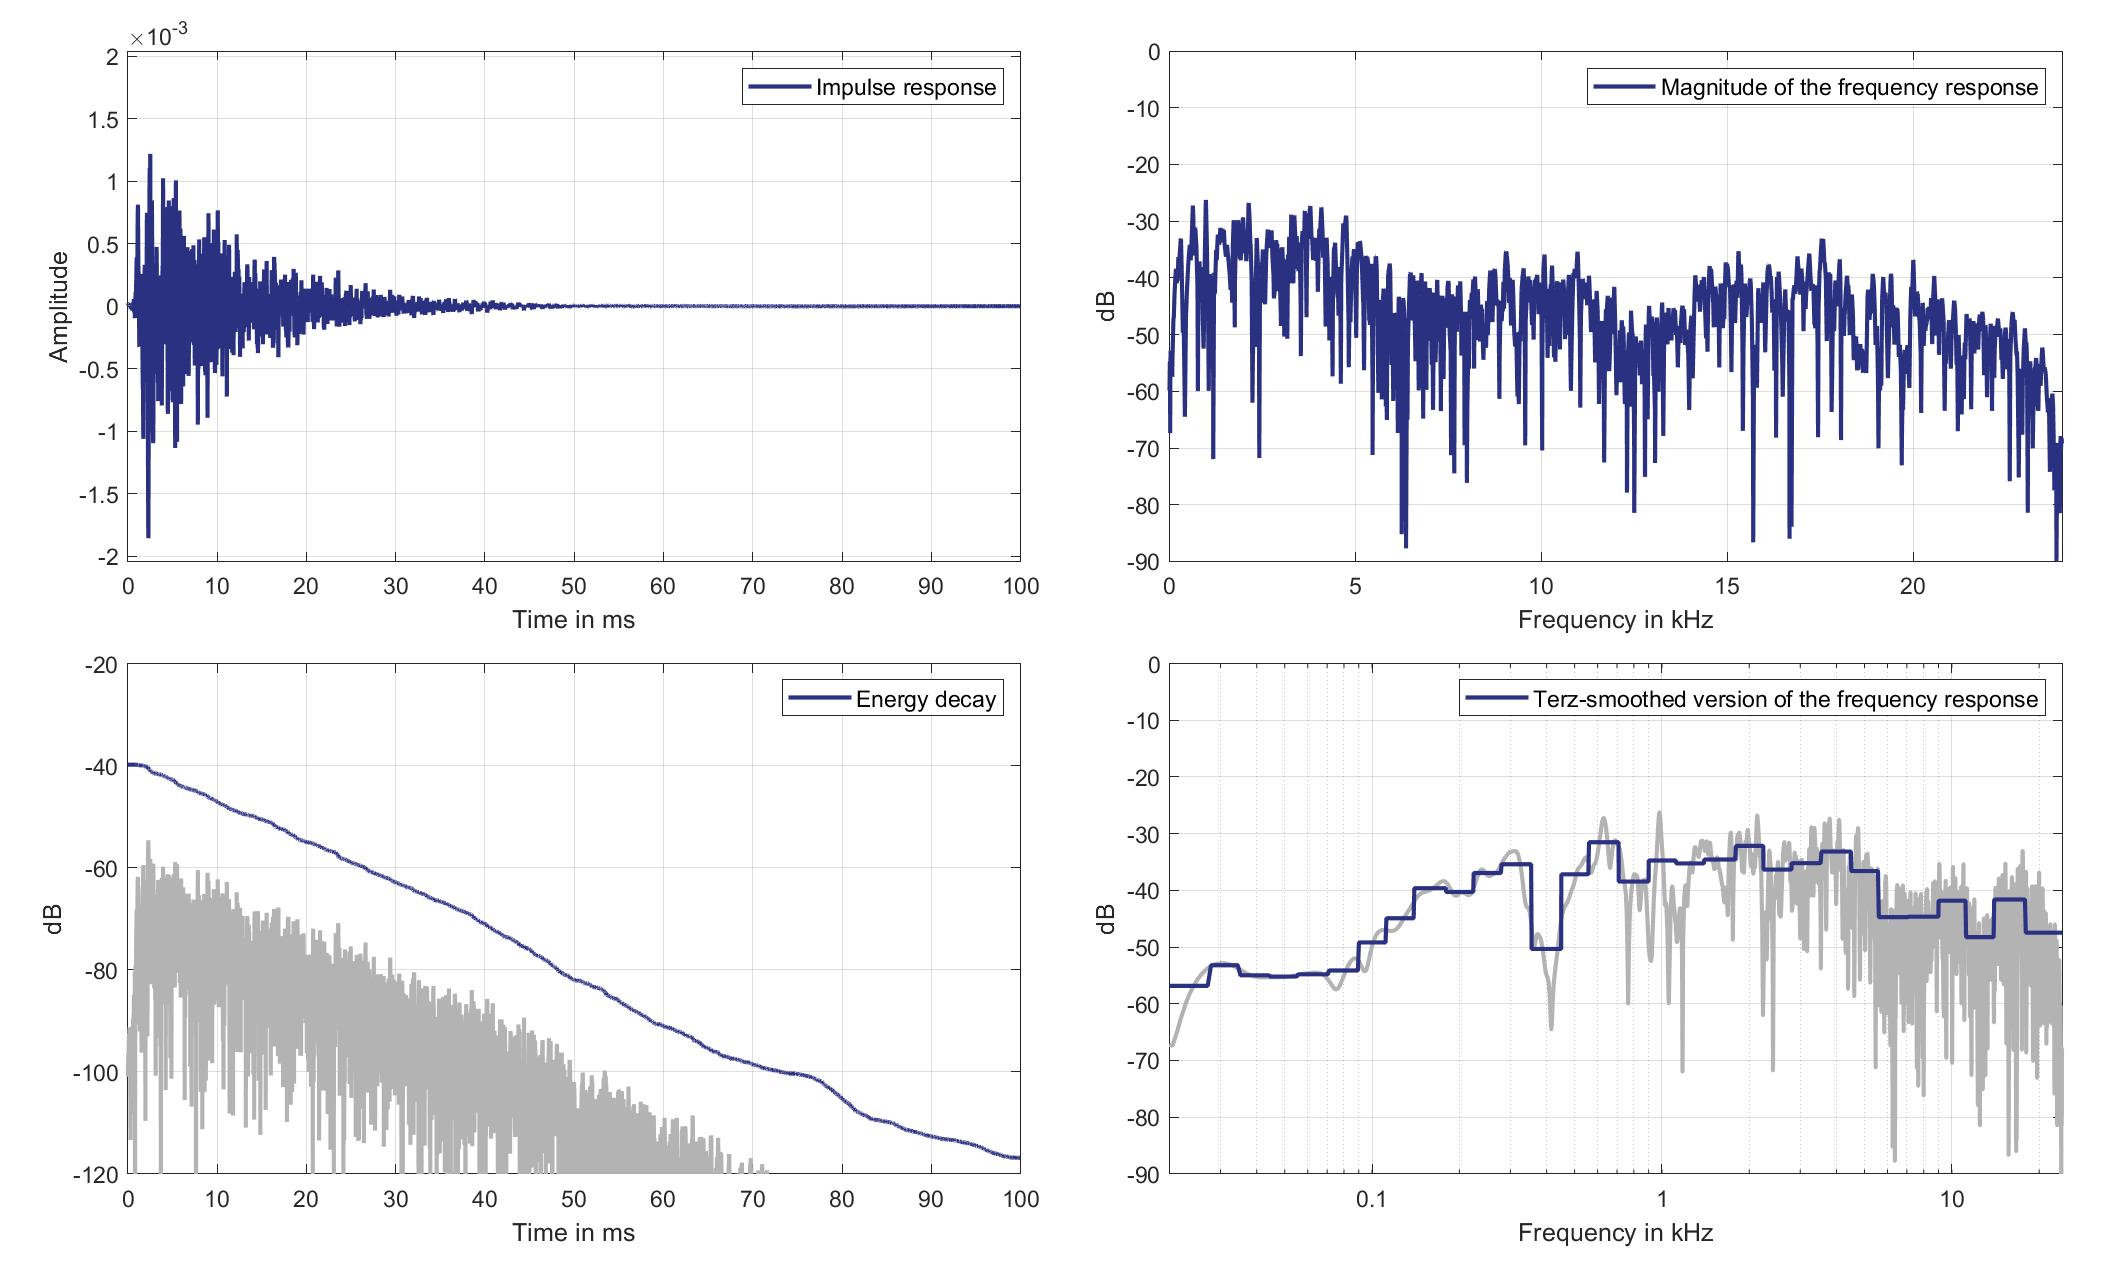
Download impulse response (in ".fir" format).
In the download section you can download all impulse response files as well as format explanation and Matlab as well as Python code examples for loading fir files.
Right lsp. - Right ear mic.
Right Headrest Loudspeaker of Zone 3 (Lsp. 5 to Right Ear Microphone of Zone 3 (Mic. 24)
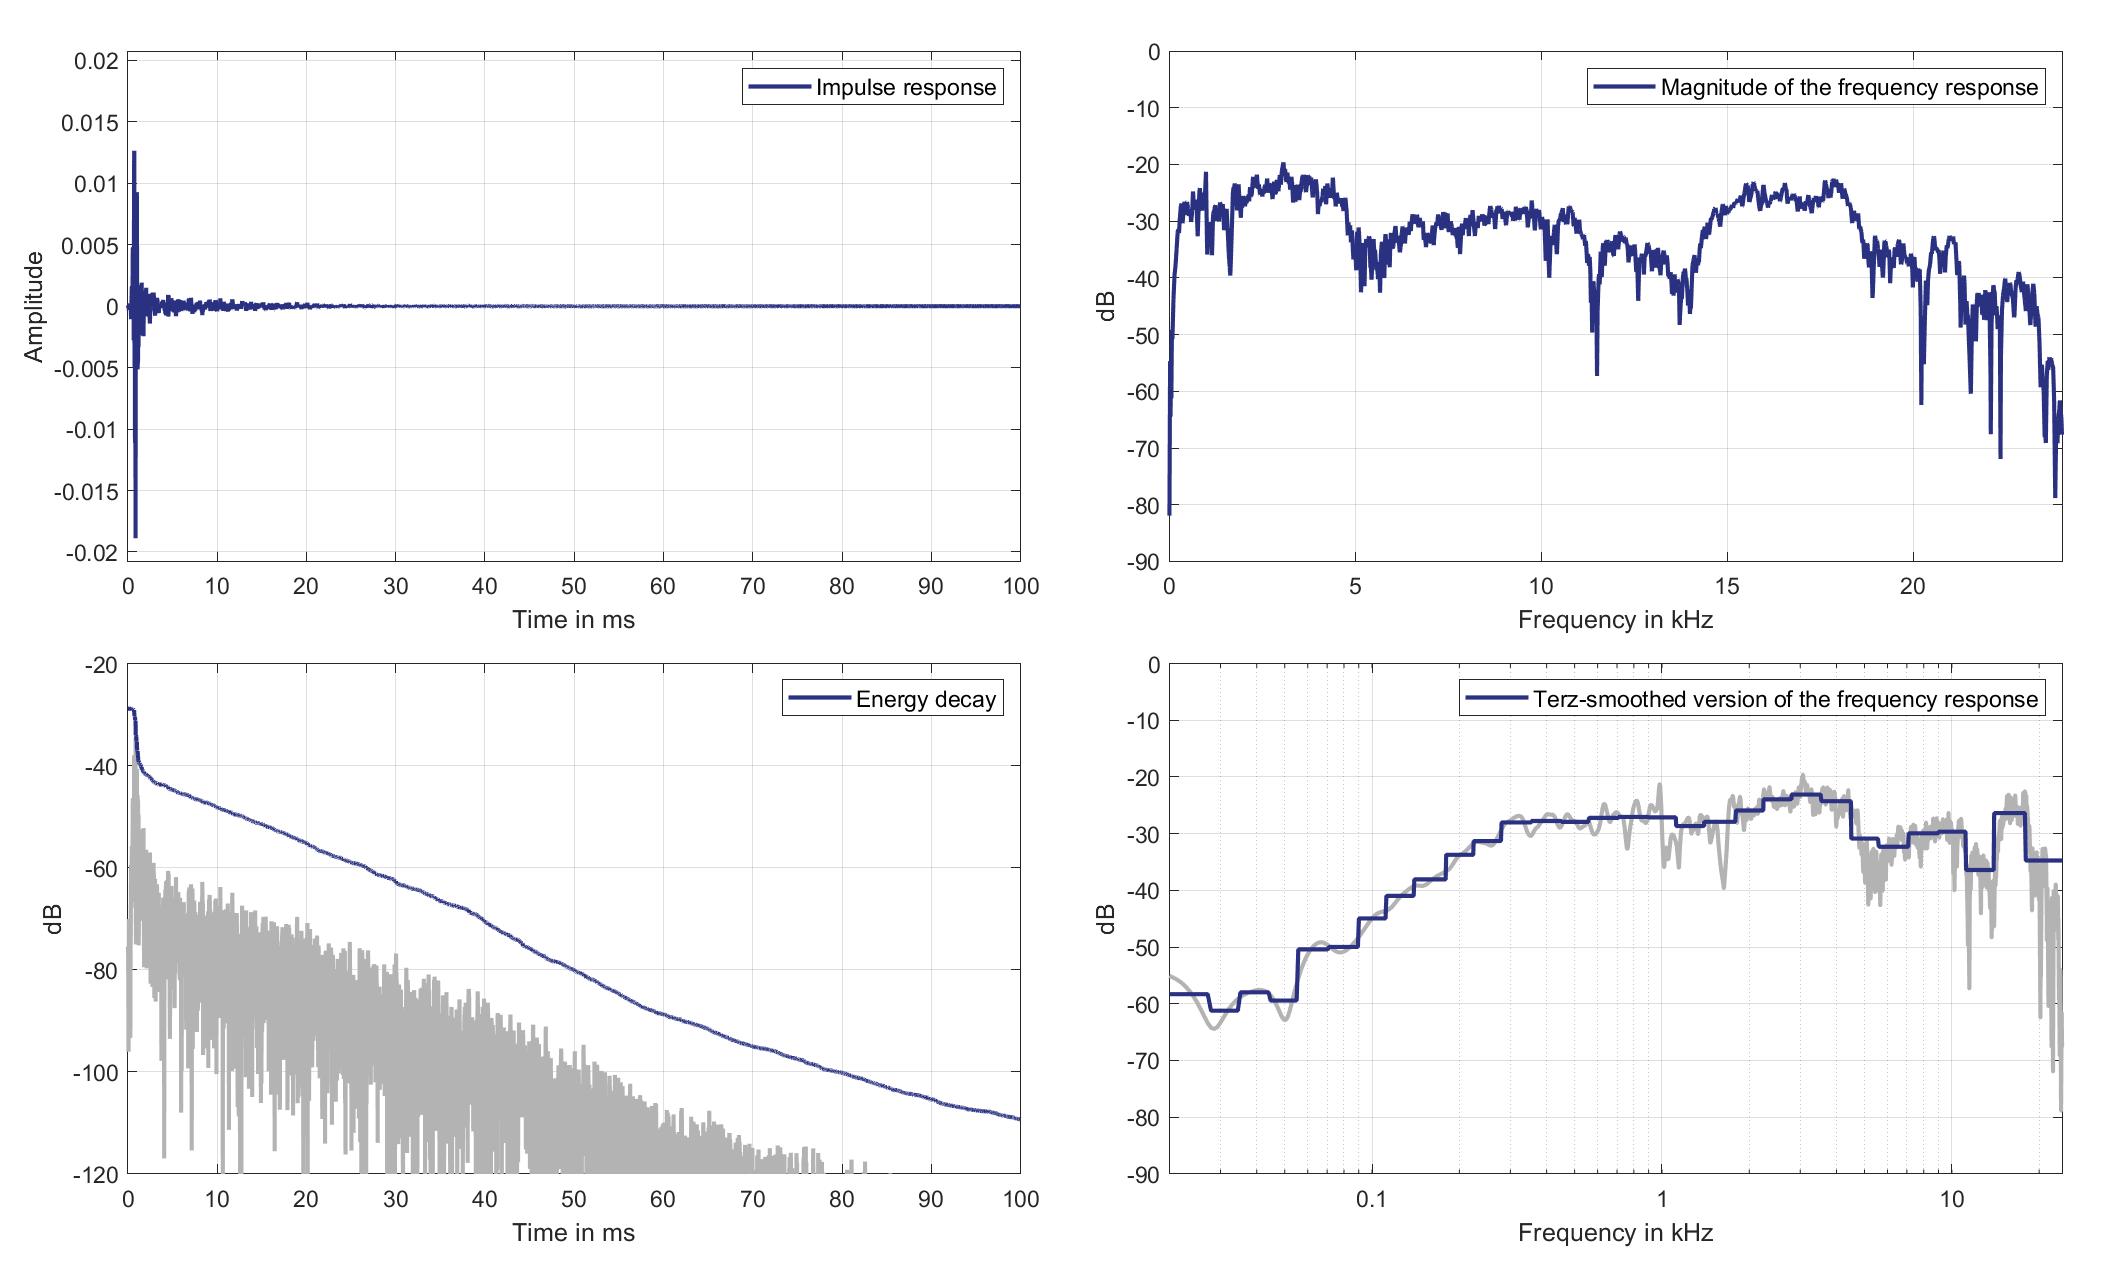
Download impulse response (in ".fir" format).
In the download section you can download all impulse response files as well as format explanation and Matlab as well as Python code examples for loading fir files.
Mics. 25/26
Left lsp. - left ear mic.
Left Headrest Loudspeaker of Zone 3 (Lsp. 4) to Left Ear Microphone of Zone 5 (Mic. 25)
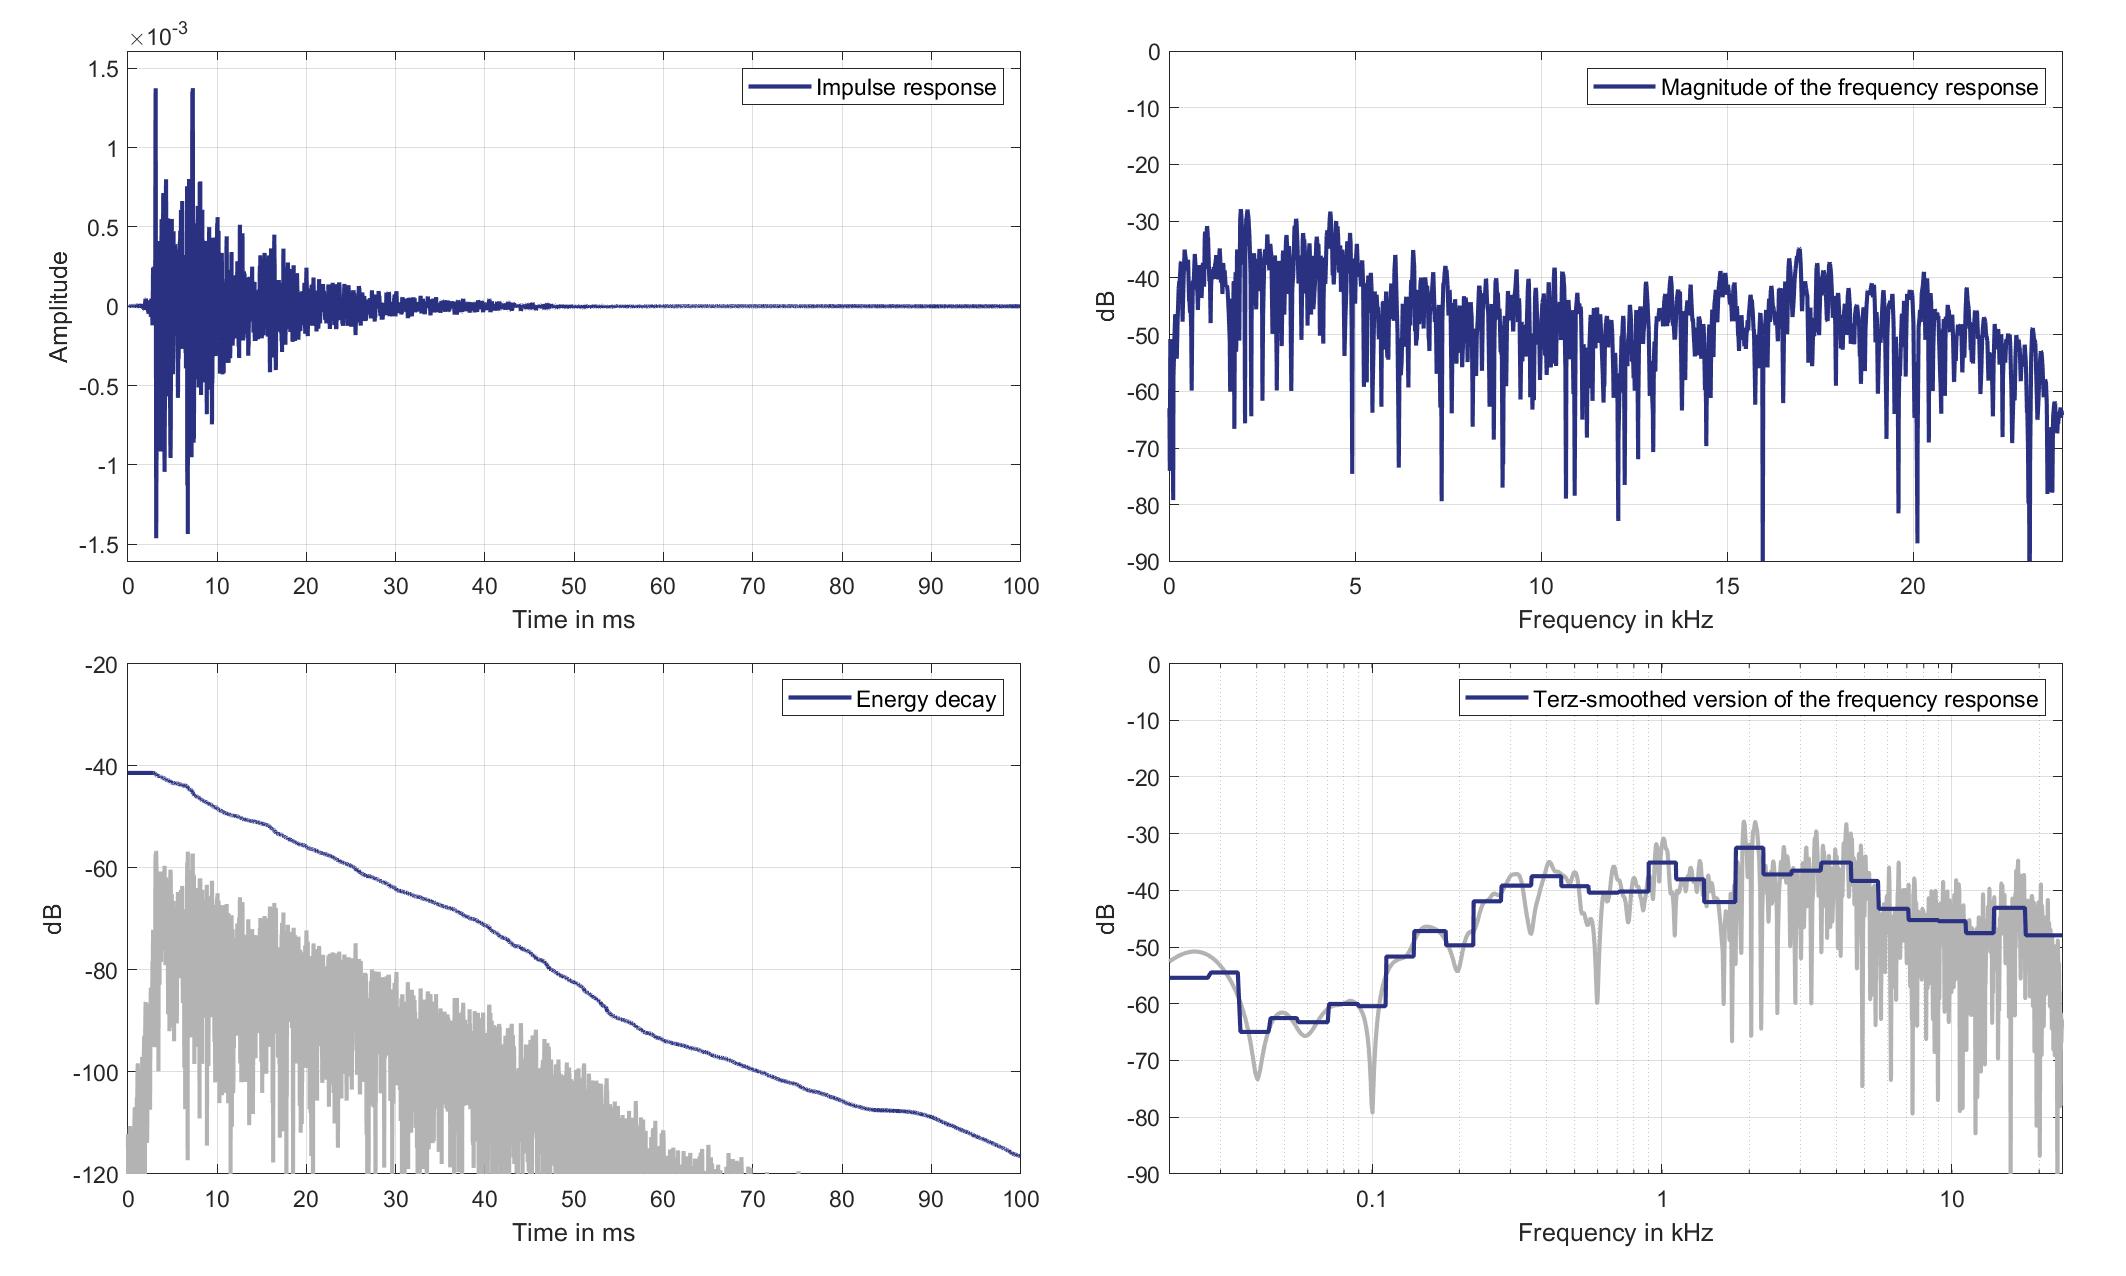
Download impulse response (in ".fir" format).
In the download section you can download all impulse response files as well as format explanation and Matlab as well as Python code examples for loading fir files.
Left lsp. - Right ear mic.
Left Headrest Loudspeaker of Zone 3 (Lsp. 4) to Right Ear Microphone of Zone 5 (Mic. 26)
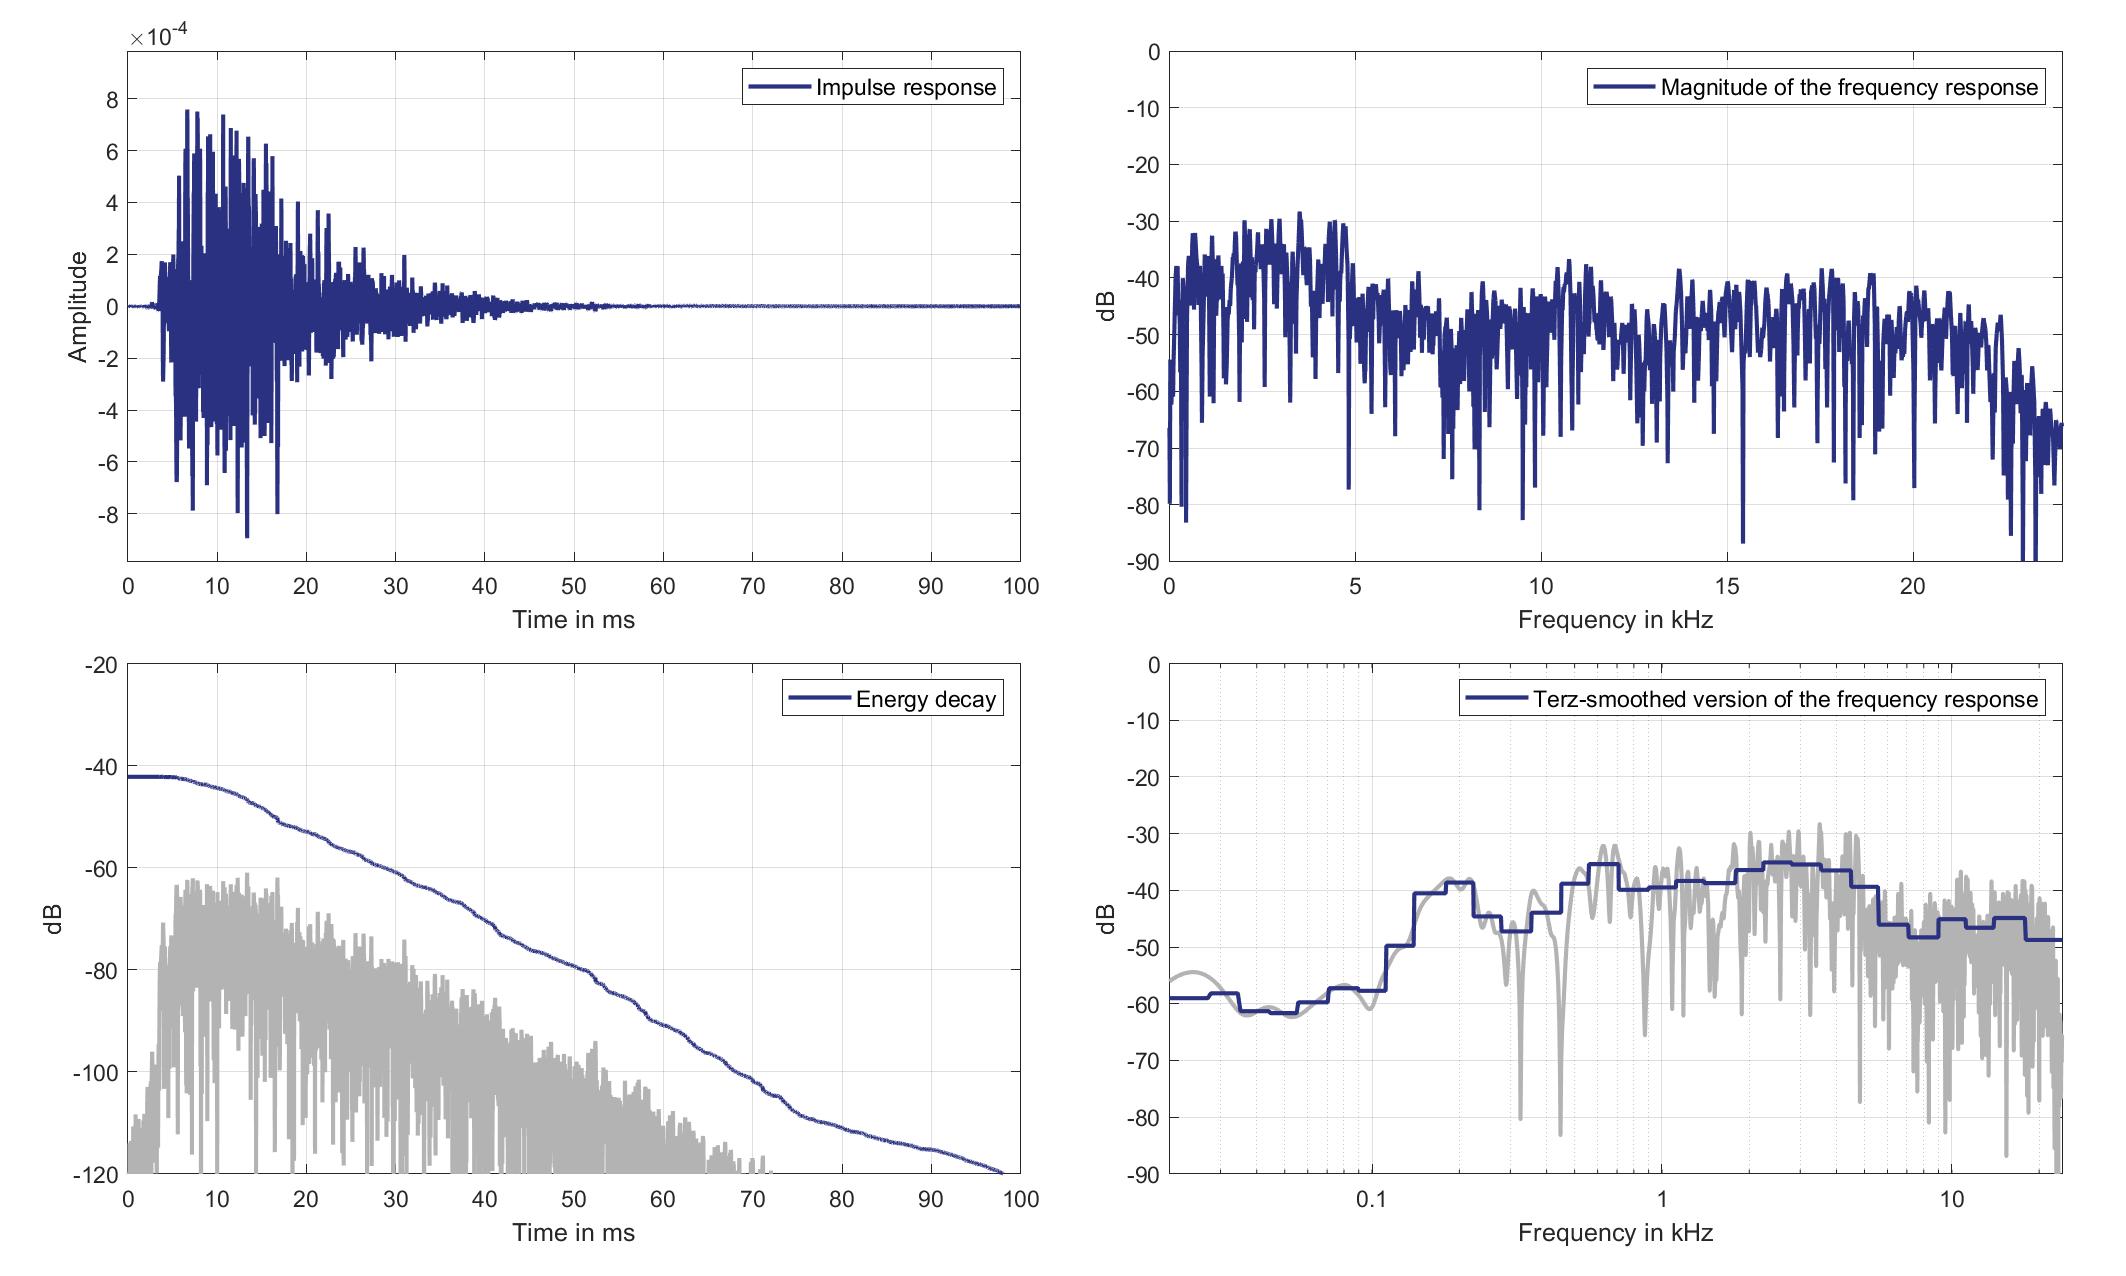
Download impulse response (in ".fir" format).
In the download section you can download all impulse response files as well as format explanation and Matlab as well as Python code examples for loading fir files.
Right lsp. - left ear mic.
Right Headrest Loudspeaker of Zone 3 (Lsp. 5) to Left Ear Microphone of Zone 5 (Mic. 25)
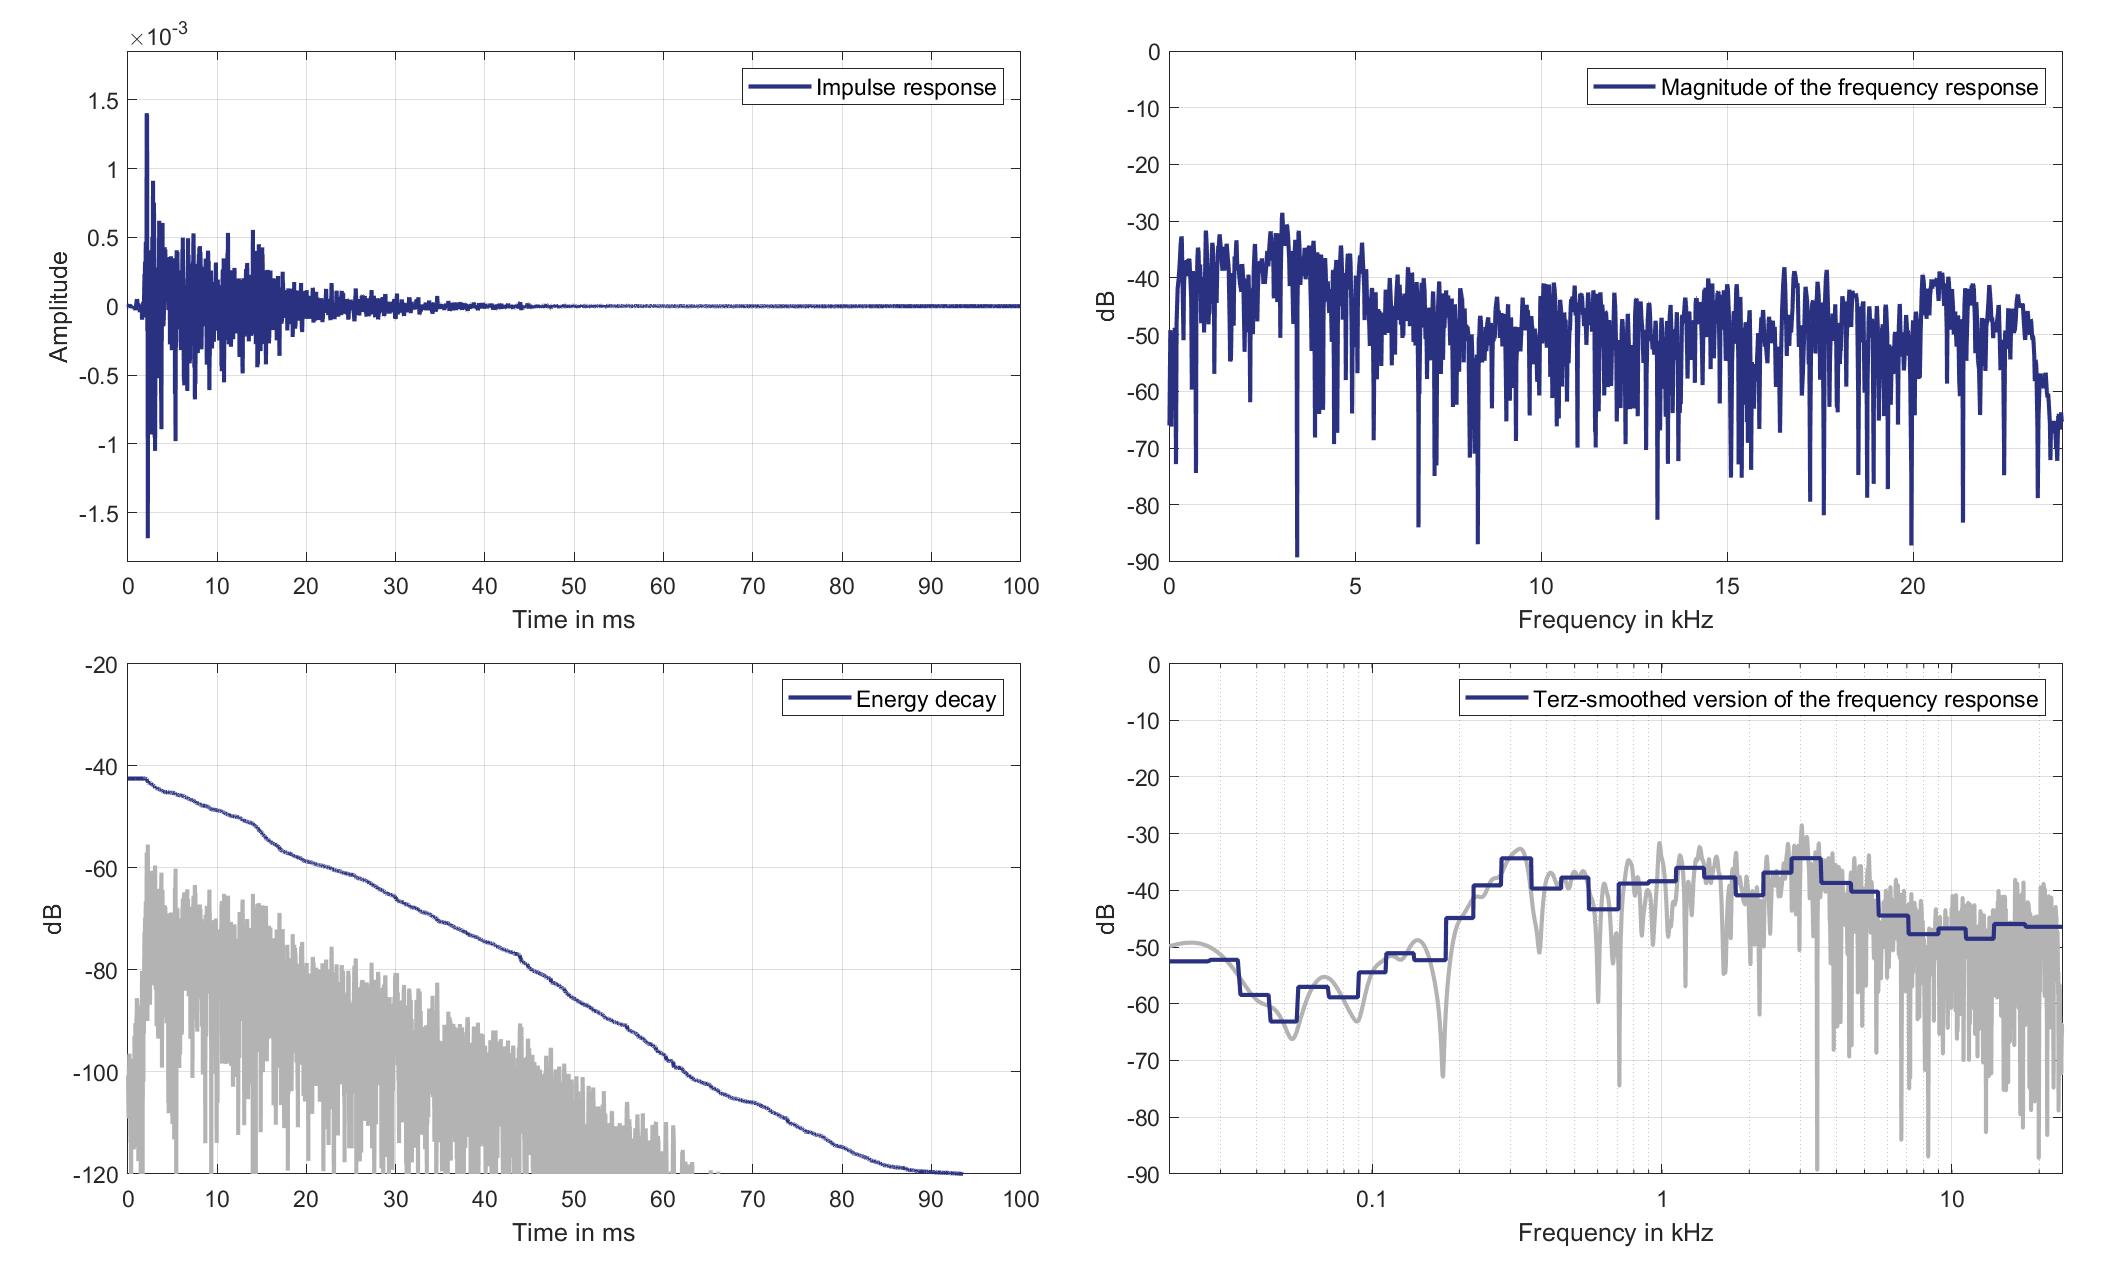
Download impulse response (in ".fir" format).
In the download section you can download all impulse response files as well as format explanation and Matlab as well as Python code examples for loading fir files.
Right lsp. - Right ear mic.
Right Headrest Loudspeaker of Zone 3 (Lsp. 5 to Right Ear Microphone of Zone 5 (Mic. 26)
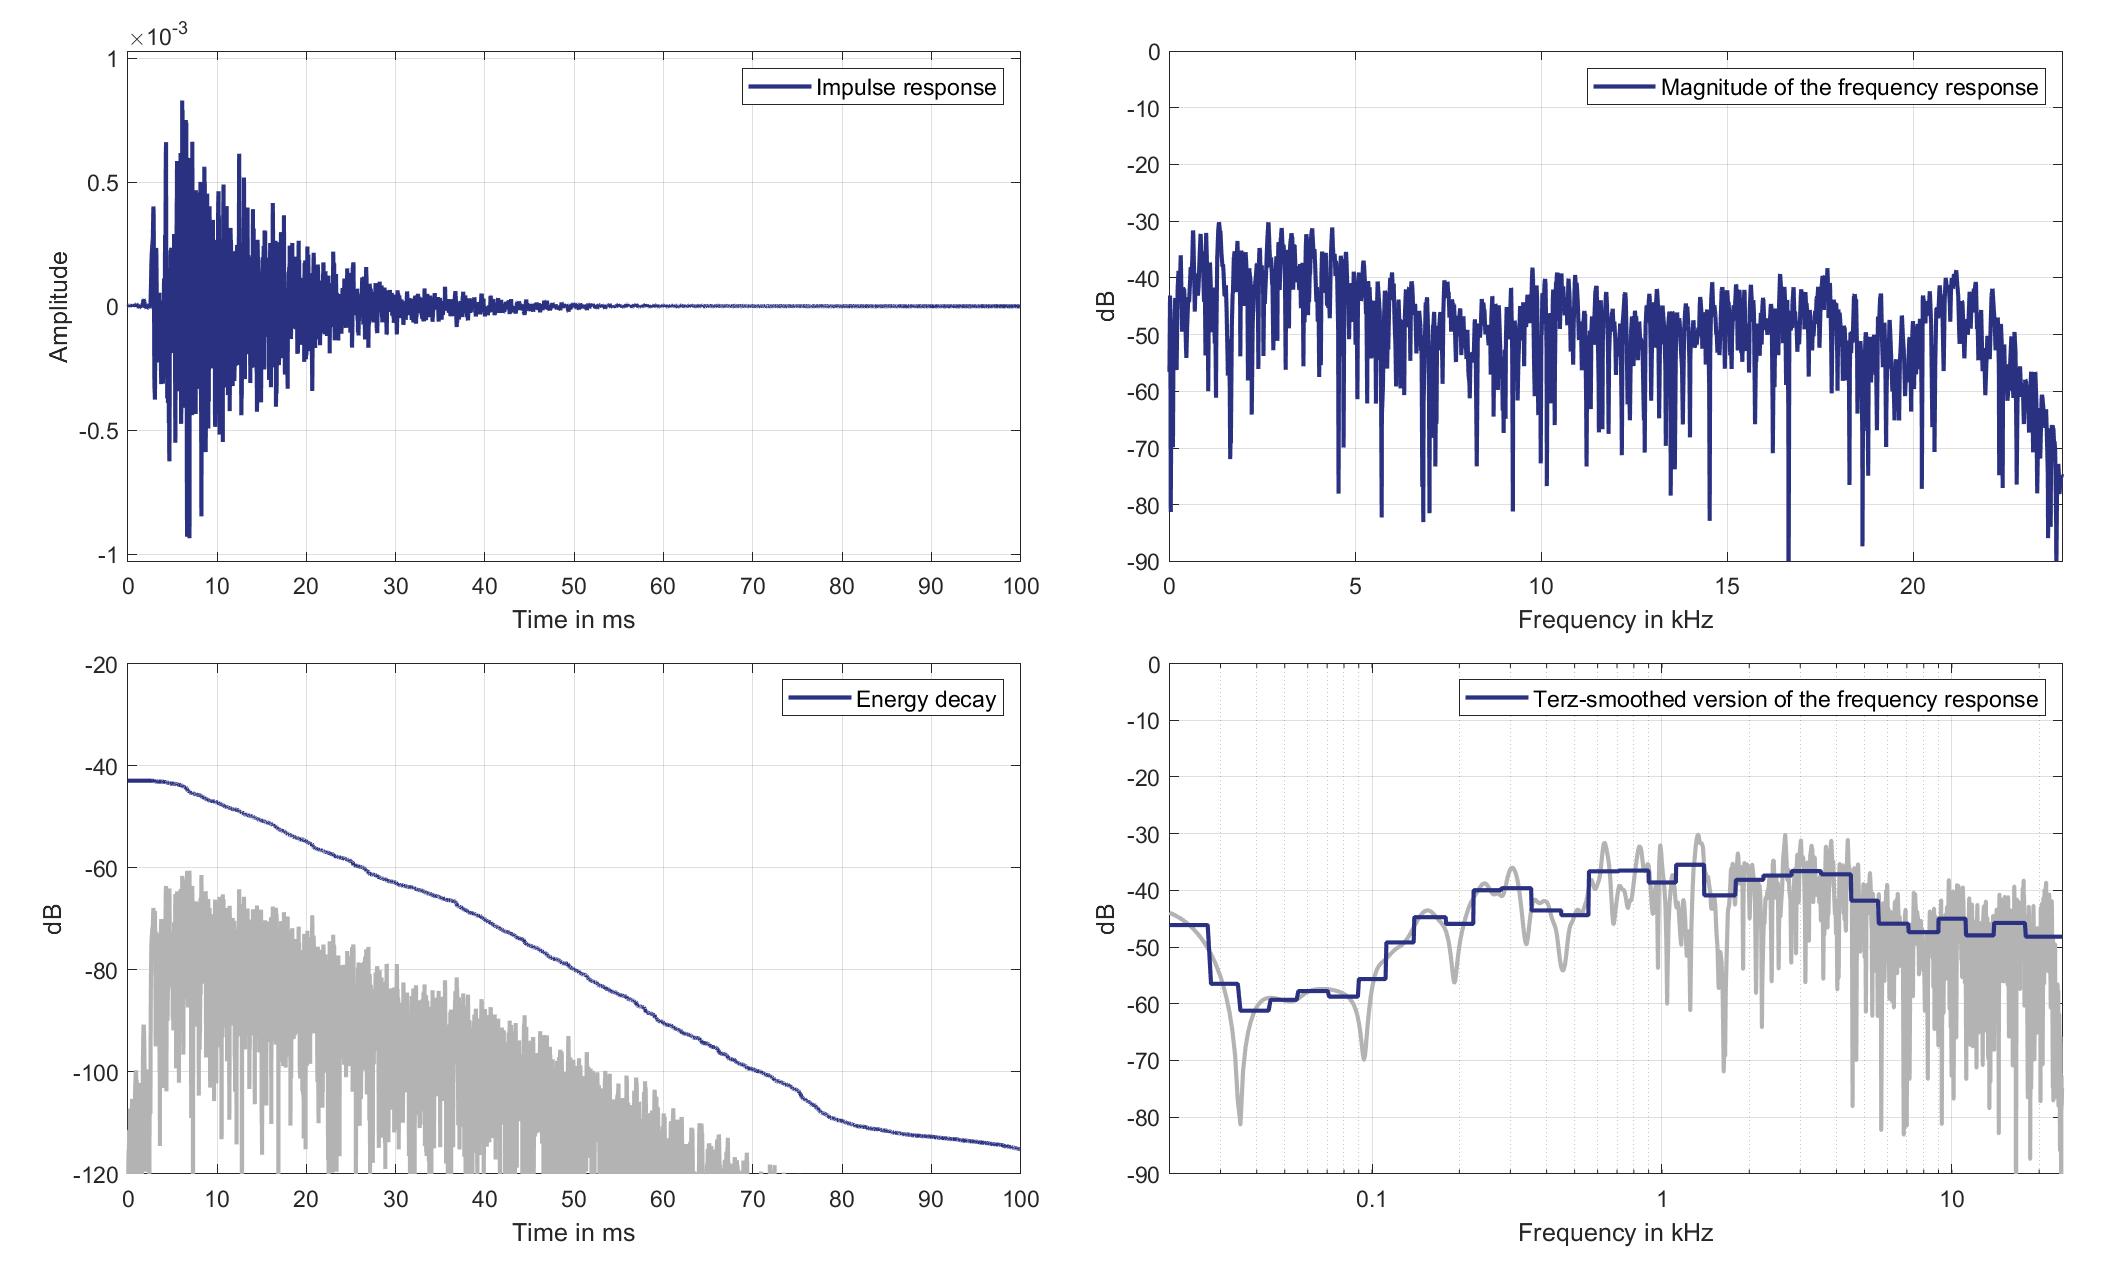
Download impulse response (in ".fir" format).
In the download section you can download all impulse response files as well as format explanation and Matlab as well as Python code examples for loading fir files.
Mics. 27/28
Left lsp. - left ear mic.
Left Headrest Loudspeaker of Zone 3 (Lsp. 4) to Left Ear Microphone of Zone 6 (Mic. 27)
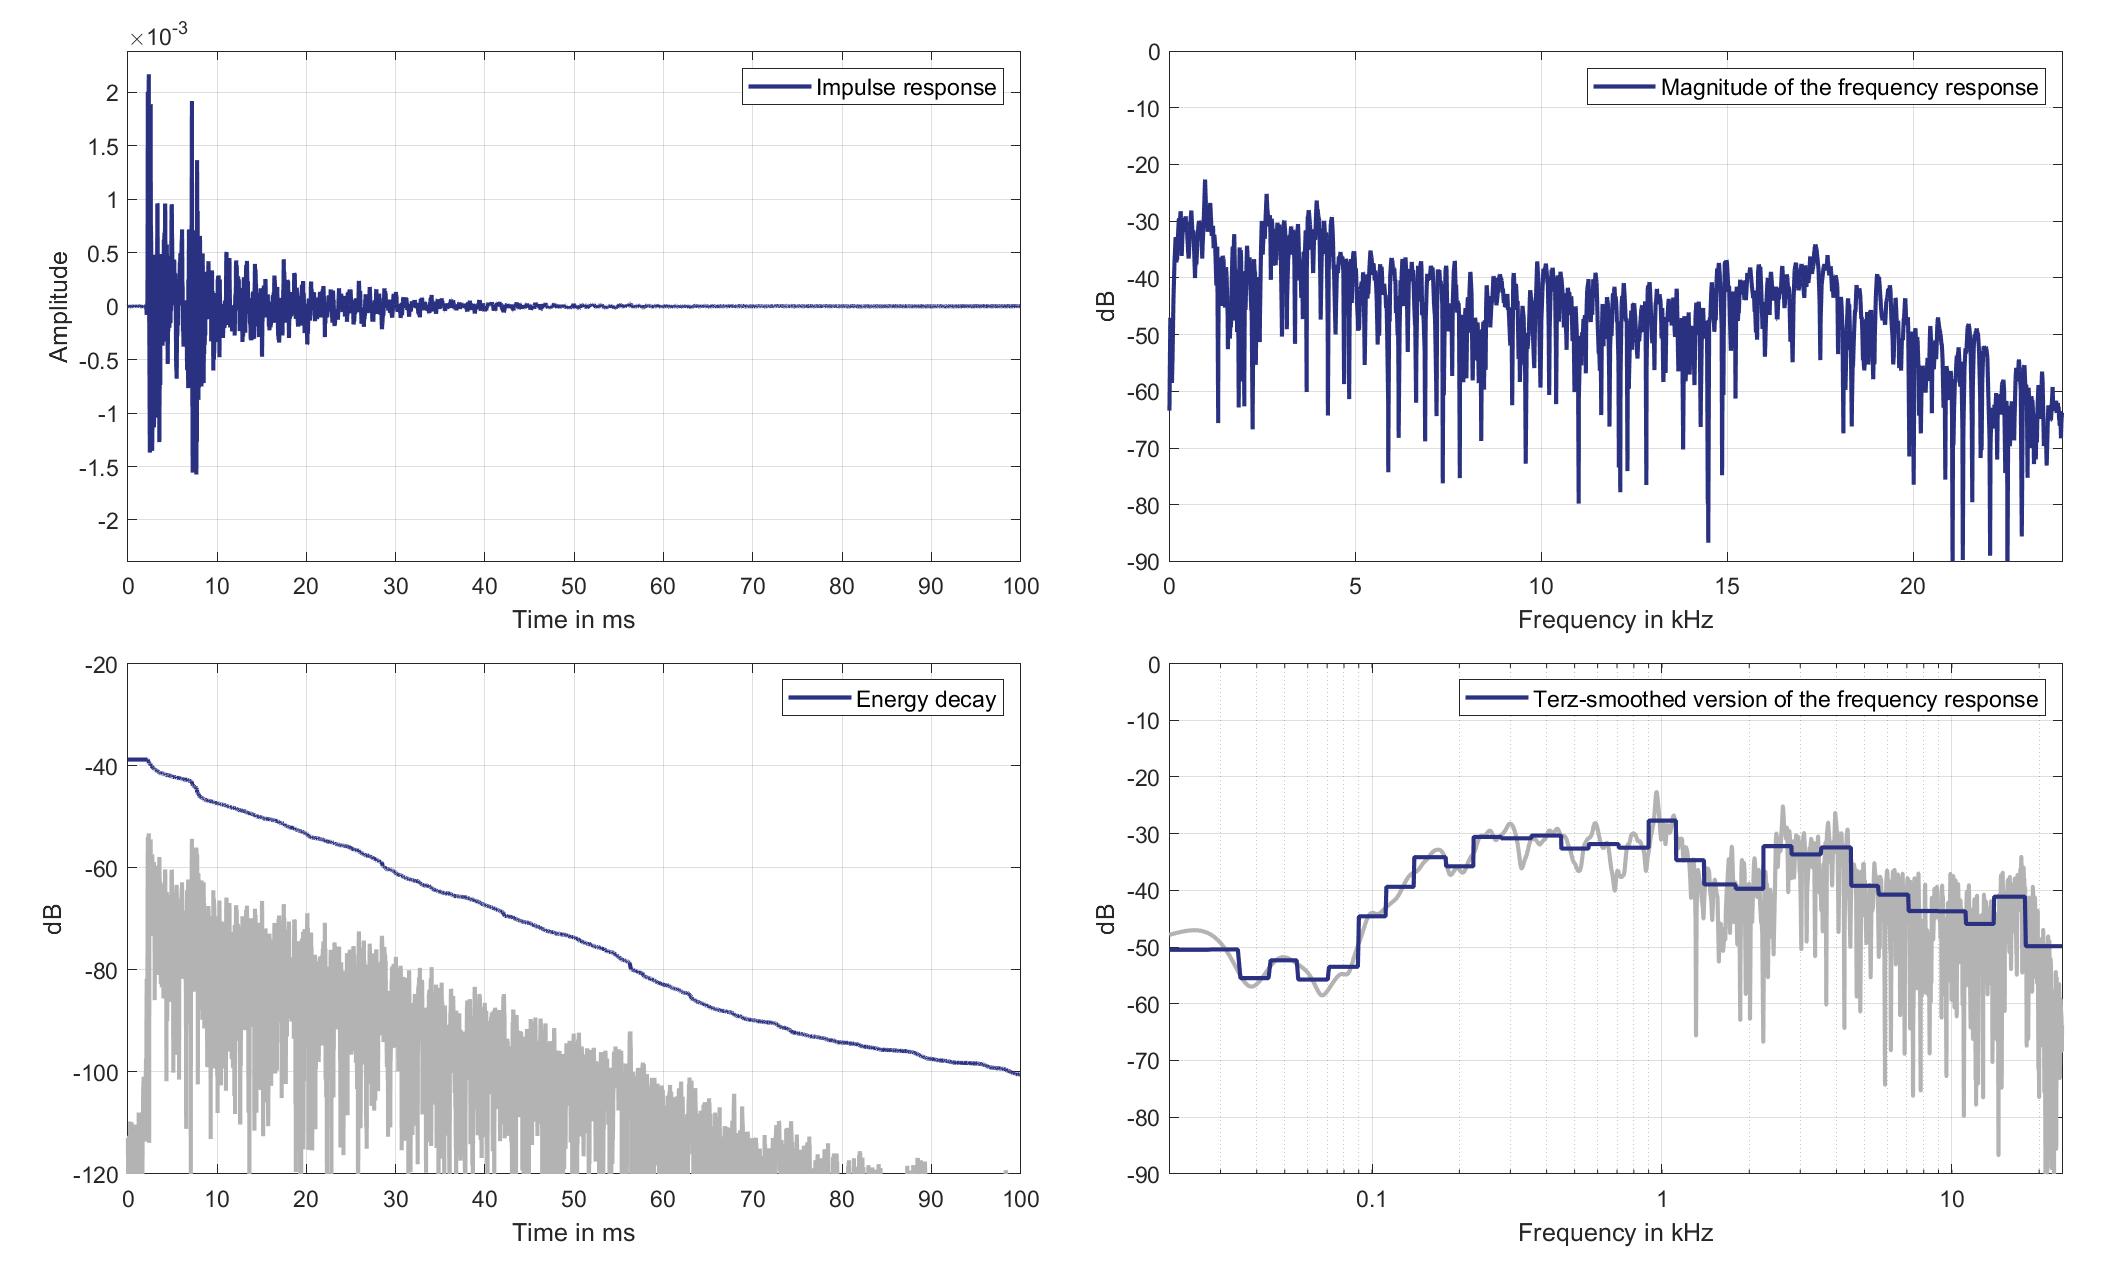
Download impulse response (in ".fir" format).
In the download section you can download all impulse response files as well as format explanation and Matlab as well as Python code examples for loading fir files.
Left lsp. - Right ear mic.
Left Headrest Loudspeaker of Zone 3 (Lsp. 4) to Right Ear Microphone of Zone 6 (Mic. 28)
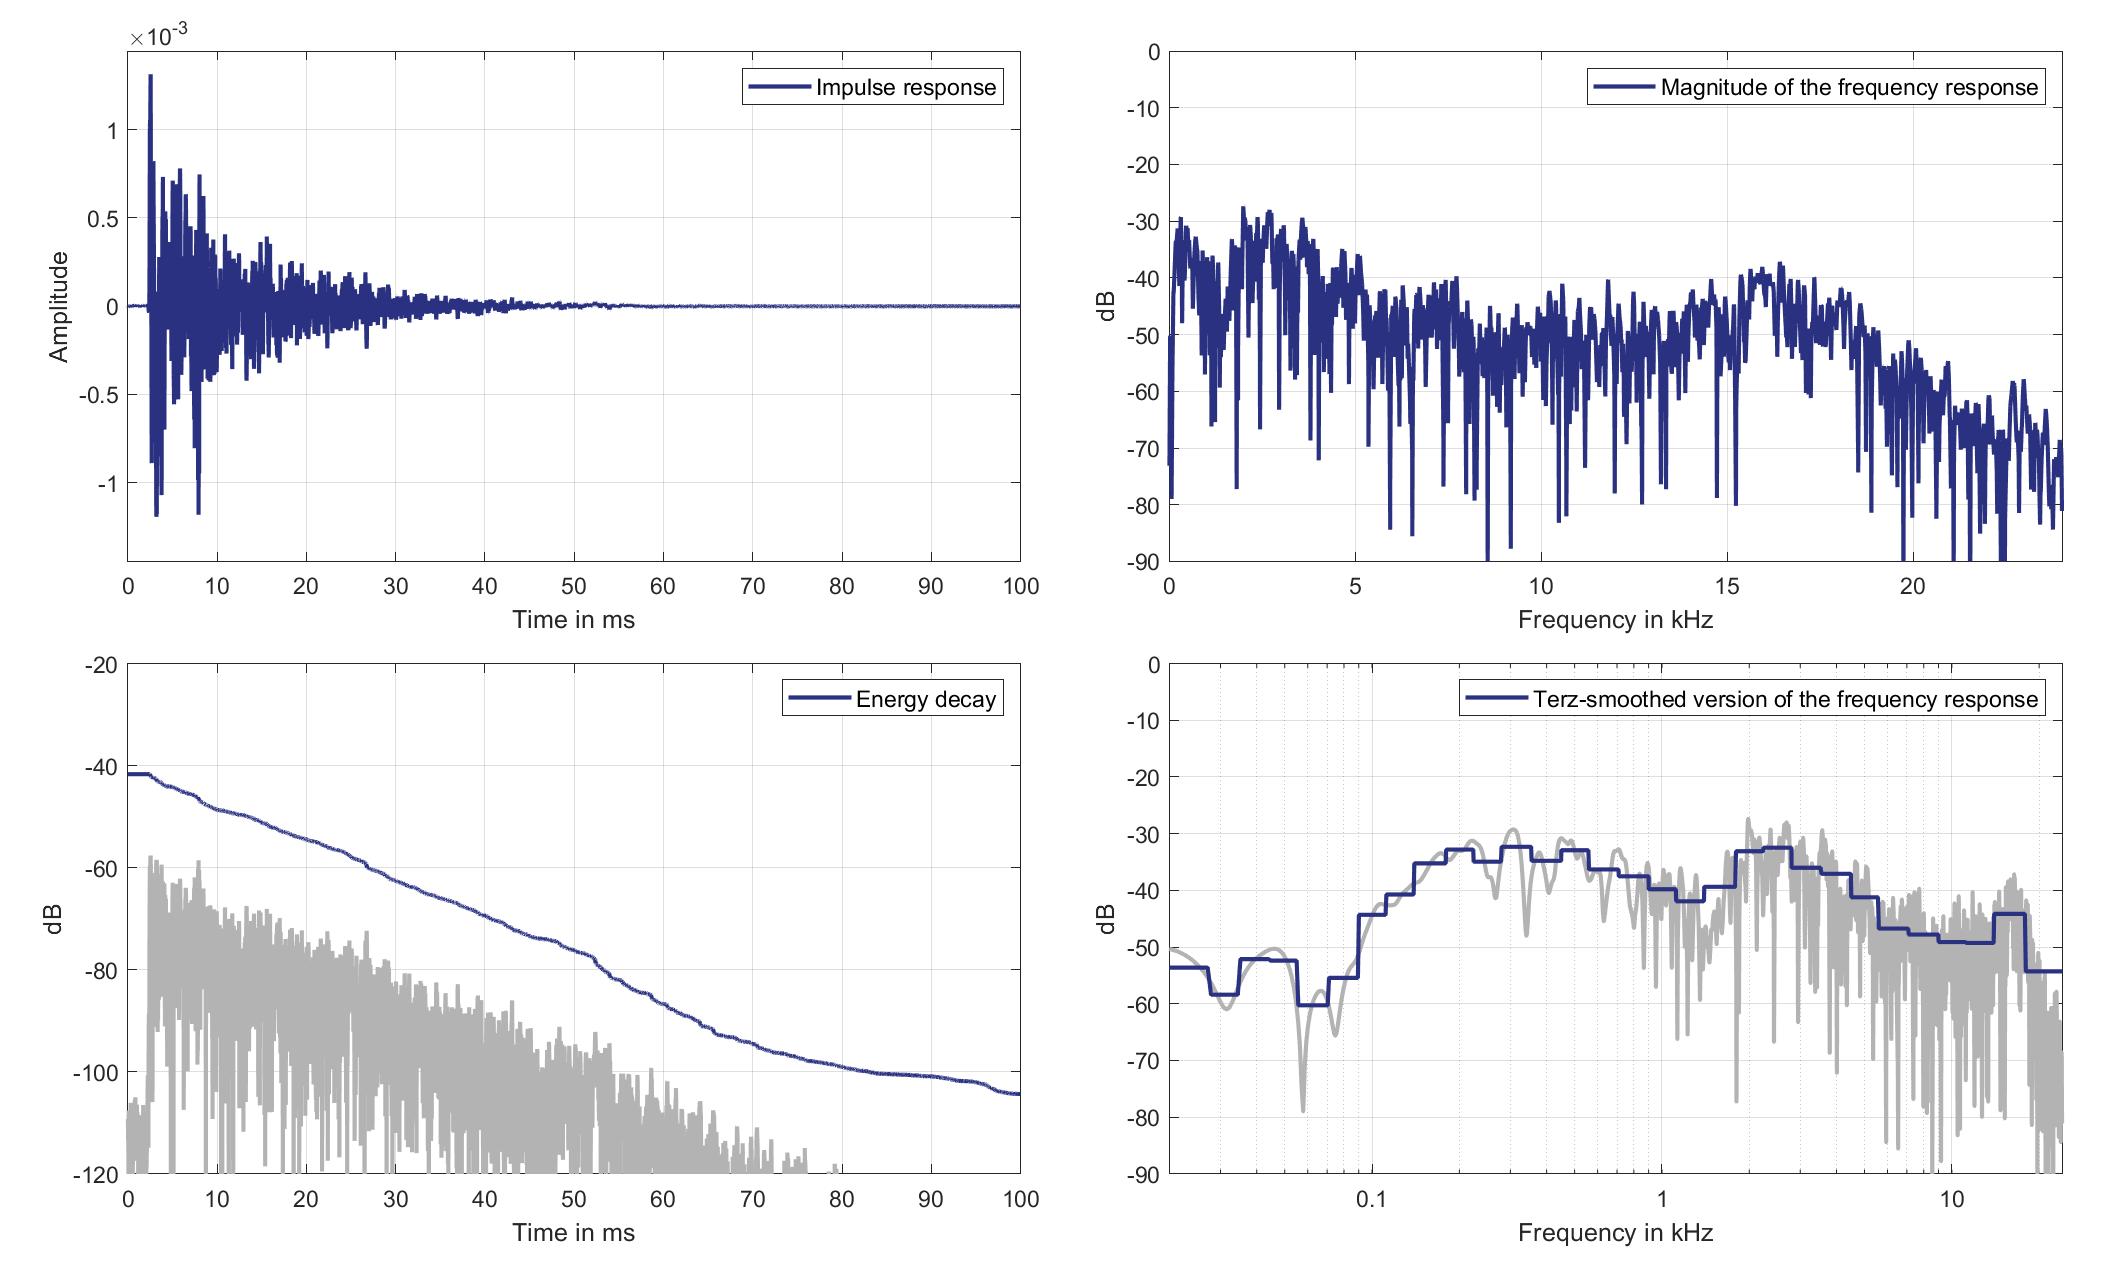
Download impulse response (in ".fir" format).
In the download section you can download all impulse response files as well as format explanation and Matlab as well as Python code examples for loading fir files.
Right lsp. - left ear mic.
Right Headrest Loudspeaker of Zone 3 (Lsp. 5) to Left Ear Microphone of Zone 6 (Mic. 27)

Download impulse response (in ".fir" format).
In the download section you can download all impulse response files as well as format explanation and Matlab as well as Python code examples for loading fir files.
Right lsp. - Right ear mic.
Right Headrest Loudspeaker of Zone 3 (Lsp. 5 to Right Ear Microphone of Zone 6 (Mic. 28)
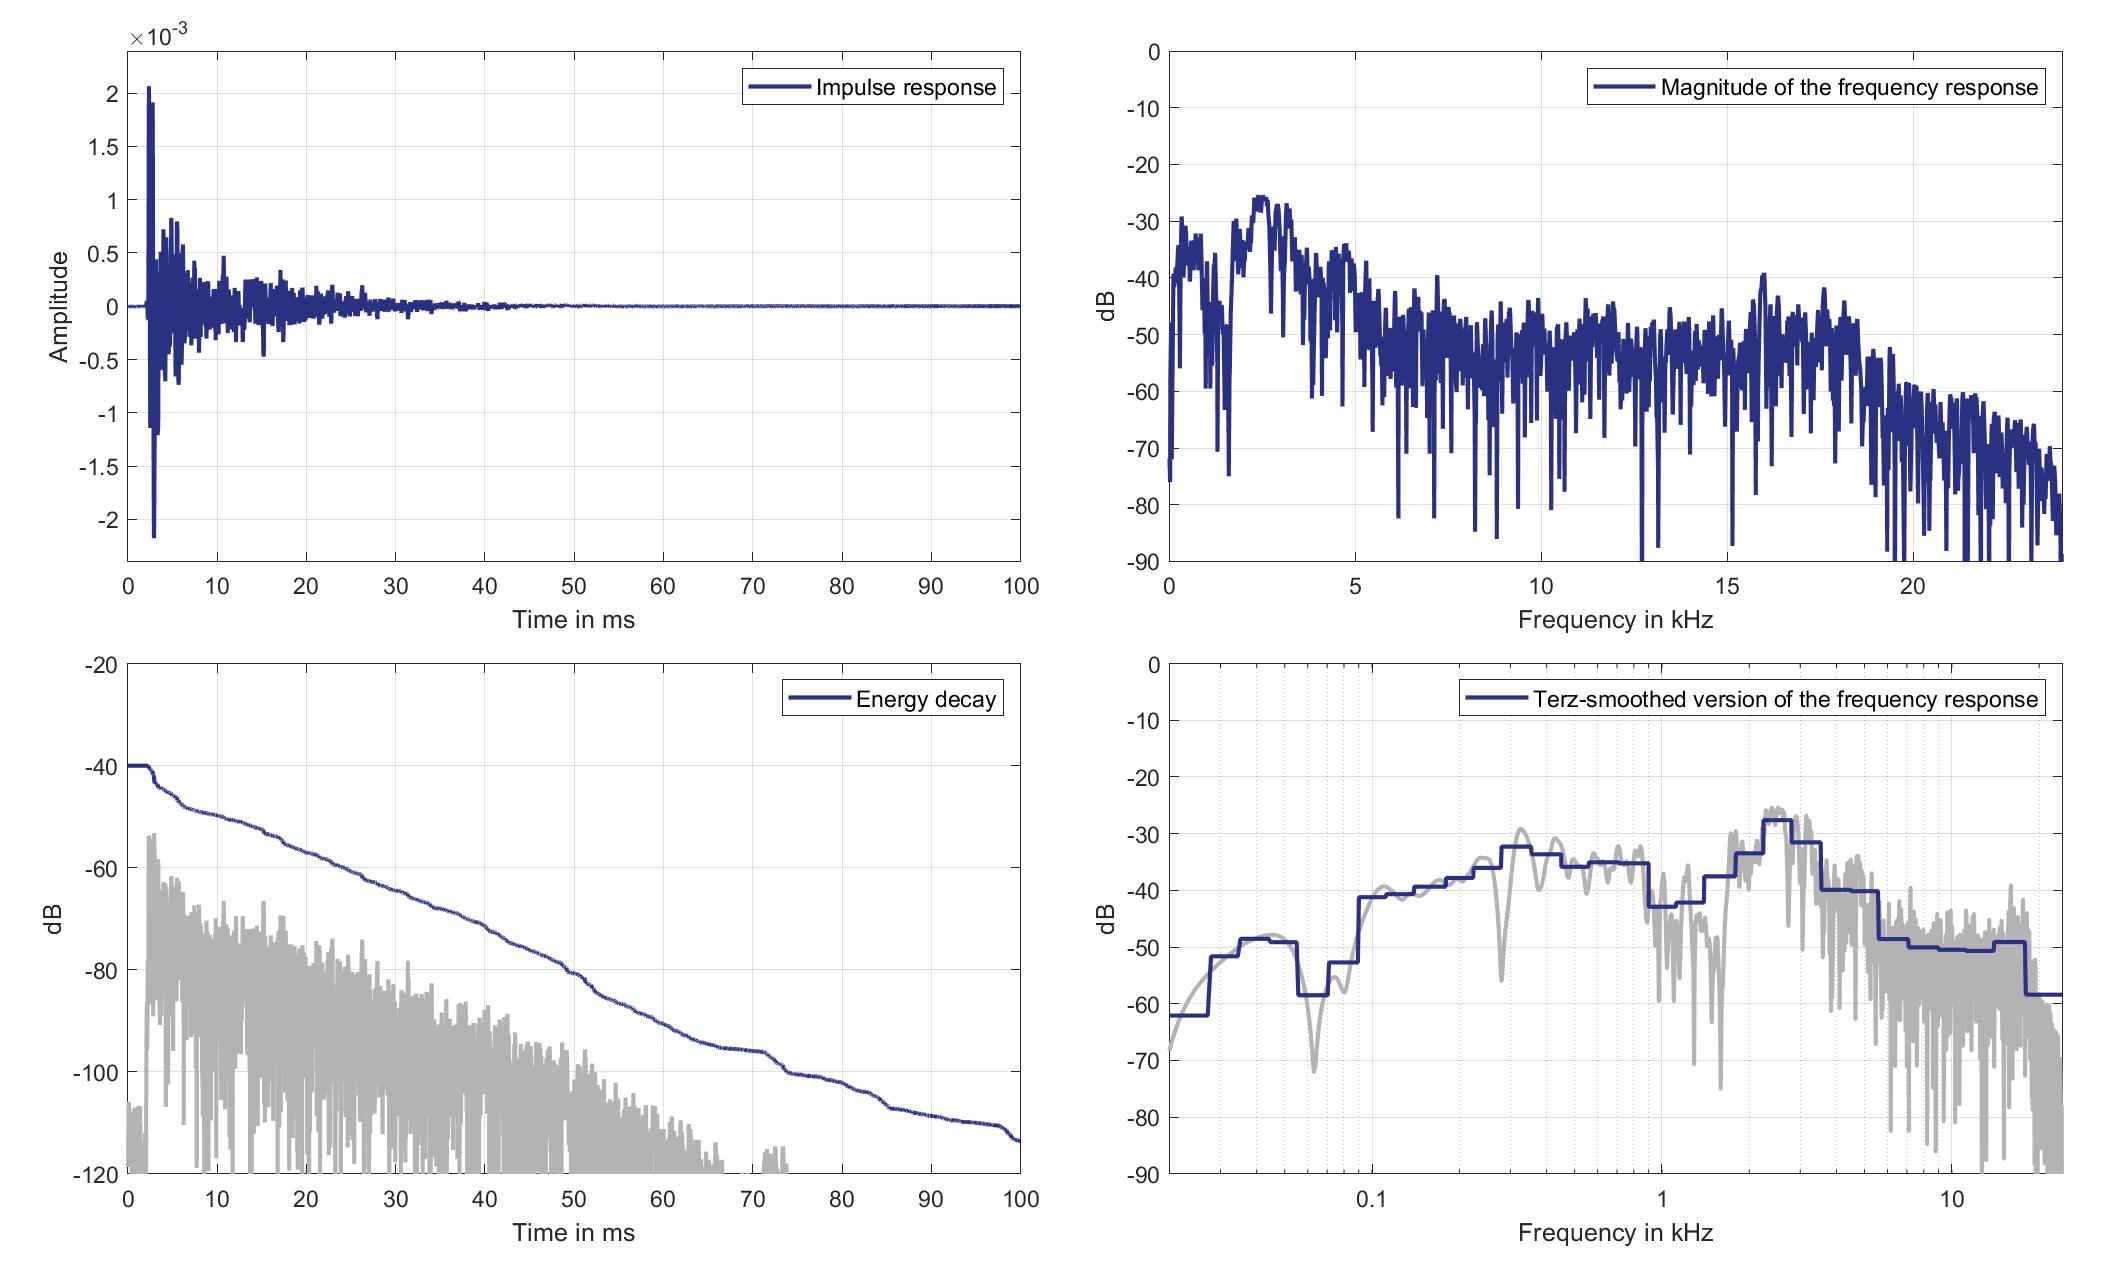
Download impulse response (in ".fir" format).
In the download section you can download all impulse response files as well as format explanation and Matlab as well as Python code examples for loading fir files.
Mics. 29/30
Left lsp. - left ear mic.
Left Headrest Loudspeaker of Zone 3 (Lsp. 4) to Left Ear Microphone of Zone 8 (Mic. 29)

Download impulse response (in ".fir" format).
In the download section you can download all impulse response files as well as format explanation and Matlab as well as Python code examples for loading fir files.
Left lsp. - Right ear mic.
Left Headrest Loudspeaker of Zone 3 (Lsp. 4) to Right Ear Microphone of Zone 8 (Mic. 30)
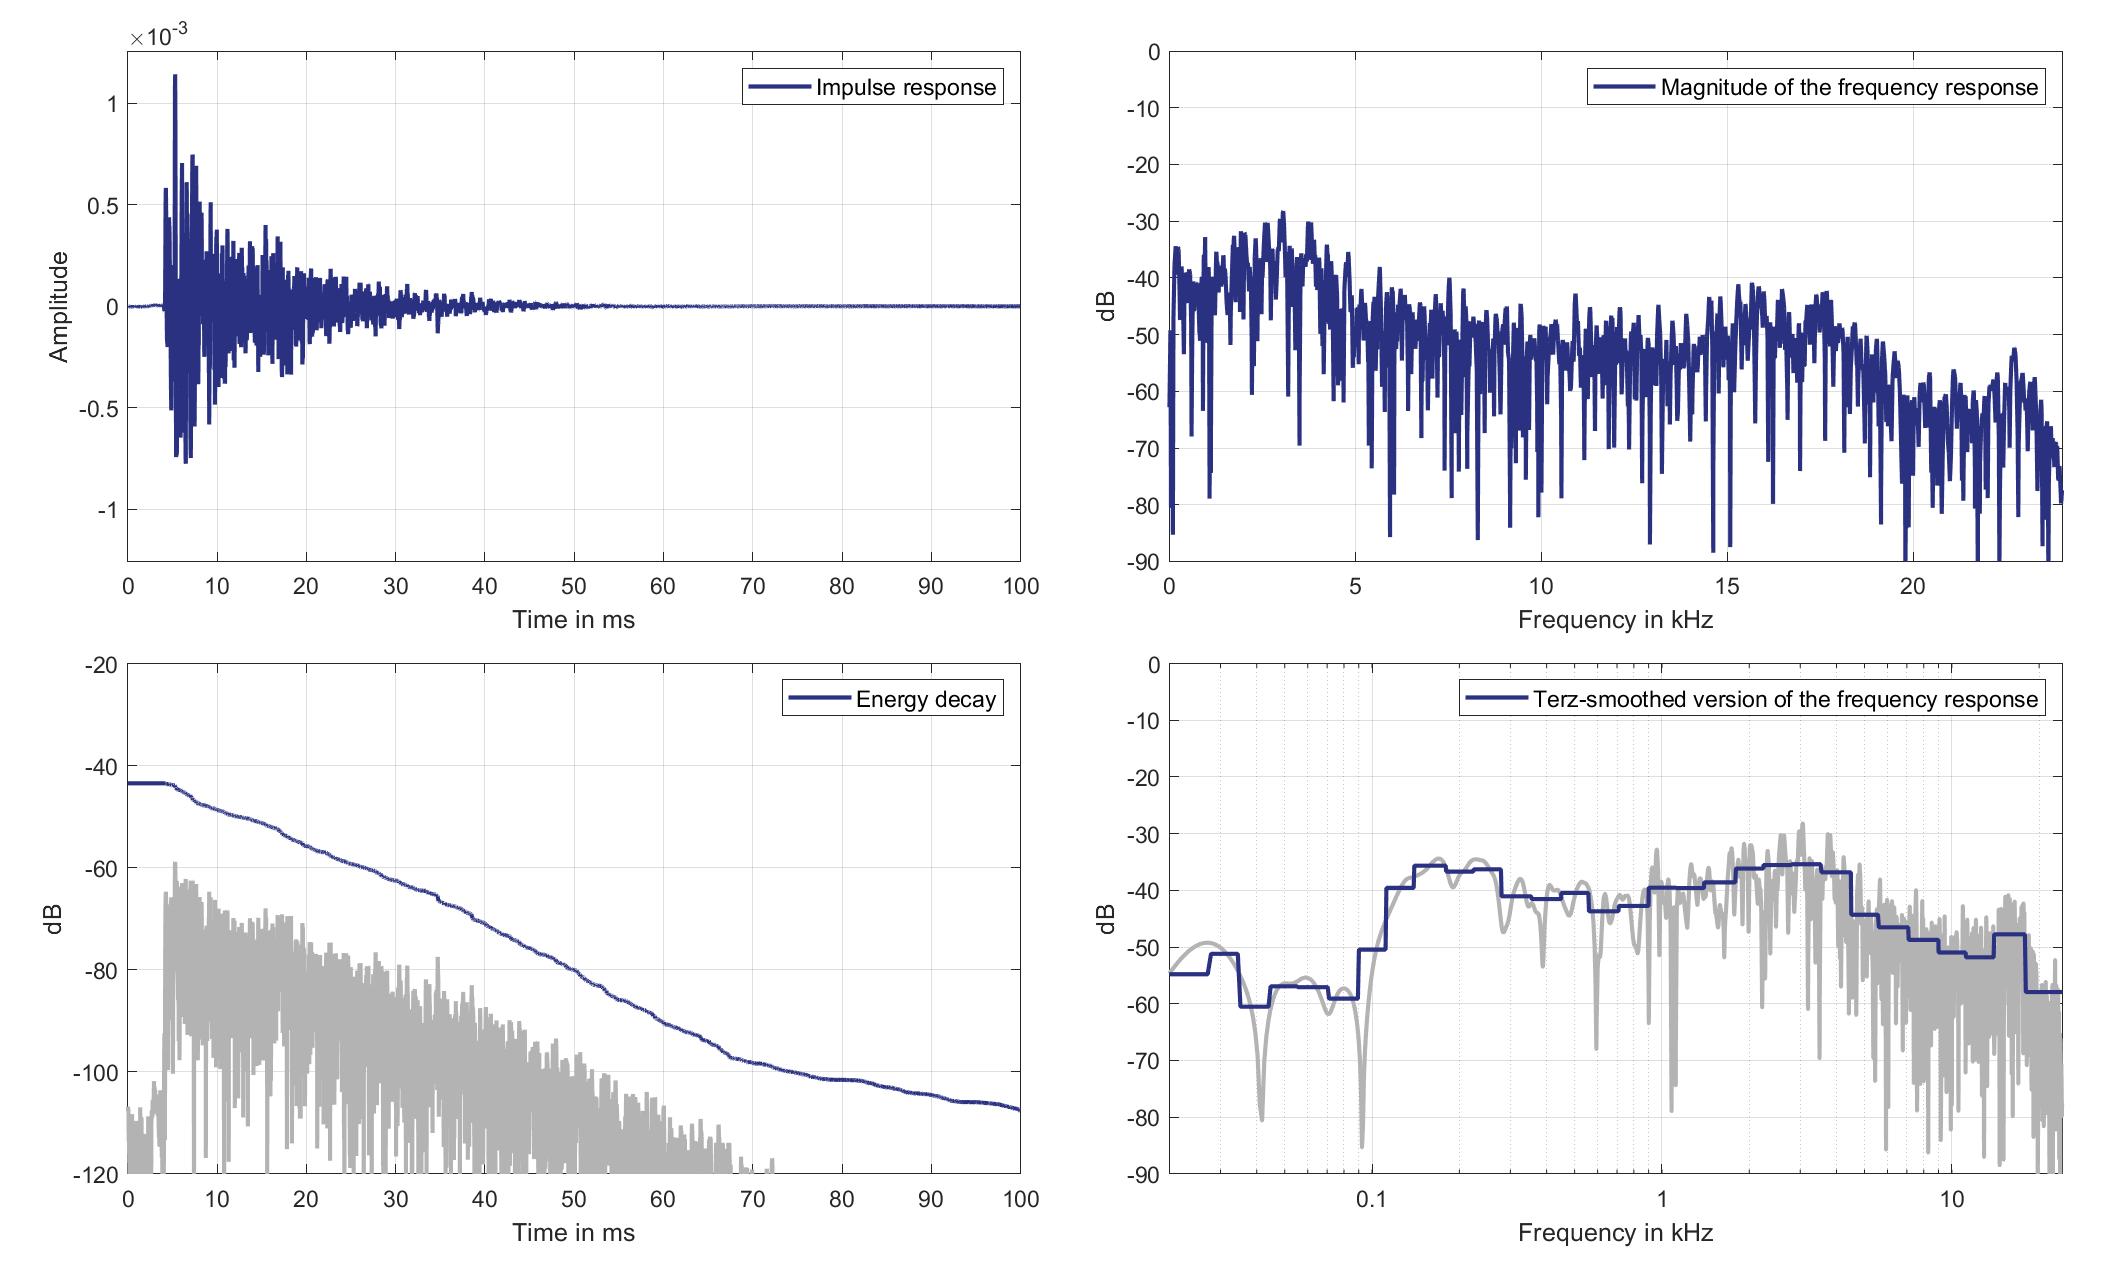
Download impulse response (in ".fir" format).
In the download section you can download all impulse response files as well as format explanation and Matlab as well as Python code examples for loading fir files.
Right lsp. - left ear mic.
Right Headrest Loudspeaker of Zone 3 (Lsp. 5) to Left Ear Microphone of Zone 8 (Mic. 29)
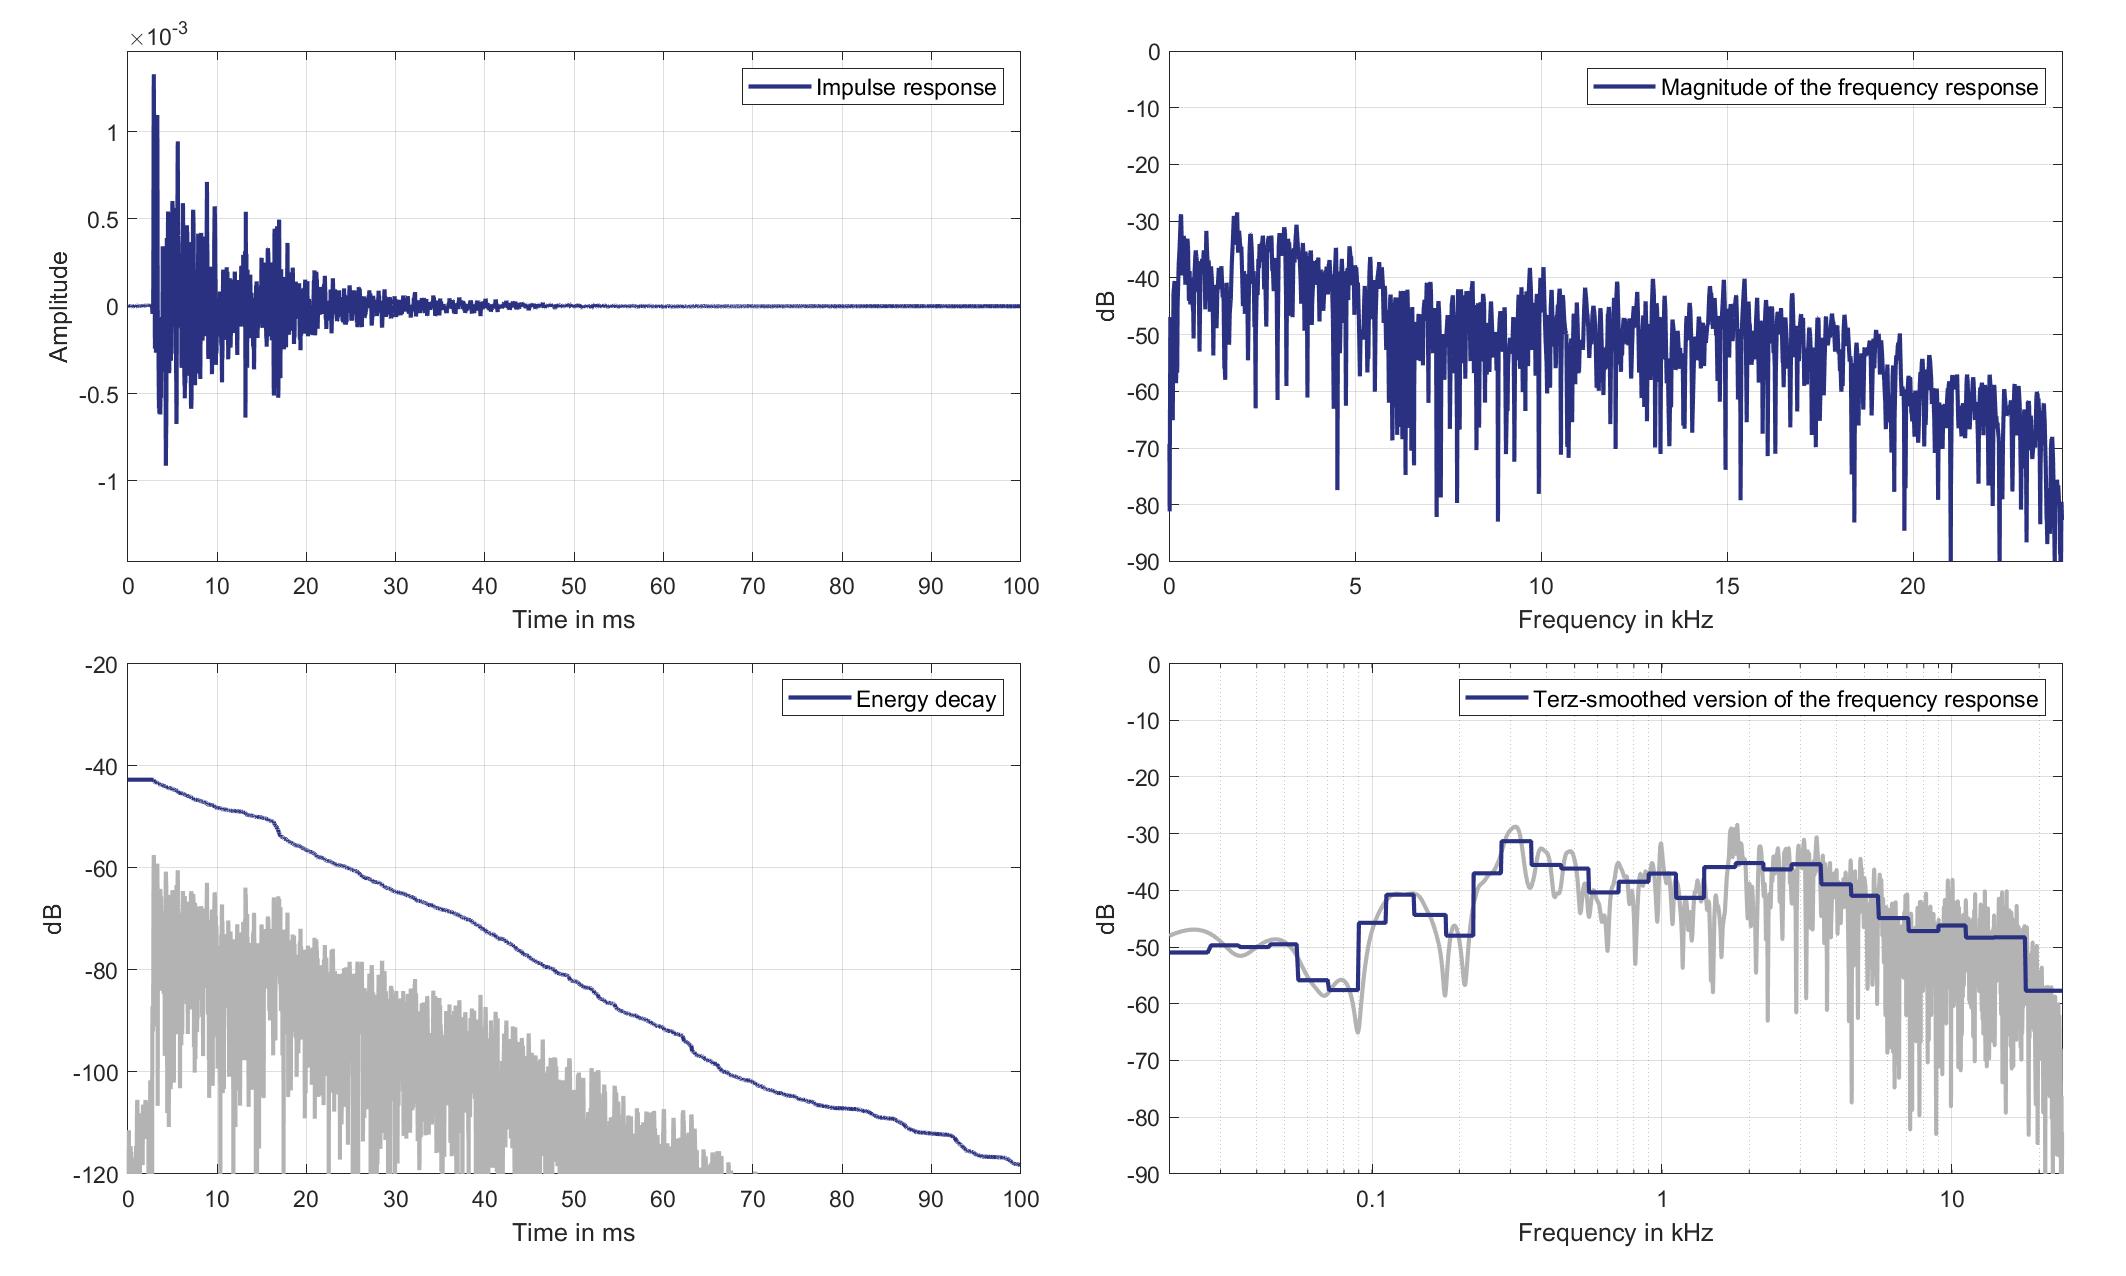
Download impulse response (in ".fir" format).
In the download section you can download all impulse response files as well as format explanation and Matlab as well as Python code examples for loading fir files.
Right lsp. - Right ear mic.
Right Headrest Loudspeaker of Zone 3 (Lsp. 5 to Right Ear Microphone of Zone 8 (Mic. 30)
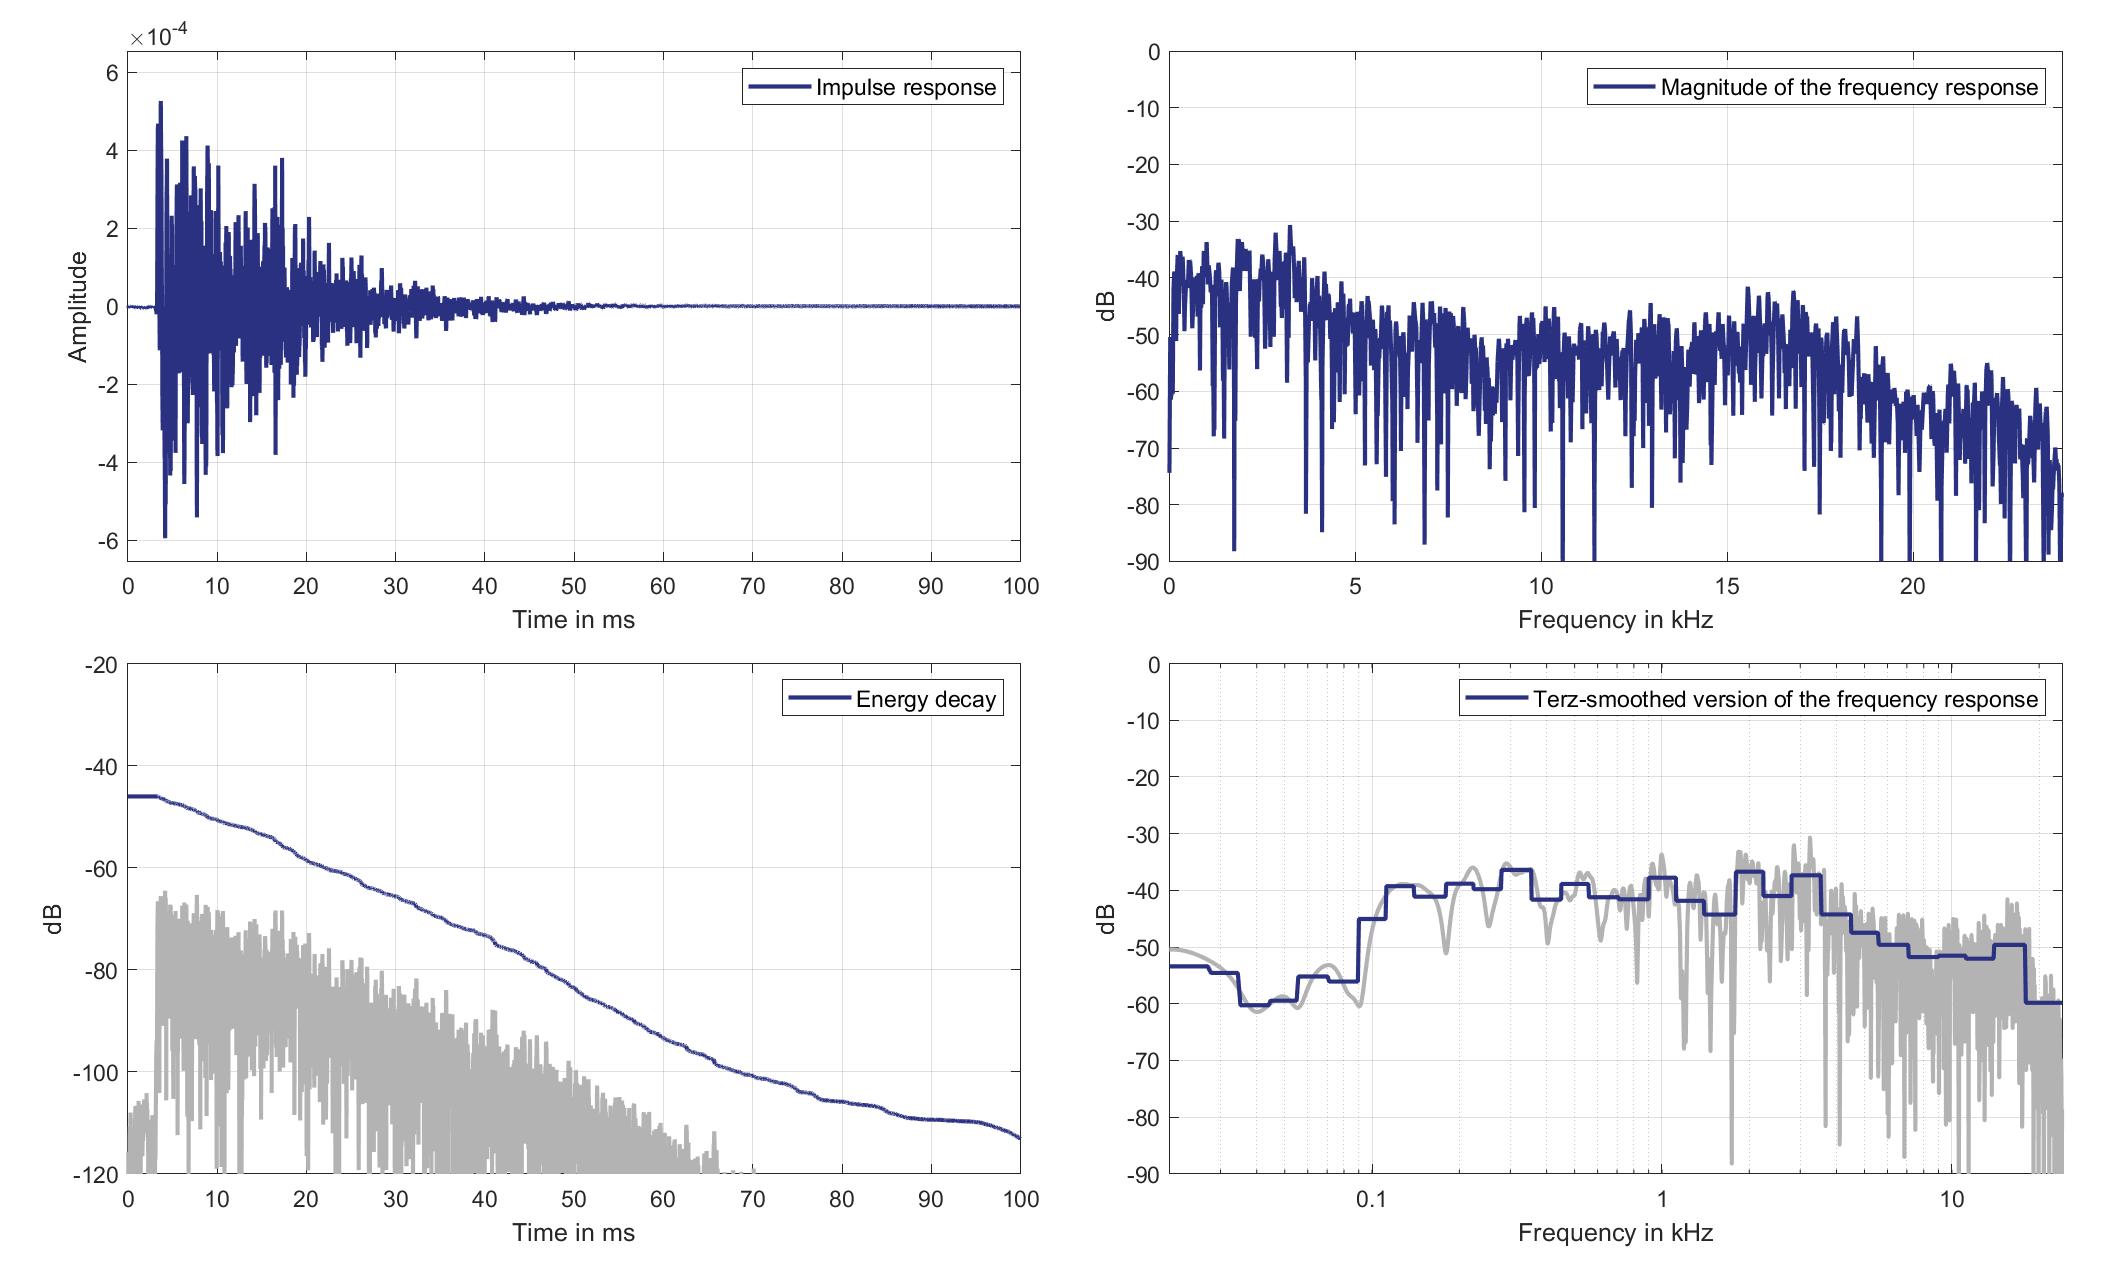
Download impulse response (in ".fir" format).
In the download section you can download all impulse response files as well as format explanation and Matlab as well as Python code examples for loading fir files.
Lsps. 6/7
Mics. 19/20
Left lsp. - left ear mic.
Left Headrest Loudspeaker of Zone 5 (Lsp. 6) to Left Ear Microphone of Zone 1 (Mic. 19)

Download impulse response (in ".fir" format).
In the download section you can download all impulse response files as well as format explanation and Matlab as well as Python code examples for loading fir files.
Left lsp. - Right ear mic.
Left Headrest Loudspeaker of Zone 5 (Lsp. 6) to Right Ear Microphone of Zone 1 (Mic. 20)
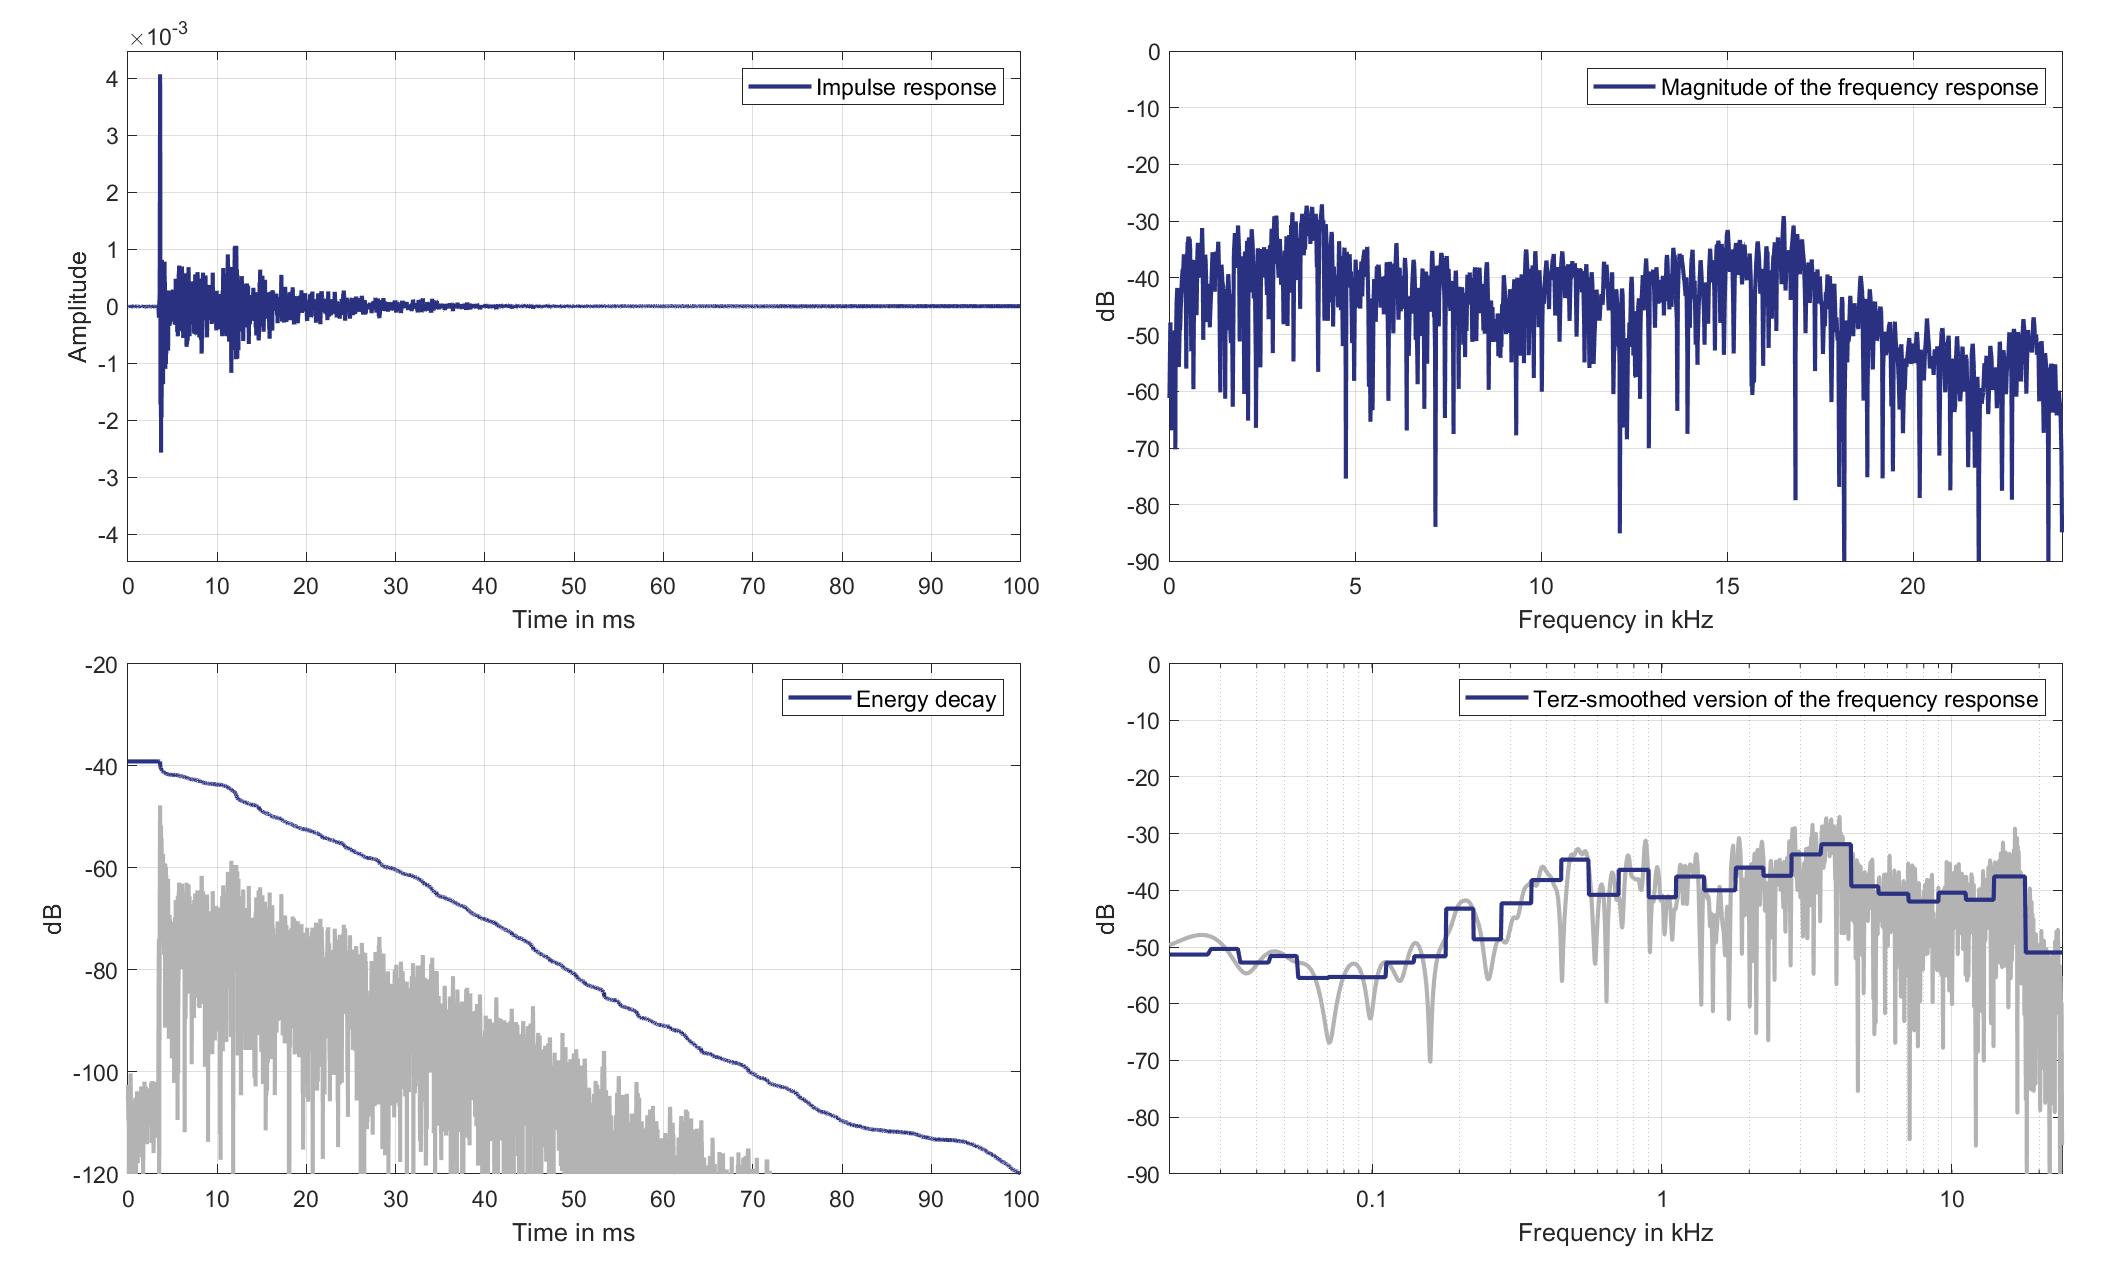
Download impulse response (in ".fir" format).
In the download section you can download all impulse response files as well as format explanation and Matlab as well as Python code examples for loading fir files.
Right lsp. - left ear mic.
Right Headrest Loudspeaker of Zone 5 (Lsp. 7) to Left Ear Microphone of Zone 1 (Mic. 19)
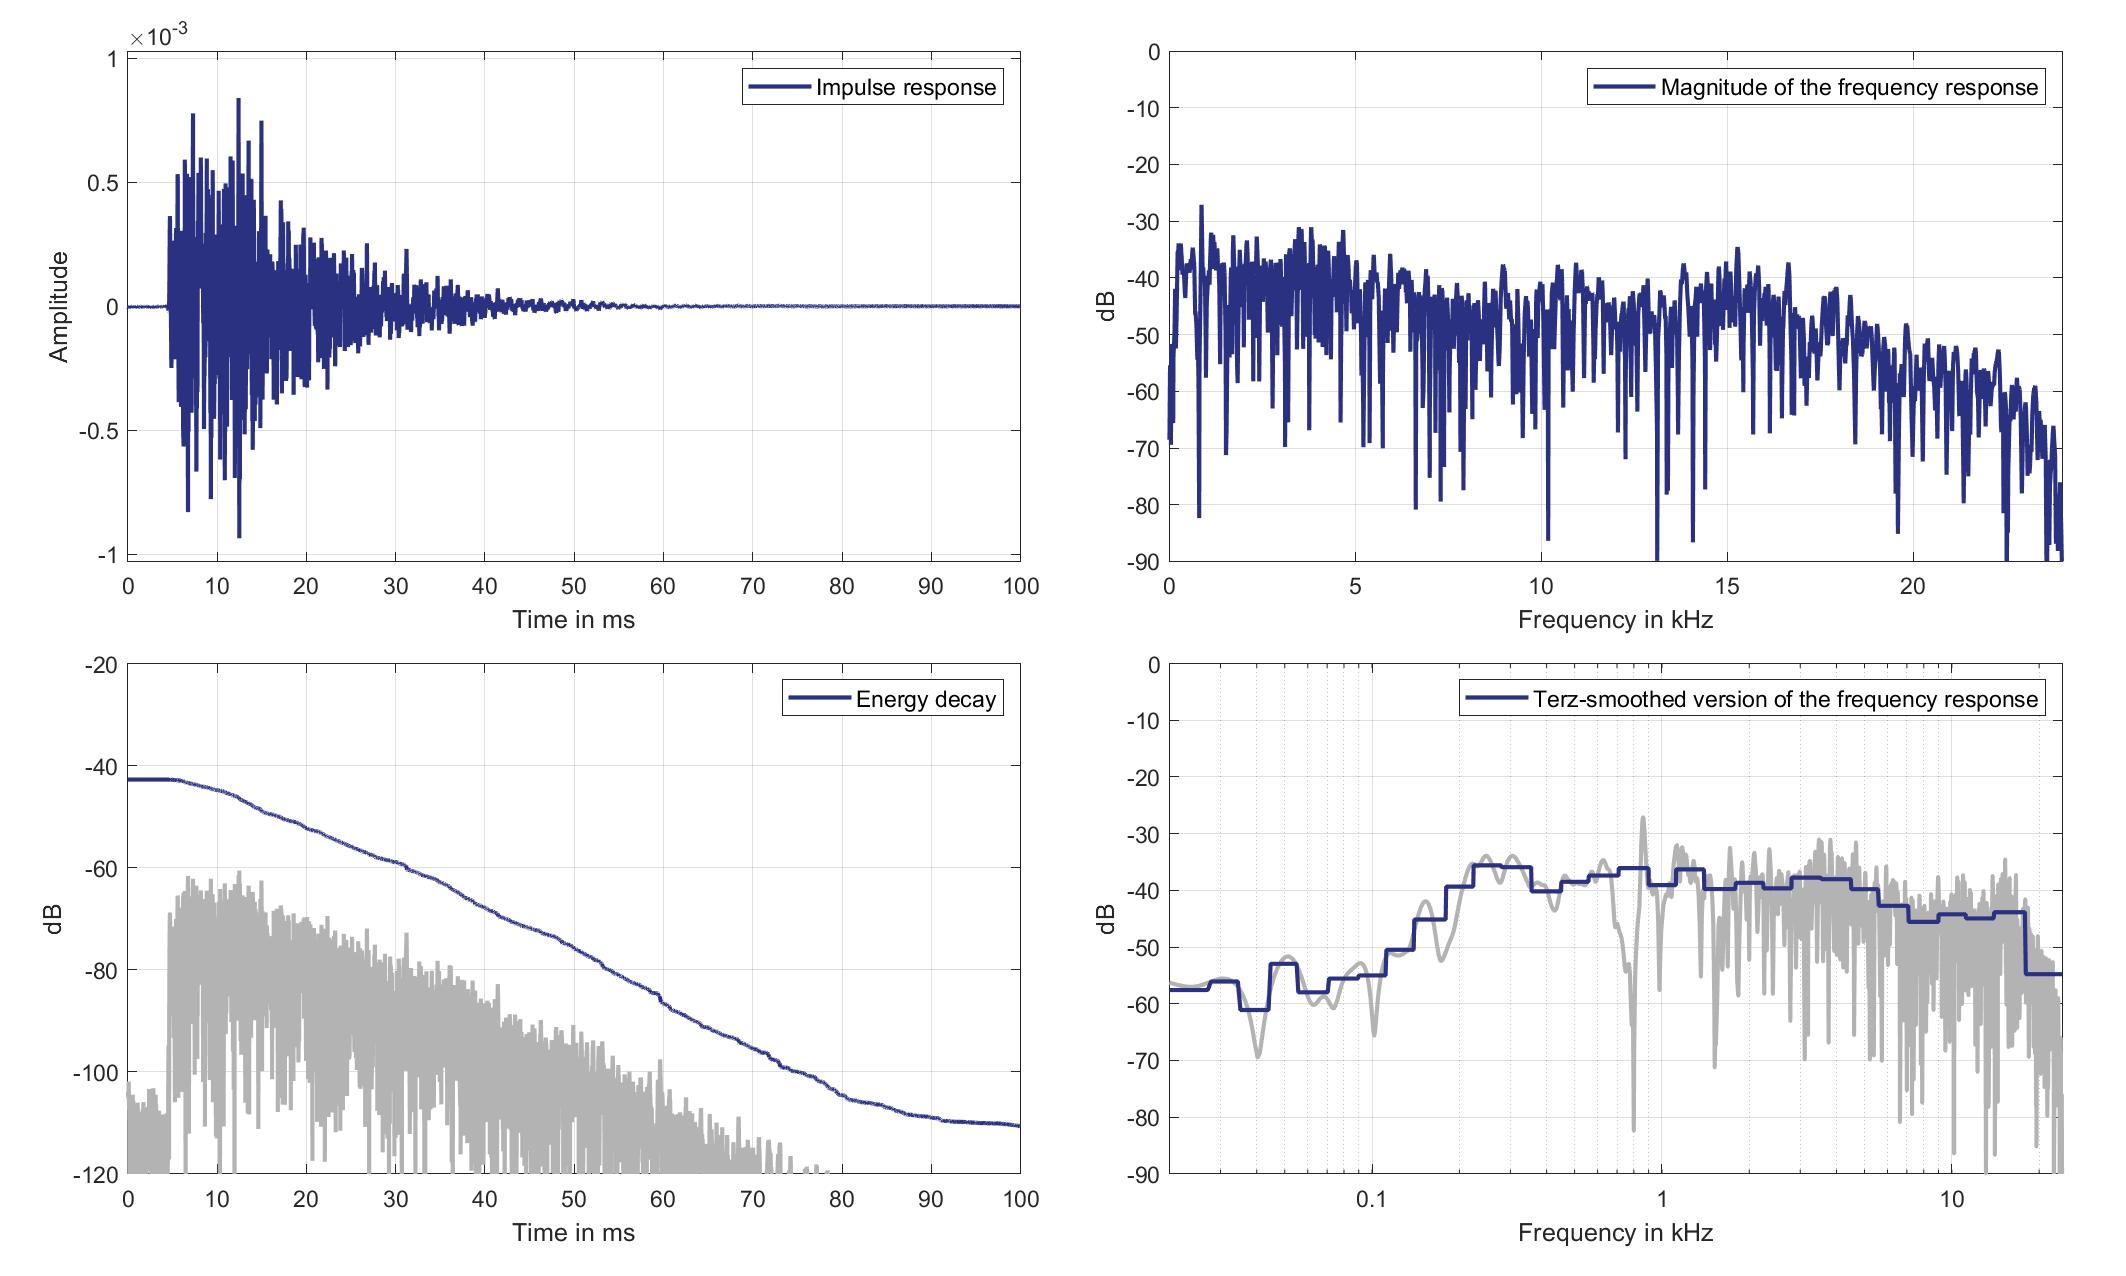
Download impulse response (in ".fir" format).
In the download section you can download all impulse response files as well as format explanation and Matlab as well as Python code examples for loading fir files.
Right lsp. - Right ear mic.
Right Headrest Loudspeaker of Zone 5 (Lsp. 7 to Right Ear Microphone of Zone 1 (Mic. 20)
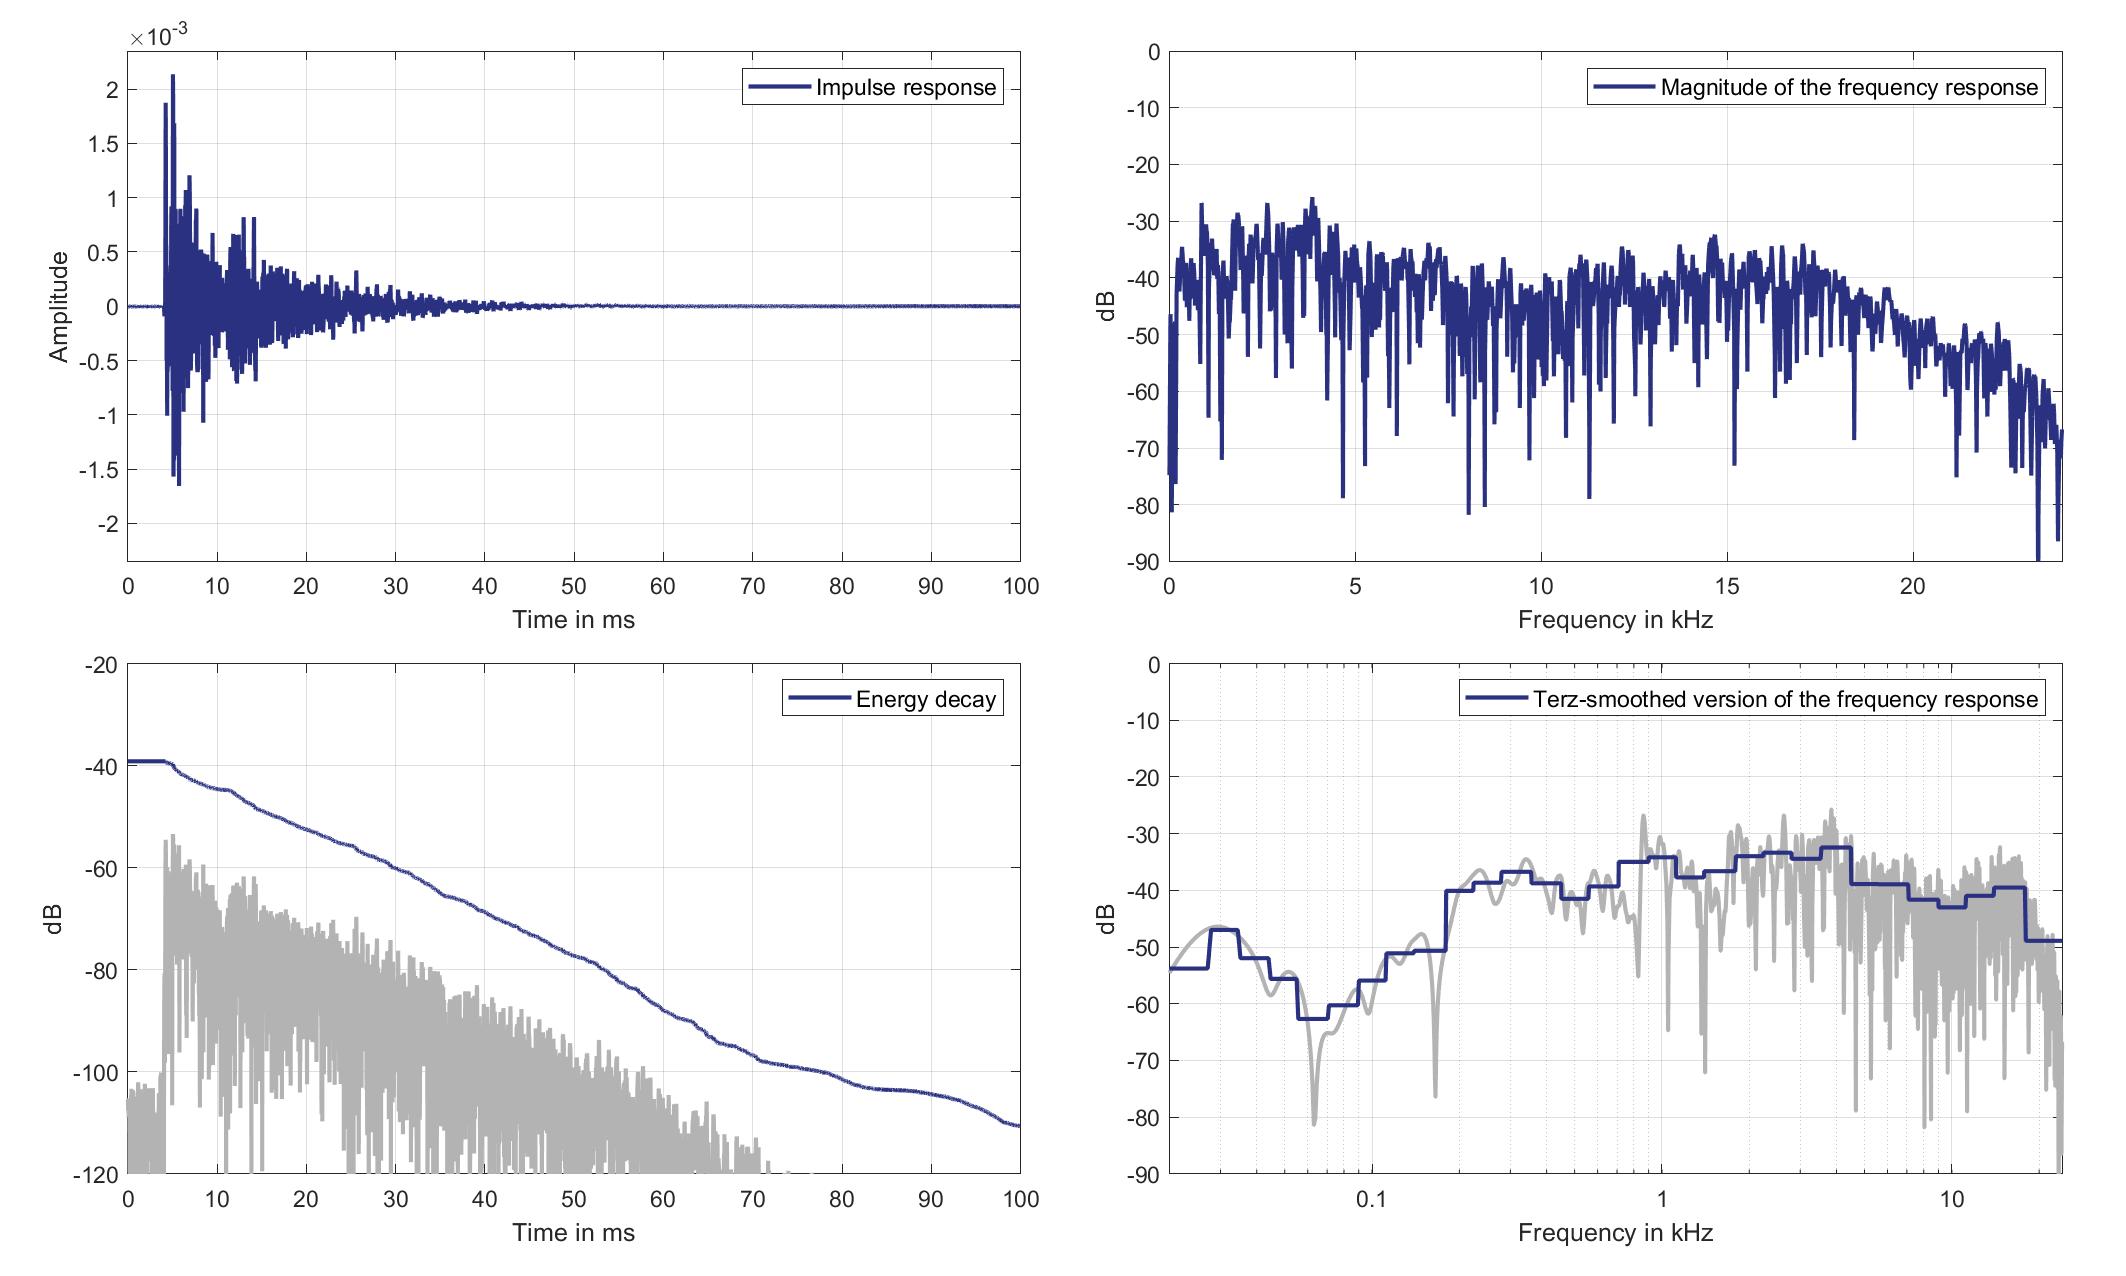
Download impulse response (in ".fir" format).
In the download section you can download all impulse response files as well as format explanation and Matlab as well as Python code examples for loading fir files.
Mics. 21/22
Left lsp. - left ear mic.
Left Headrest Loudspeaker of Zone 5 (Lsp. 6) to Left Ear Microphone of Zone 2 (Mic. 21)
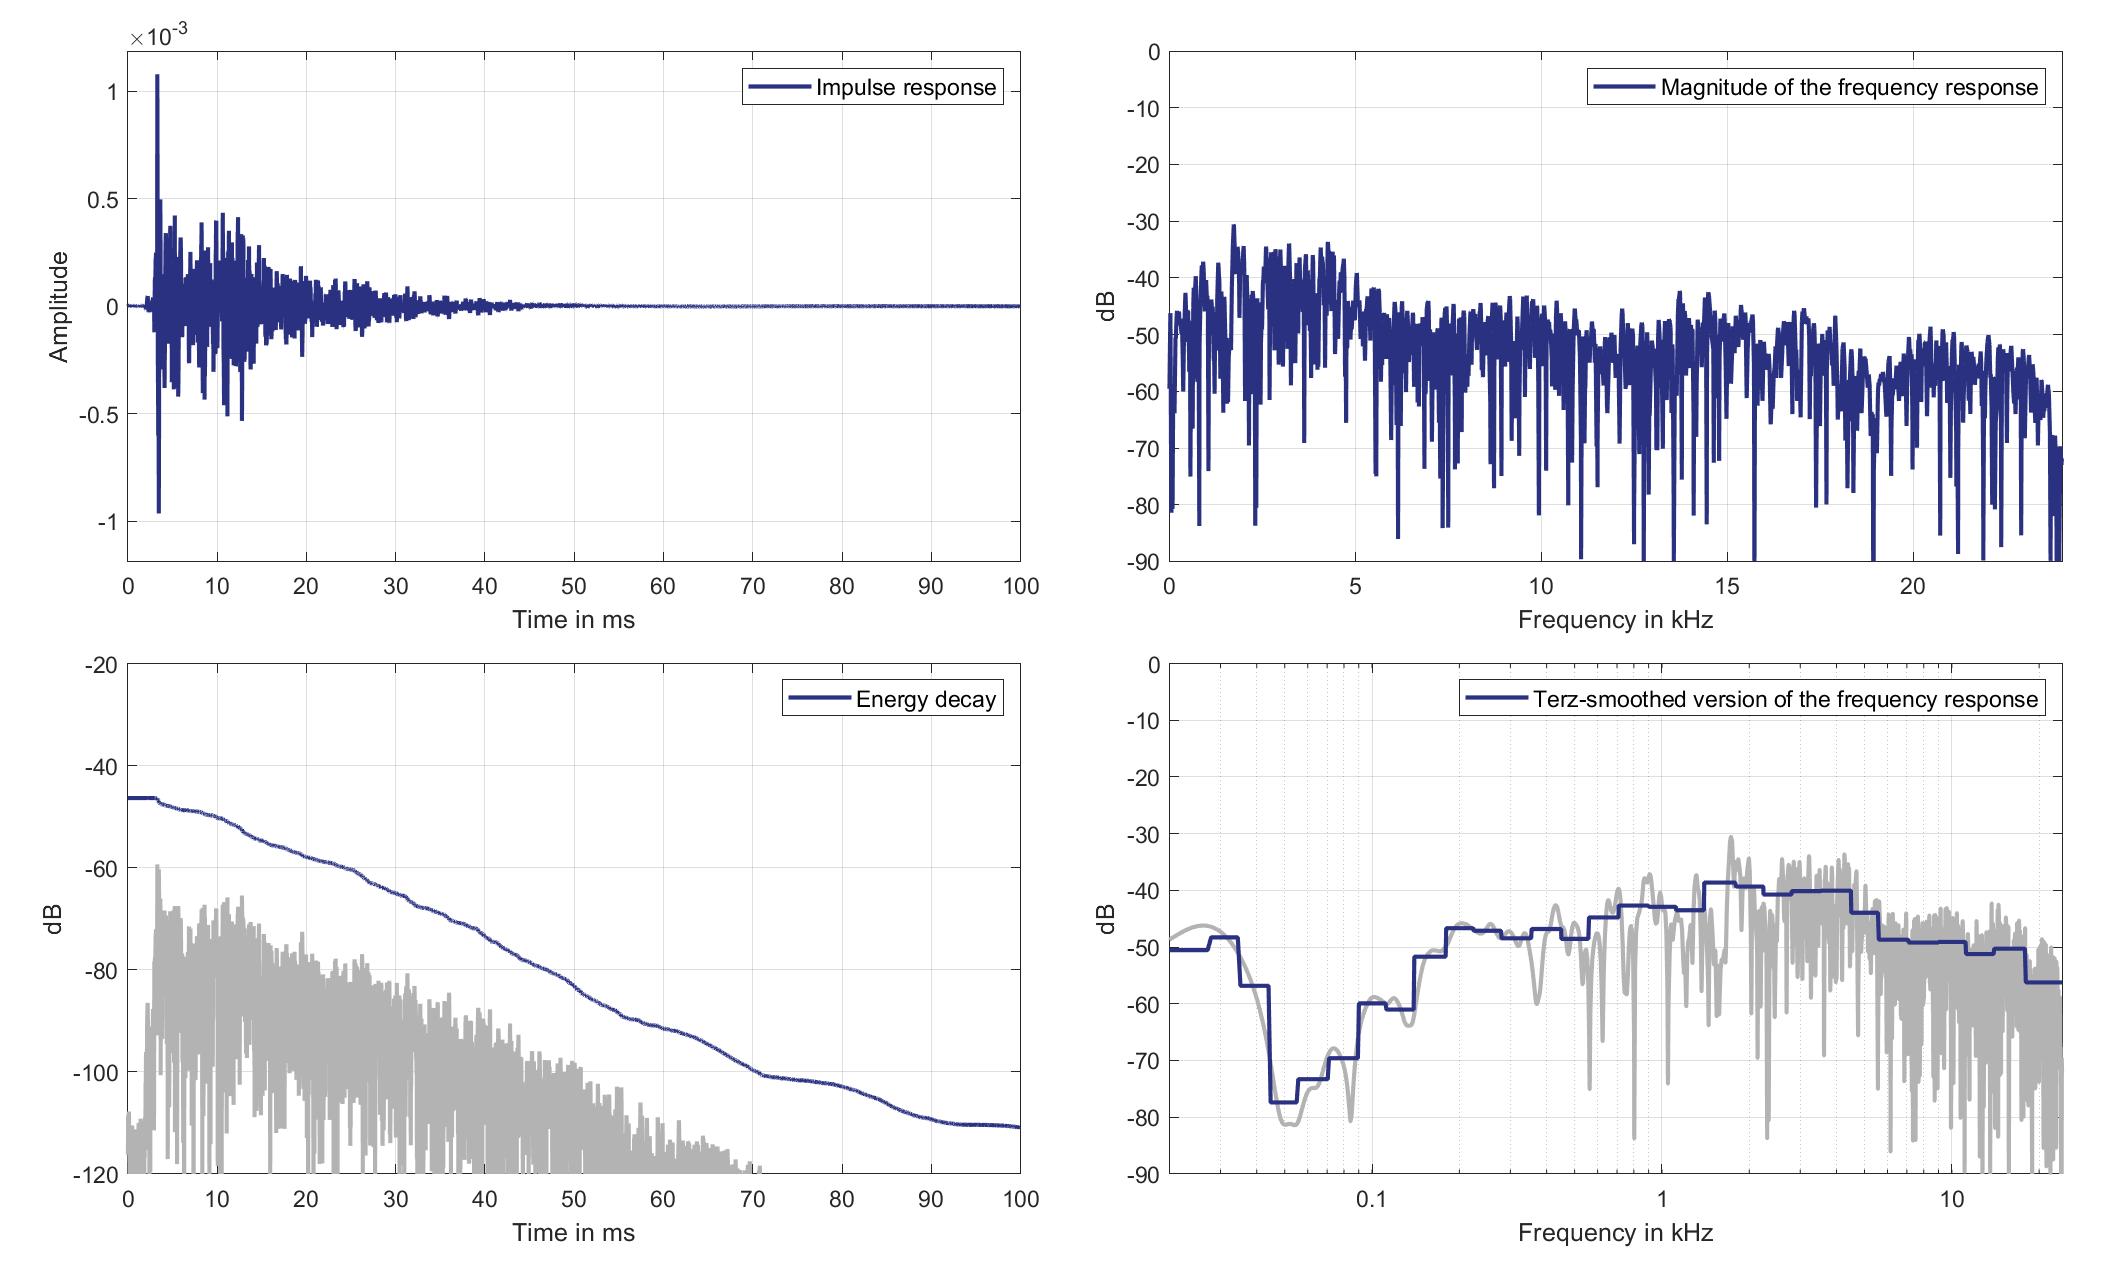
Download impulse response (in ".fir" format).
In the download section you can download all impulse response files as well as format explanation and Matlab as well as Python code examples for loading fir files.
Left lsp. - Right ear mic.
Left Headrest Loudspeaker of Zone 5 (Lsp. 6) to Right Ear Microphone of Zone 2 (Mic. 22)
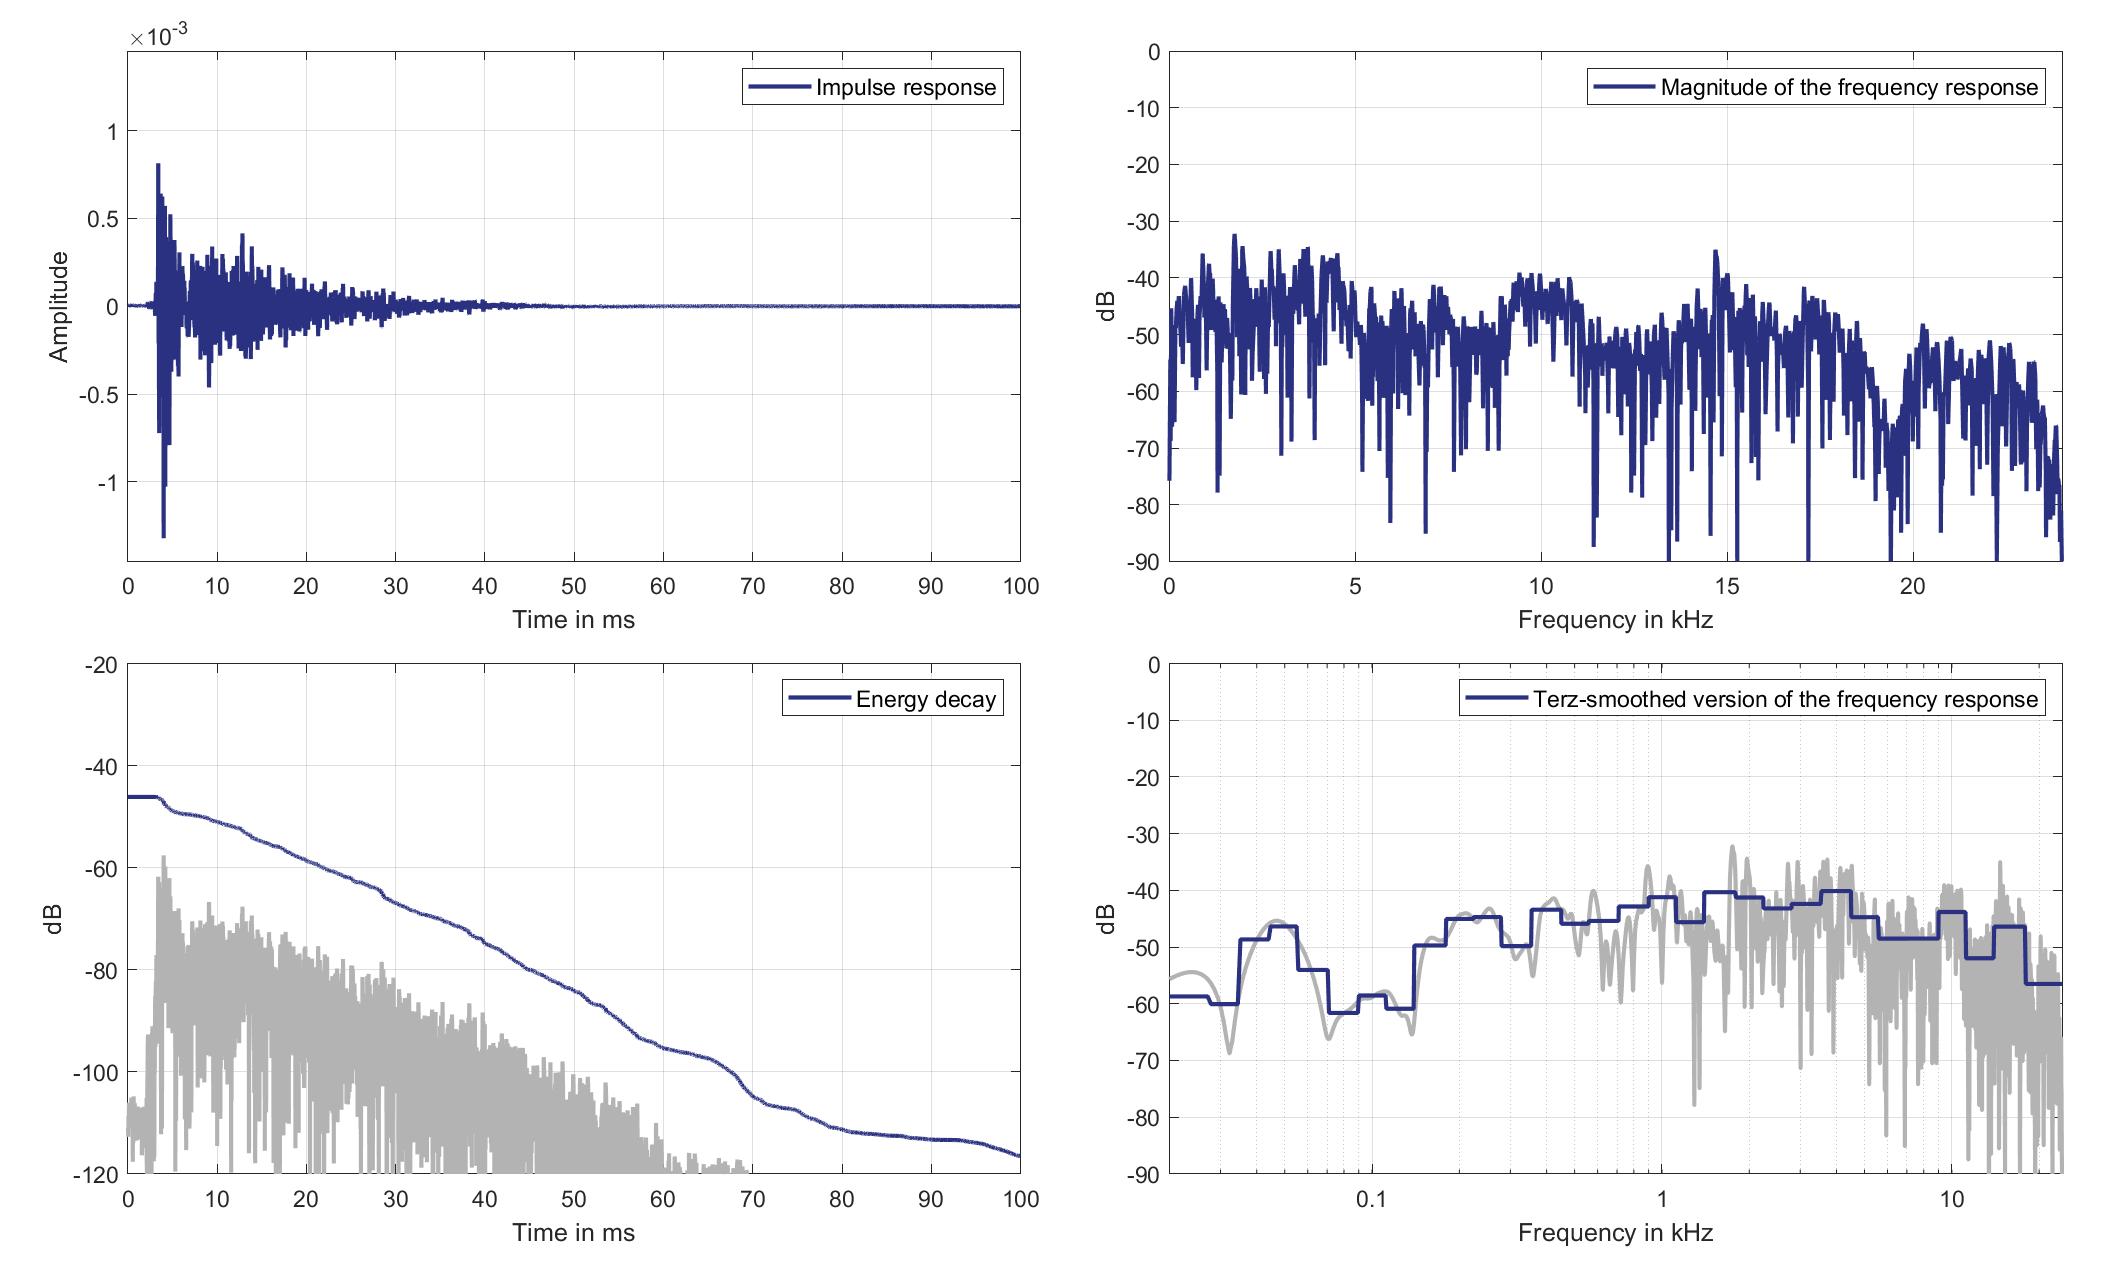
Download impulse response (in ".fir" format).
In the download section you can download all impulse response files as well as format explanation and Matlab as well as Python code examples for loading fir files.
Right lsp. - left ear mic.
Right Headrest Loudspeaker of Zone 5 (Lsp. 7) to Left Ear Microphone of Zone 2 (Mic. 21)
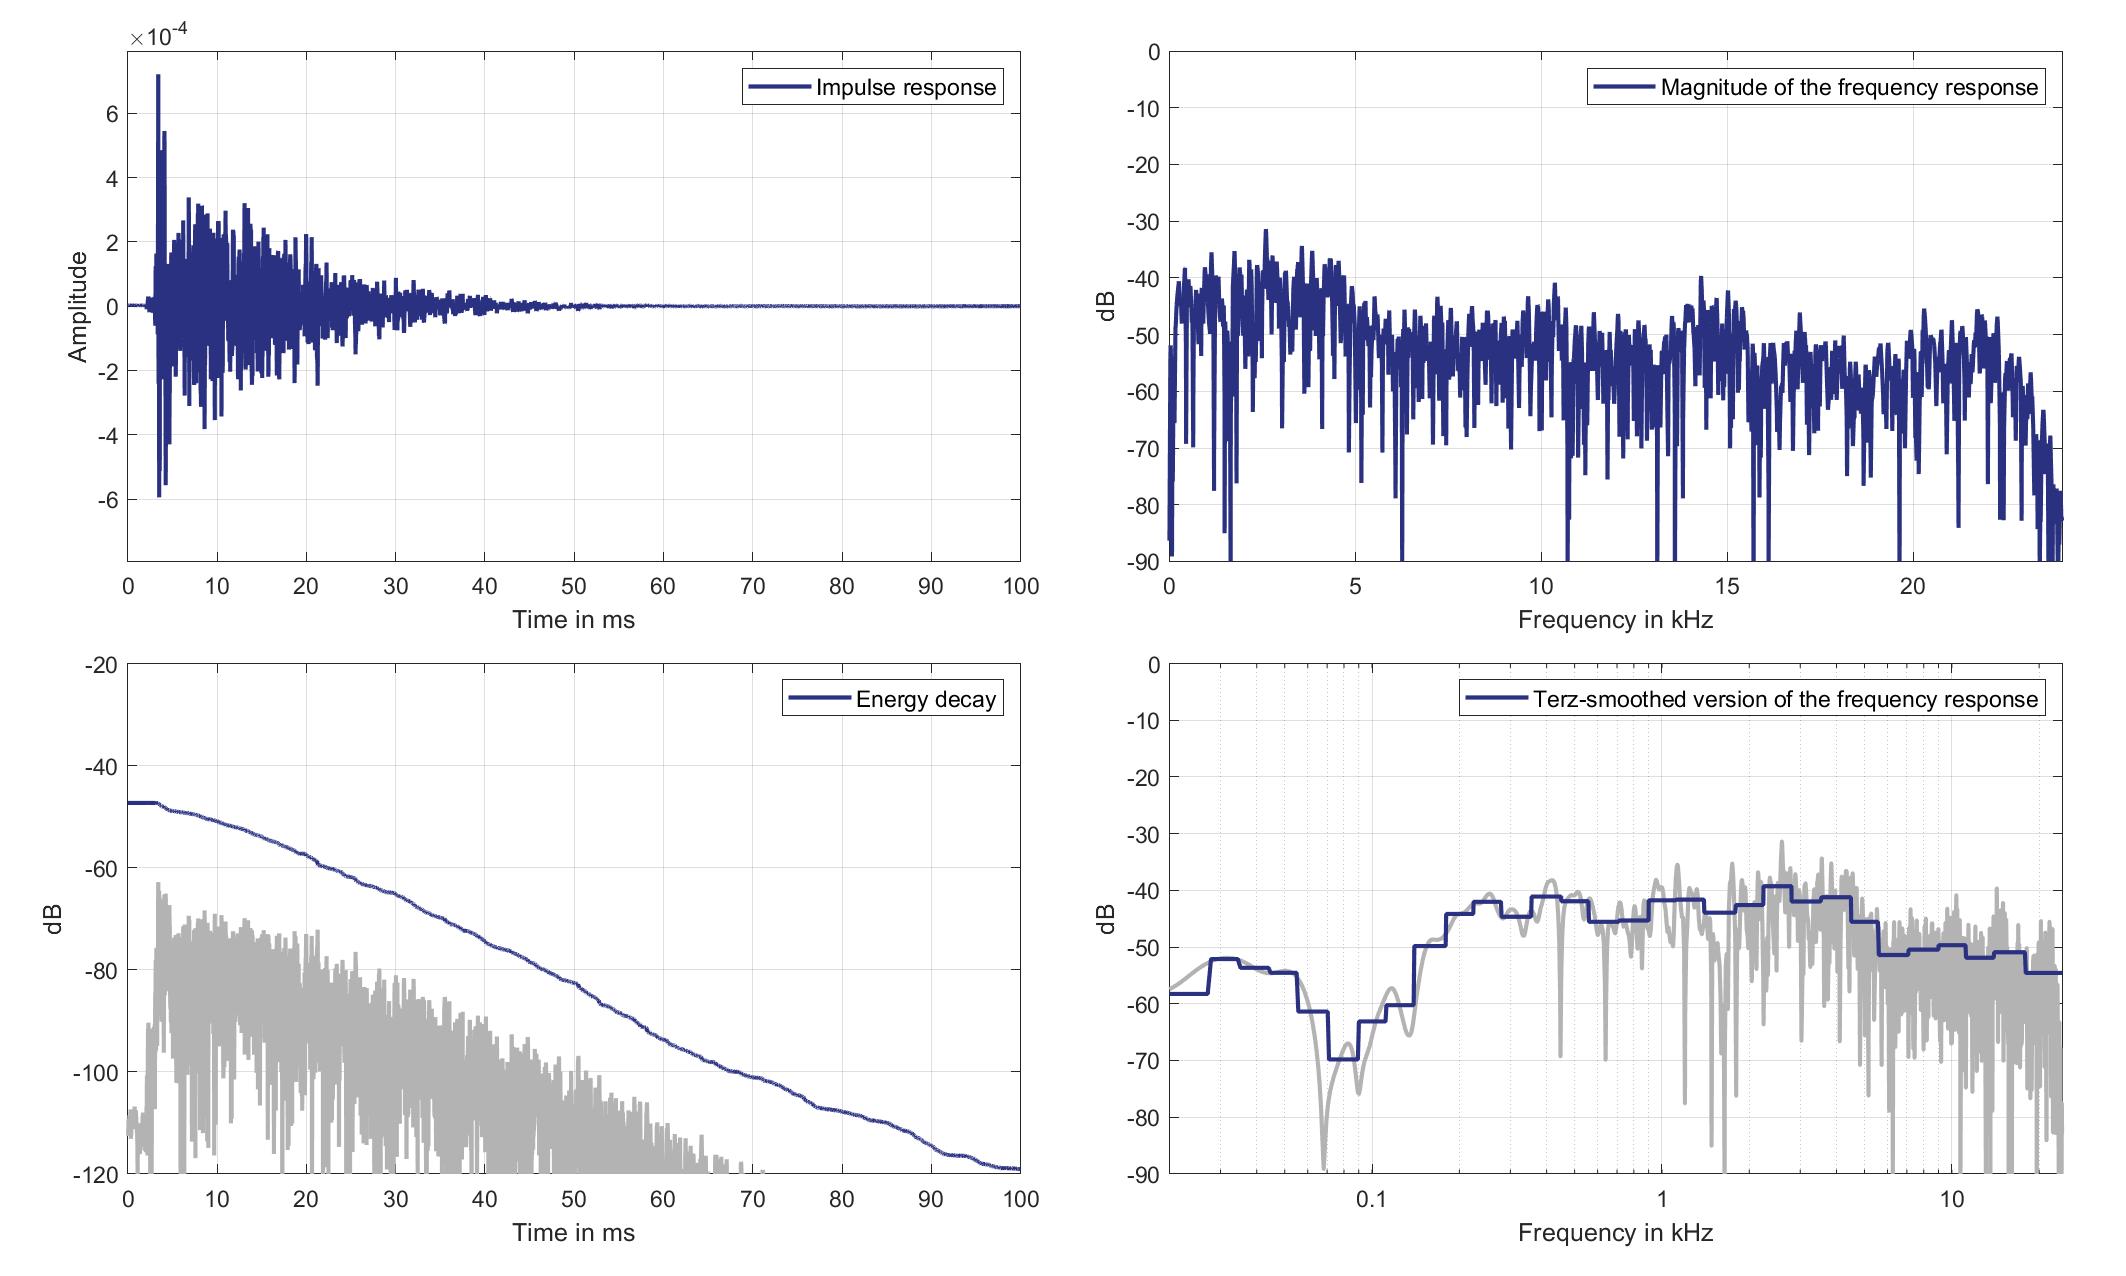
Download impulse response (in ".fir" format).
In the download section you can download all impulse response files as well as format explanation and Matlab as well as Python code examples for loading fir files.
Right lsp. - Right ear mic.
Right Headrest Loudspeaker of Zone 5 (Lsp. 7 to Right Ear Microphone of Zone 2 (Mic. 22)
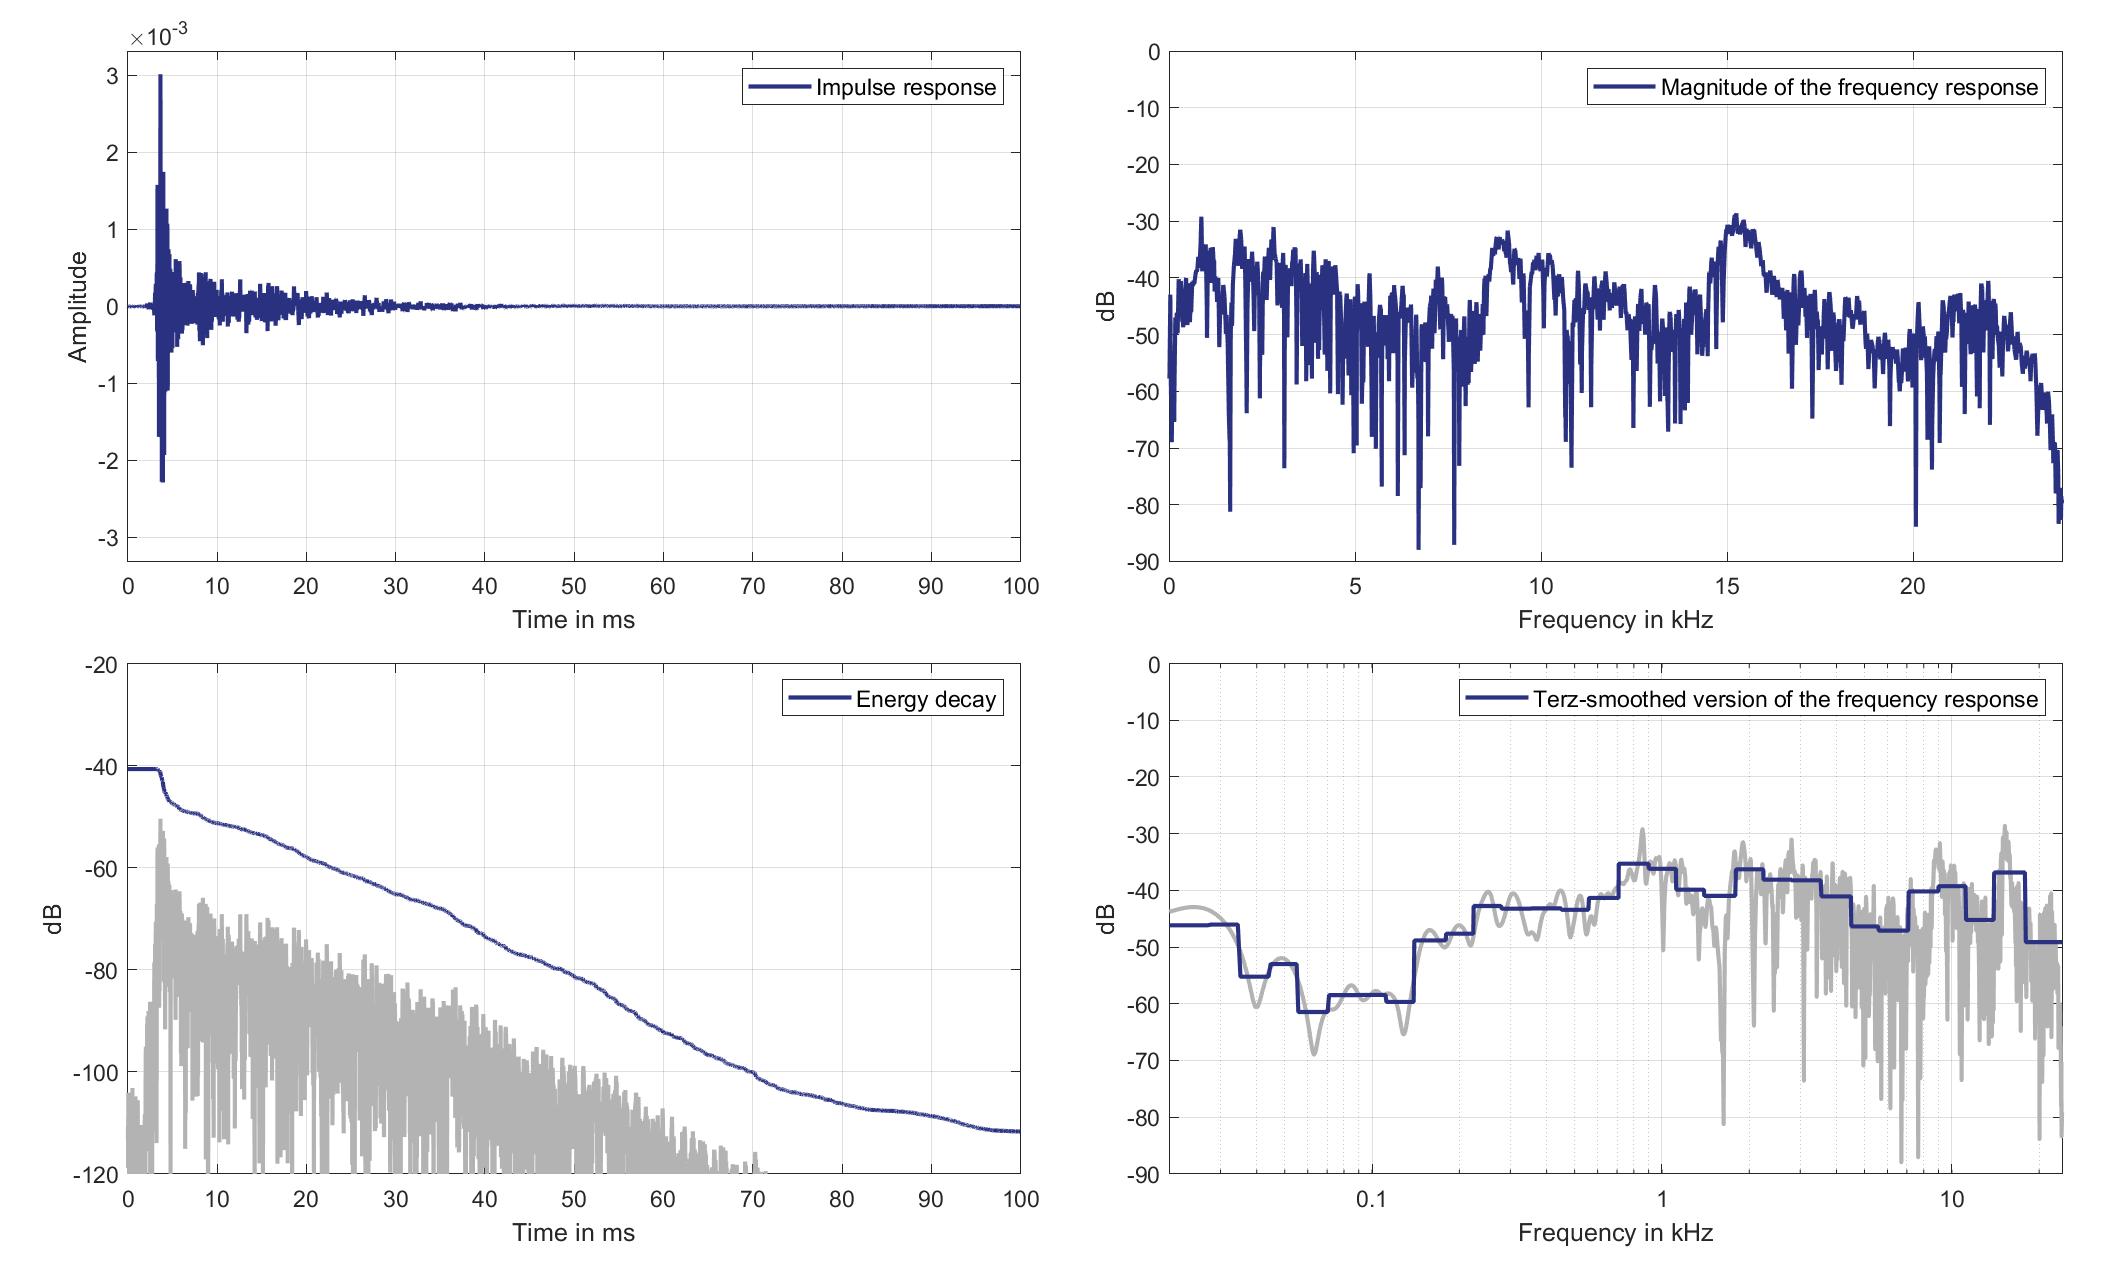
Download impulse response (in ".fir" format).
In the download section you can download all impulse response files as well as format explanation and Matlab as well as Python code examples for loading fir files.
Mics. 23/24
Left lsp. - left ear mic.
Left Headrest Loudspeaker of Zone 5 (Lsp. 6) to Left Ear Microphone of Zone 3 (Mic. 23)
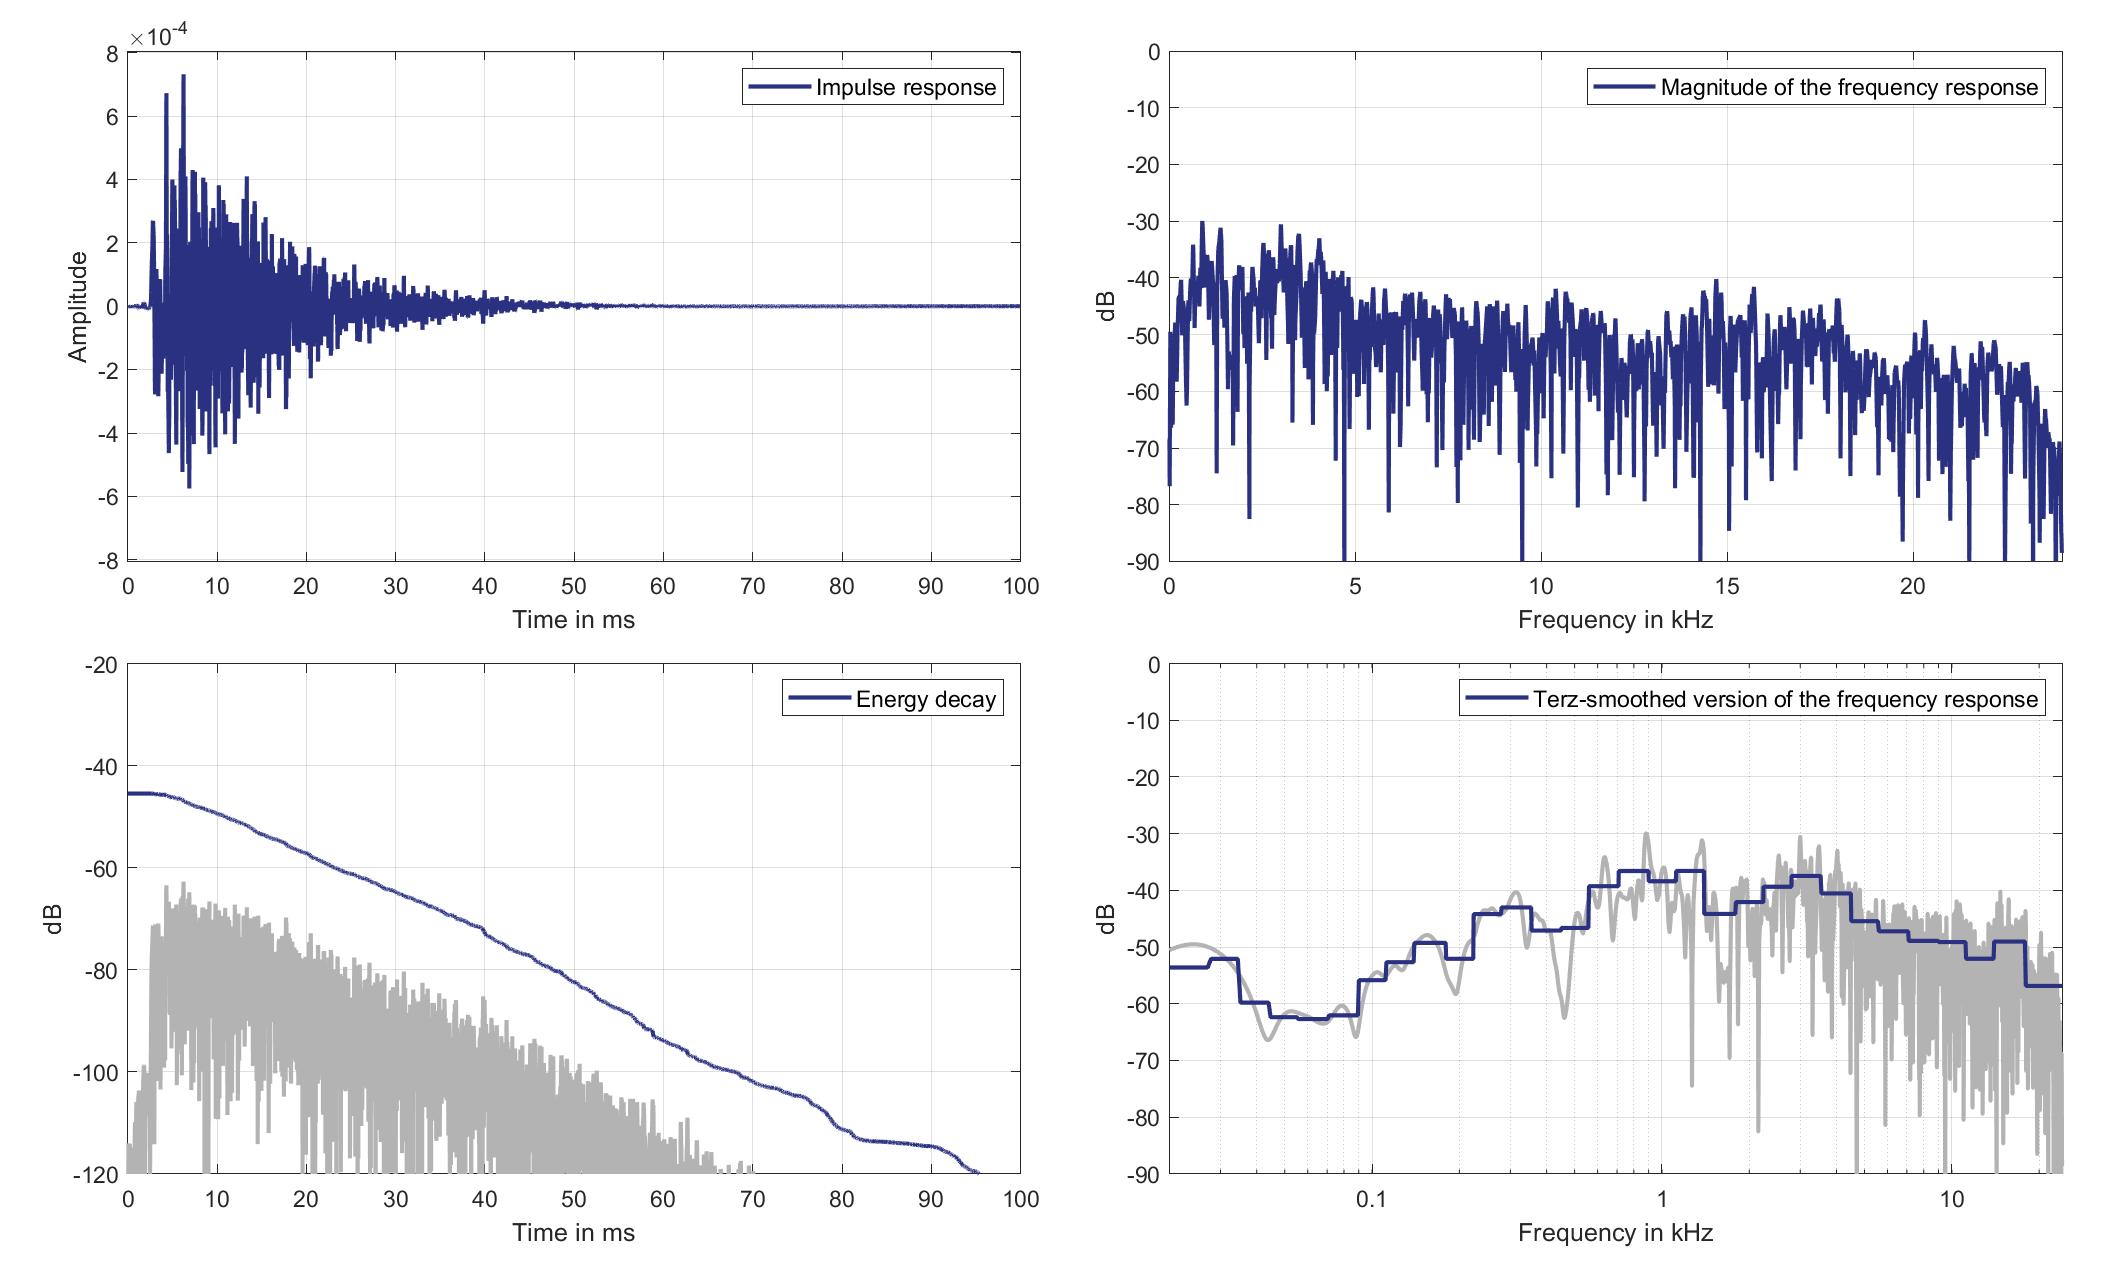
Download impulse response (in ".fir" format).
In the download section you can download all impulse response files as well as format explanation and Matlab as well as Python code examples for loading fir files.
Left lsp. - Right ear mic.
Left Headrest Loudspeaker of Zone 5 (Lsp. 6) to Right Ear Microphone of Zone 3 (Mic. 24)
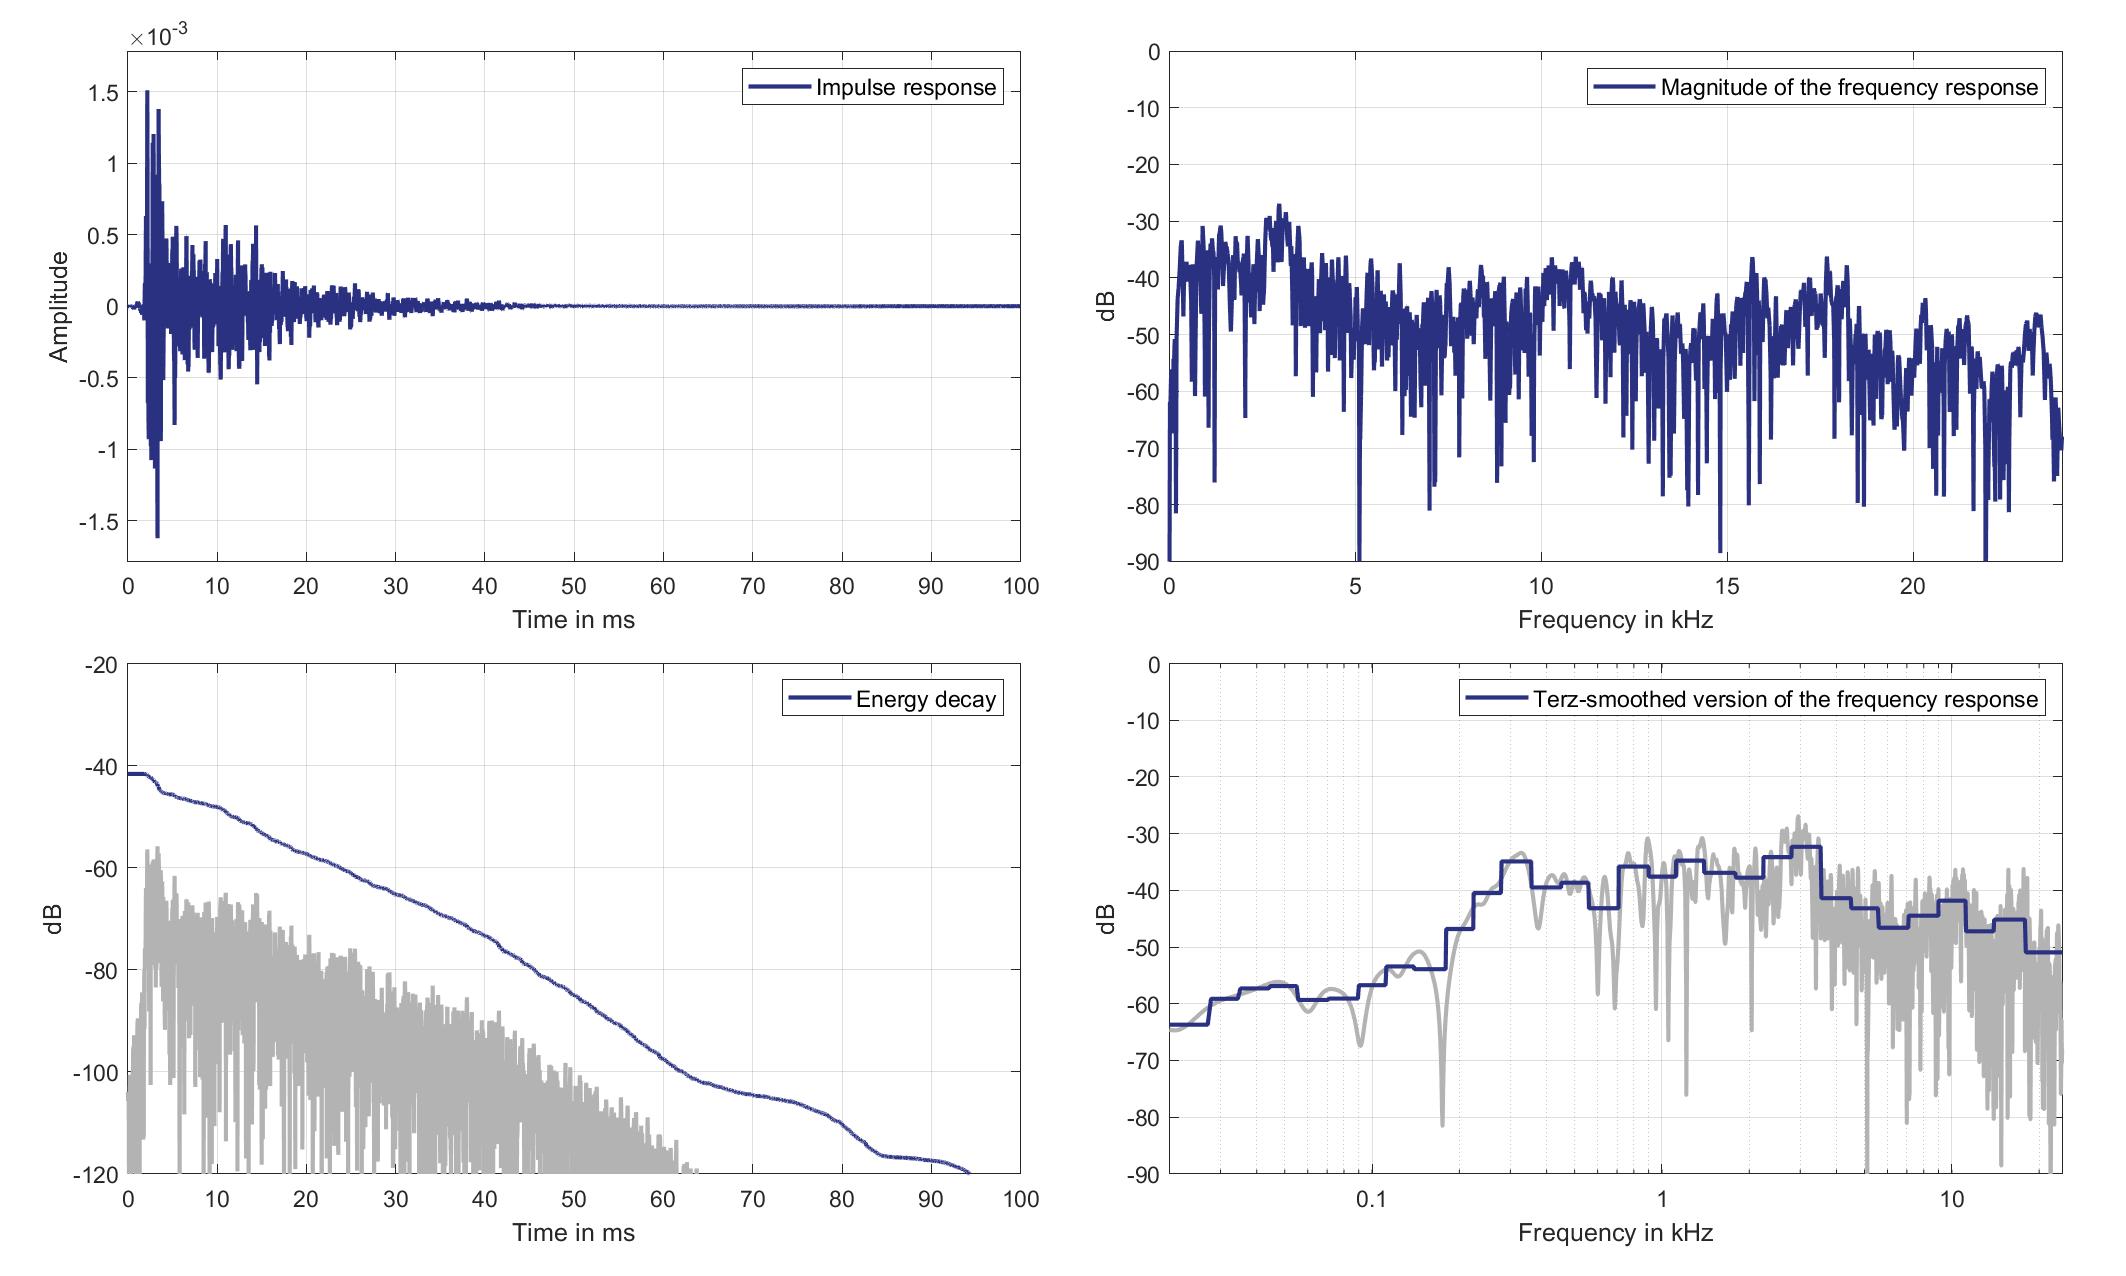
Download impulse response (in ".fir" format).
In the download section you can download all impulse response files as well as format explanation and Matlab as well as Python code examples for loading fir files.
Right lsp. - left ear mic.
Right Headrest Loudspeaker of Zone 5 (Lsp. 7) to Left Ear Microphone of Zone 3 (Mic. 23)
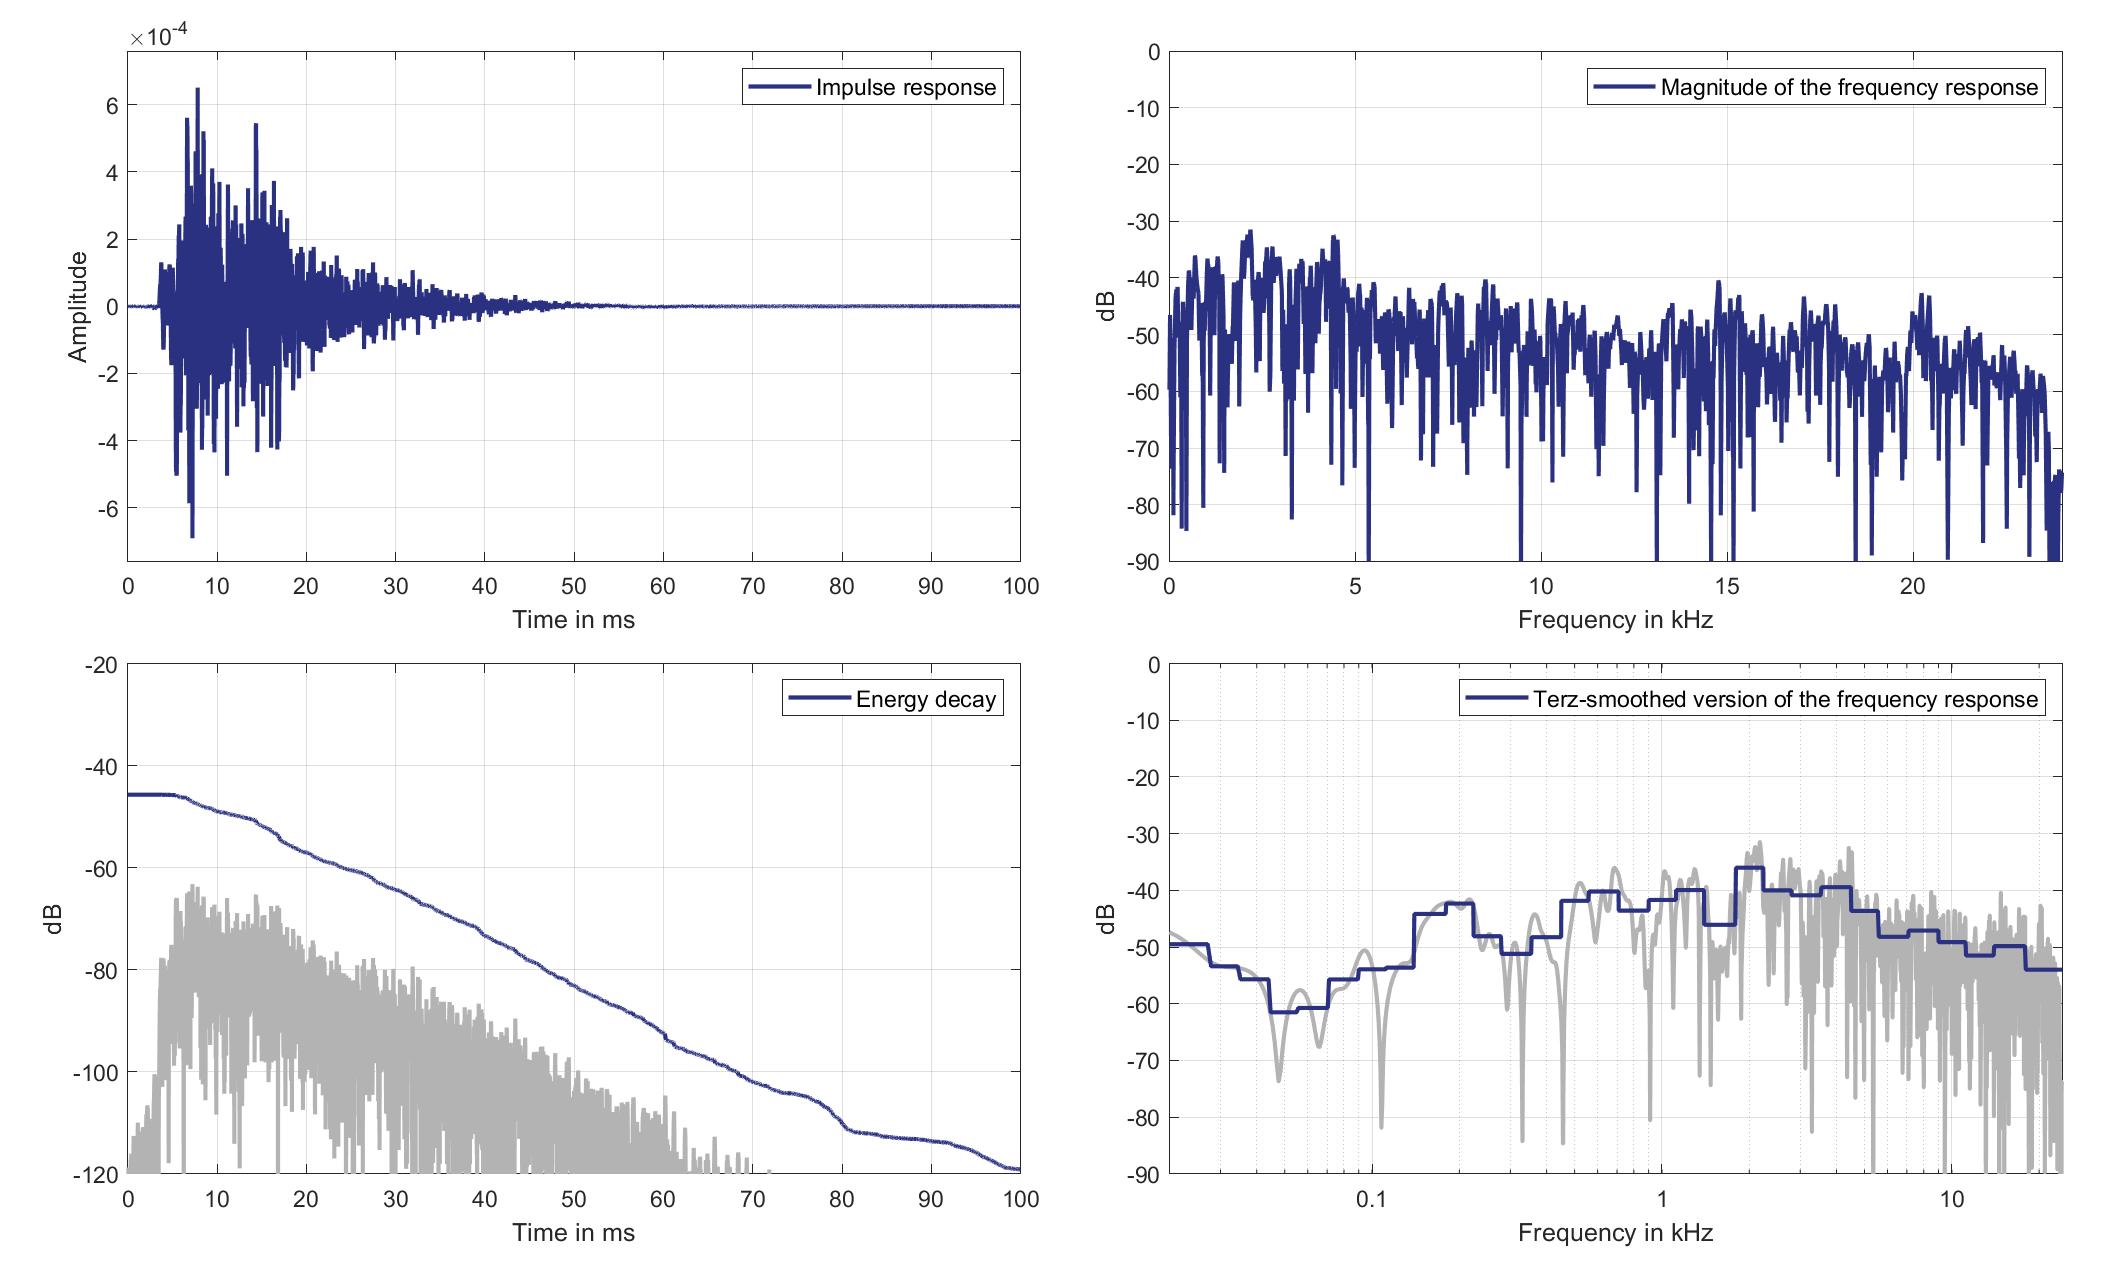
Download impulse response (in ".fir" format).
In the download section you can download all impulse response files as well as format explanation and Matlab as well as Python code examples for loading fir files.
Right lsp. - Right ear mic.
Right Headrest Loudspeaker of Zone 5 (Lsp. 7 to Right Ear Microphone of Zone 3 (Mic. 24)
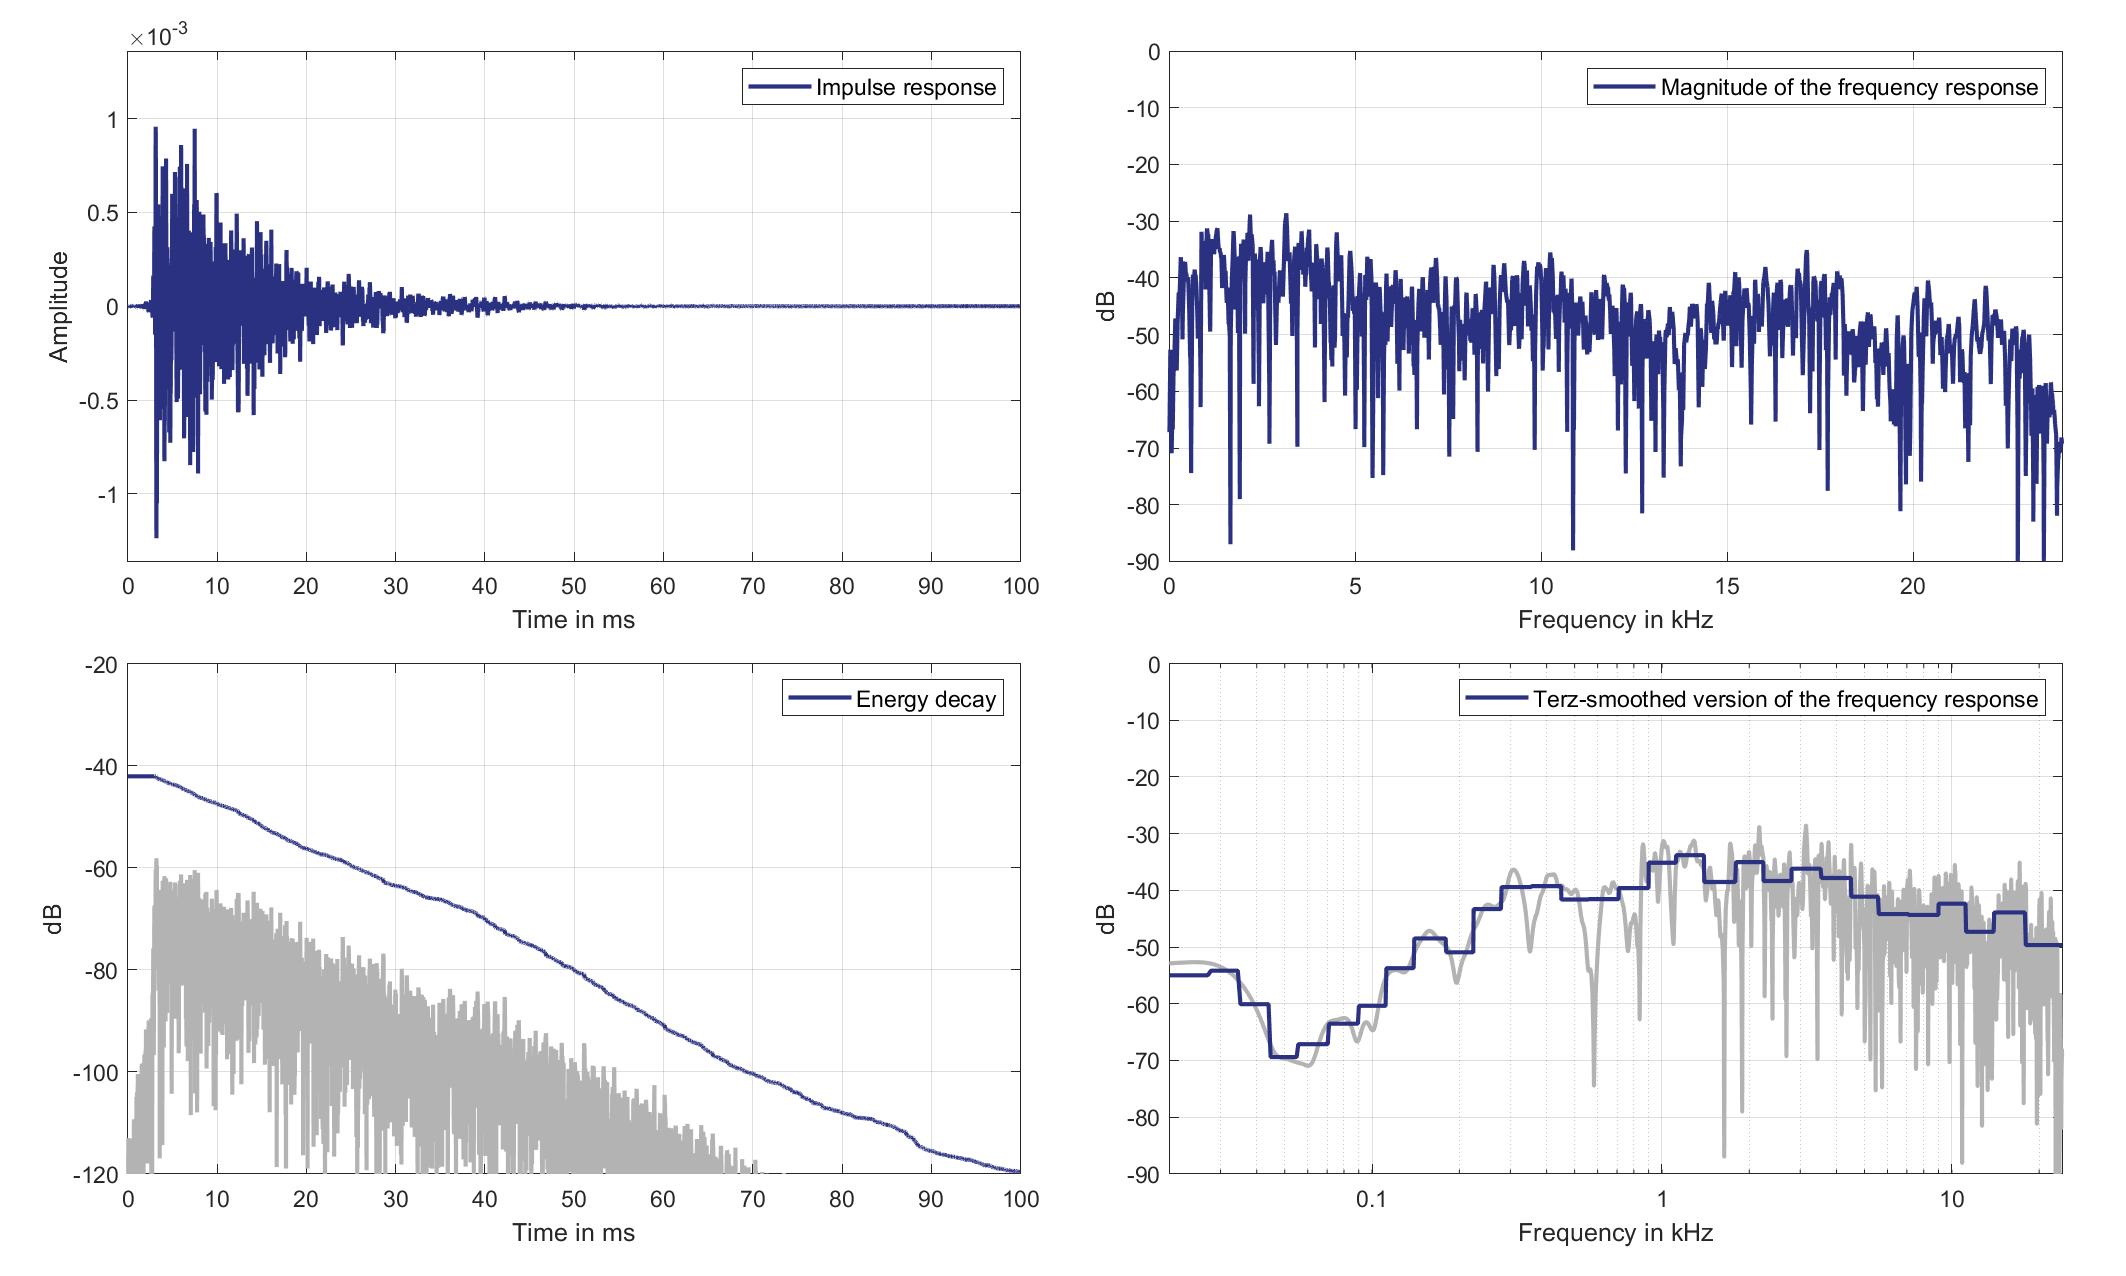
Download impulse response (in ".fir" format).
In the download section you can download all impulse response files as well as format explanation and Matlab as well as Python code examples for loading fir files.
Mics. 25/26
Left lsp. - left ear mic.
Left Headrest Loudspeaker of Zone 5 (Lsp. 6) to Left Ear Microphone of Zone 5 (Mic. 25)

Download impulse response (in ".fir" format).
In the download section you can download all impulse response files as well as format explanation and Matlab as well as Python code examples for loading fir files.
Left lsp. - Right ear mic.
Left Headrest Loudspeaker of Zone 5 (Lsp. 6) to Right Ear Microphone of Zone 5 (Mic. 26)
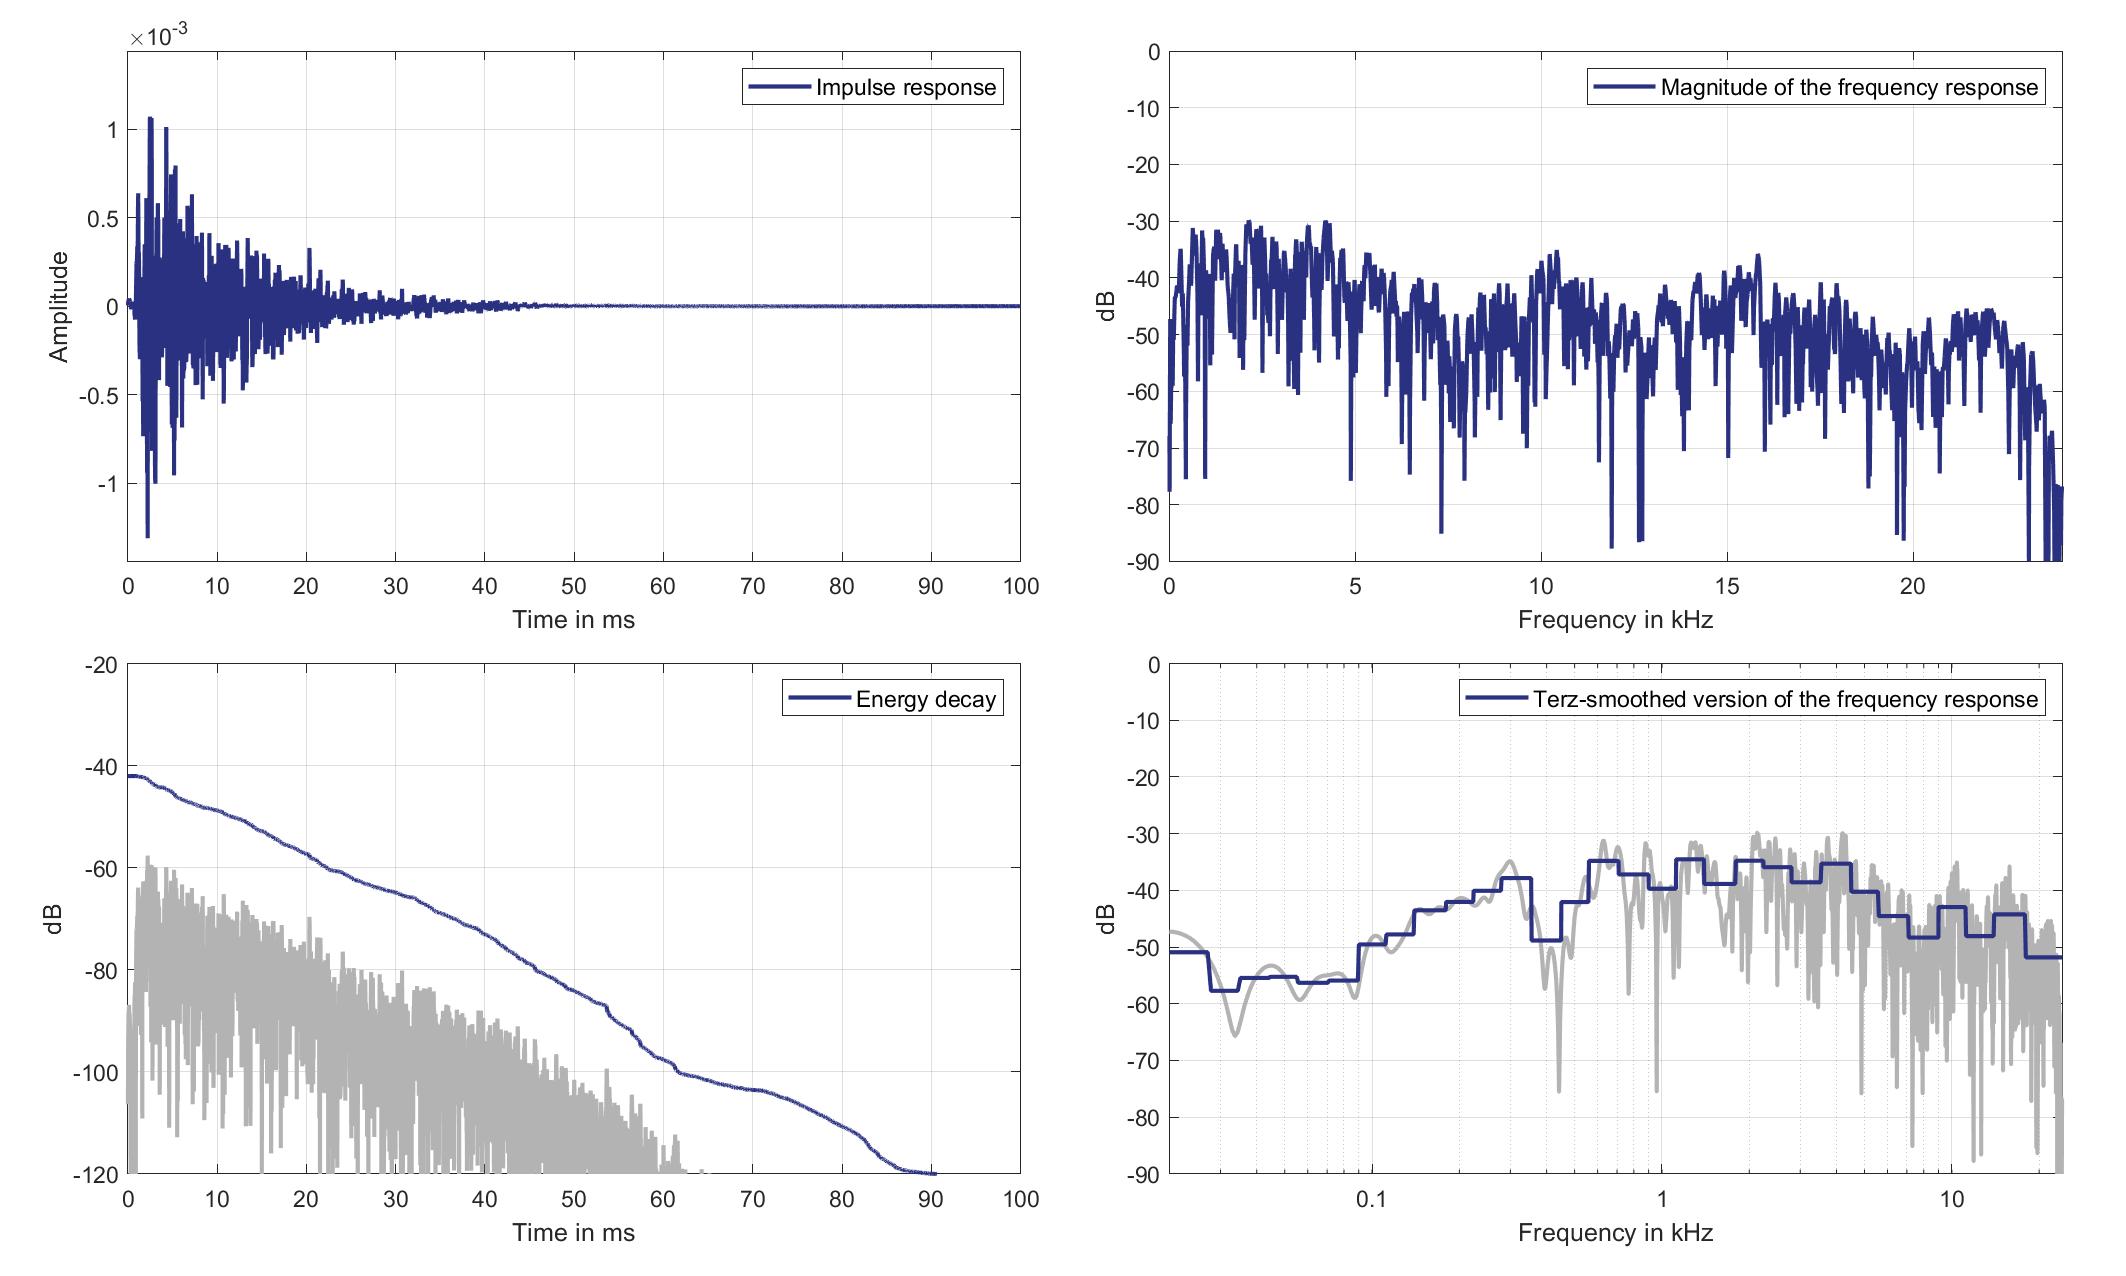
Download impulse response (in ".fir" format).
In the download section you can download all impulse response files as well as format explanation and Matlab as well as Python code examples for loading fir files.
Right lsp. - left ear mic.
Right Headrest Loudspeaker of Zone 5 (Lsp. 7) to Left Ear Microphone of Zone 5 (Mic. 25)
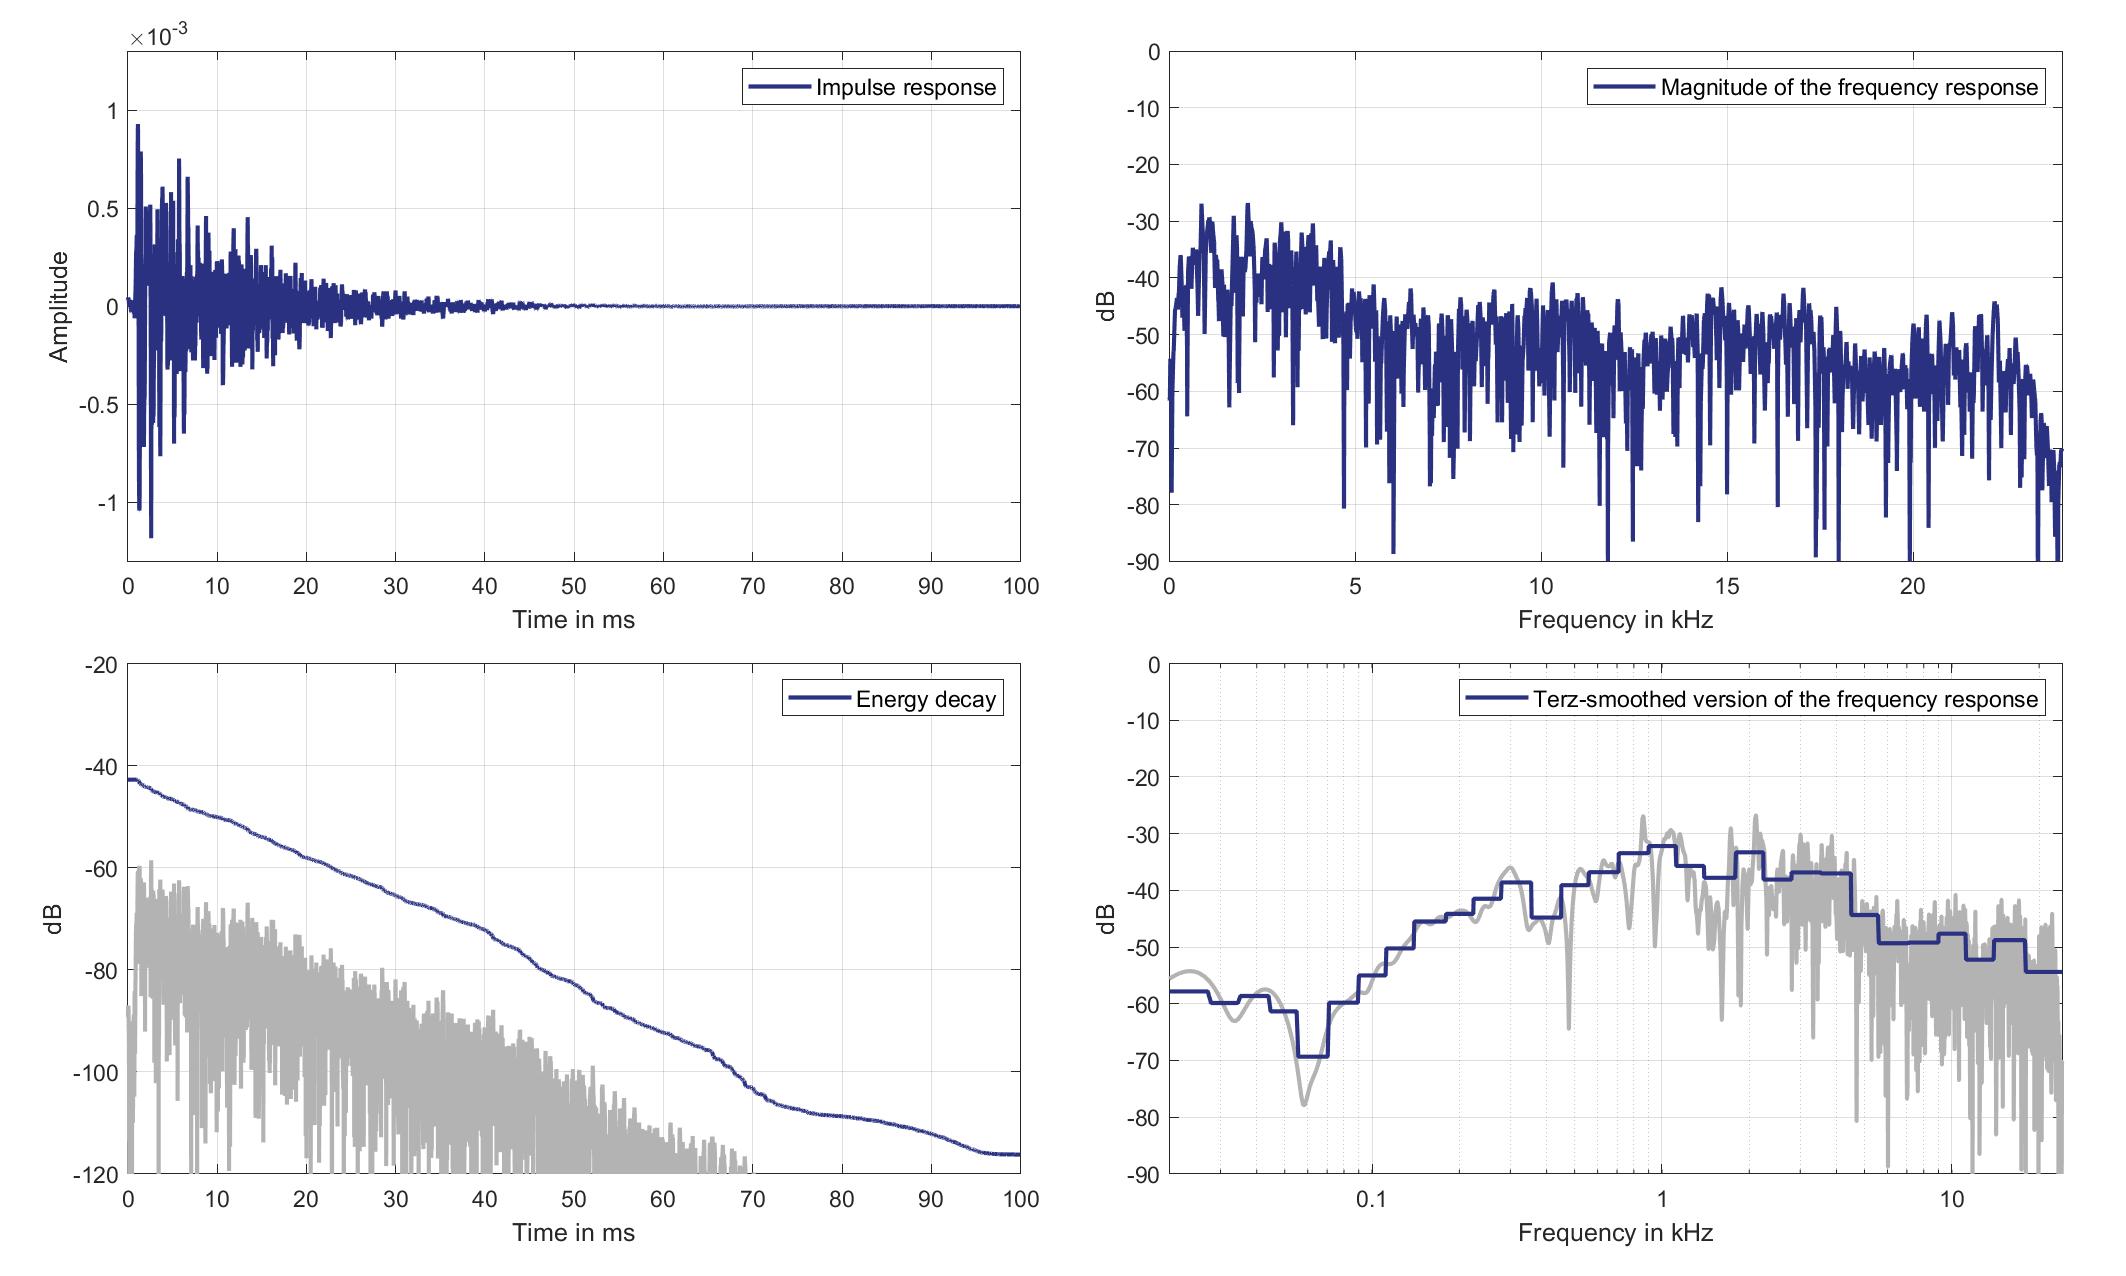
Download impulse response (in ".fir" format).
In the download section you can download all impulse response files as well as format explanation and Matlab as well as Python code examples for loading fir files.
Right lsp. - Right ear mic.
Right Headrest Loudspeaker of Zone 5 (Lsp. 7 to Right Ear Microphone of Zone 5 (Mic. 26)
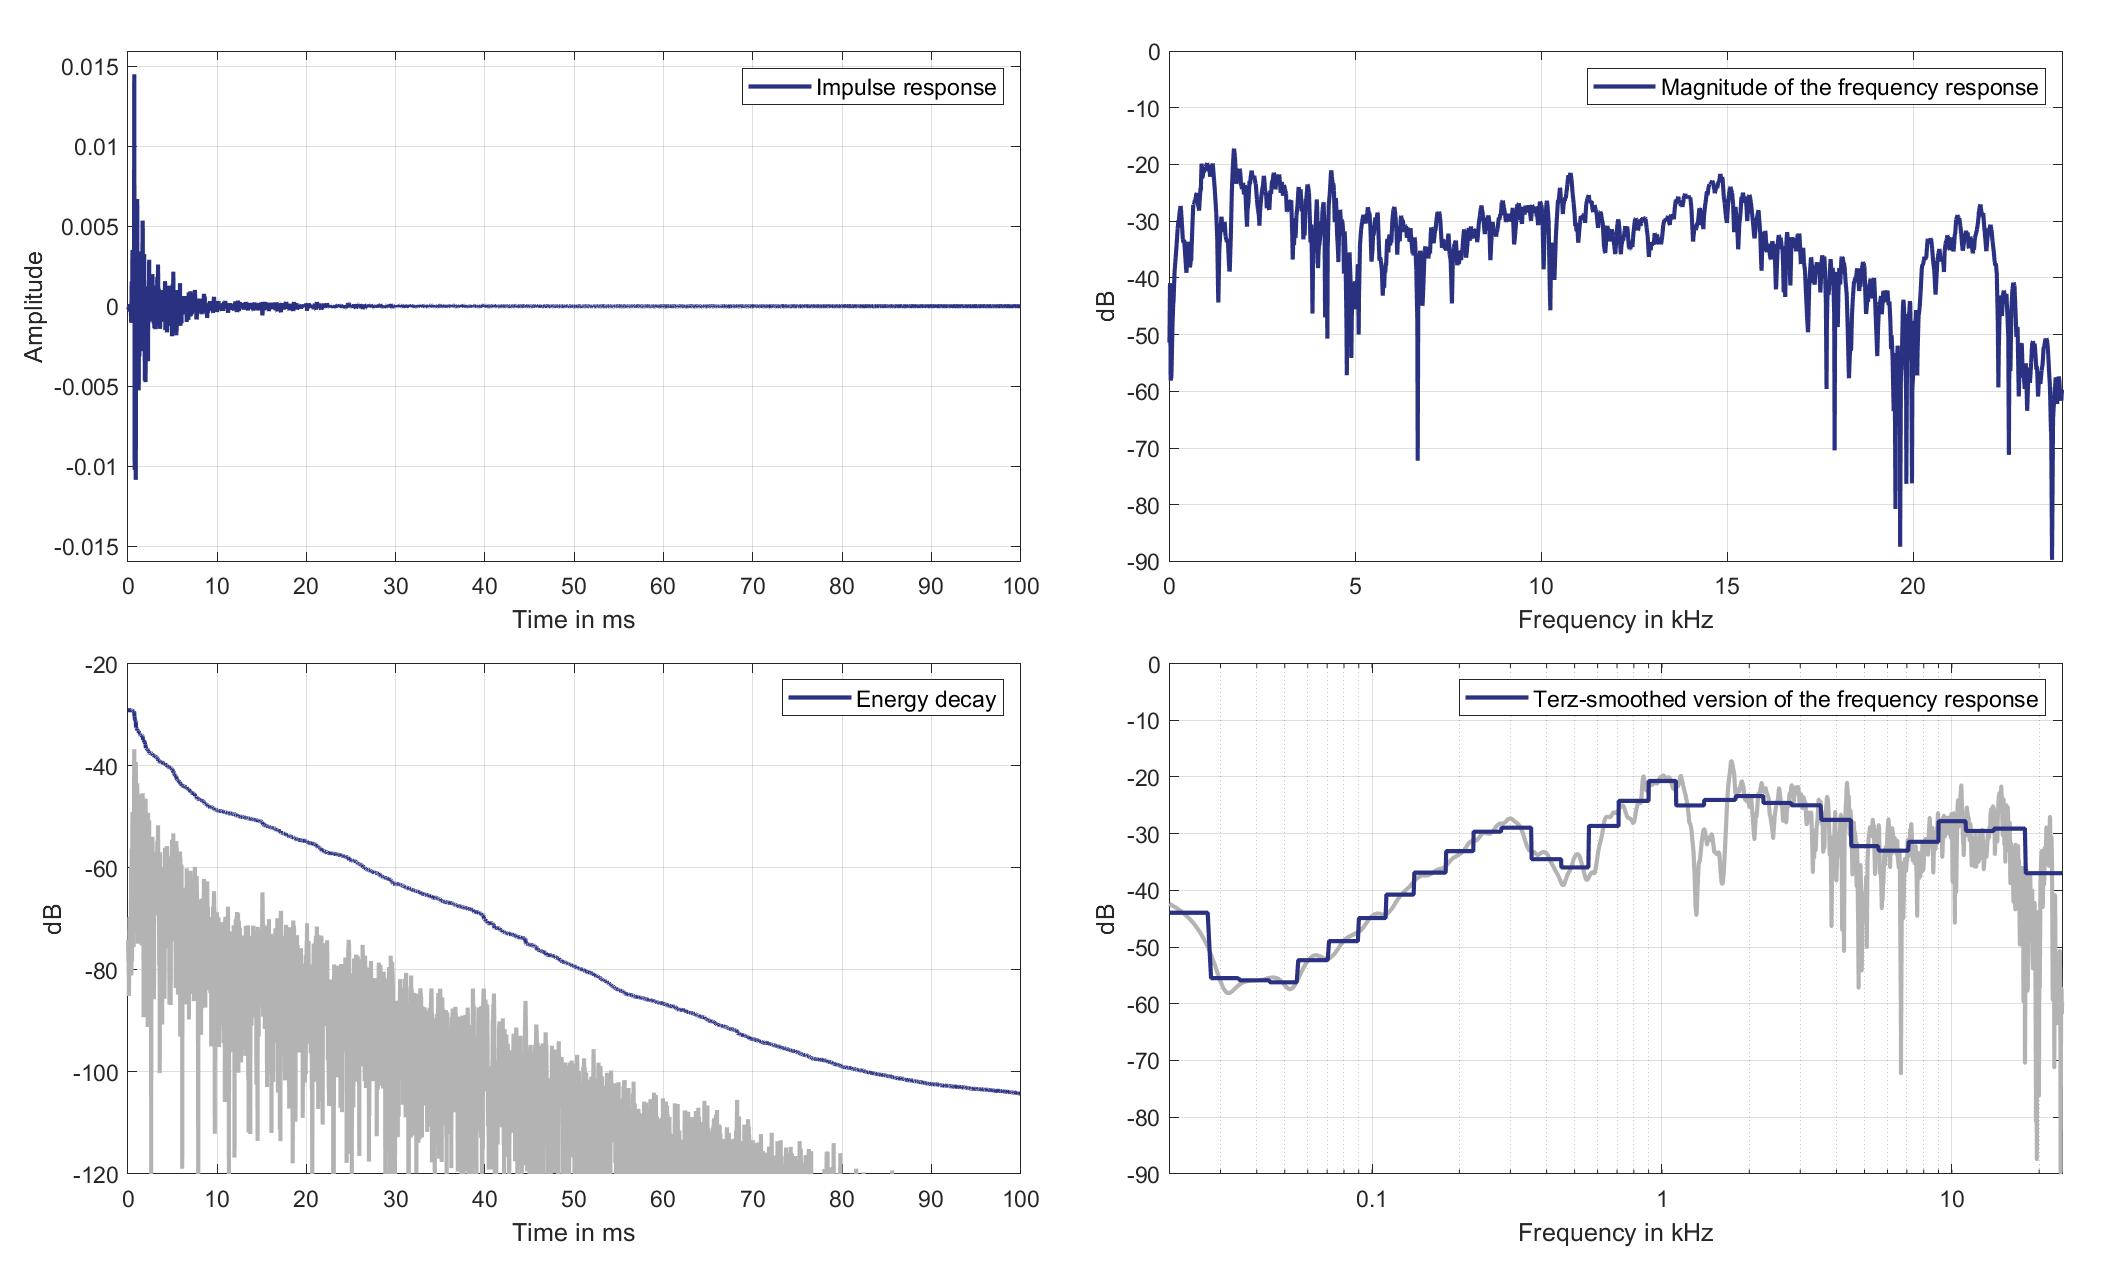
Download impulse response (in ".fir" format).
In the download section you can download all impulse response files as well as format explanation and Matlab as well as Python code examples for loading fir files.
Mics. 27/28
Left lsp. - left ear mic.
Left Headrest Loudspeaker of Zone 5 (Lsp. 6) to Left Ear Microphone of Zone 6 (Mic. 27)
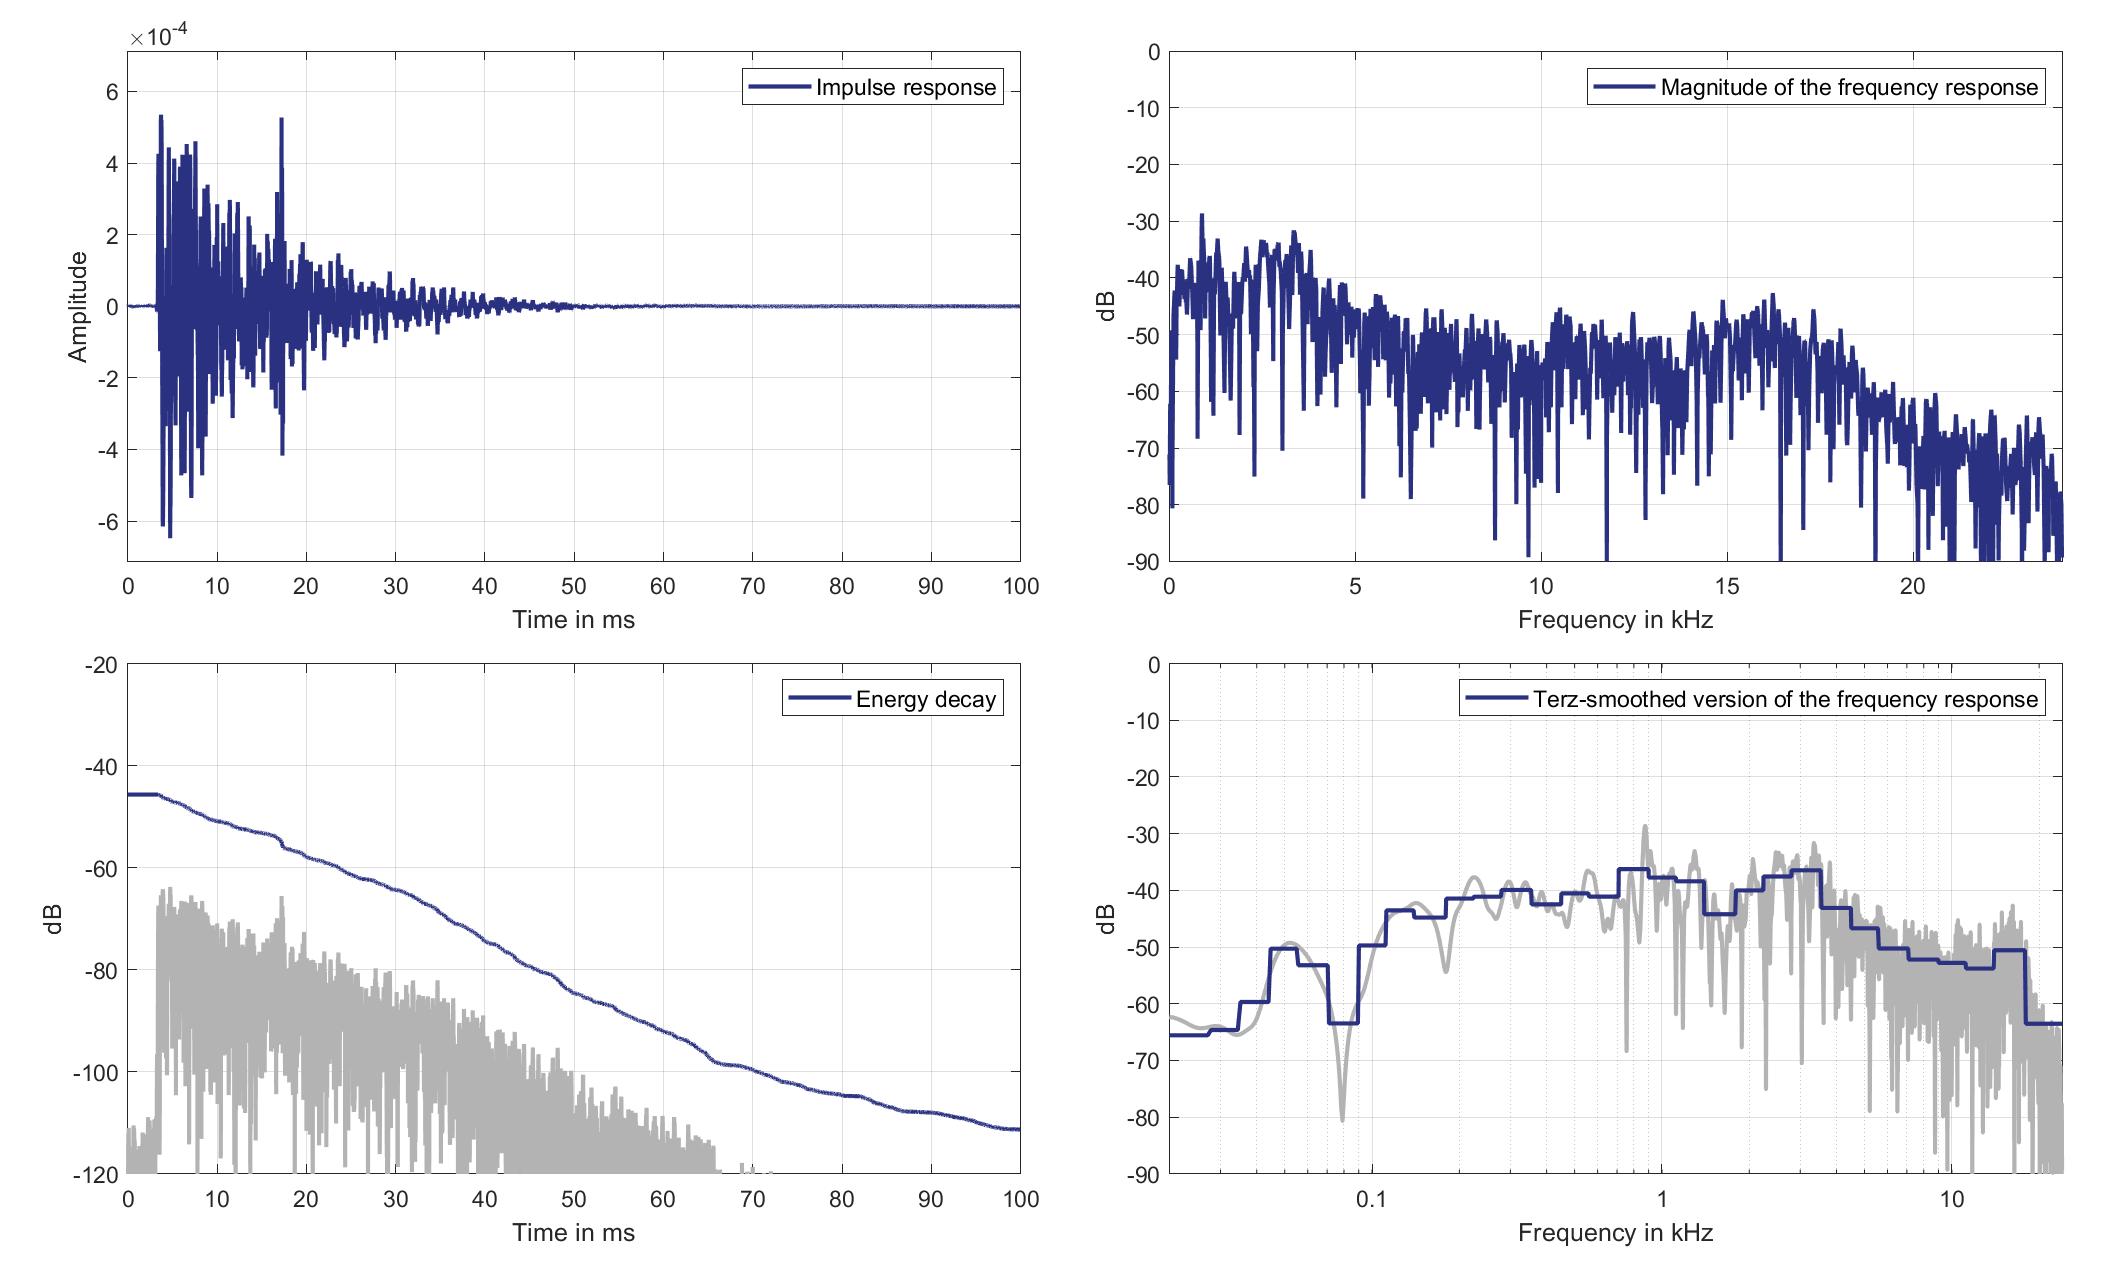
Download impulse response (in ".fir" format).
In the download section you can download all impulse response files as well as format explanation and Matlab as well as Python code examples for loading fir files.
Left lsp. - Right ear mic.
Left Headrest Loudspeaker of Zone 5 (Lsp. 6) to Right Ear Microphone of Zone 6 (Mic. 28)
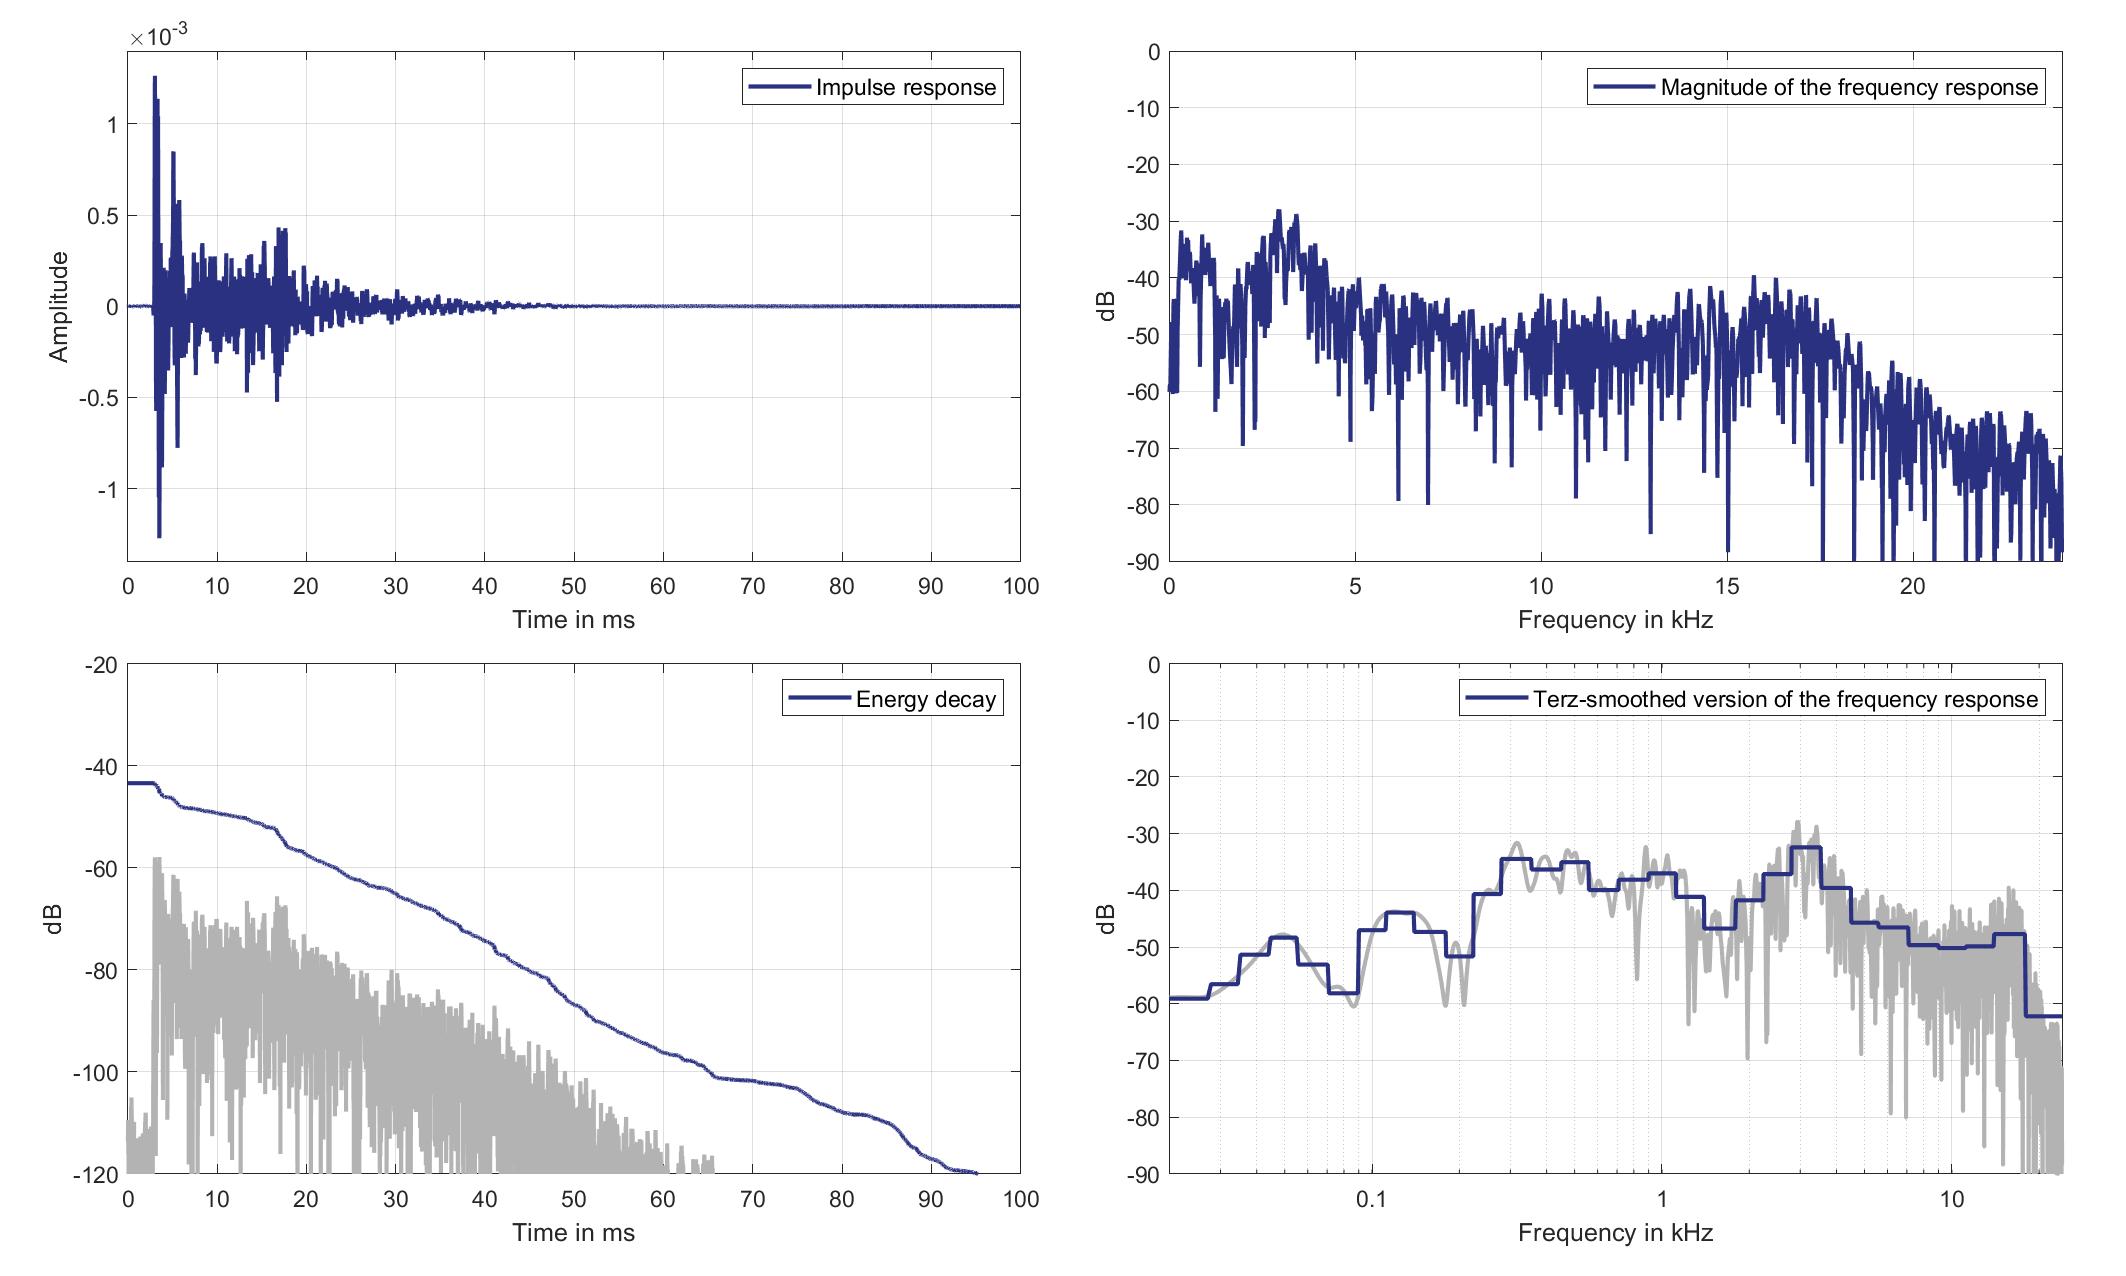
Download impulse response (in ".fir" format).
In the download section you can download all impulse response files as well as format explanation and Matlab as well as Python code examples for loading fir files.
Right lsp. - left ear mic.
Right Headrest Loudspeaker of Zone 5 (Lsp. 7) to Left Ear Microphone of Zone 6 (Mic. 27)
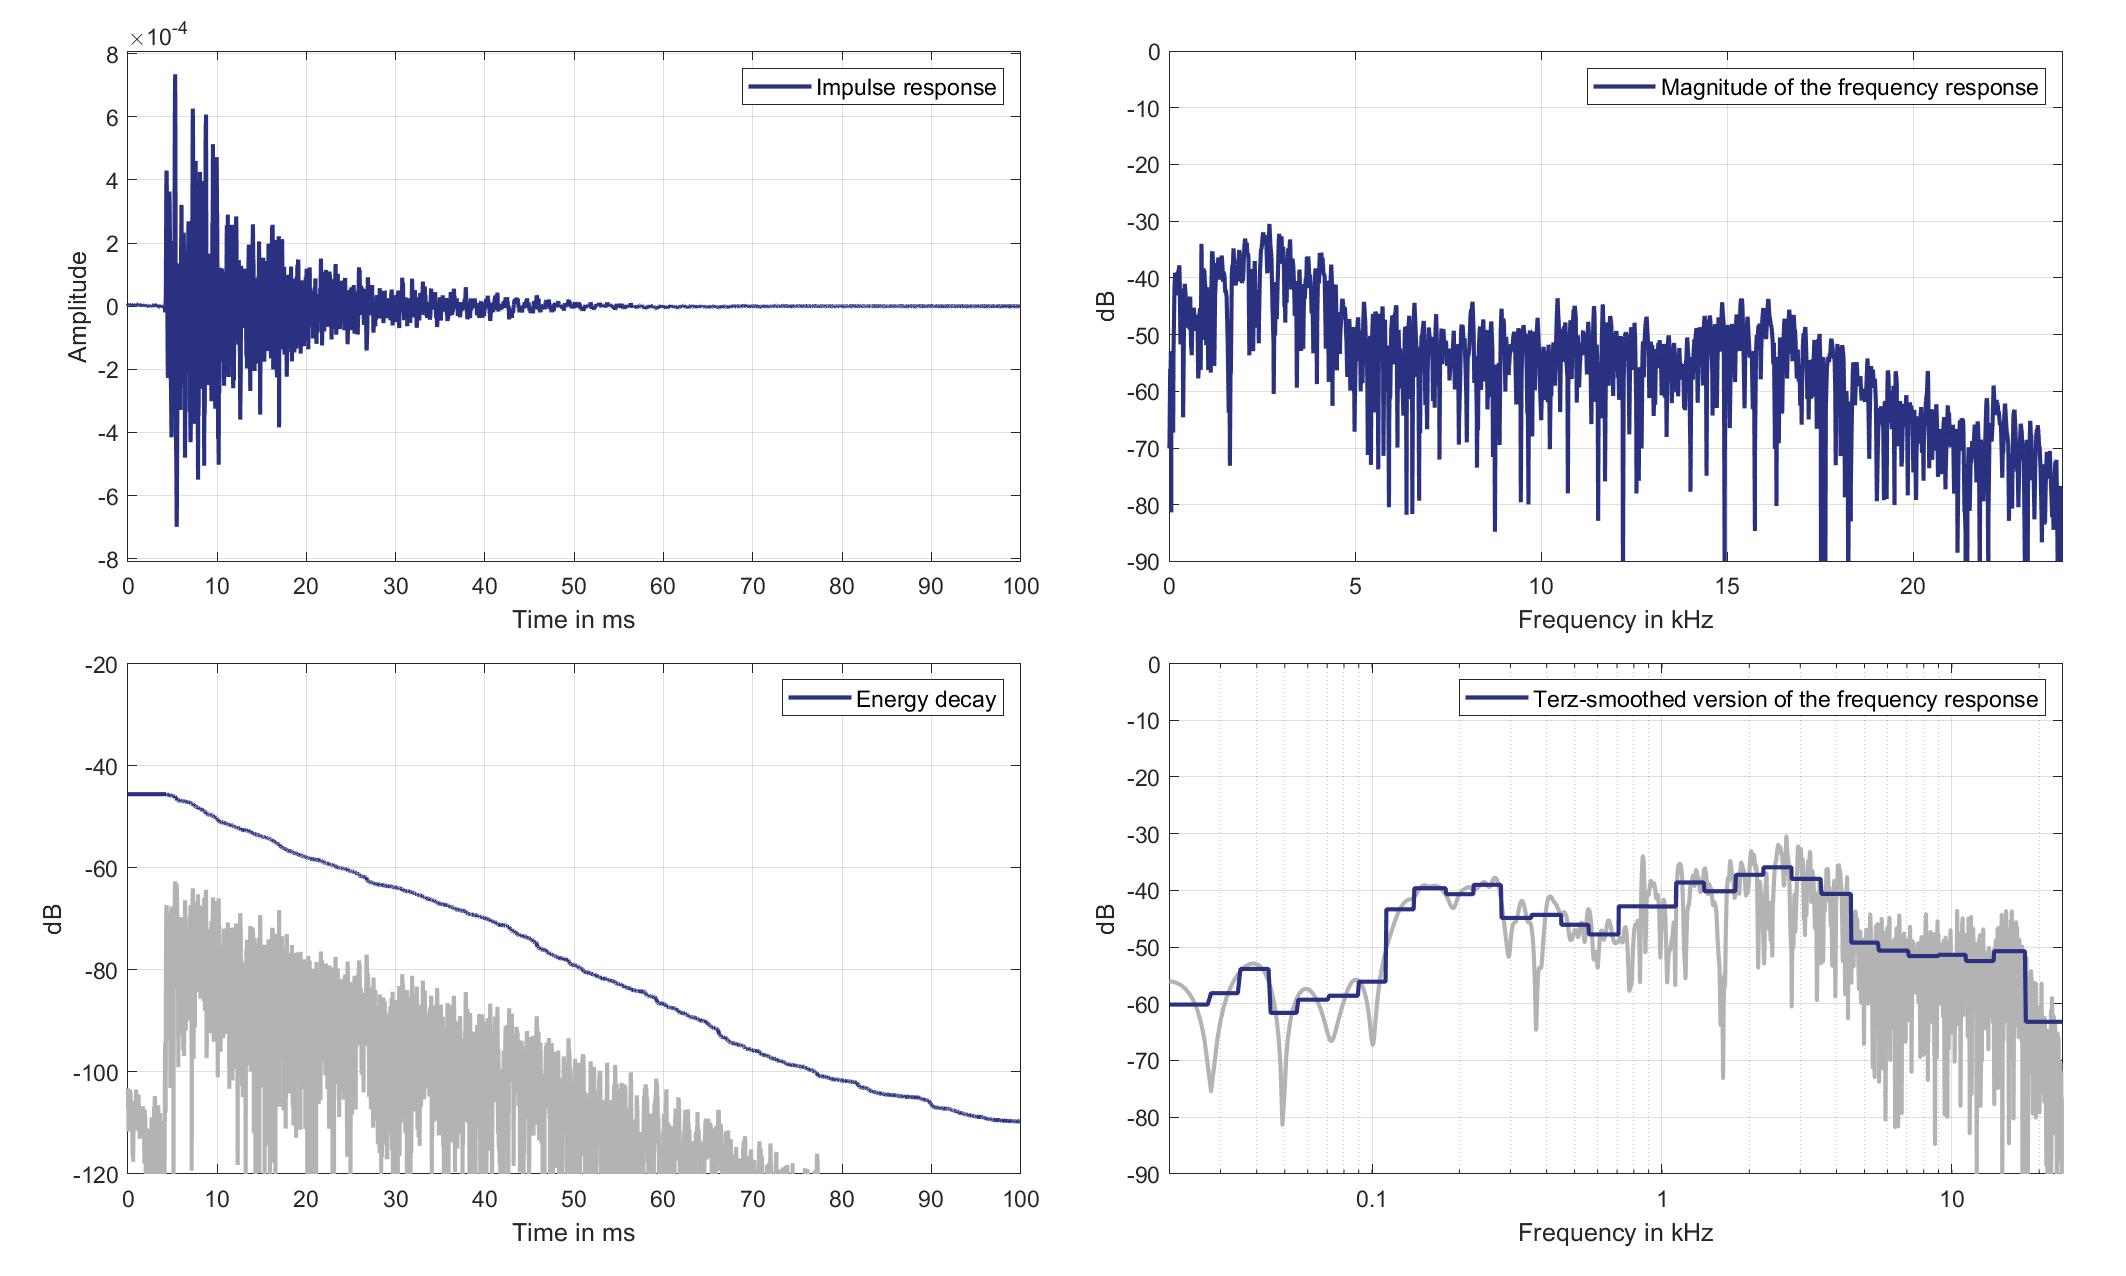
Download impulse response (in ".fir" format).
In the download section you can download all impulse response files as well as format explanation and Matlab as well as Python code examples for loading fir files.
Right lsp. - Right ear mic.
Right Headrest Loudspeaker of Zone 5 (Lsp. 7 to Right Ear Microphone of Zone 6 (Mic. 28)
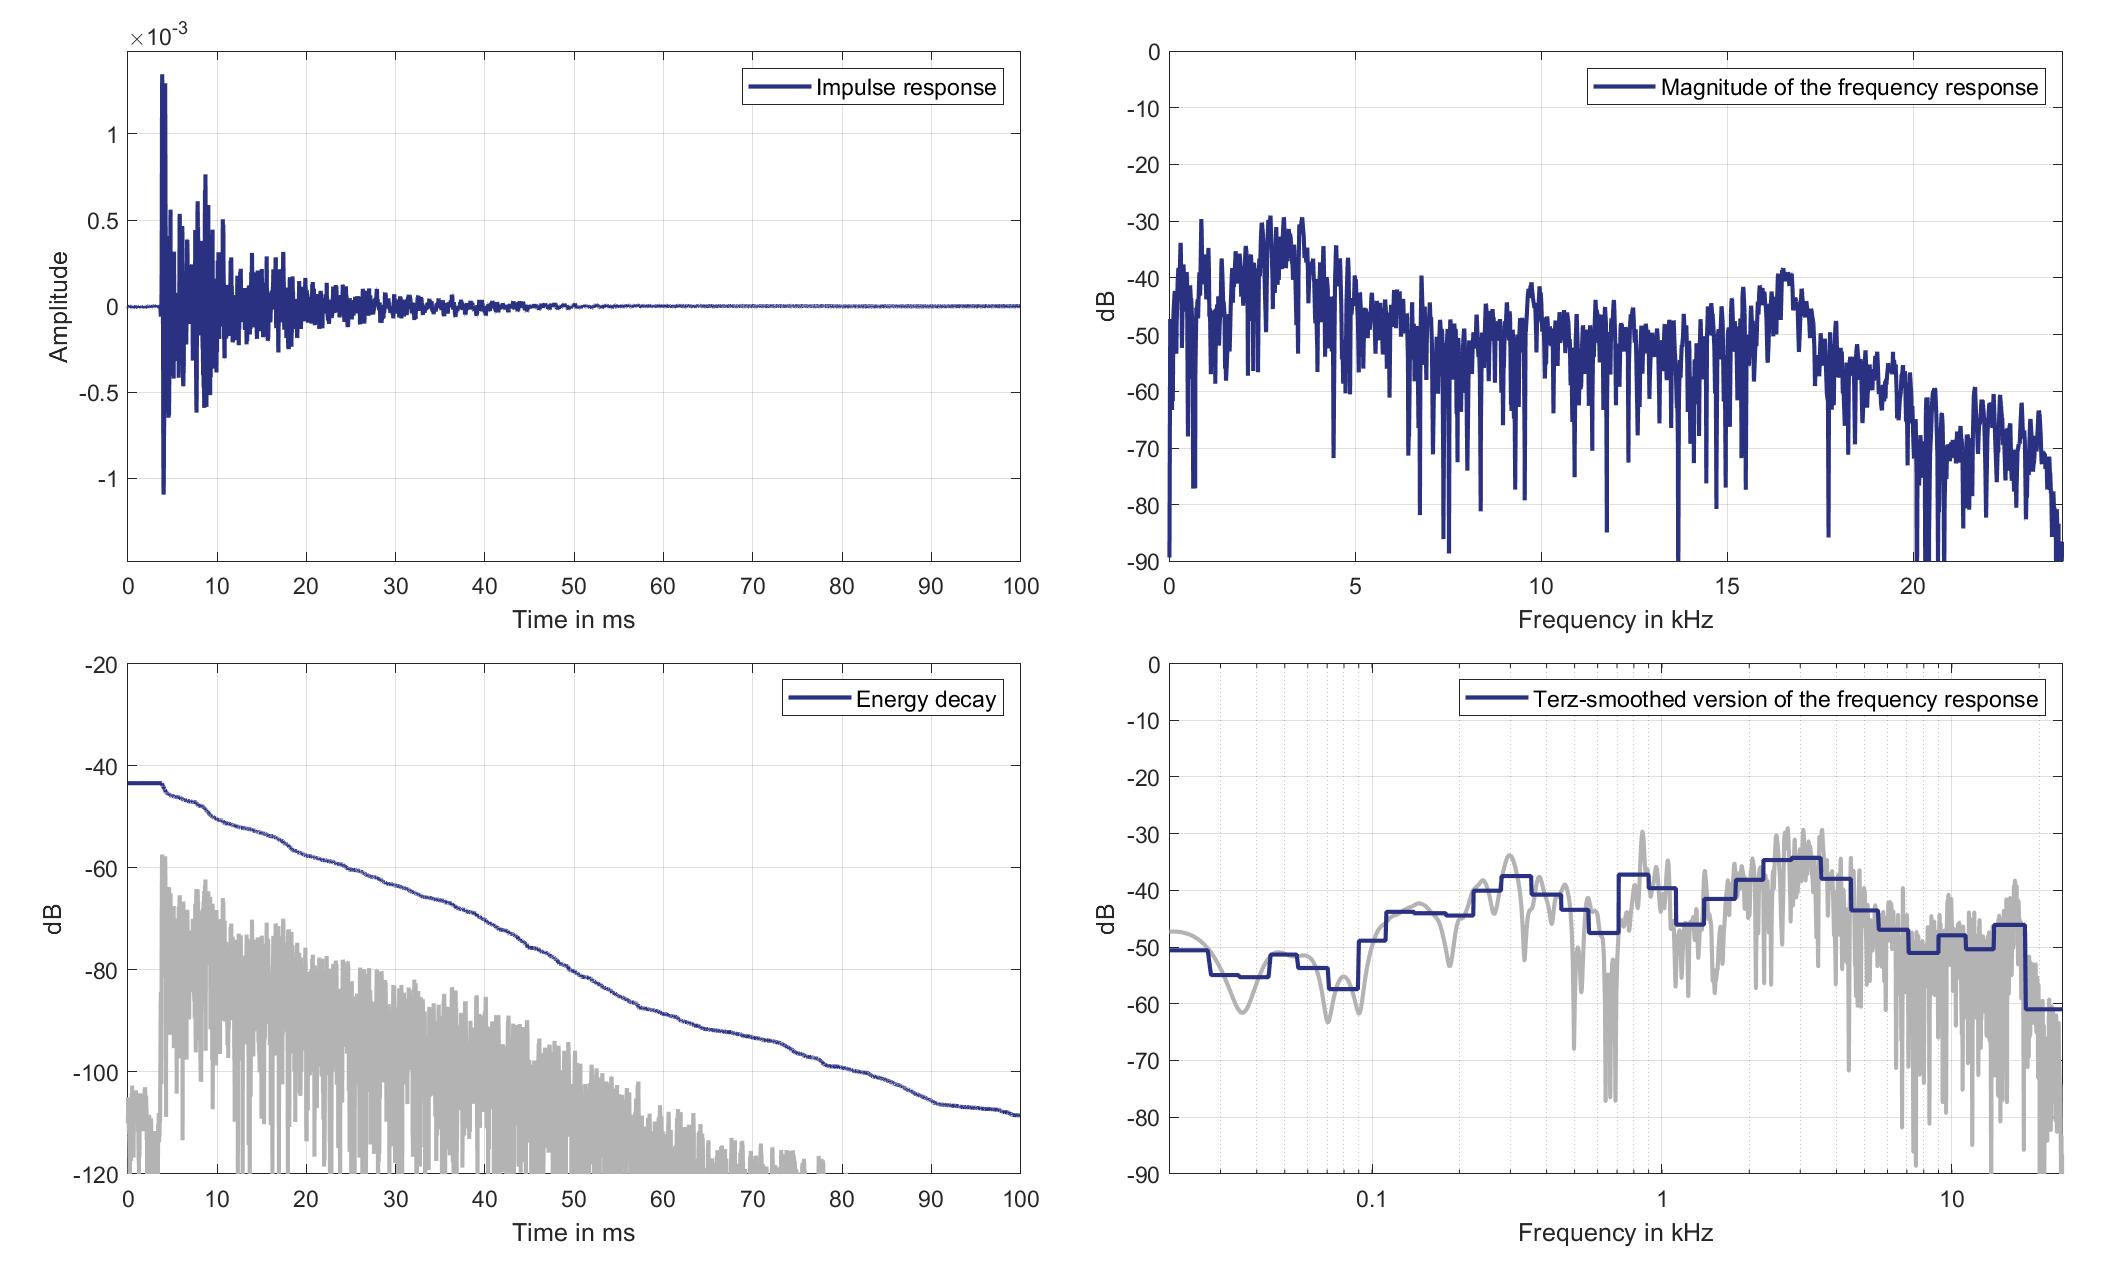
Download impulse response (in ".fir" format).
In the download section you can download all impulse response files as well as format explanation and Matlab as well as Python code examples for loading fir files.
Mics. 29/30
Left lsp. - left ear mic.
Left Headrest Loudspeaker of Zone 5 (Lsp. 6) to Left Ear Microphone of Zone 8 (Mic. 29)
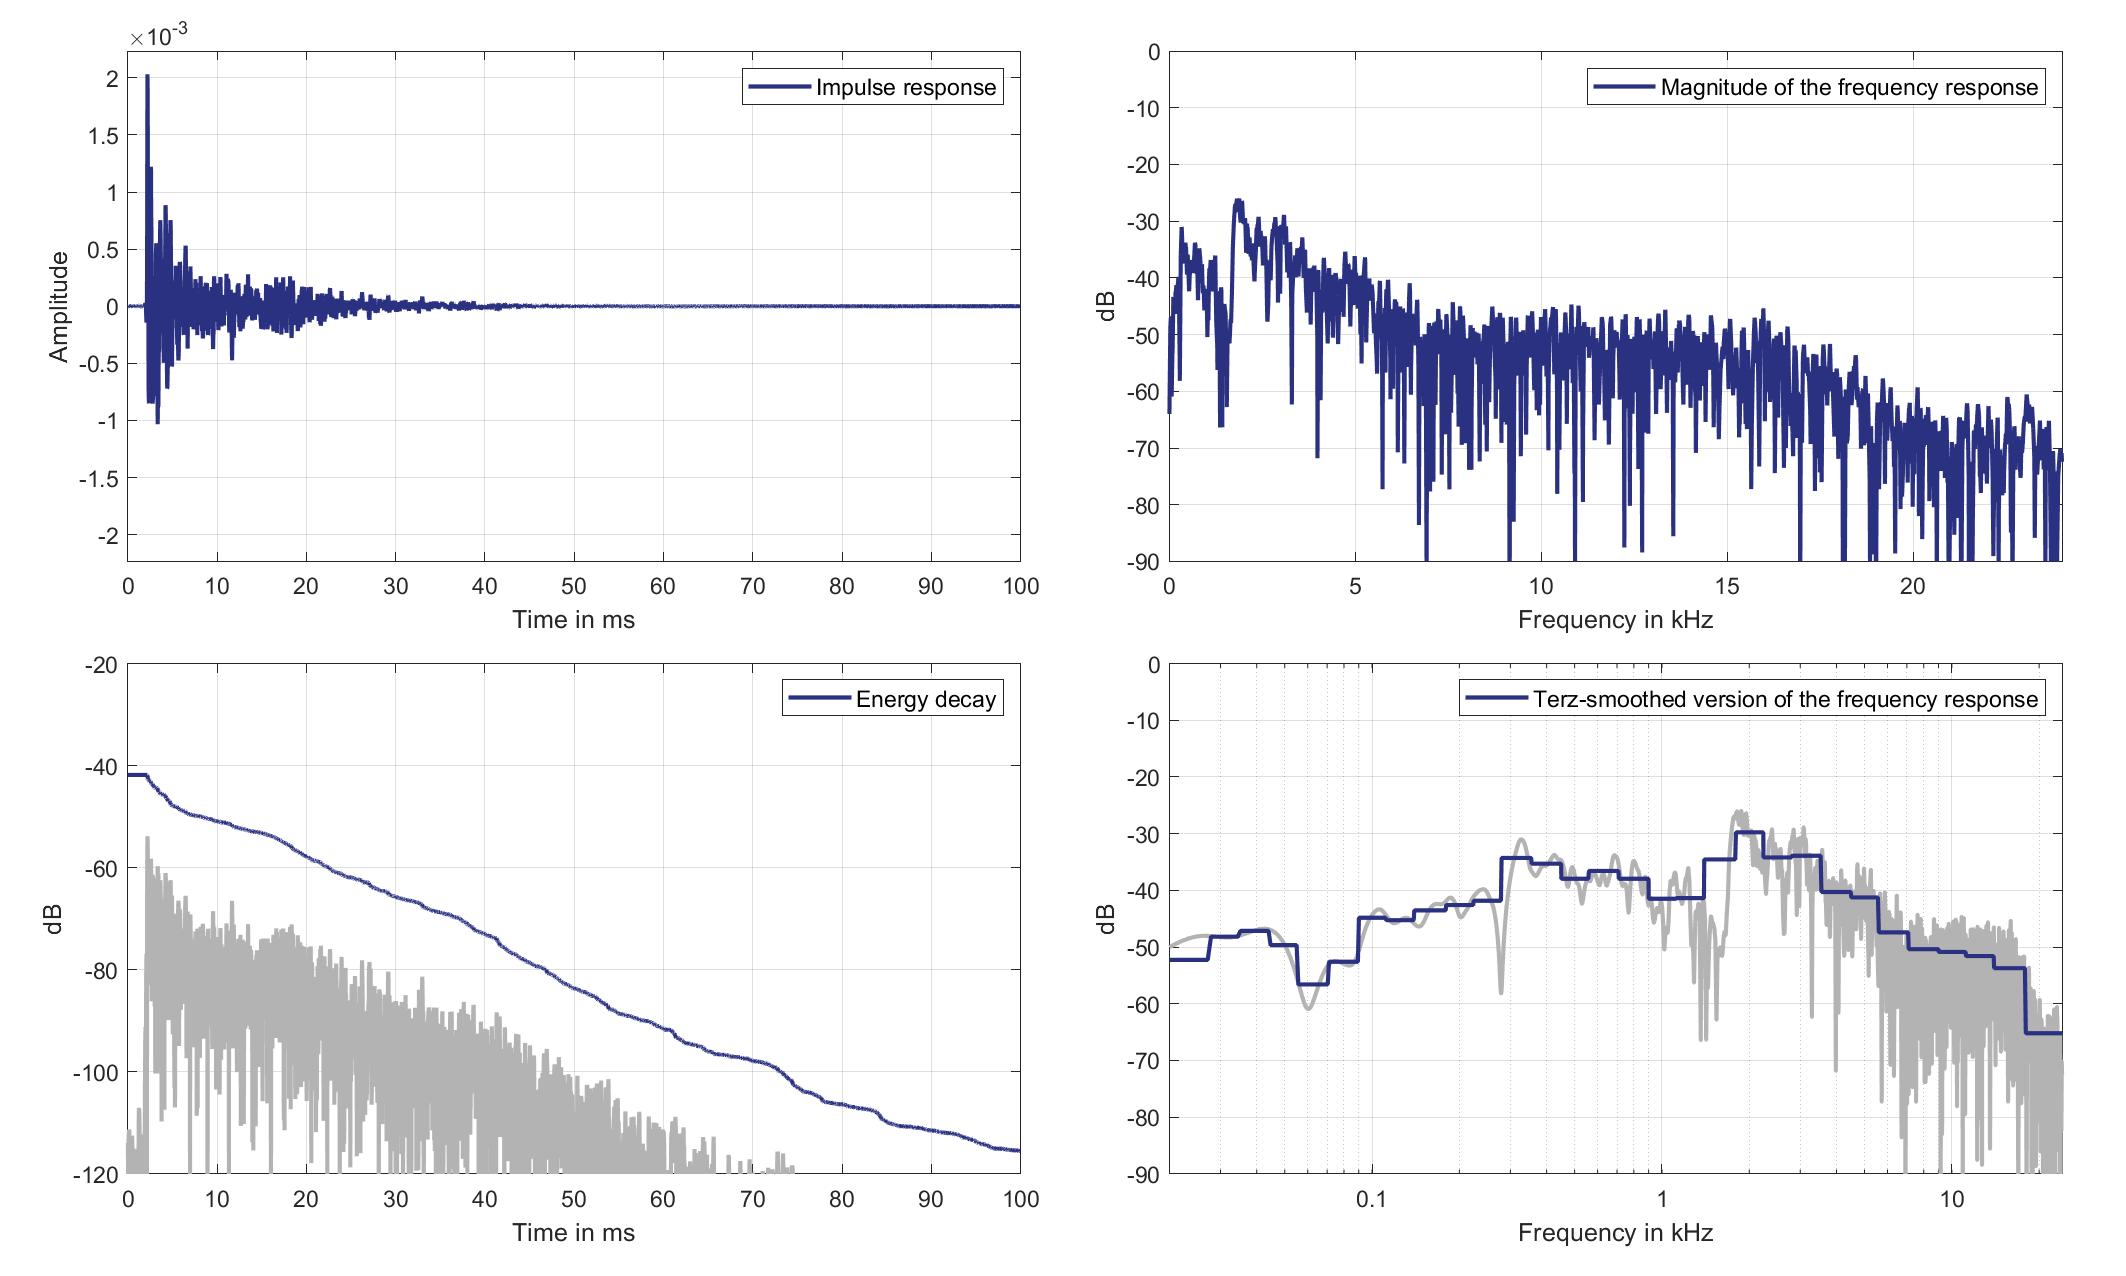
Download impulse response (in ".fir" format).
In the download section you can download all impulse response files as well as format explanation and Matlab as well as Python code examples for loading fir files.
Left lsp. - Right ear mic.
Left Headrest Loudspeaker of Zone 5 (Lsp. 6) to Right Ear Microphone of Zone 8 (Mic. 30)
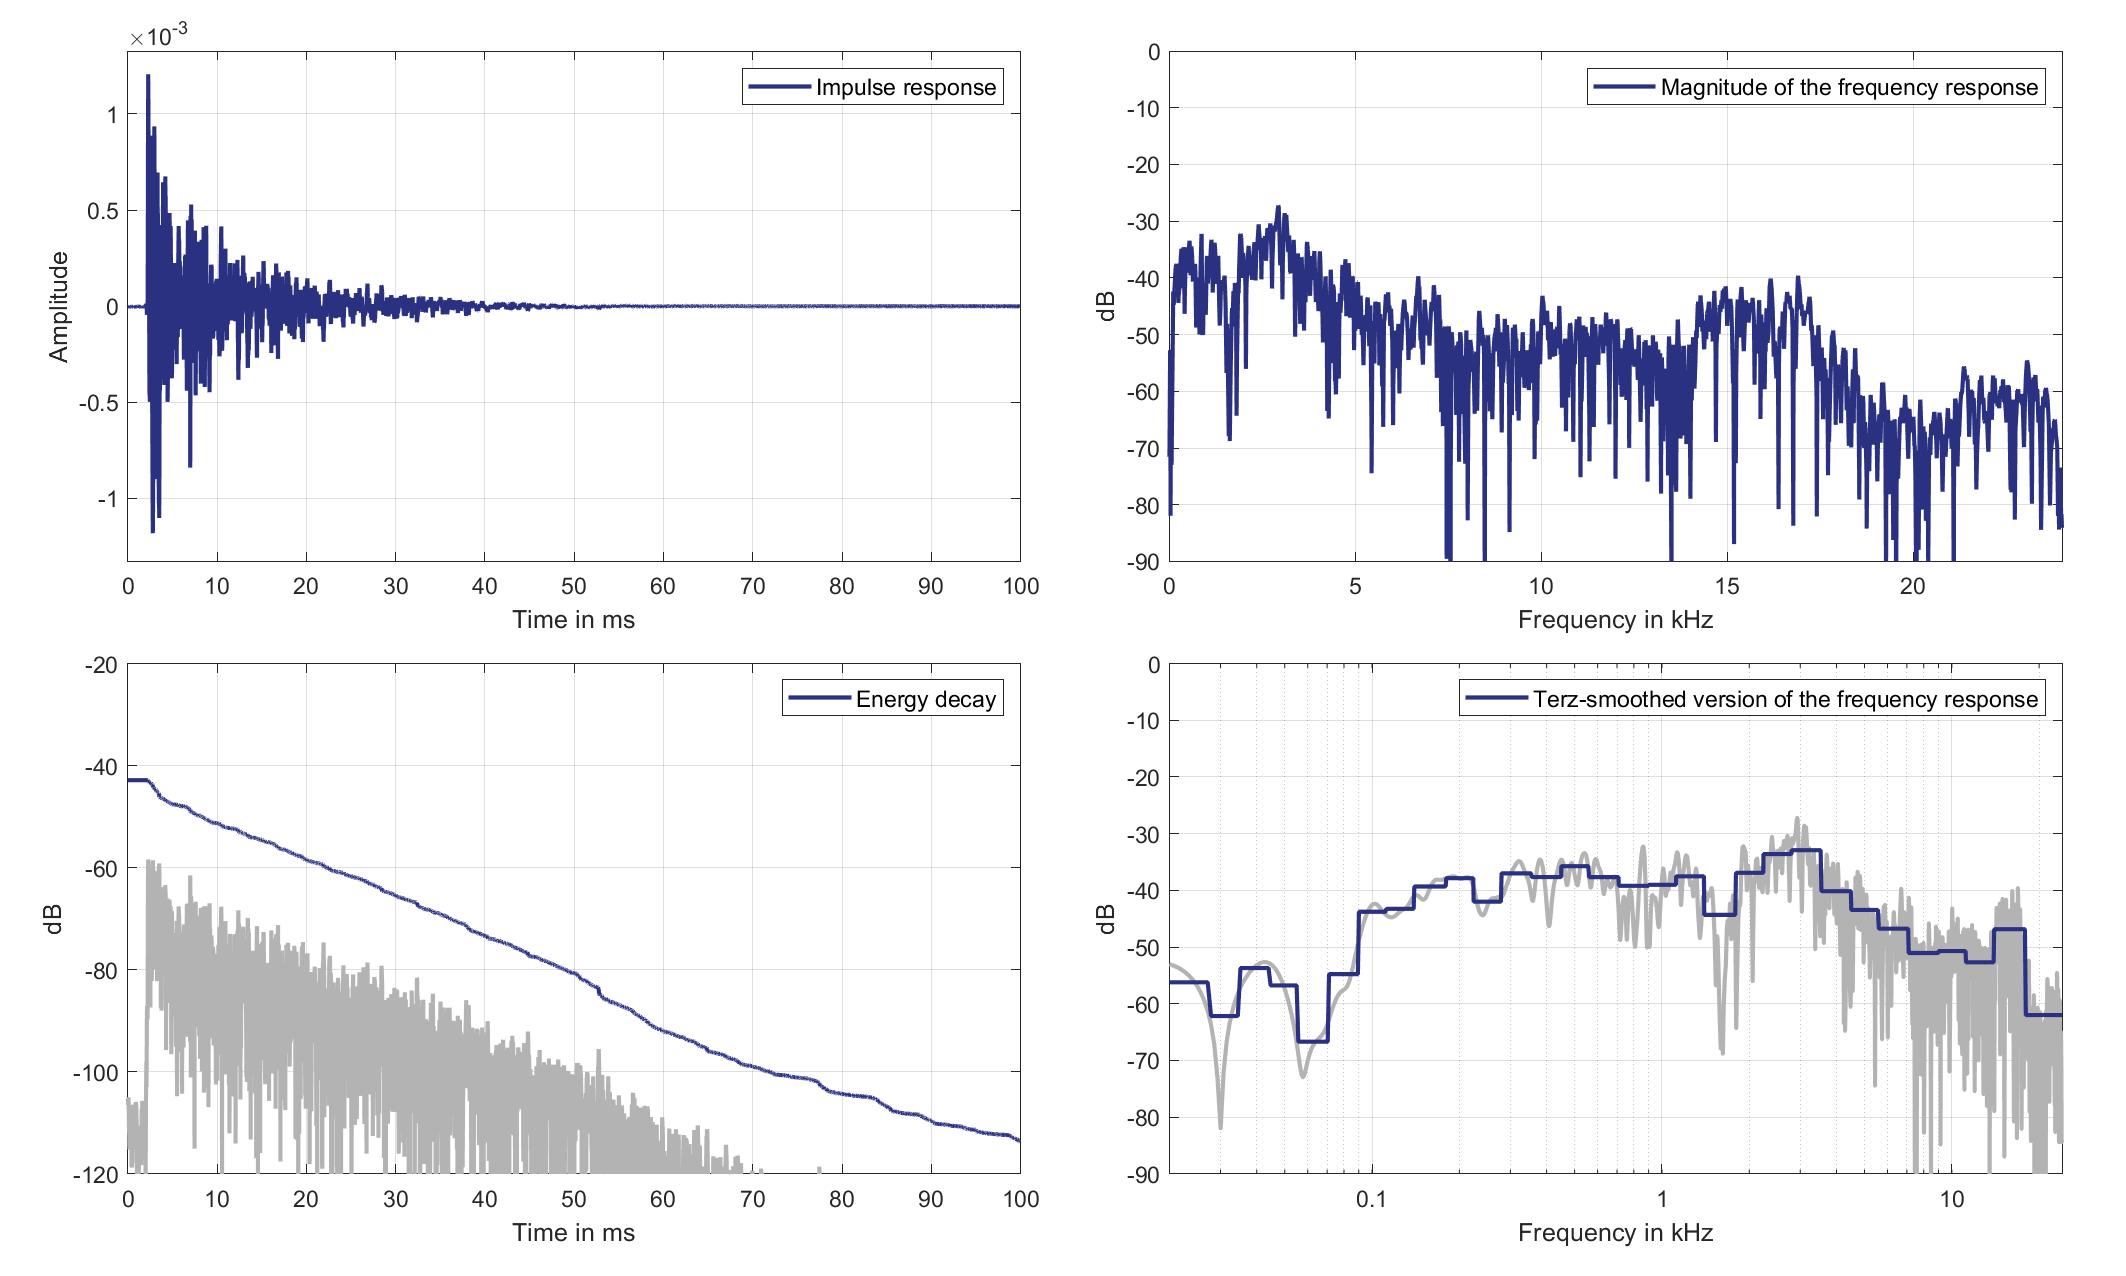
Download impulse response (in ".fir" format).
In the download section you can download all impulse response files as well as format explanation and Matlab as well as Python code examples for loading fir files.
Right lsp. - left ear mic.
Right Headrest Loudspeaker of Zone 5 (Lsp. 7) to Left Ear Microphone of Zone 8 (Mic. 29)
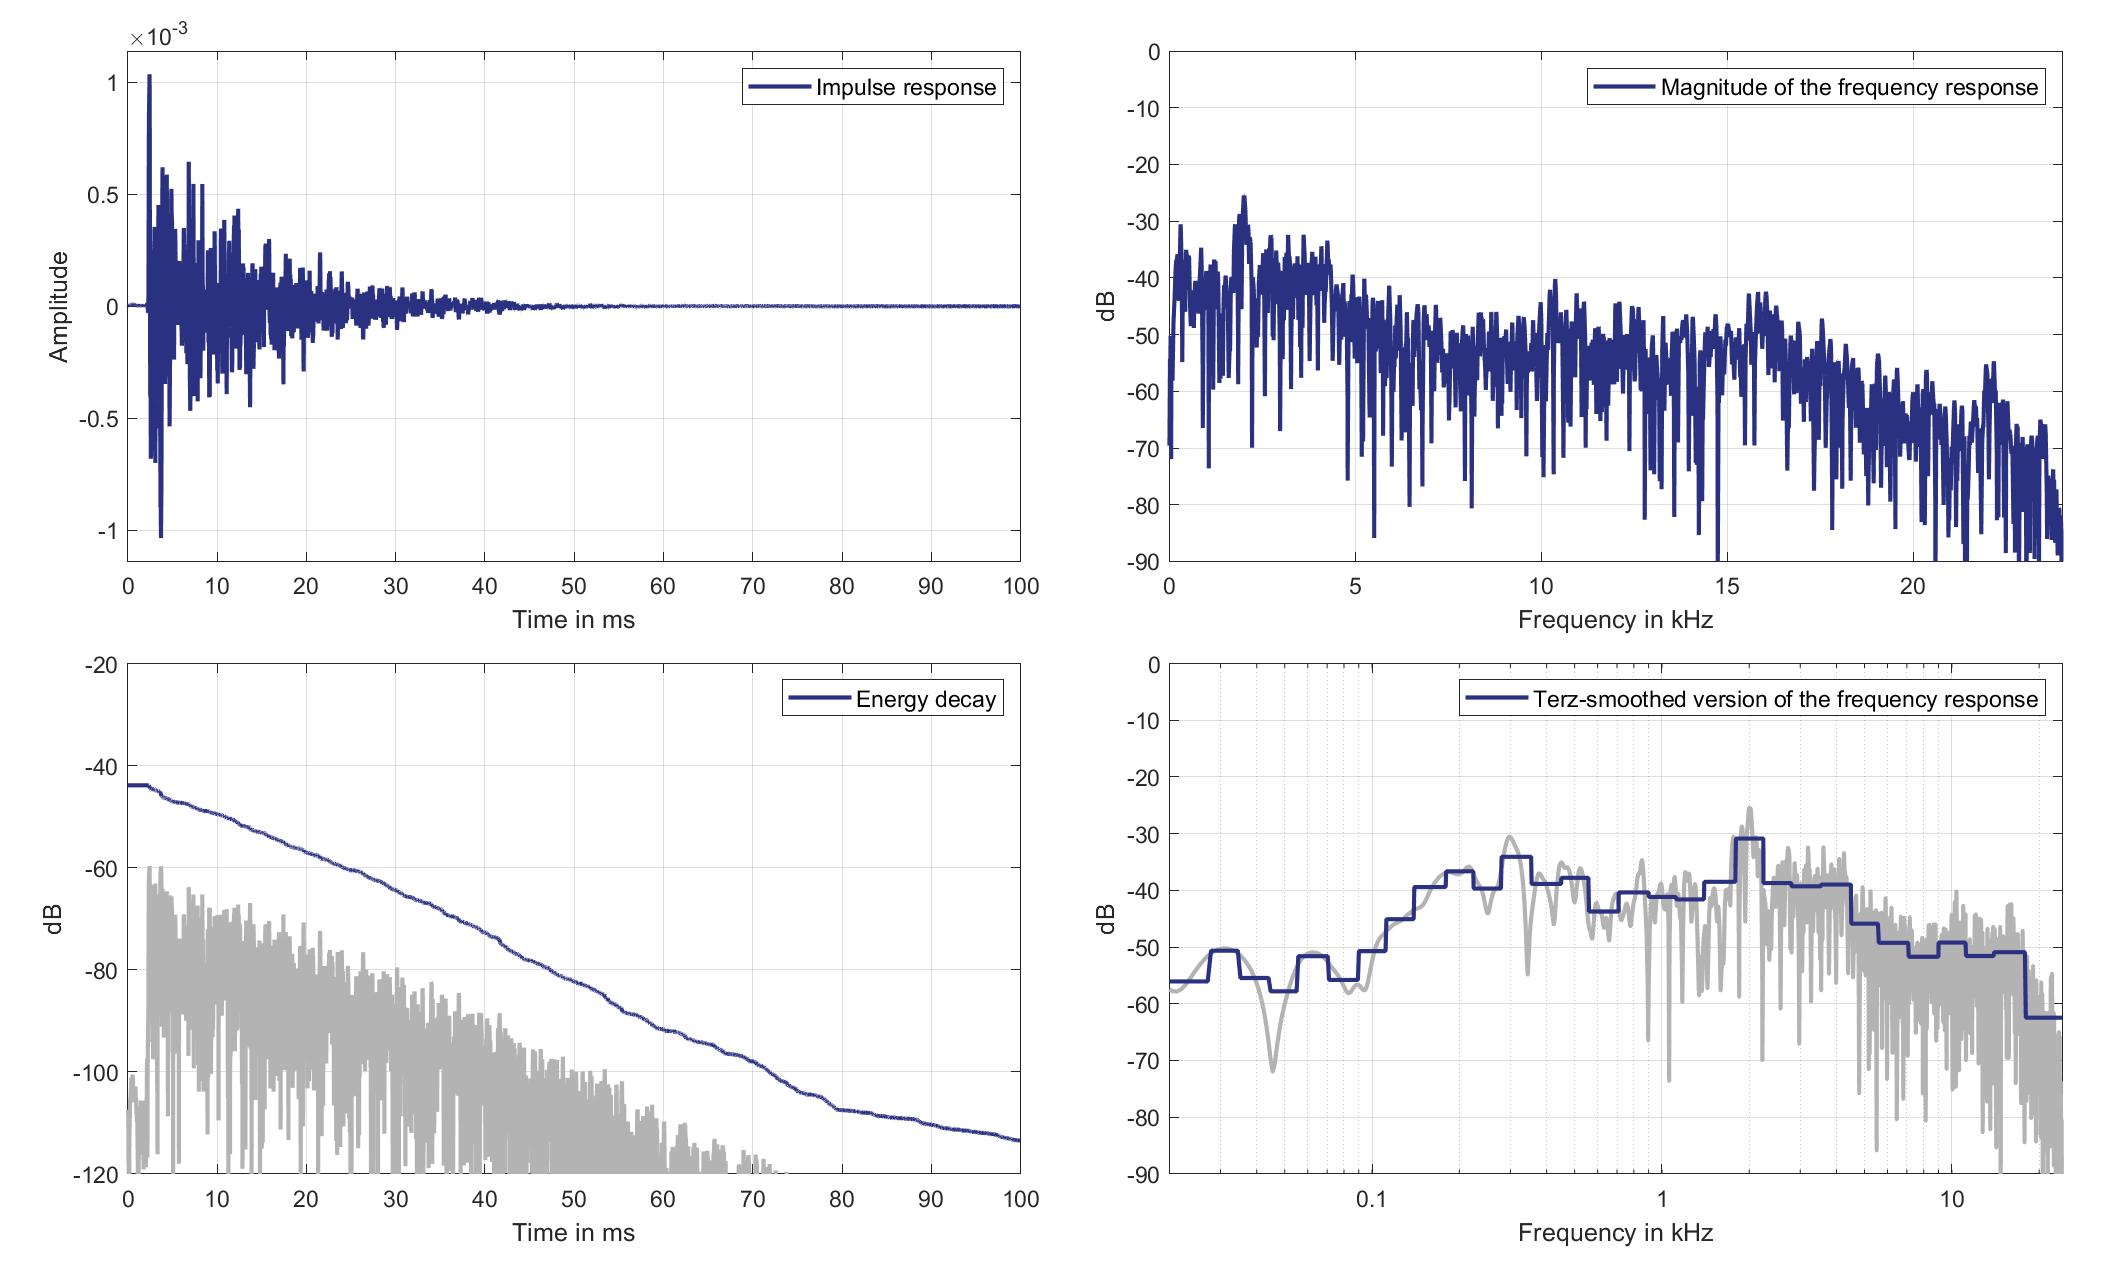
Download impulse response (in ".fir" format).
In the download section you can download all impulse response files as well as format explanation and Matlab as well as Python code examples for loading fir files.
Right lsp. - Right ear mic.
Right Headrest Loudspeaker of Zone 5 (Lsp. 7 to Right Ear Microphone of Zone 8 (Mic. 30)
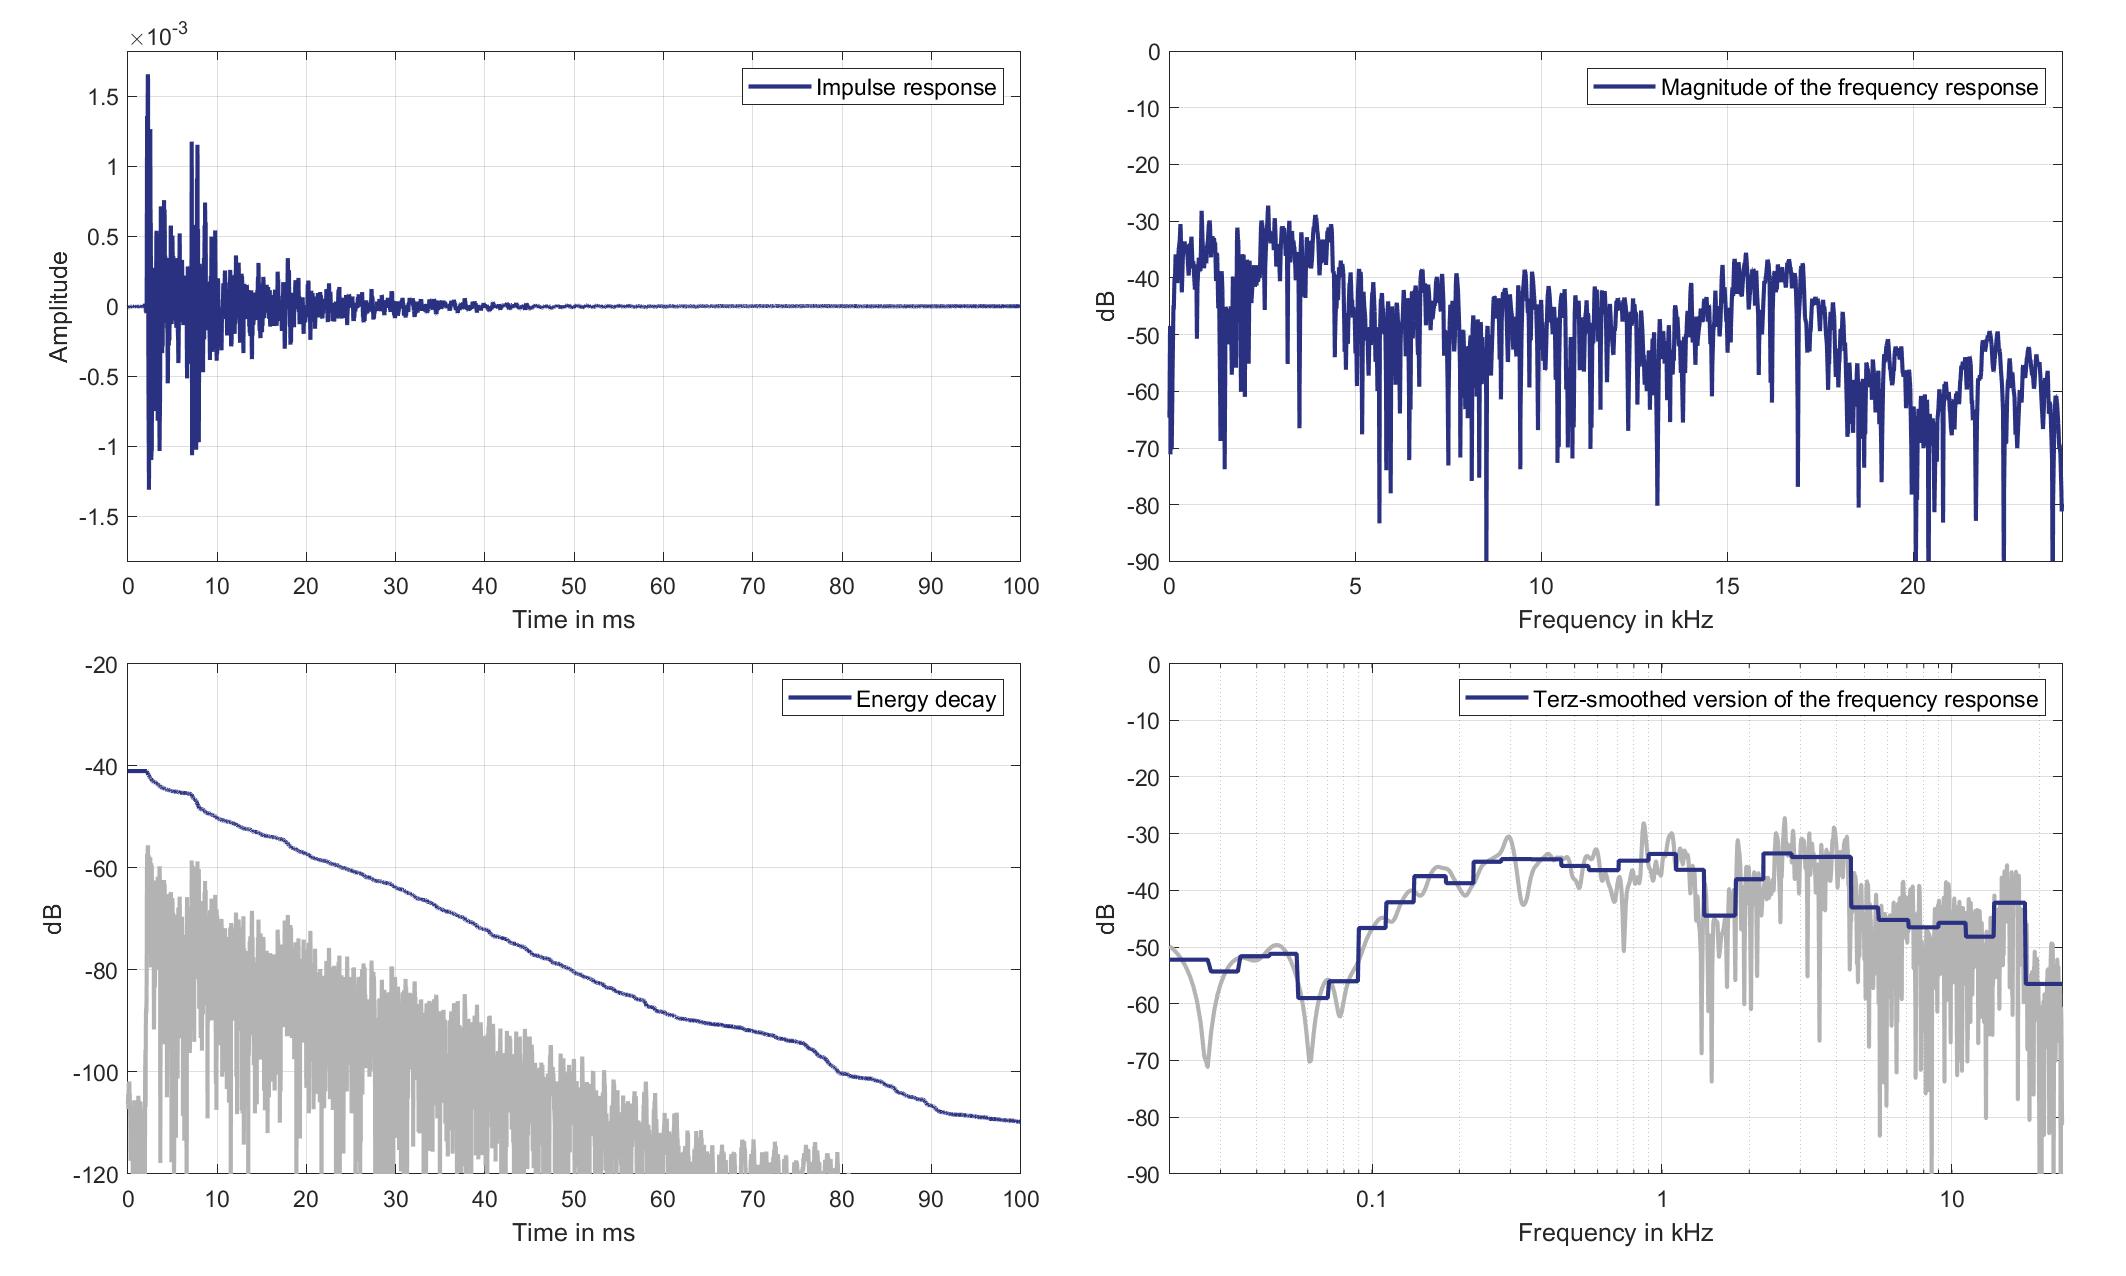
Download impulse response (in ".fir" format).
In the download section you can download all impulse response files as well as format explanation and Matlab as well as Python code examples for loading fir files.
Lsps. 8/9
Mics. 19/20
Left lsp. - left ear mic.
Left Headrest Loudspeaker of Zone 6 (Lsp. 8) to Left Ear Microphone of Zone 1 (Mic. 19)
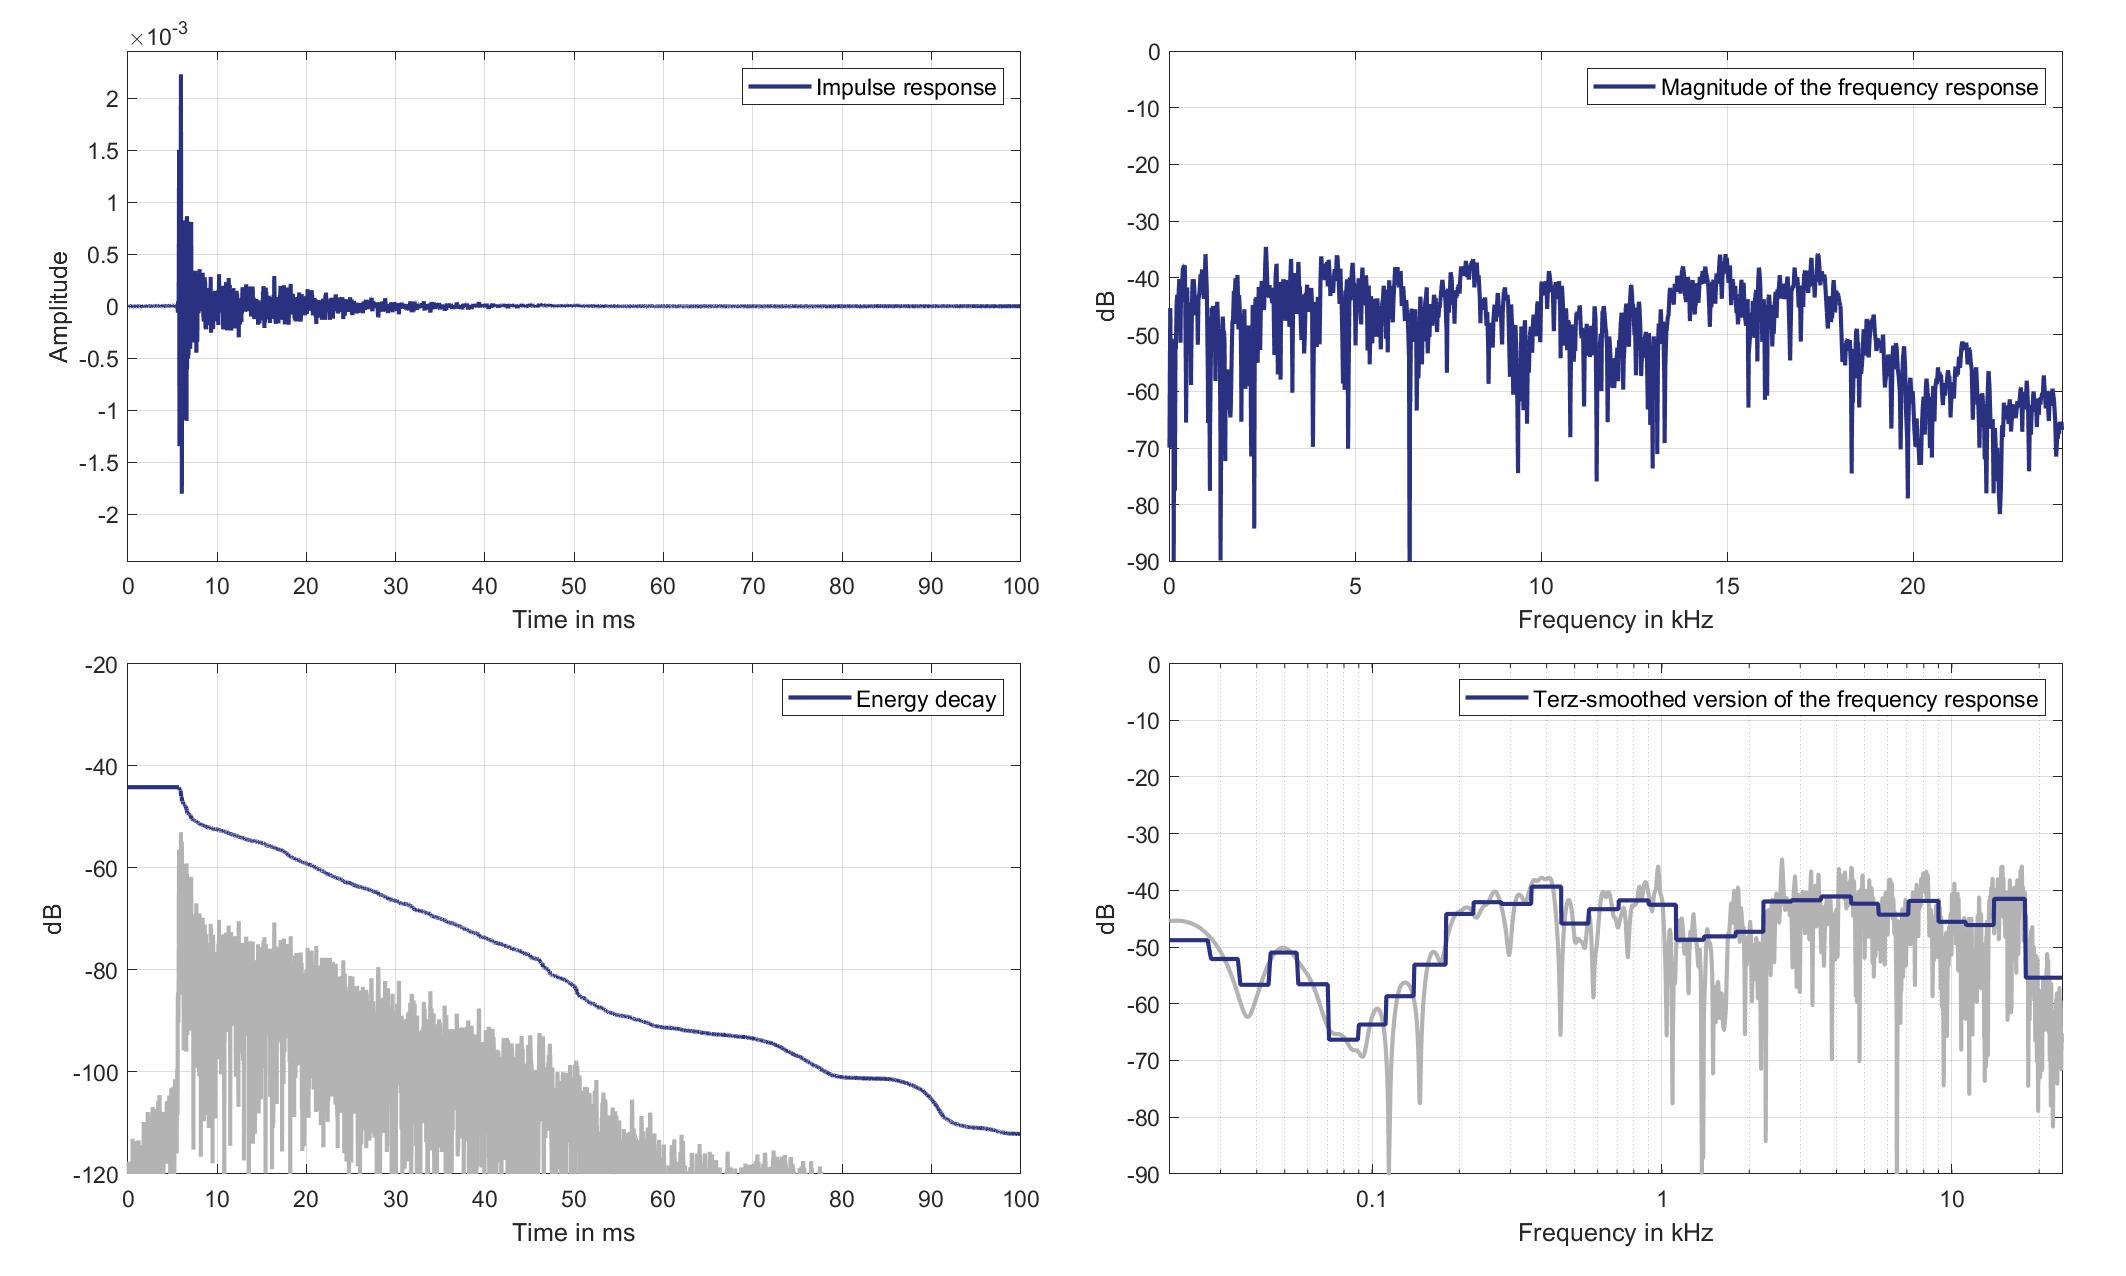
Download impulse response (in ".fir" format).
In the download section you can download all impulse response files as well as format explanation and Matlab as well as Python code examples for loading fir files.
Left lsp. - Right ear mic.
Left Headrest Loudspeaker of Zone 6 (Lsp. 8) to Right Ear Microphone of Zone 1 (Mic. 20)
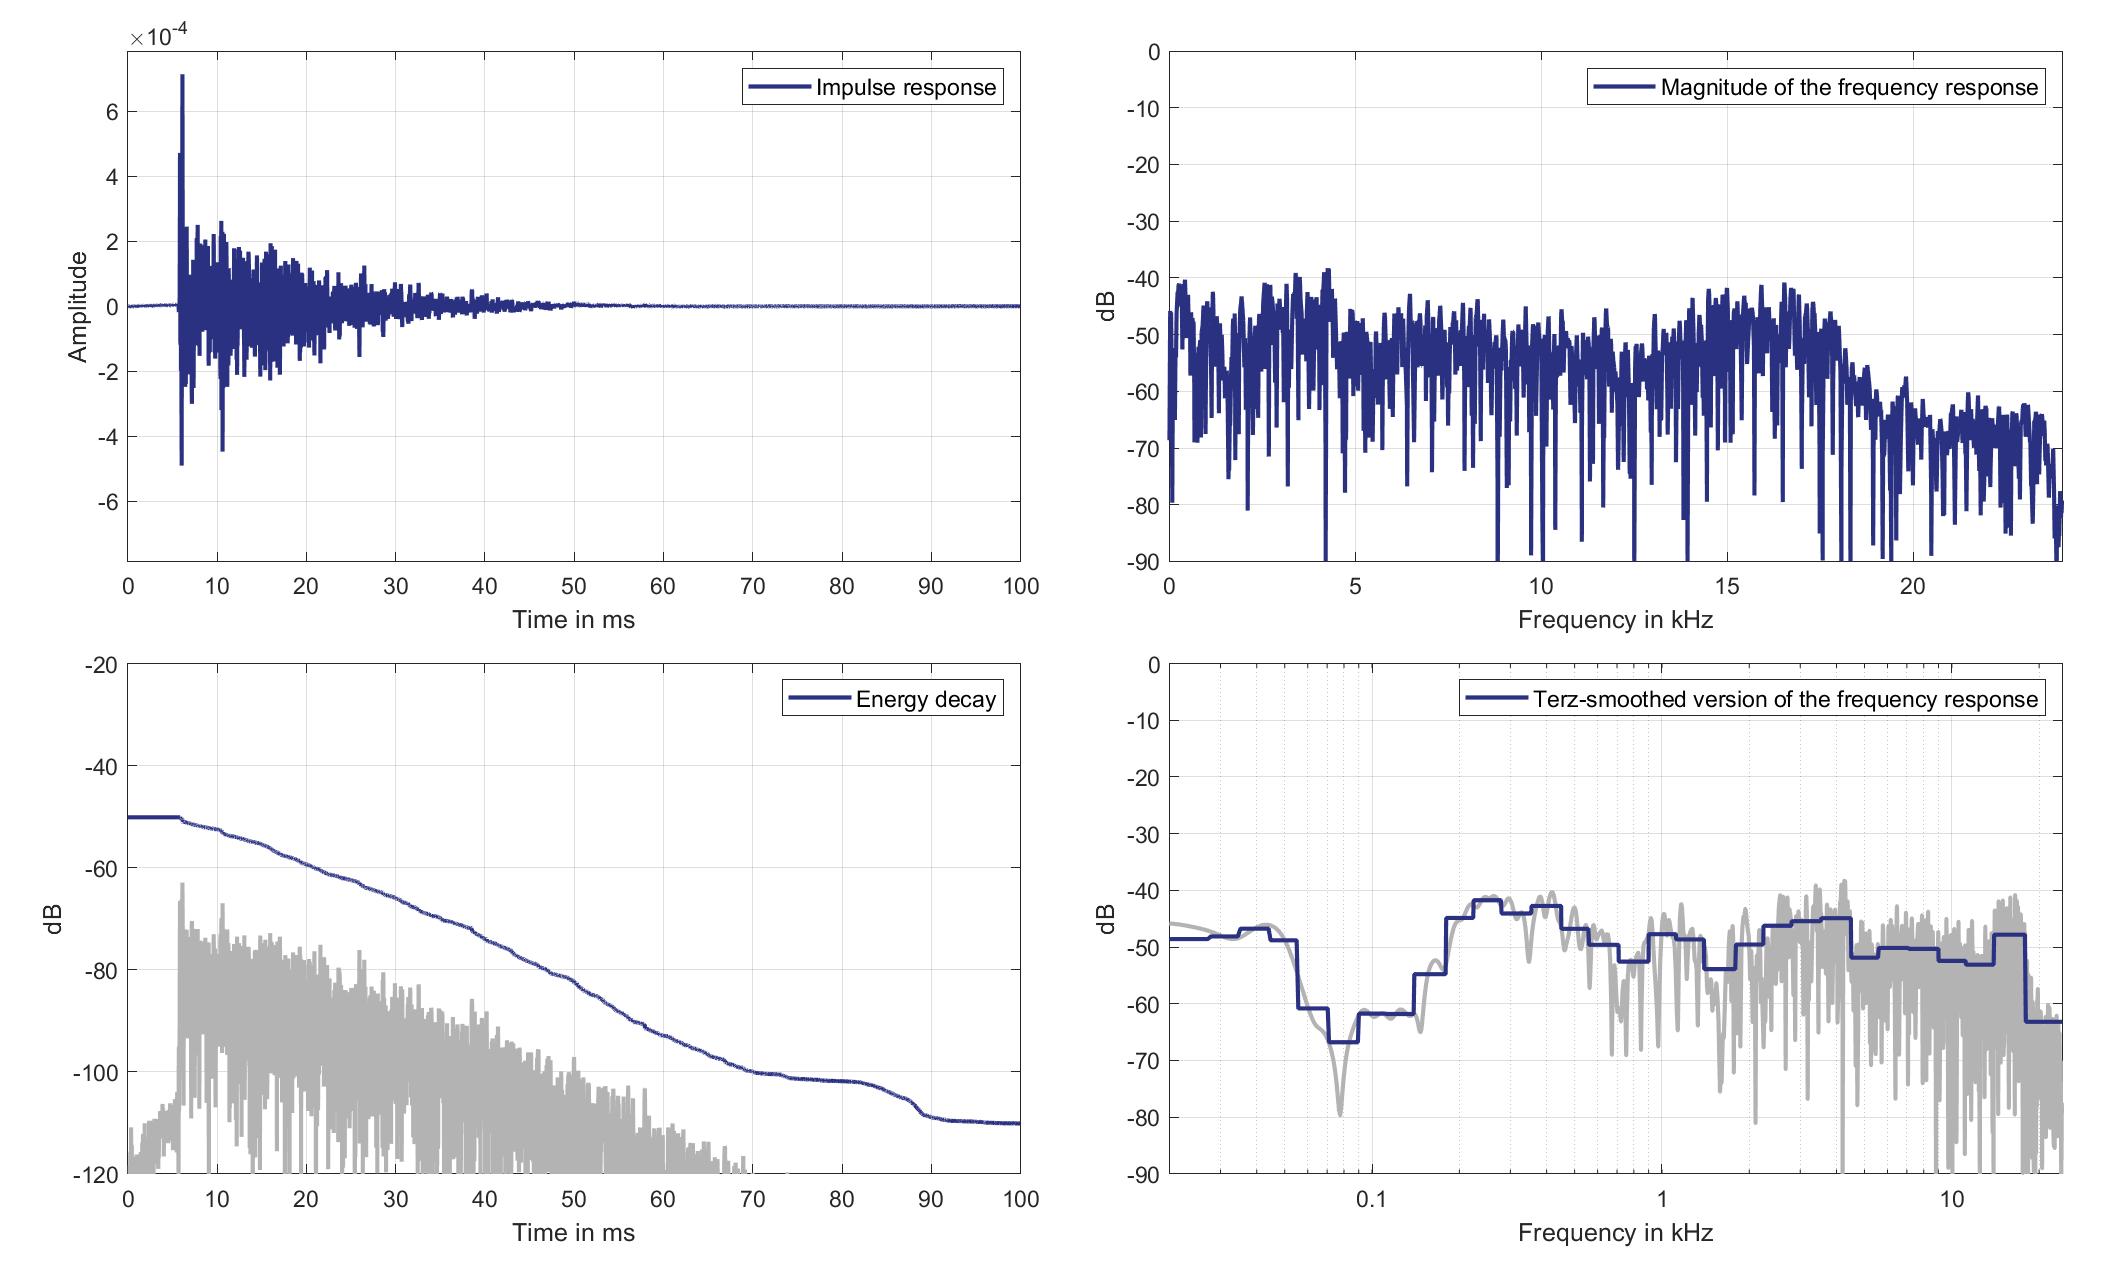
Download impulse response (in ".fir" format).
In the download section you can download all impulse response files as well as format explanation and Matlab as well as Python code examples for loading fir files.
Right lsp. - left ear mic.
Right Headrest Loudspeaker of Zone 6 (Lsp. 9) to Left Ear Microphone of Zone 1 (Mic. 19)
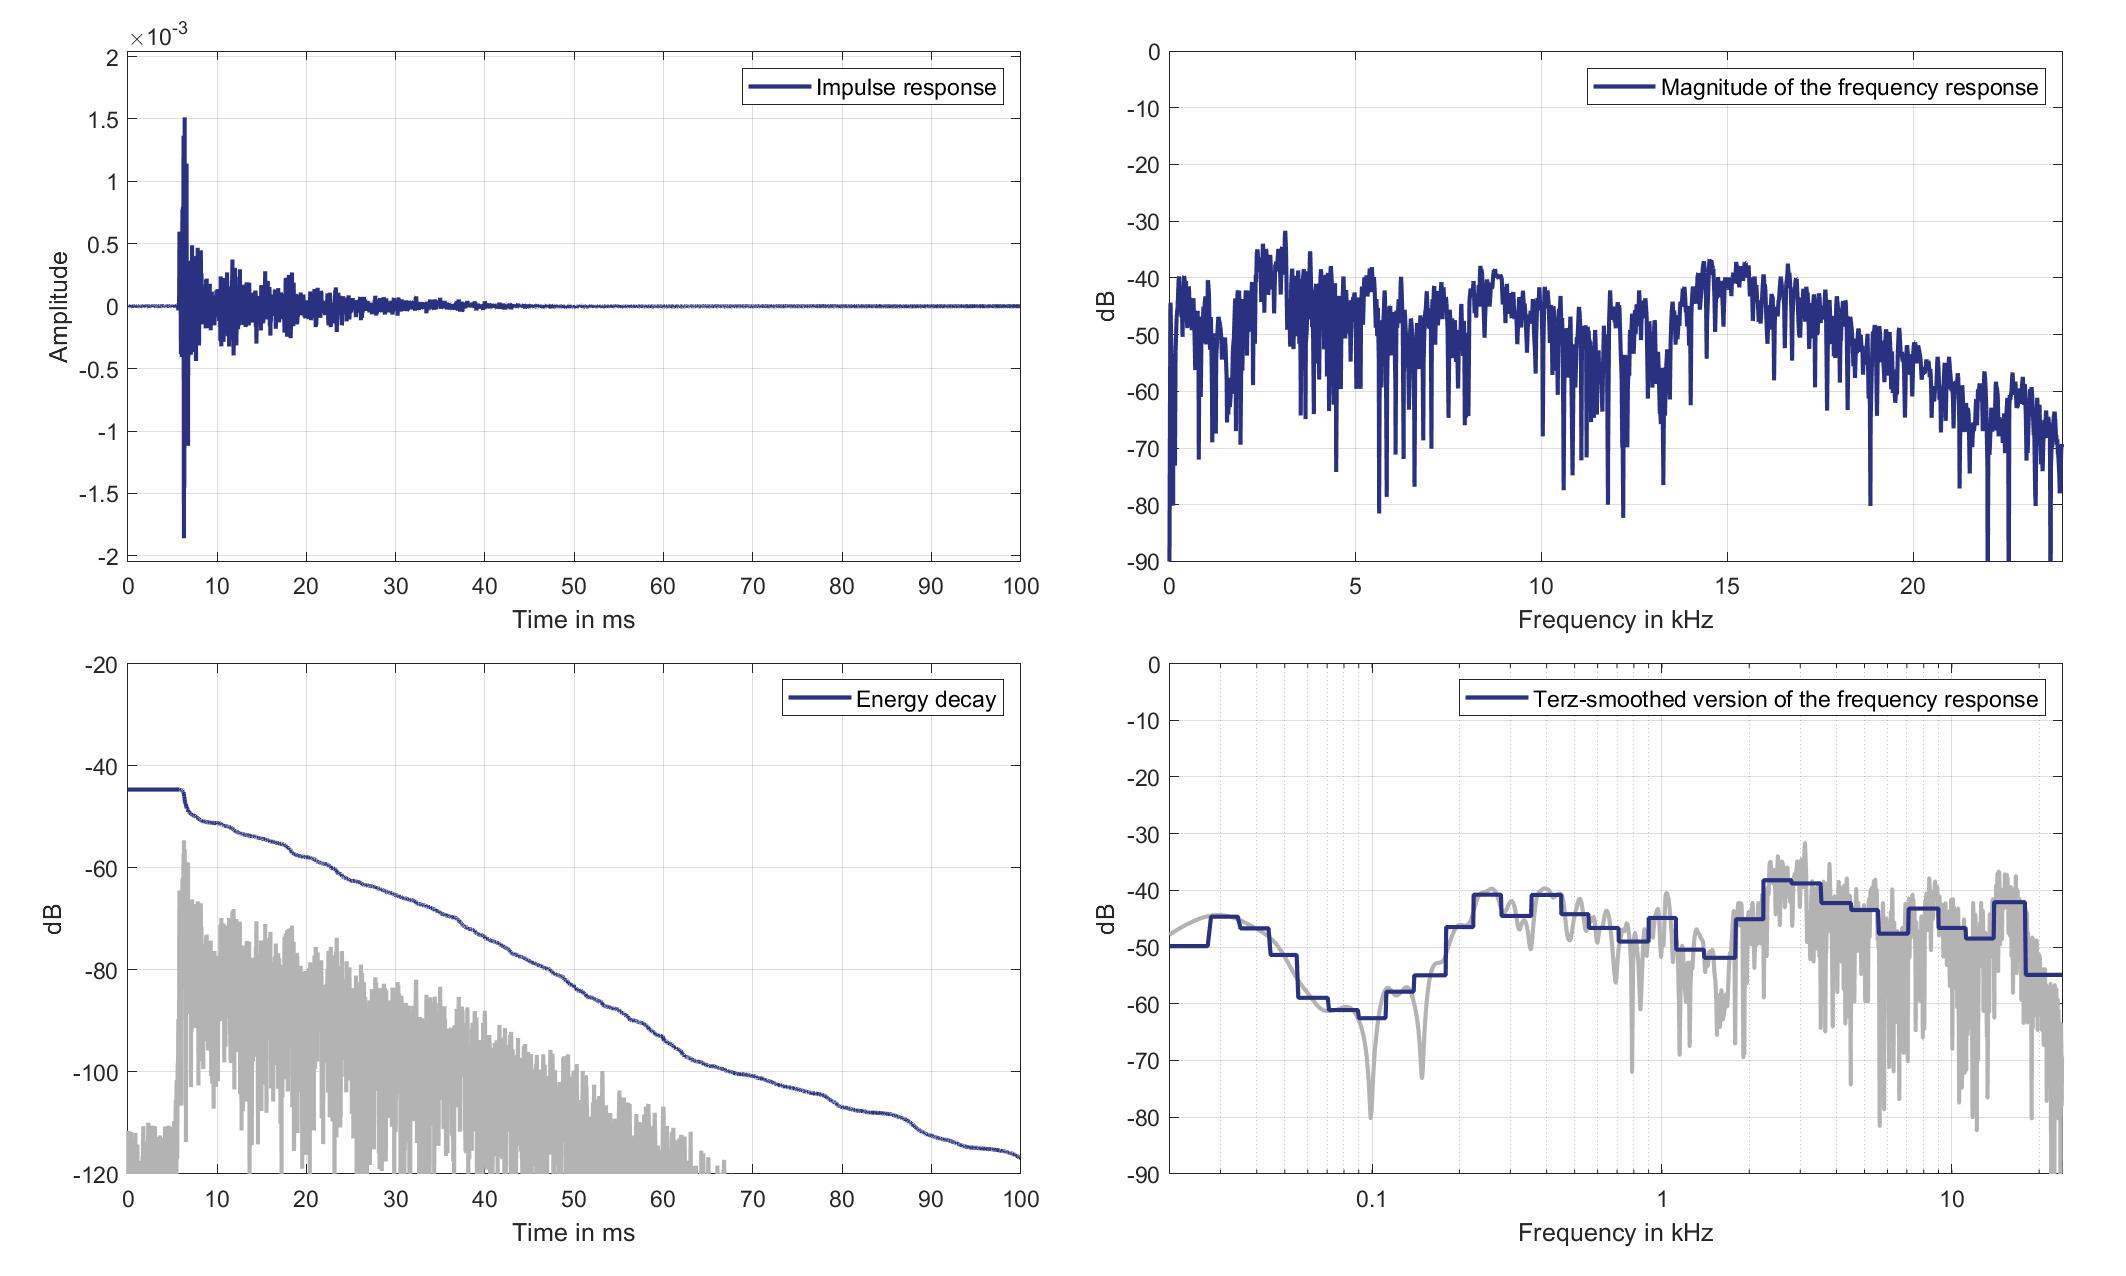
Download impulse response (in ".fir" format).
In the download section you can download all impulse response files as well as format explanation and Matlab as well as Python code examples for loading fir files.
Right lsp. - Right ear mic.
Right Headrest Loudspeaker of Zone 6 (Lsp. 9 to Right Ear Microphone of Zone 1 (Mic. 20)
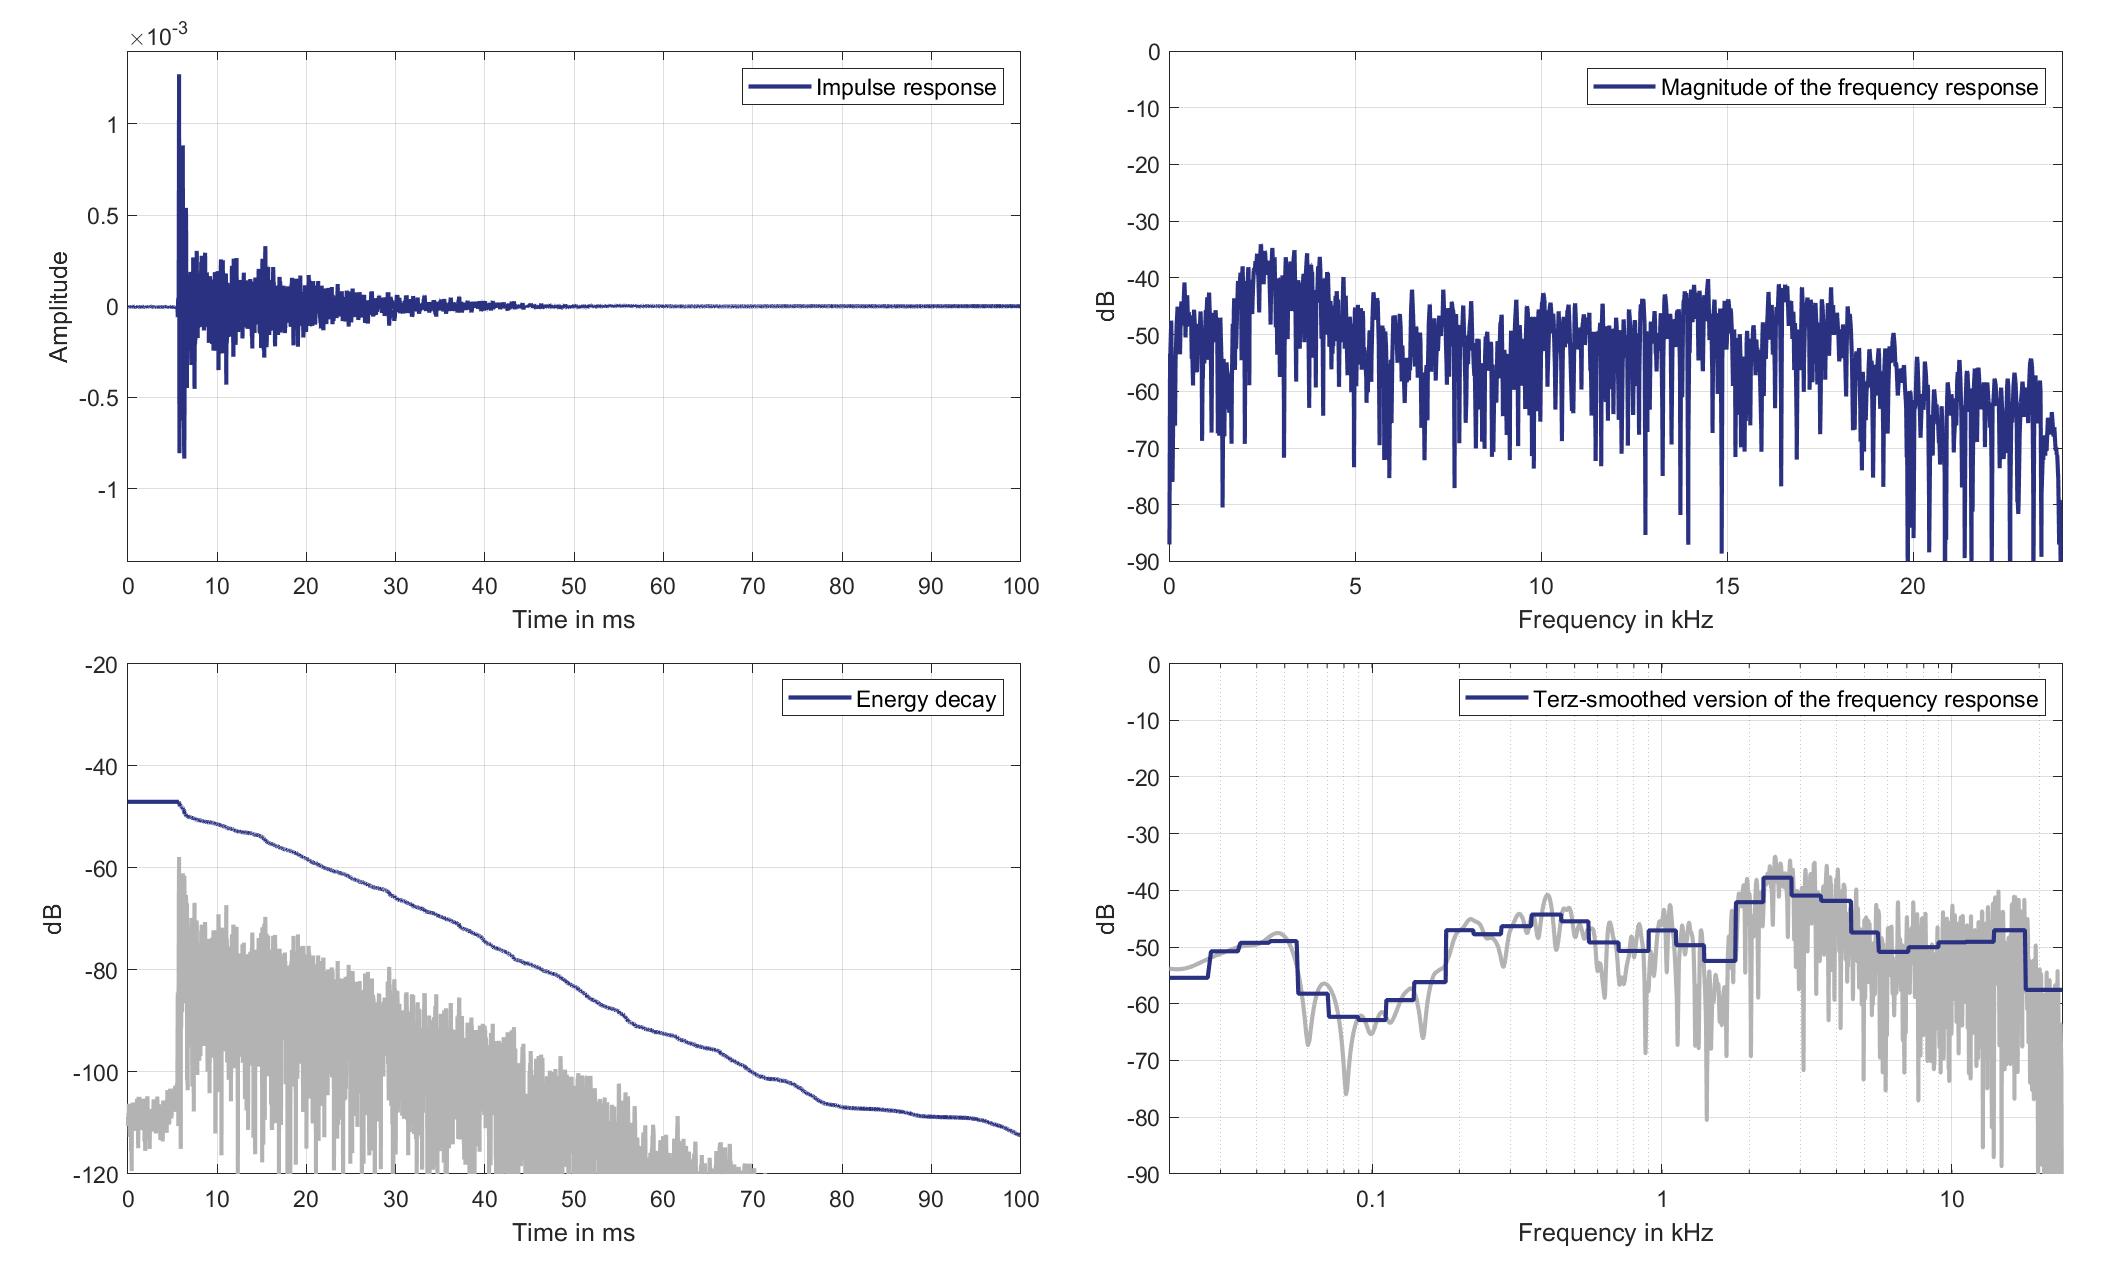
Download impulse response (in ".fir" format).
In the download section you can download all impulse response files as well as format explanation and Matlab as well as Python code examples for loading fir files.
Mics. 21/22
Left lsp. - left ear mic.
Left Headrest Loudspeaker of Zone 6 (Lsp. 8) to Left Ear Microphone of Zone 2 (Mic. 21)
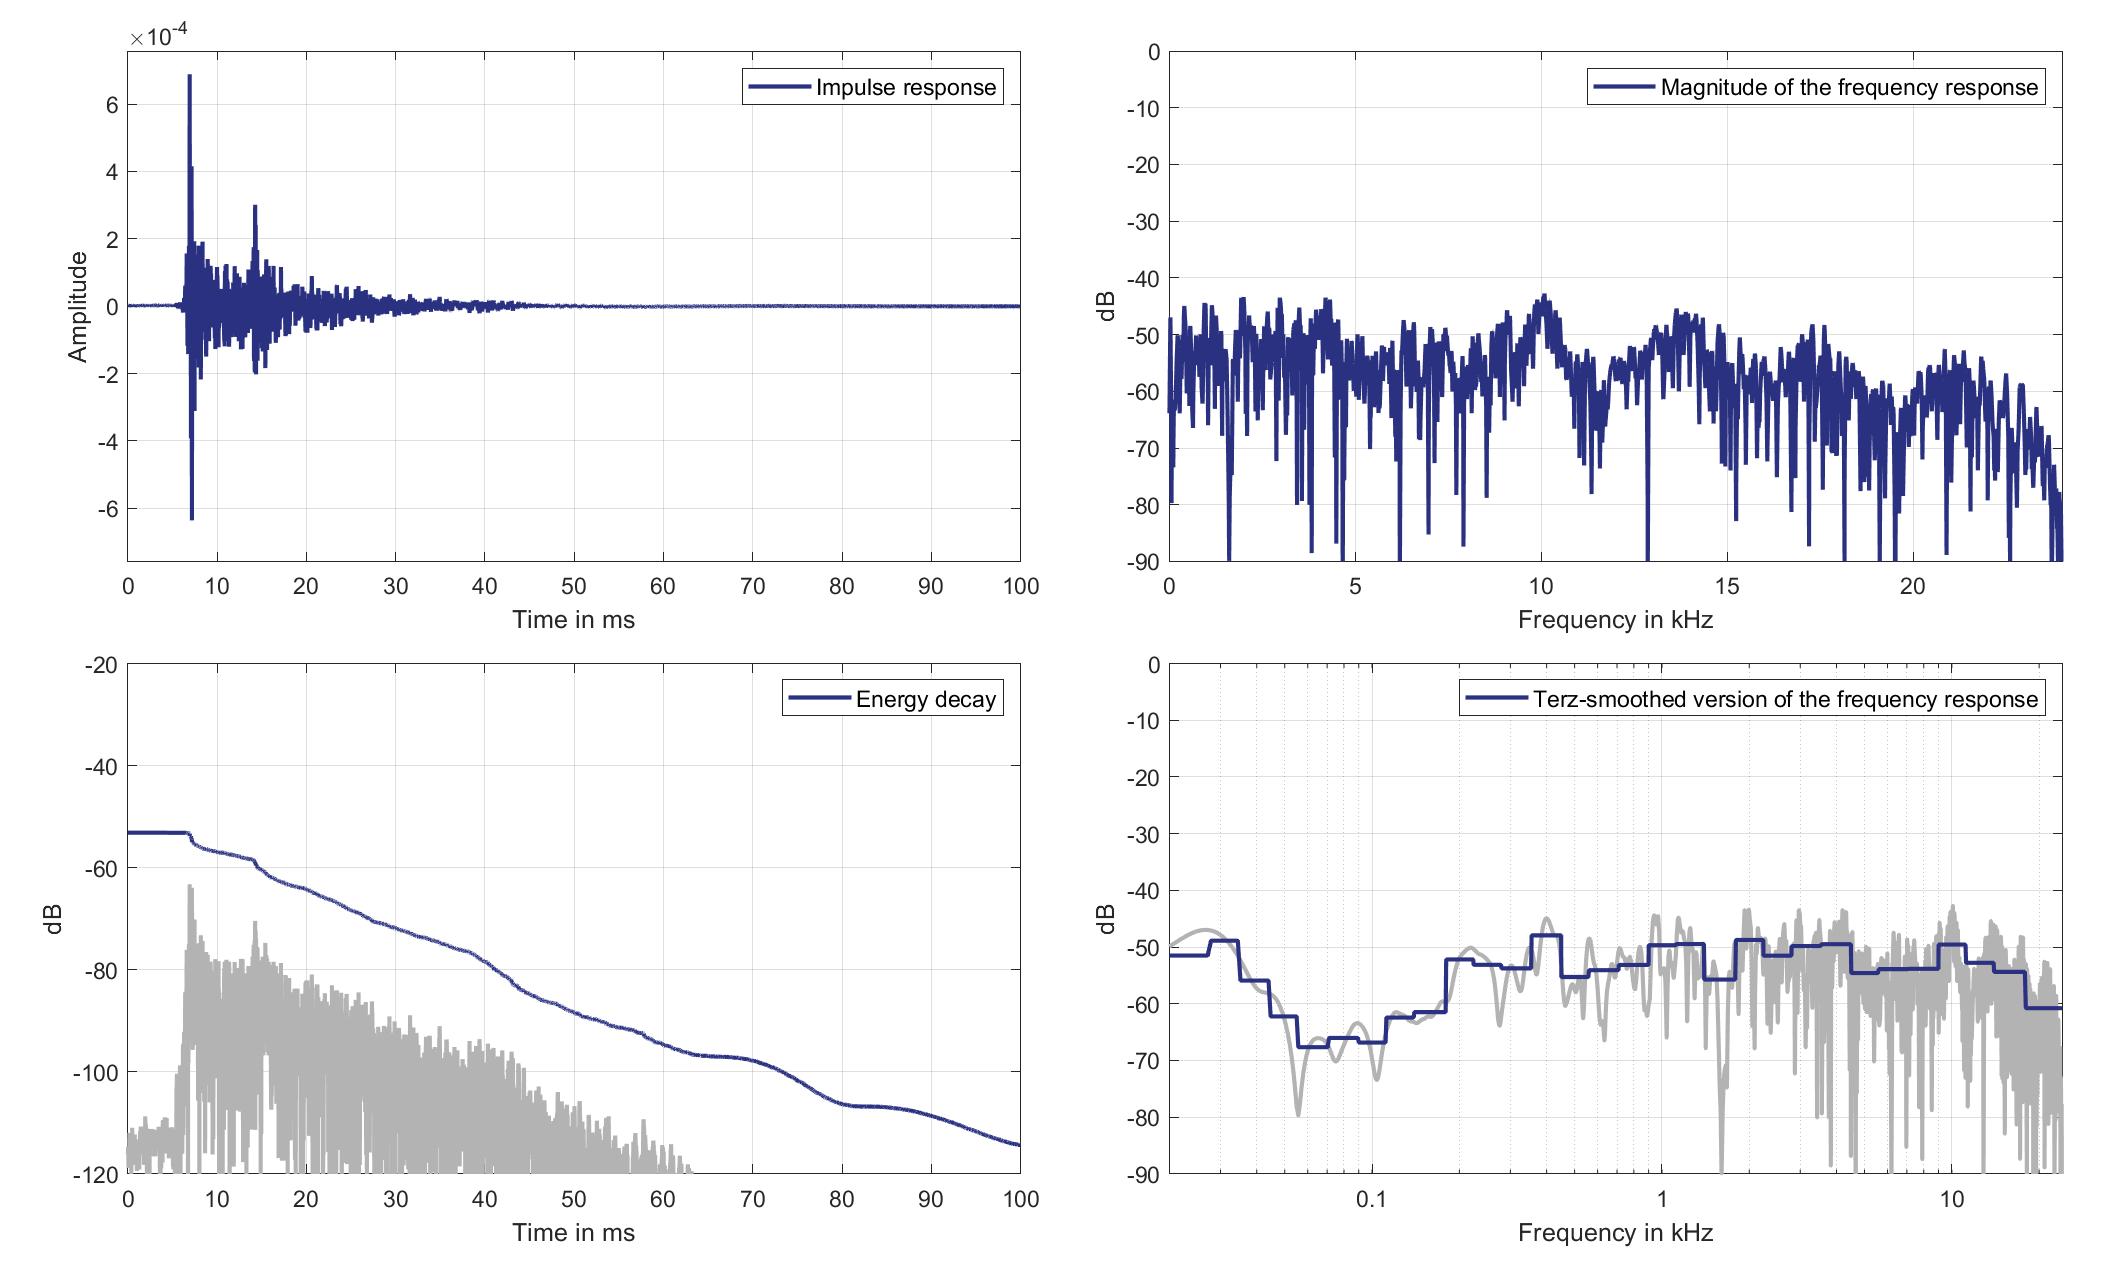
Download impulse response (in ".fir" format).
In the download section you can download all impulse response files as well as format explanation and Matlab as well as Python code examples for loading fir files.
Left lsp. - Right ear mic.
Left Headrest Loudspeaker of Zone 6 (Lsp. 8) to Right Ear Microphone of Zone 2 (Mic. 22)

Download impulse response (in ".fir" format).
In the download section you can download all impulse response files as well as format explanation and Matlab as well as Python code examples for loading fir files.
Right lsp. - left ear mic.
Right Headrest Loudspeaker of Zone 6 (Lsp. 9) to Left Ear Microphone of Zone 2 (Mic. 21)
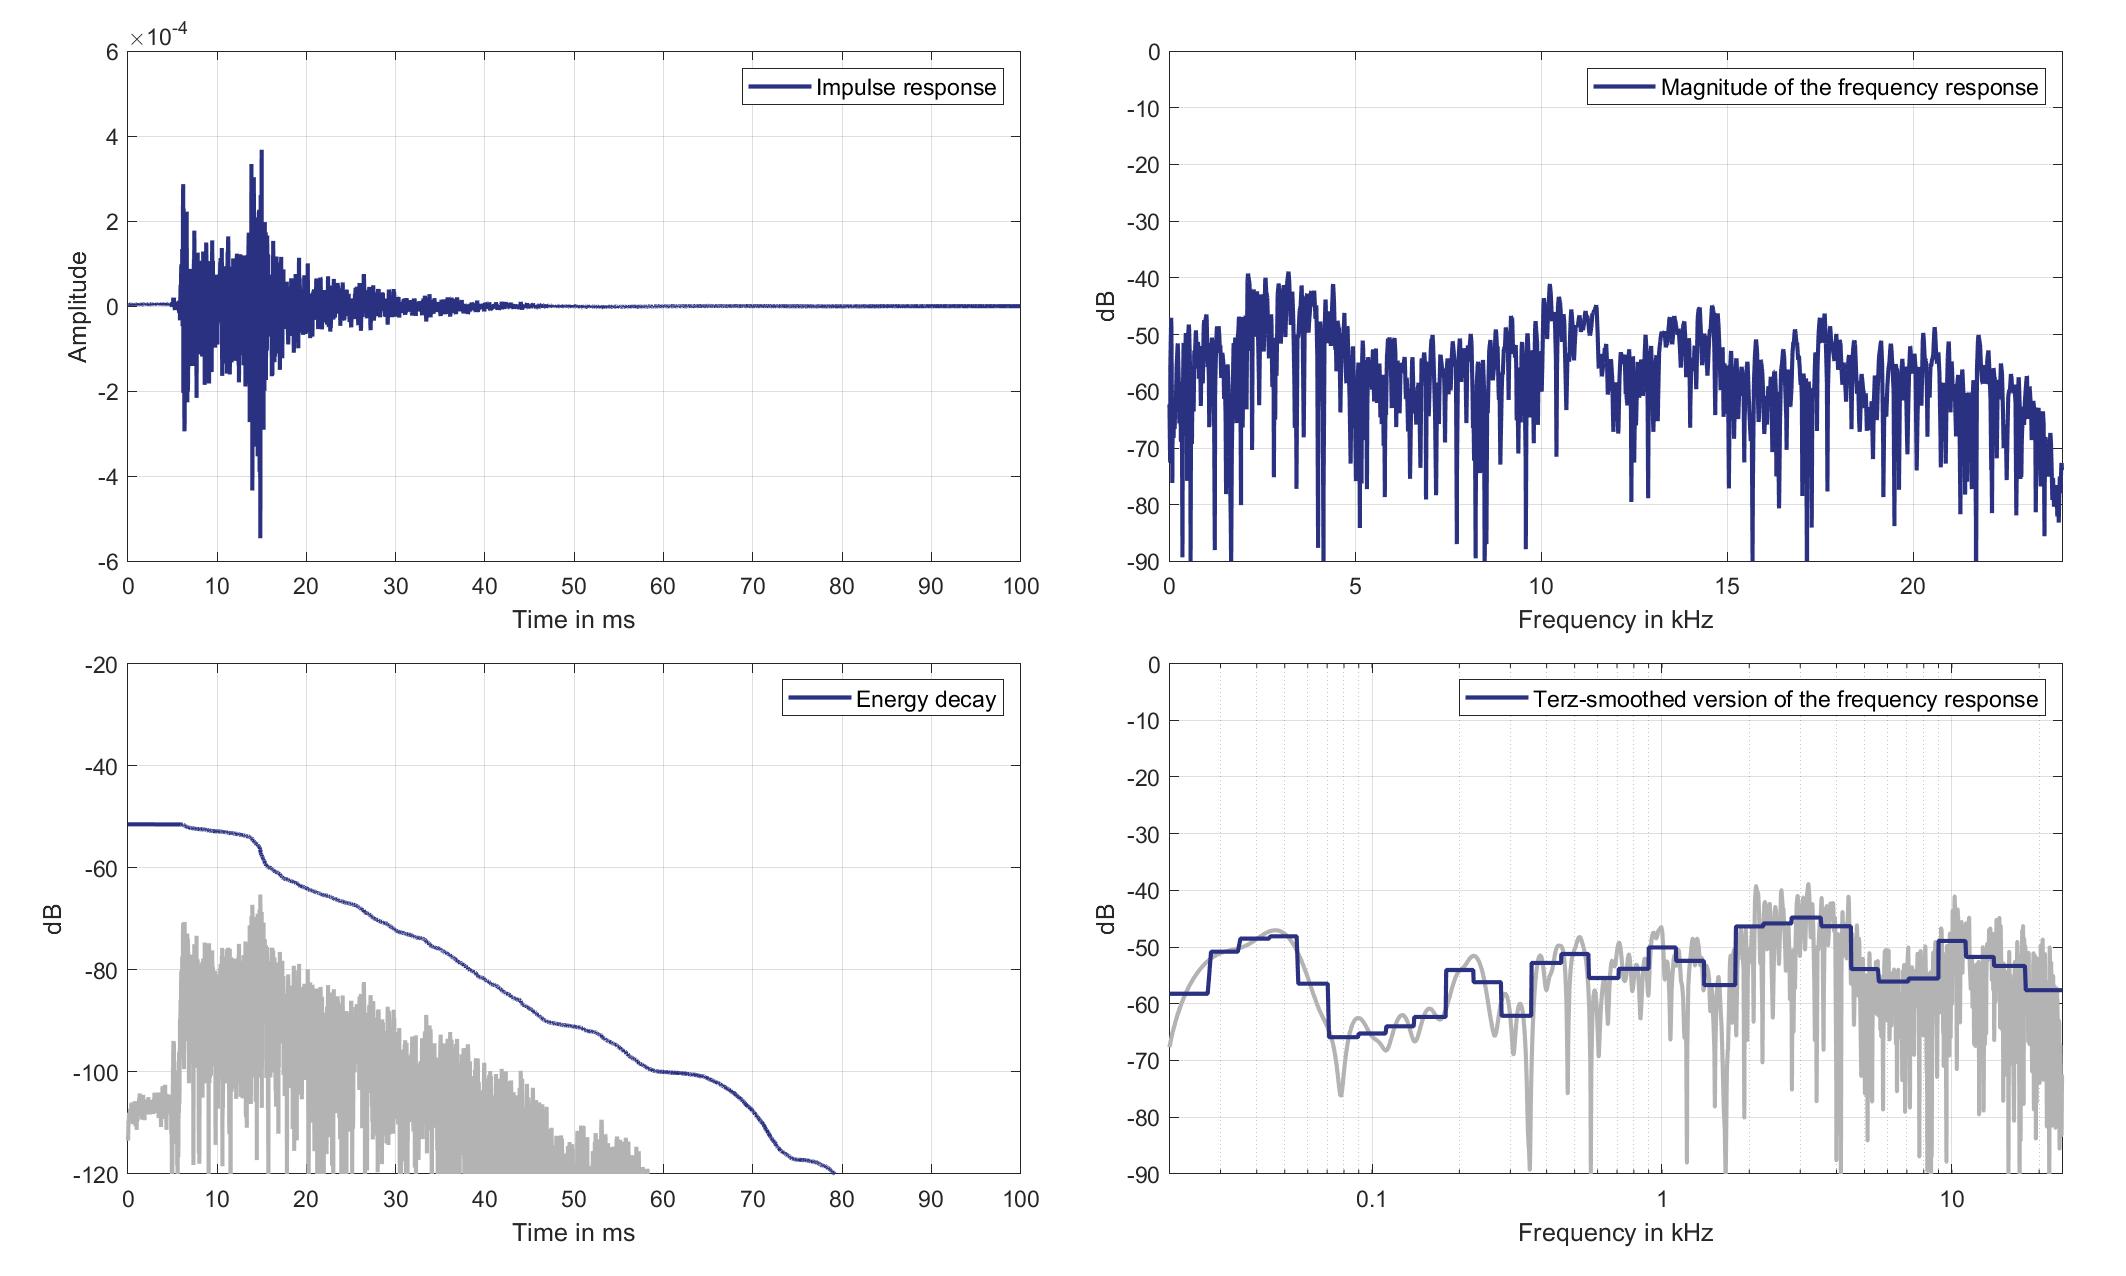
Download impulse response (in ".fir" format).
In the download section you can download all impulse response files as well as format explanation and Matlab as well as Python code examples for loading fir files.
Right lsp. - Right ear mic.
Right Headrest Loudspeaker of Zone 6 (Lsp. 9 to Right Ear Microphone of Zone 2 (Mic. 22)

Download impulse response (in ".fir" format).
In the download section you can download all impulse response files as well as format explanation and Matlab as well as Python code examples for loading fir files.
Mics. 23/24
Left lsp. - left ear mic.
Left Headrest Loudspeaker of Zone 6 (Lsp. 8) to Left Ear Microphone of Zone 3 (Mic. 23)
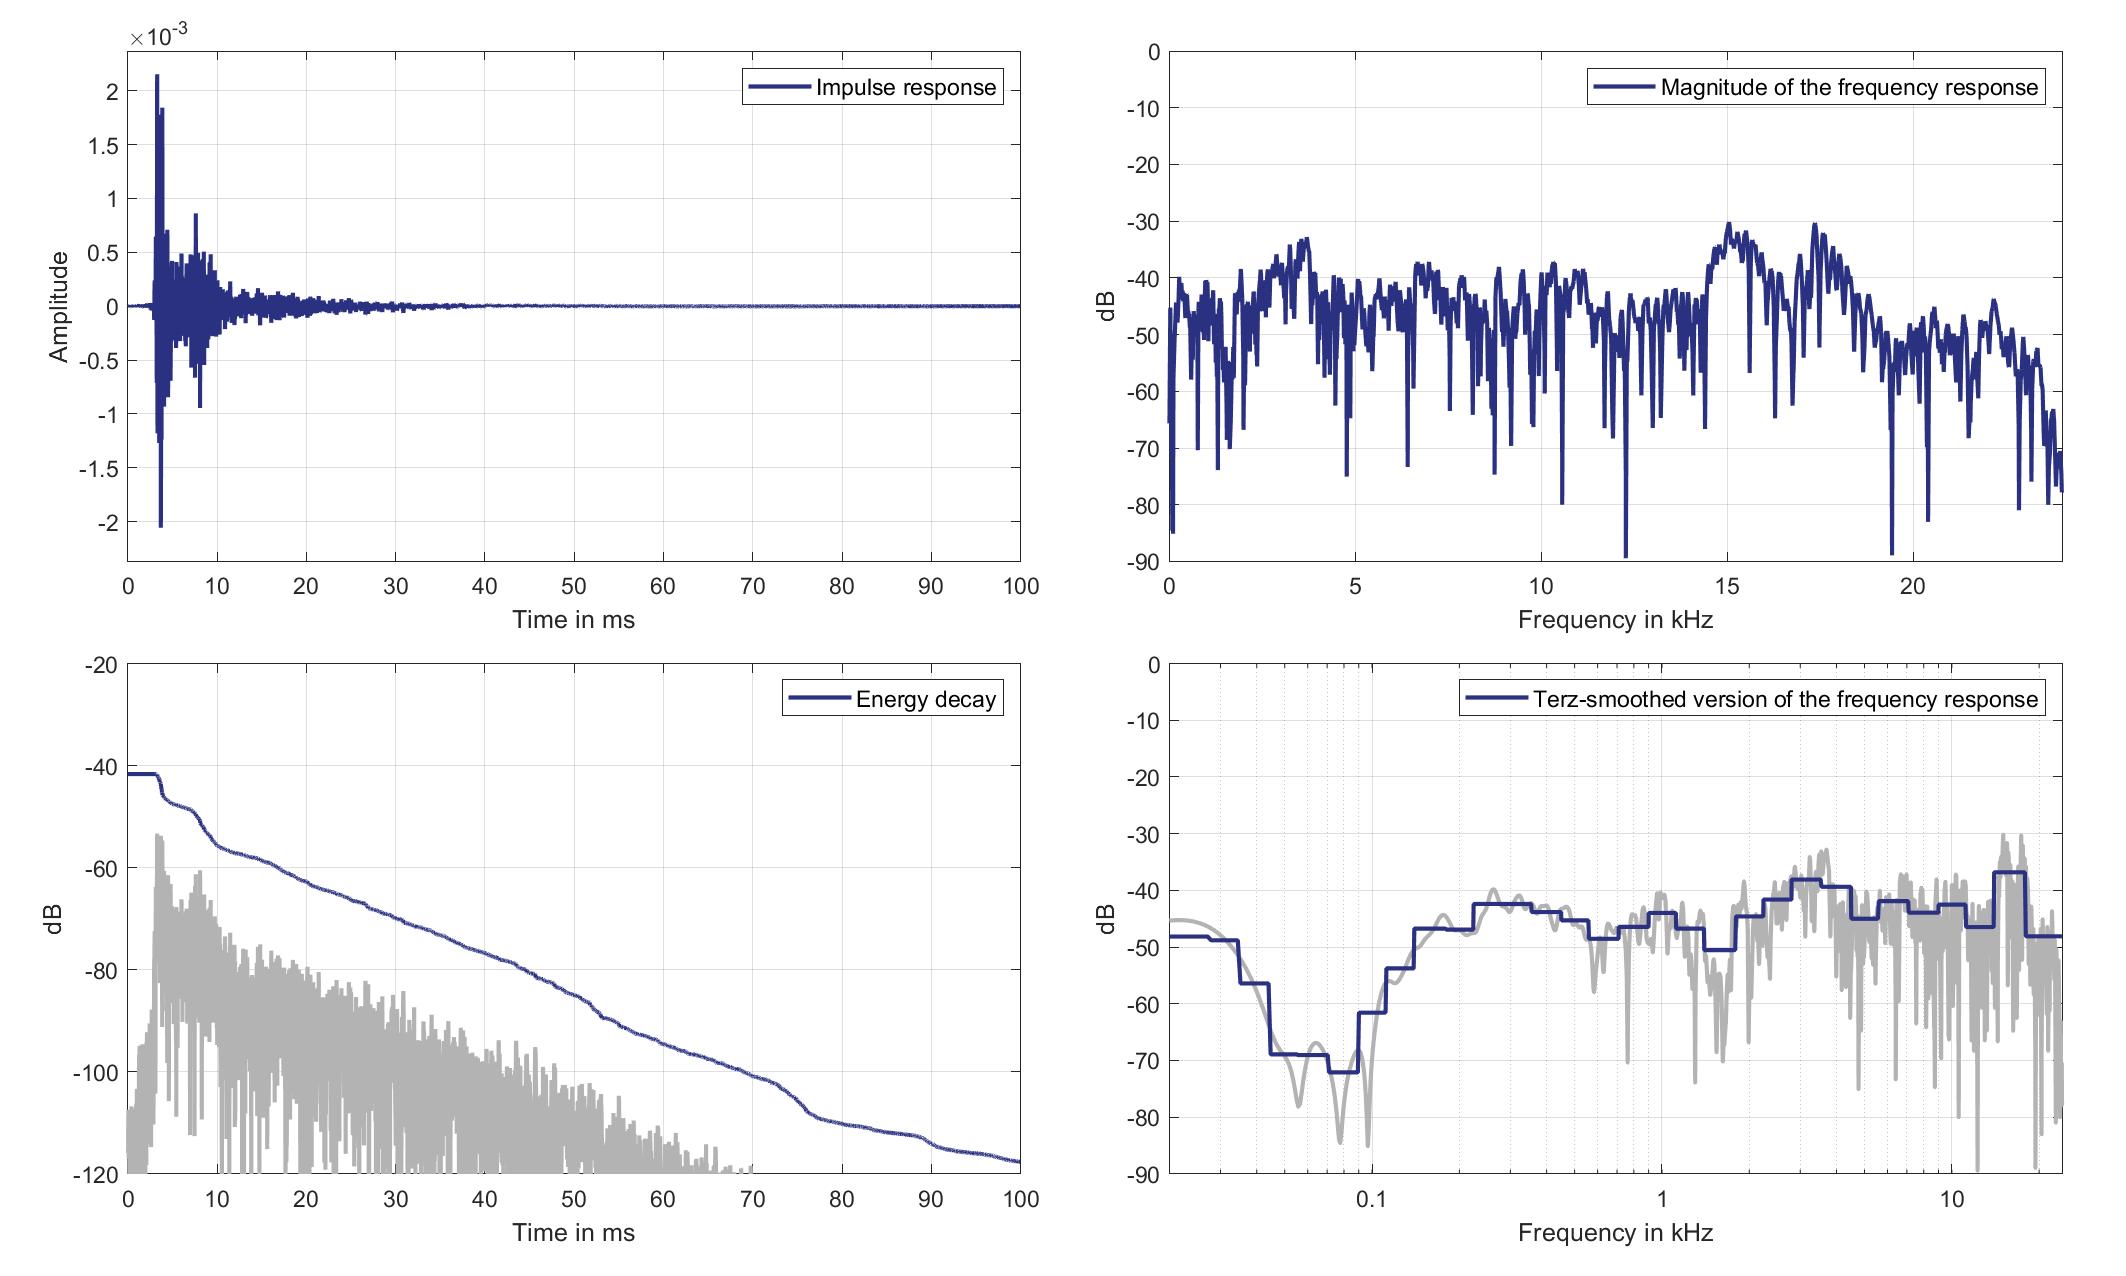
Download impulse response (in ".fir" format).
In the download section you can download all impulse response files as well as format explanation and Matlab as well as Python code examples for loading fir files.
Left lsp. - Right ear mic.
Left Headrest Loudspeaker of Zone 6 (Lsp. 8) to Right Ear Microphone of Zone 3 (Mic. 24)
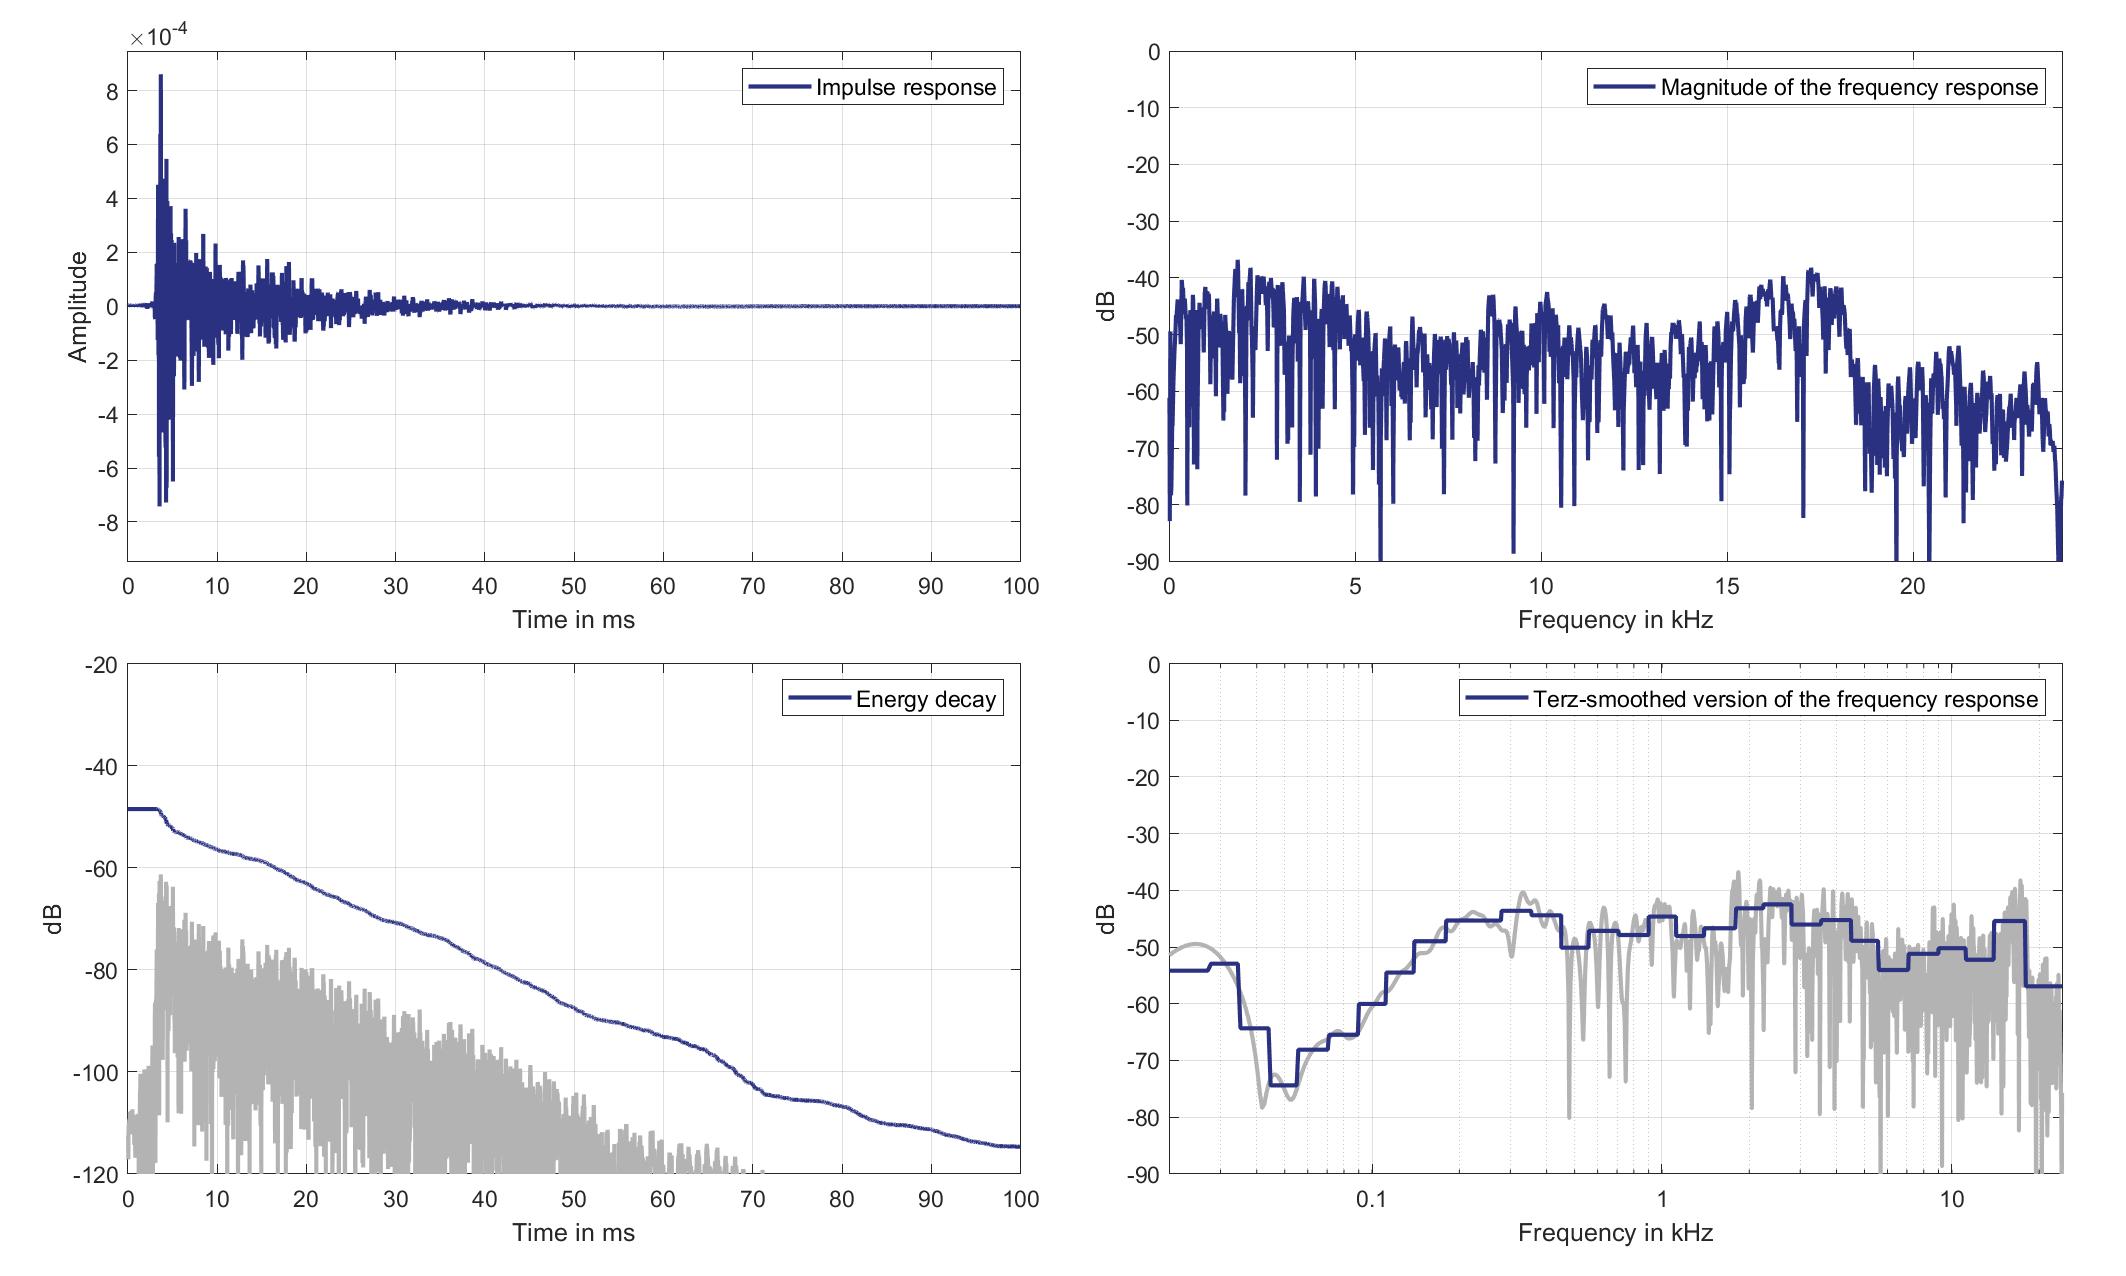
Download impulse response (in ".fir" format).
In the download section you can download all impulse response files as well as format explanation and Matlab as well as Python code examples for loading fir files.
Right lsp. - left ear mic.
Right Headrest Loudspeaker of Zone 6 (Lsp. 9) to Left Ear Microphone of Zone 3 (Mic. 23)
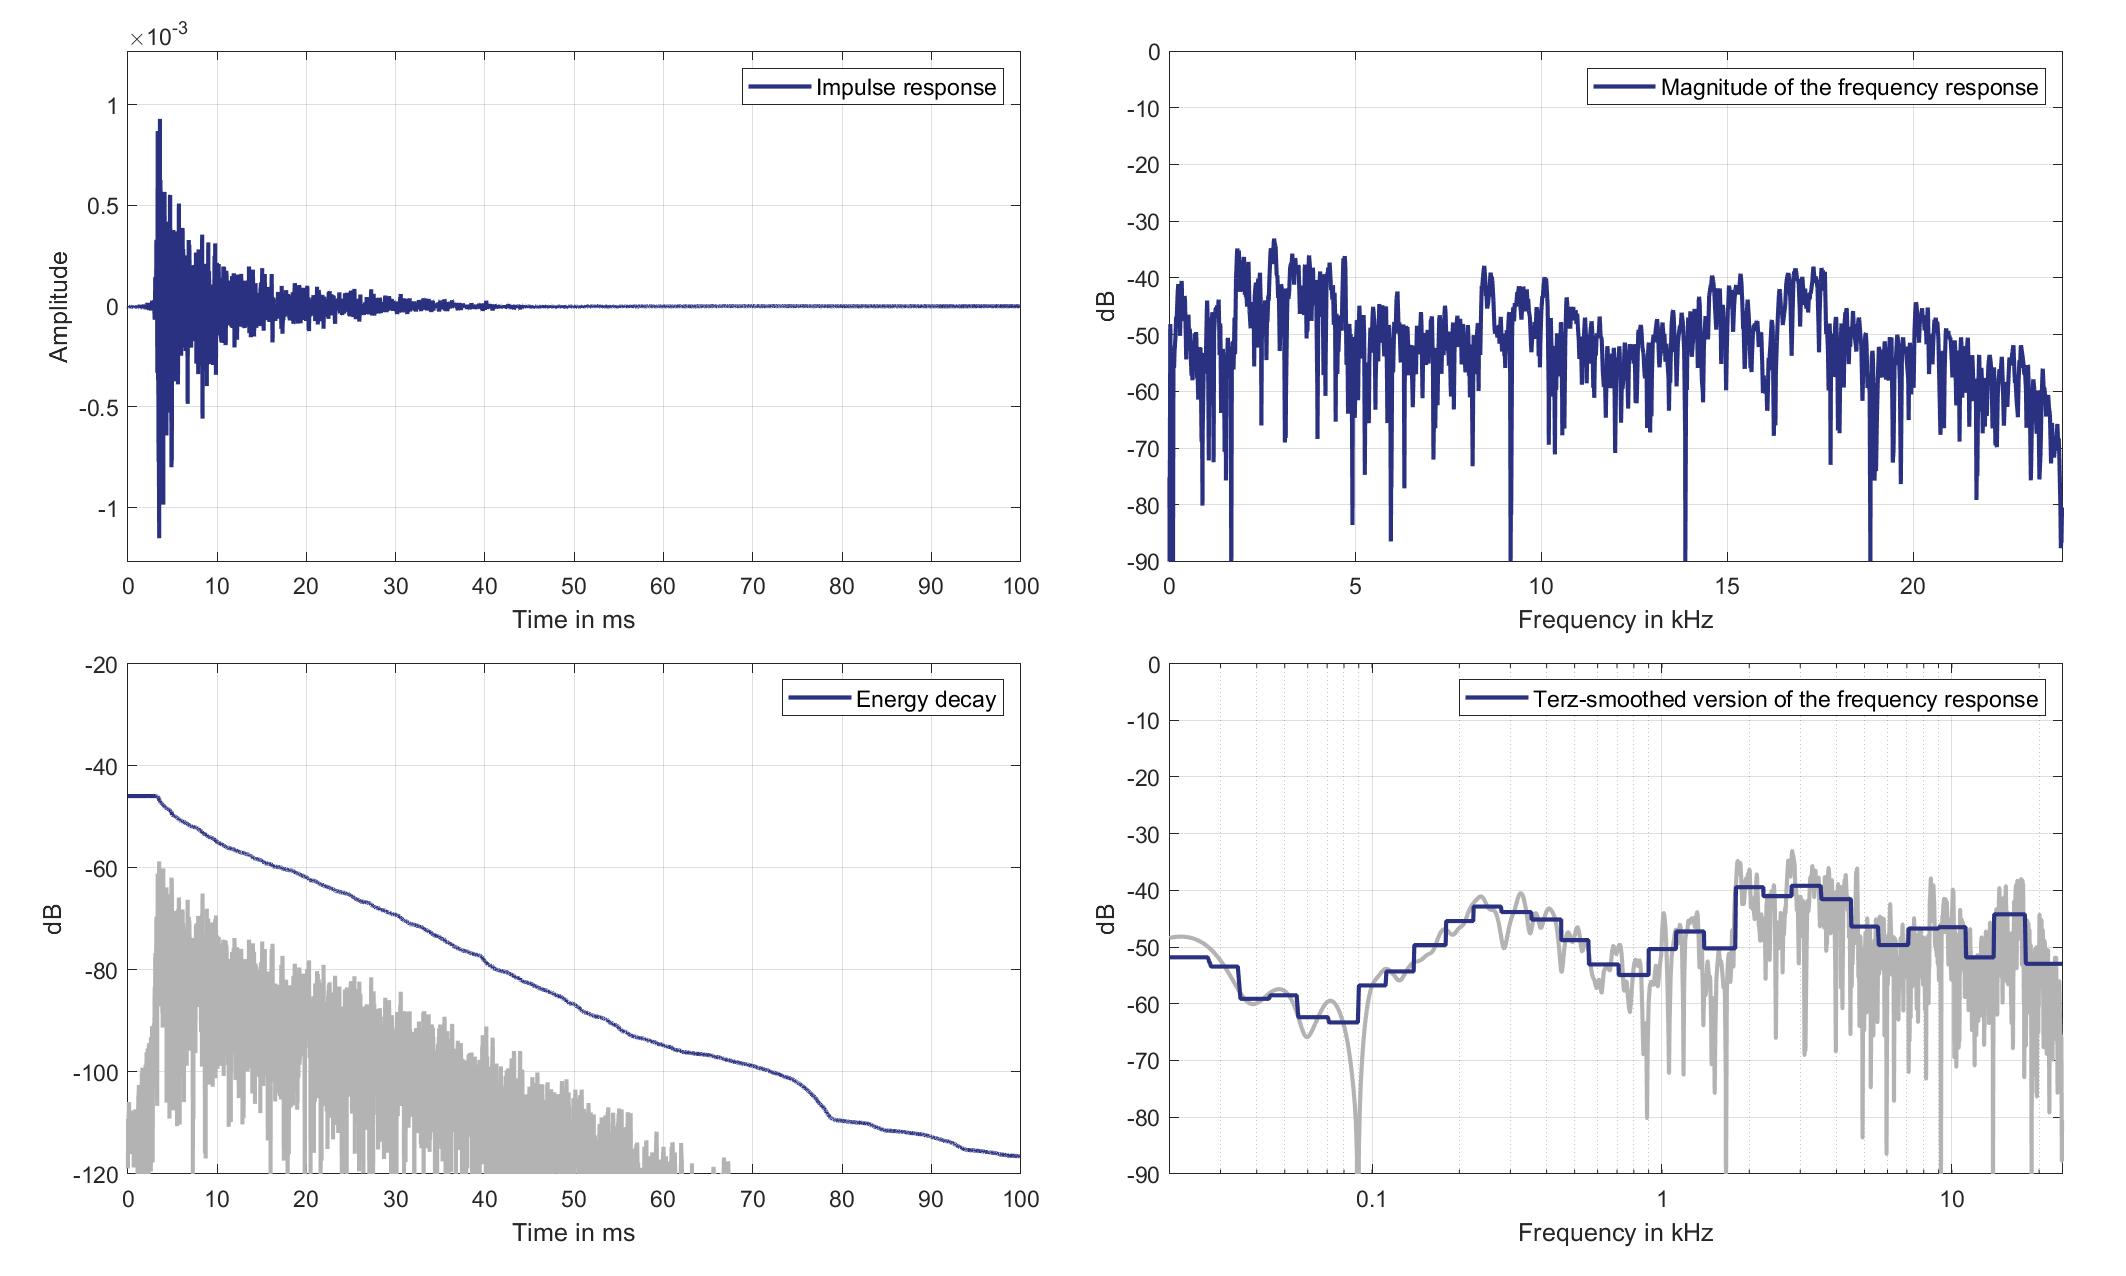
Download impulse response (in ".fir" format).
In the download section you can download all impulse response files as well as format explanation and Matlab as well as Python code examples for loading fir files.
Right lsp. - Right ear mic.
Right Headrest Loudspeaker of Zone 6 (Lsp. 9 to Right Ear Microphone of Zone 3 (Mic. 24)
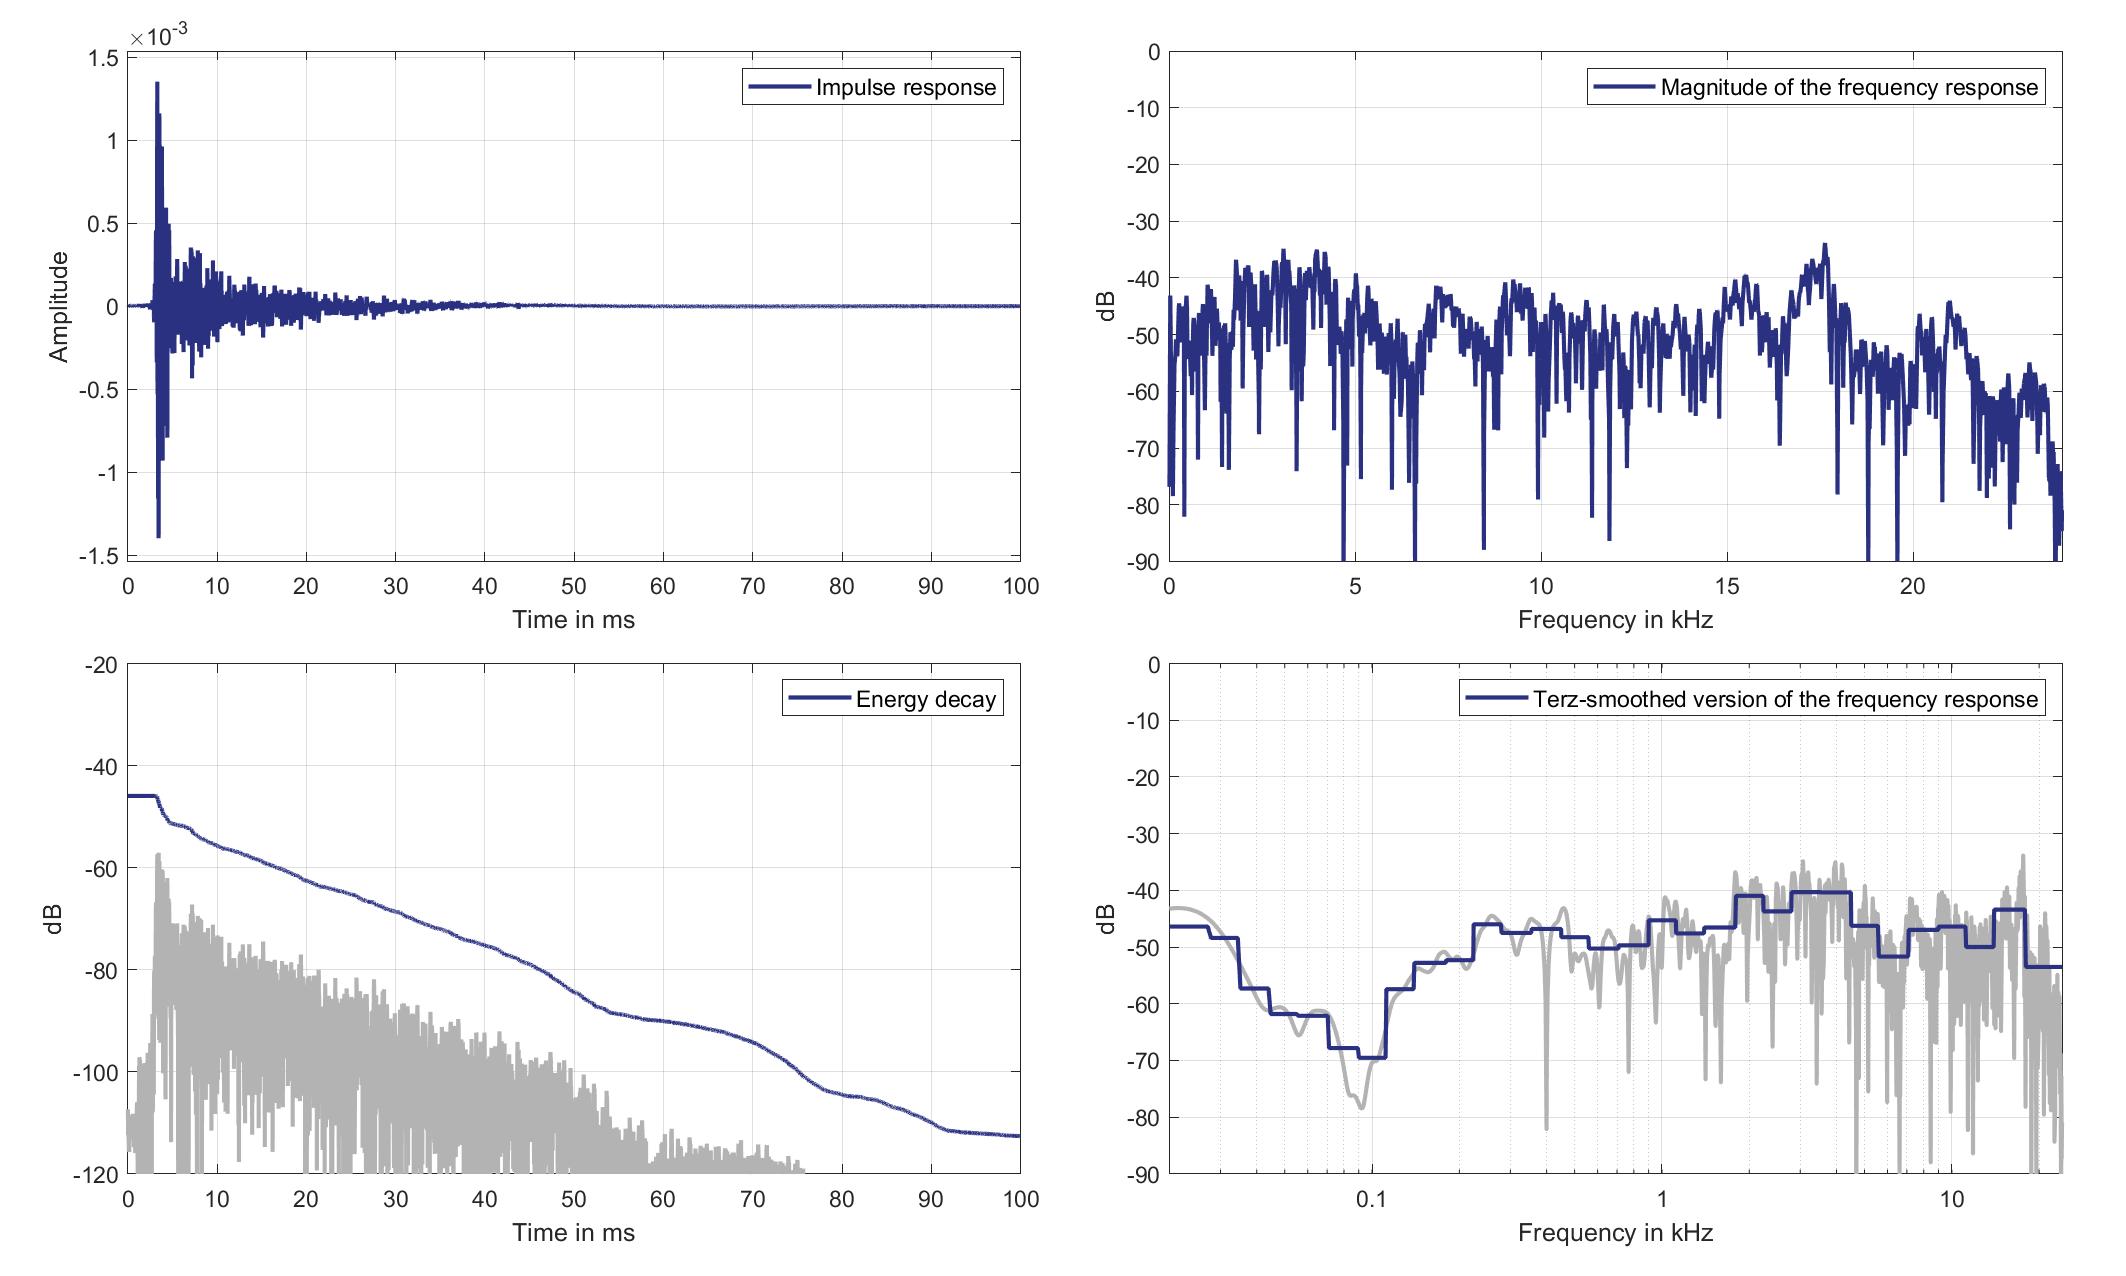
Download impulse response (in ".fir" format).
In the download section you can download all impulse response files as well as format explanation and Matlab as well as Python code examples for loading fir files.
Mics. 25/26
Left lsp. - left ear mic.
Left Headrest Loudspeaker of Zone 6 (Lsp. 8) to Left Ear Microphone of Zone 5 (Mic. 25)
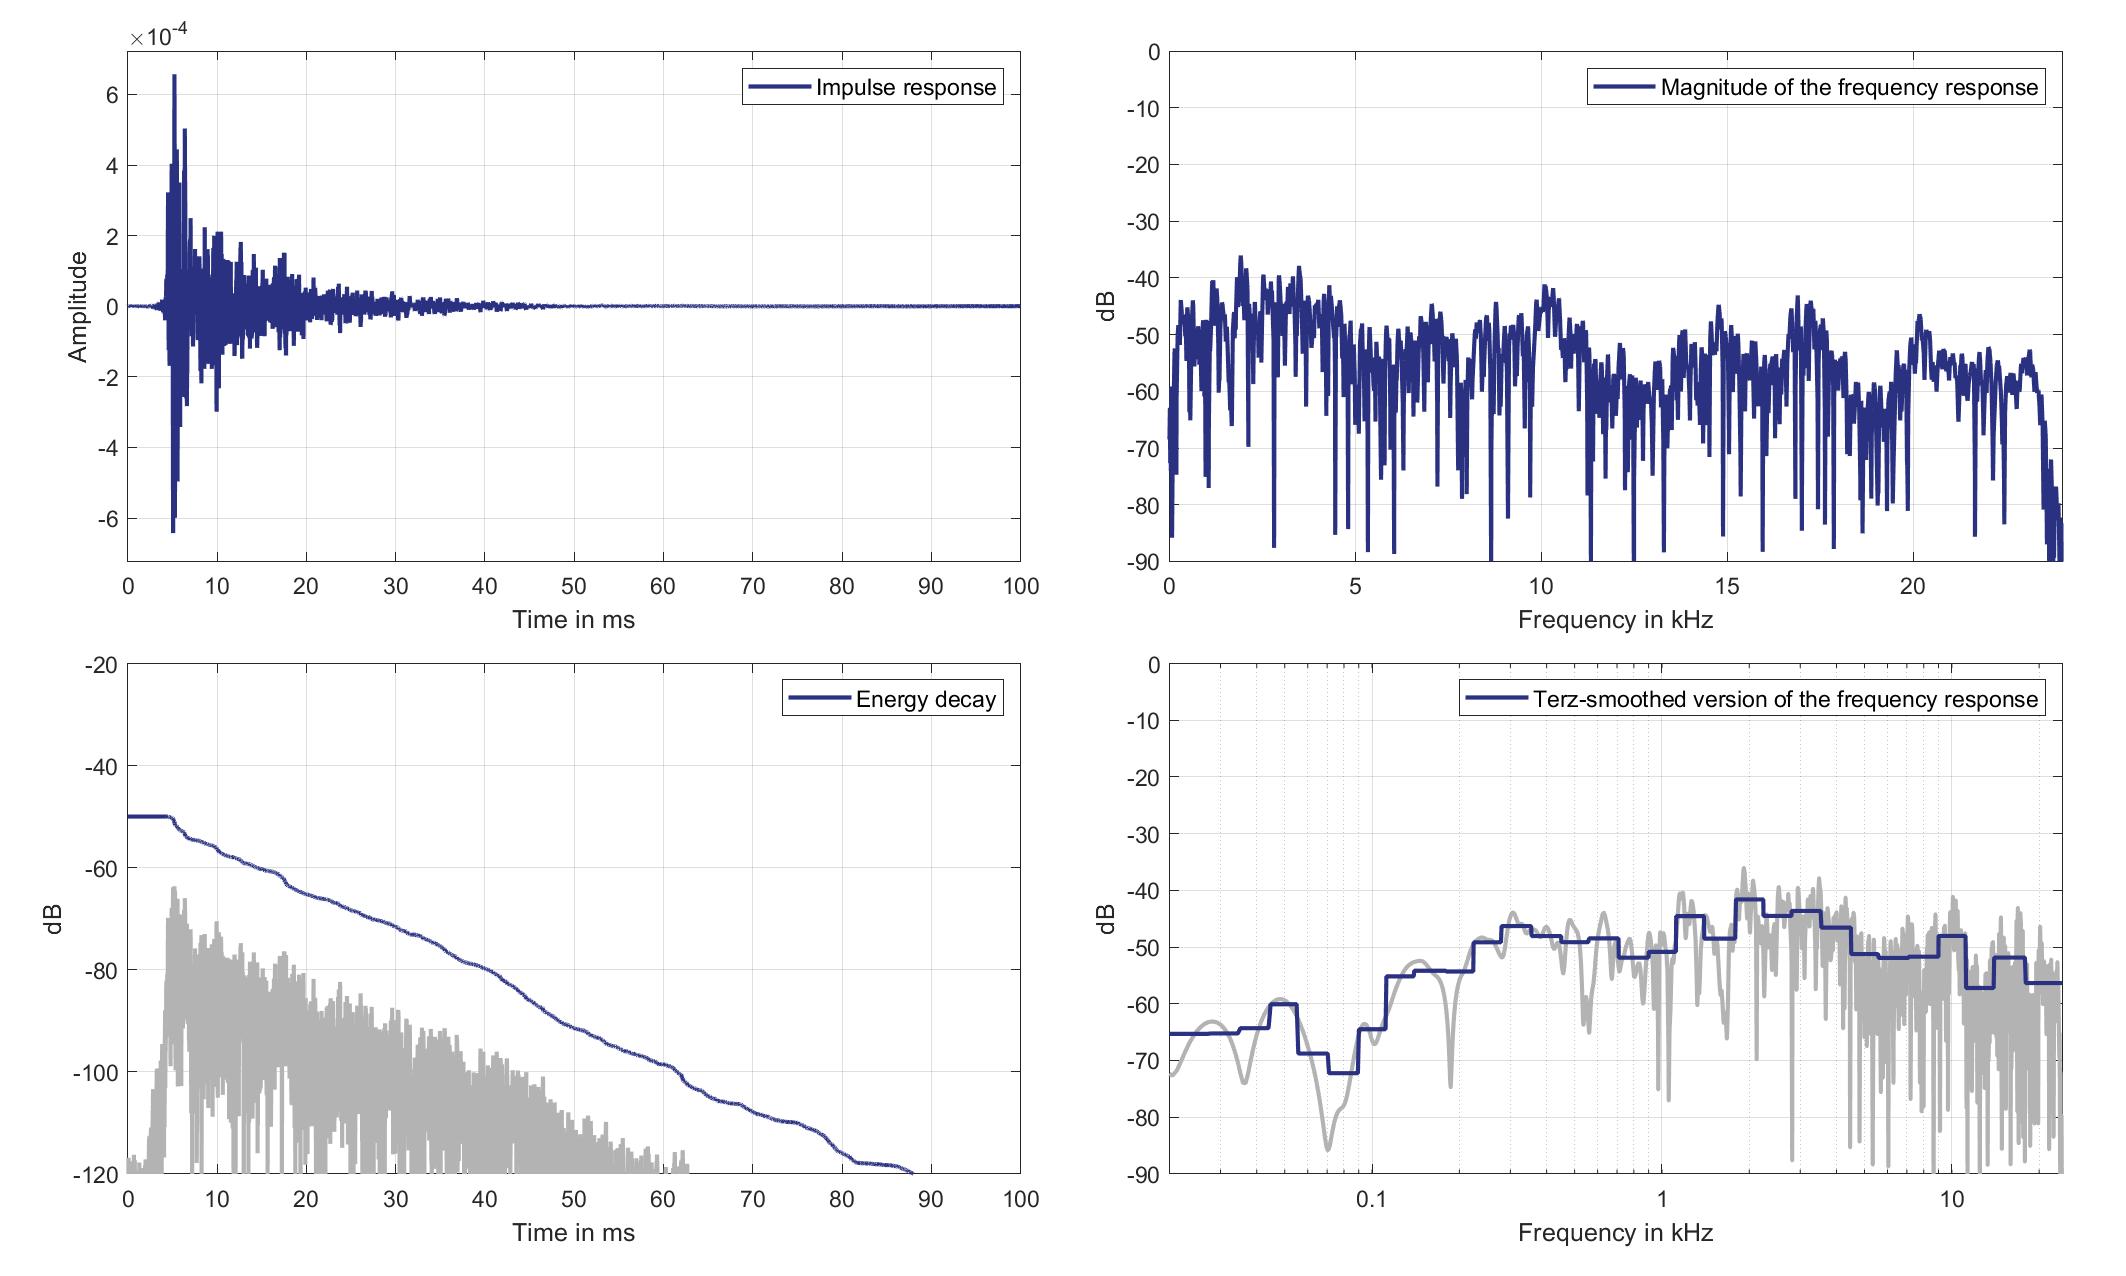
Download impulse response (in ".fir" format).
In the download section you can download all impulse response files as well as format explanation and Matlab as well as Python code examples for loading fir files.
Left lsp. - Right ear mic.
Left Headrest Loudspeaker of Zone 6 (Lsp. 8) to Right Ear Microphone of Zone 5 (Mic. 26)

Download impulse response (in ".fir" format).
In the download section you can download all impulse response files as well as format explanation and Matlab as well as Python code examples for loading fir files.
Right lsp. - left ear mic.
Right Headrest Loudspeaker of Zone 6 (Lsp. 9) to Left Ear Microphone of Zone 5 (Mic. 25)
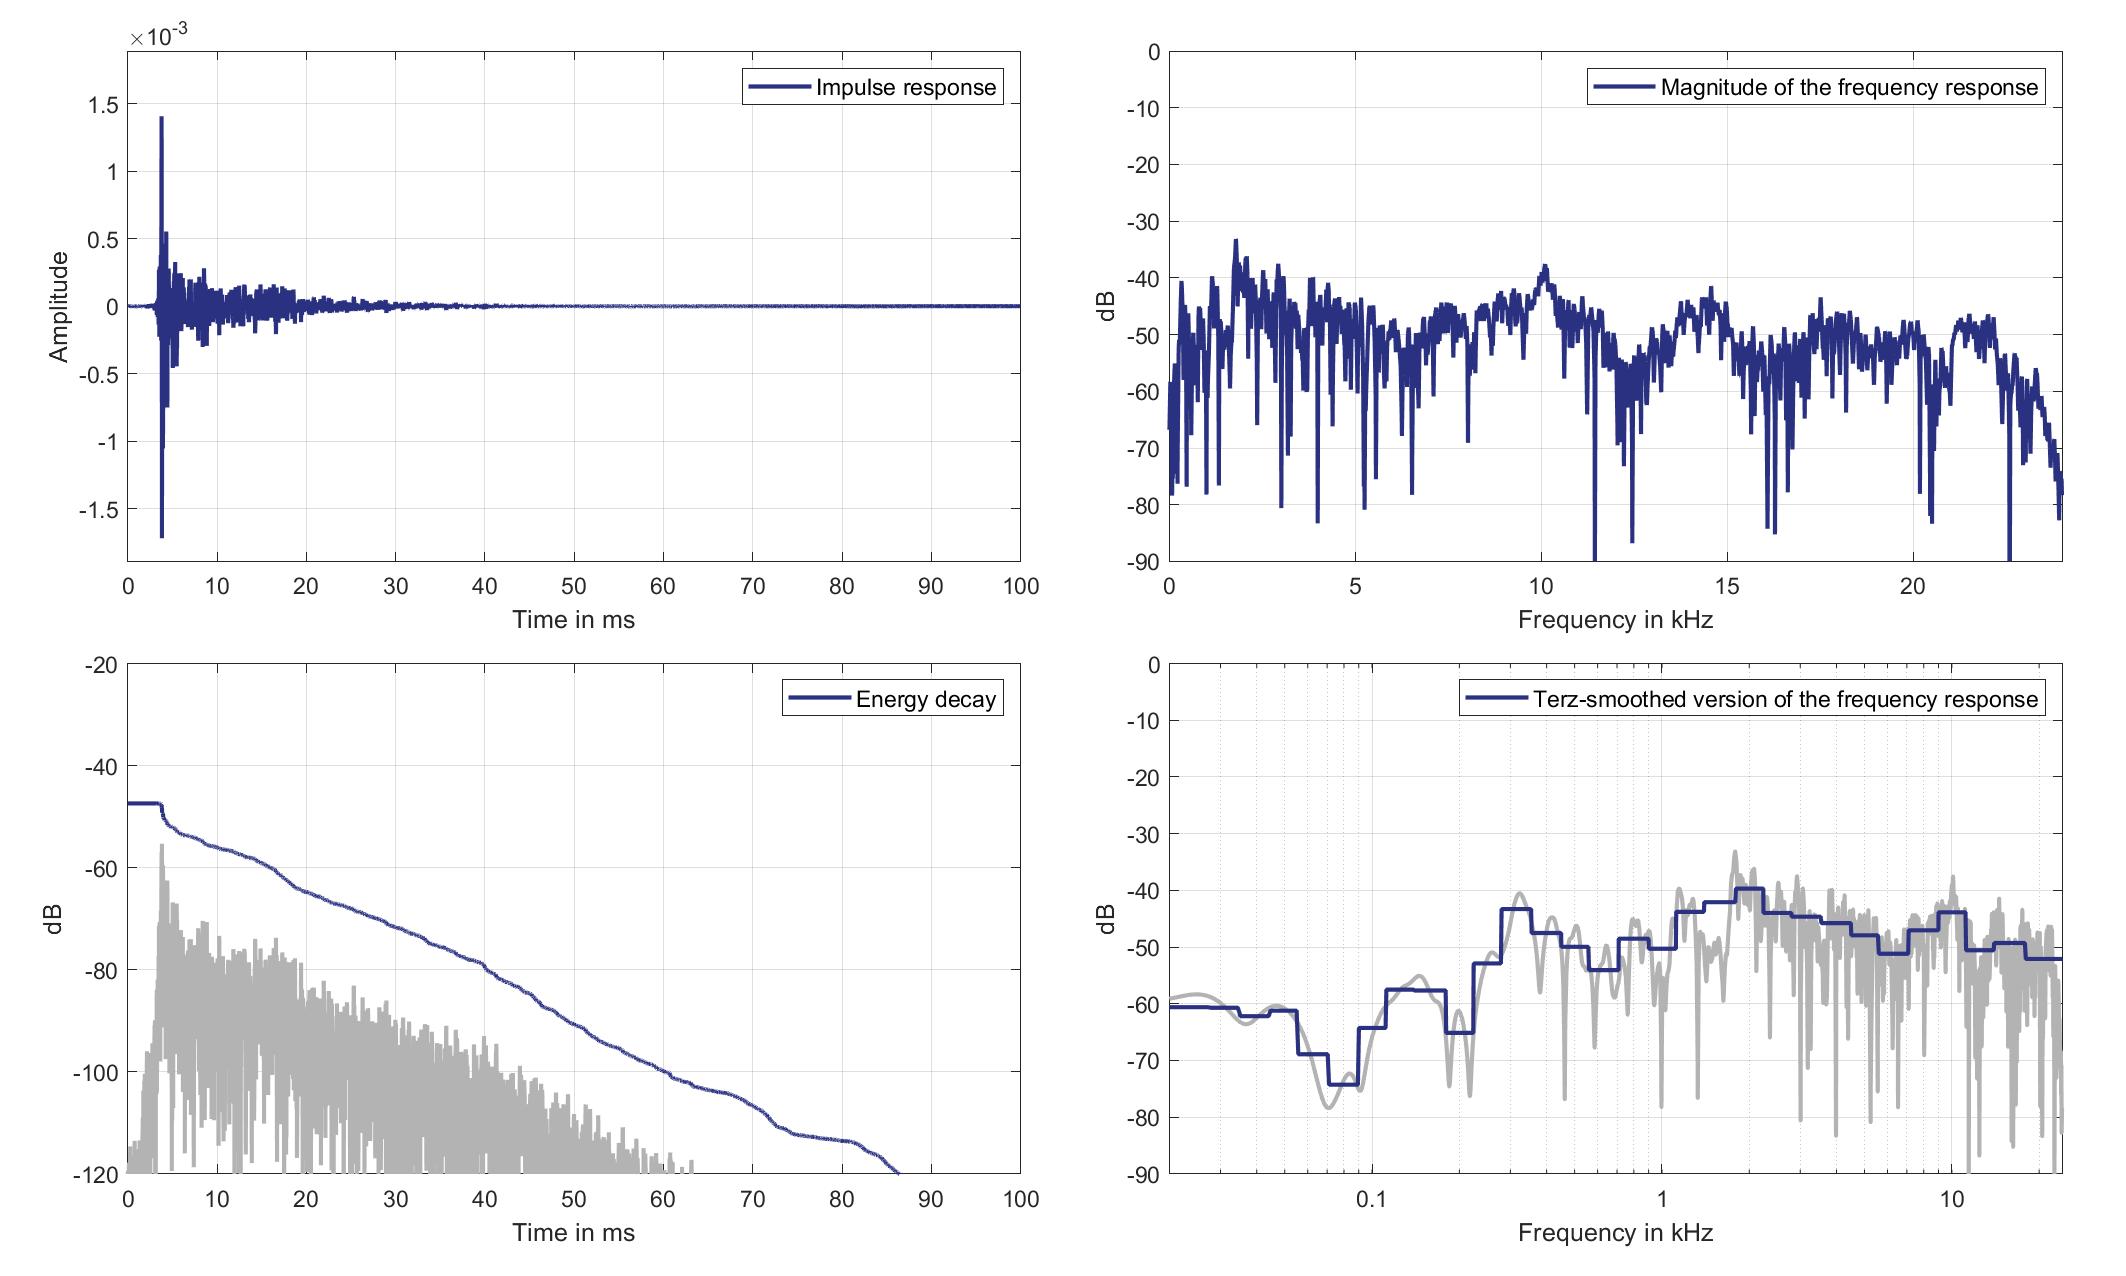
Download impulse response (in ".fir" format).
In the download section you can download all impulse response files as well as format explanation and Matlab as well as Python code examples for loading fir files.
Right lsp. - Right ear mic.
Right Headrest Loudspeaker of Zone 6 (Lsp. 9 to Right Ear Microphone of Zone 5 (Mic. 26)
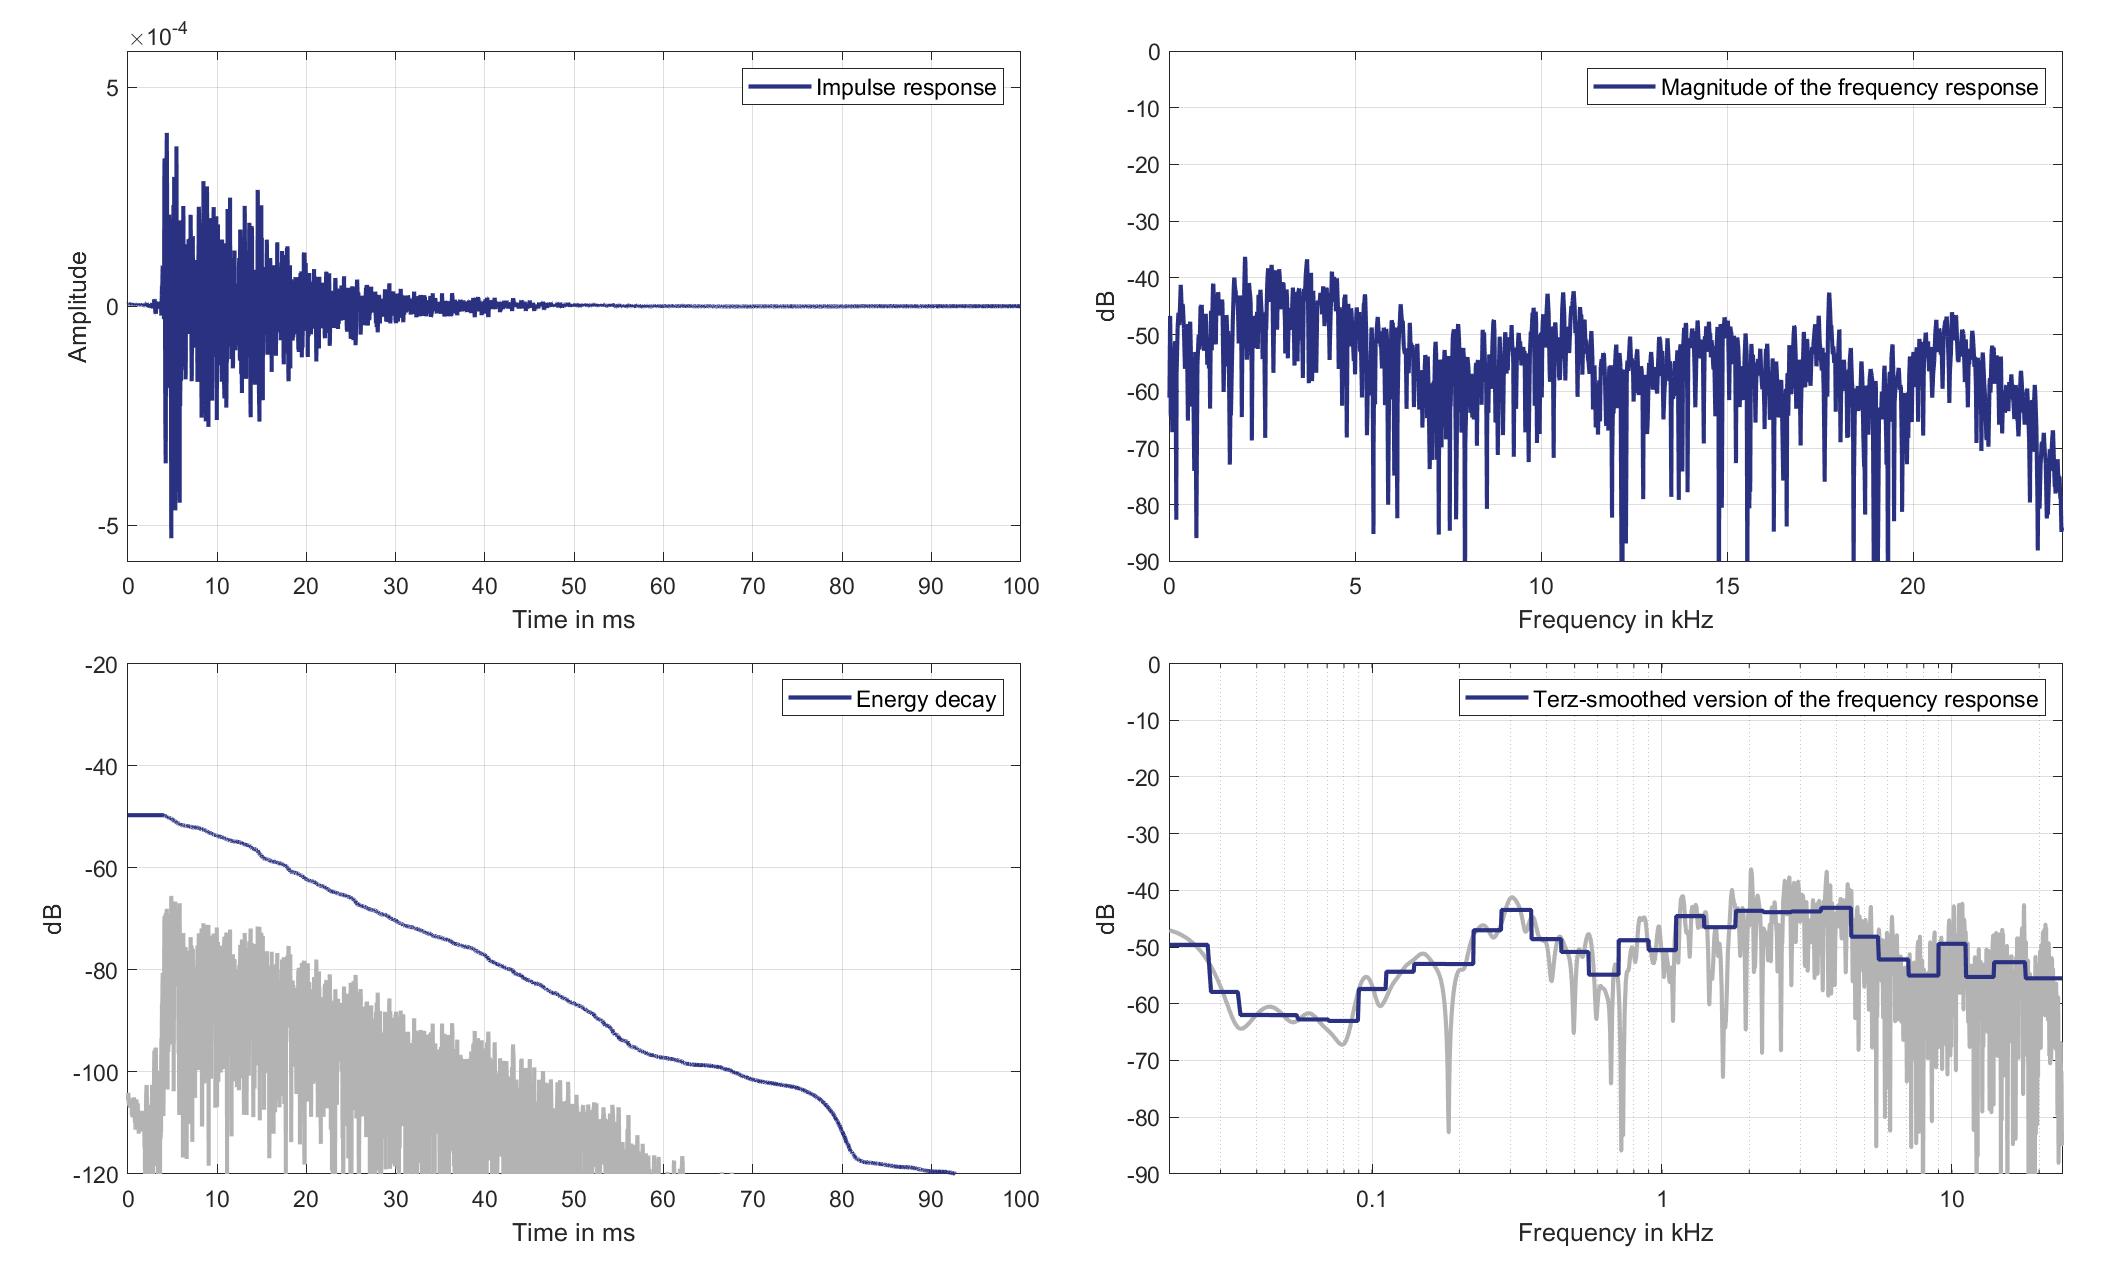
Download impulse response (in ".fir" format).
In the download section you can download all impulse response files as well as format explanation and Matlab as well as Python code examples for loading fir files.
Mics. 27/28
Left lsp. - left ear mic.
Left Headrest Loudspeaker of Zone 6 (Lsp. 8) to Left Ear Microphone of Zone 6 (Mic. 27)
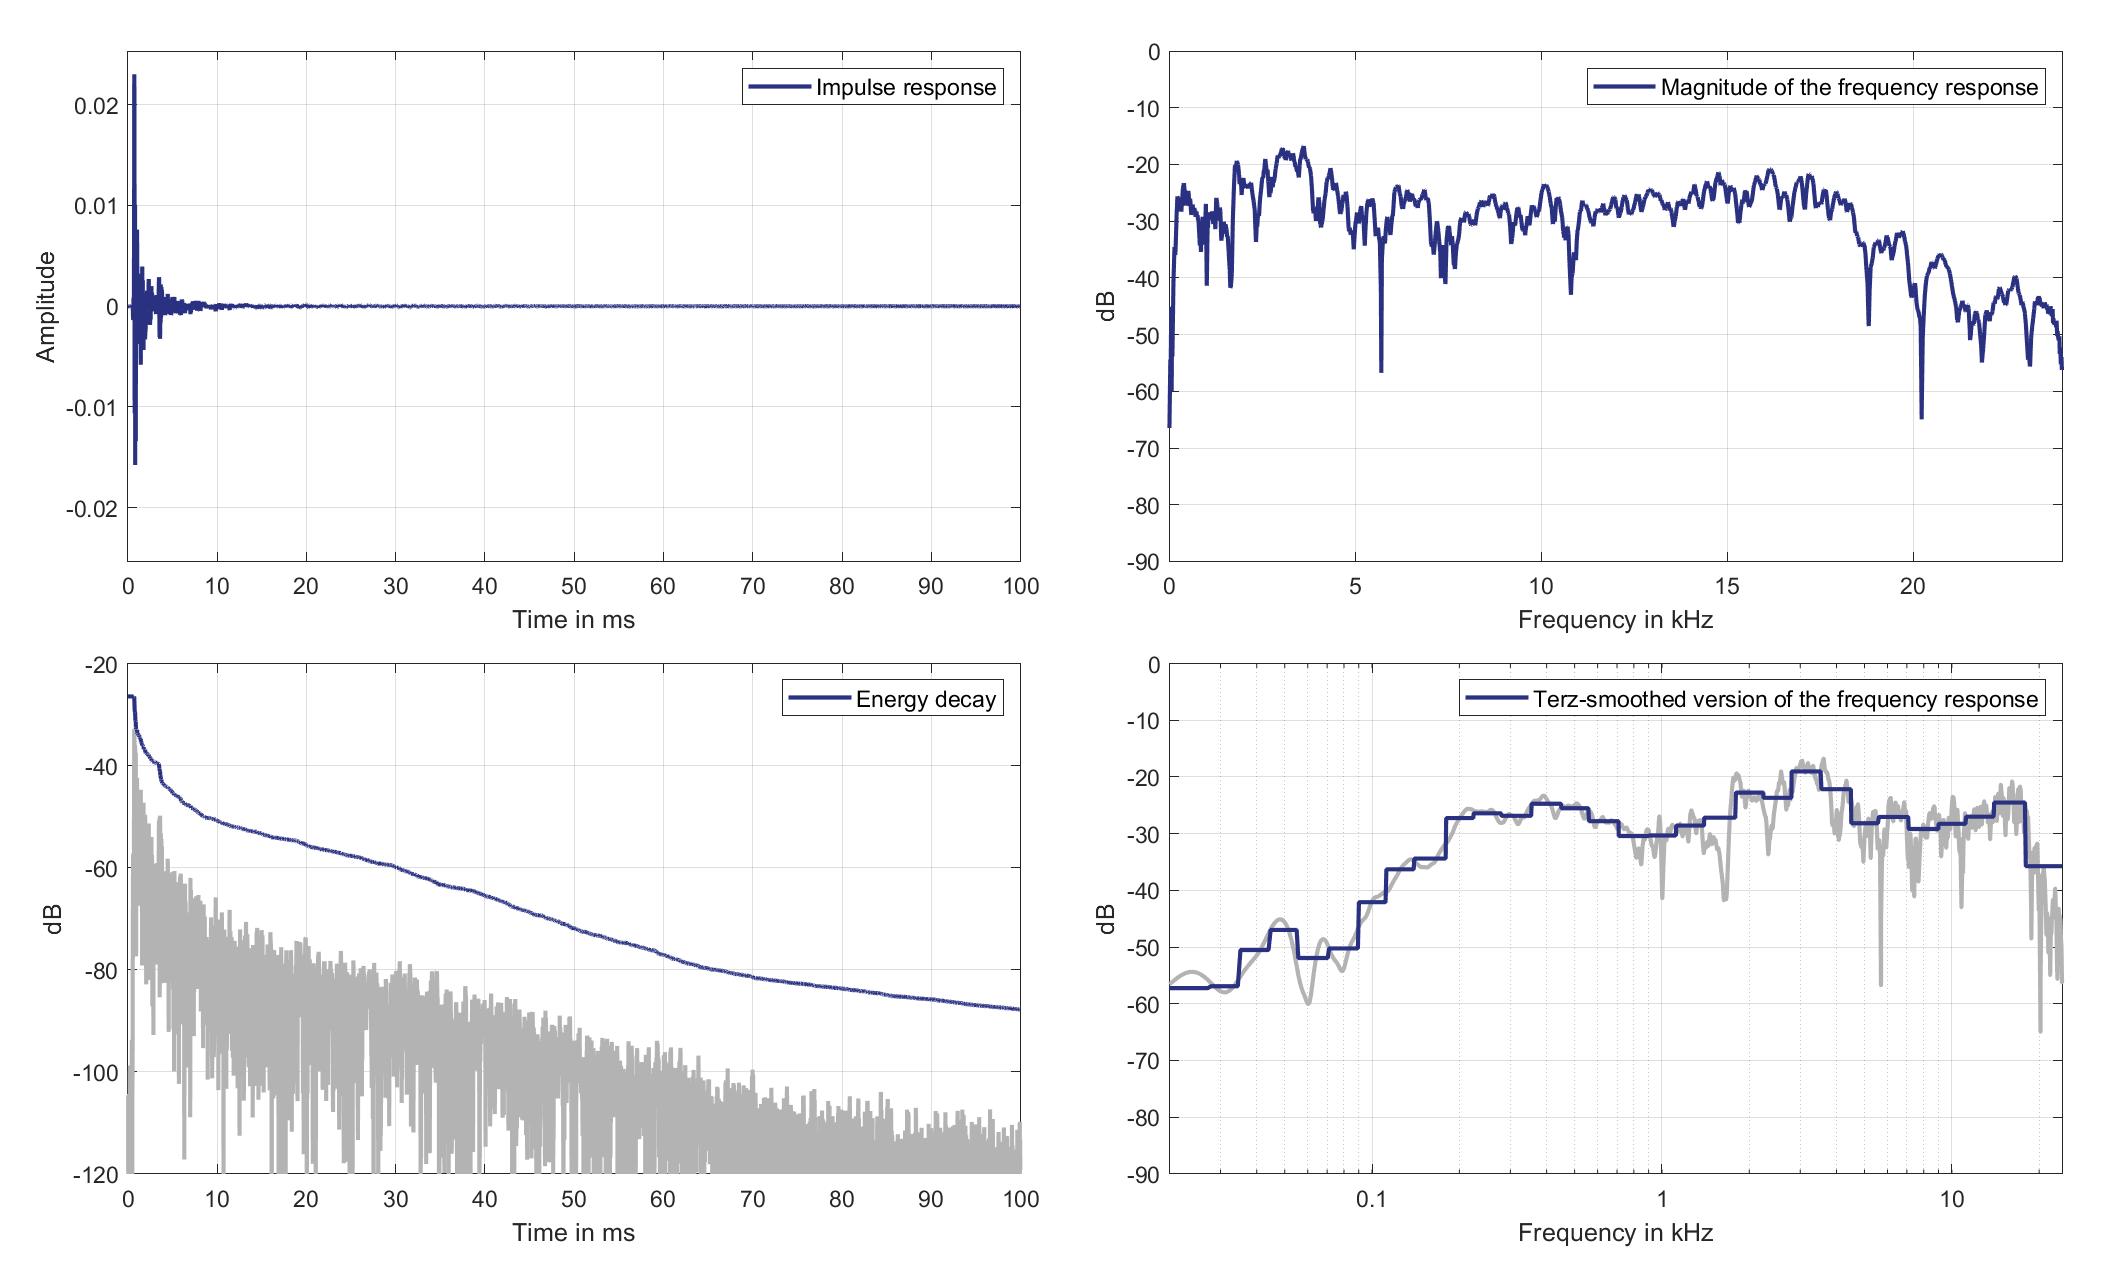
Download impulse response (in ".fir" format).
In the download section you can download all impulse response files as well as format explanation and Matlab as well as Python code examples for loading fir files.
Left lsp. - Right ear mic.
Left Headrest Loudspeaker of Zone 6 (Lsp. 8) to Right Ear Microphone of Zone 6 (Mic. 28)
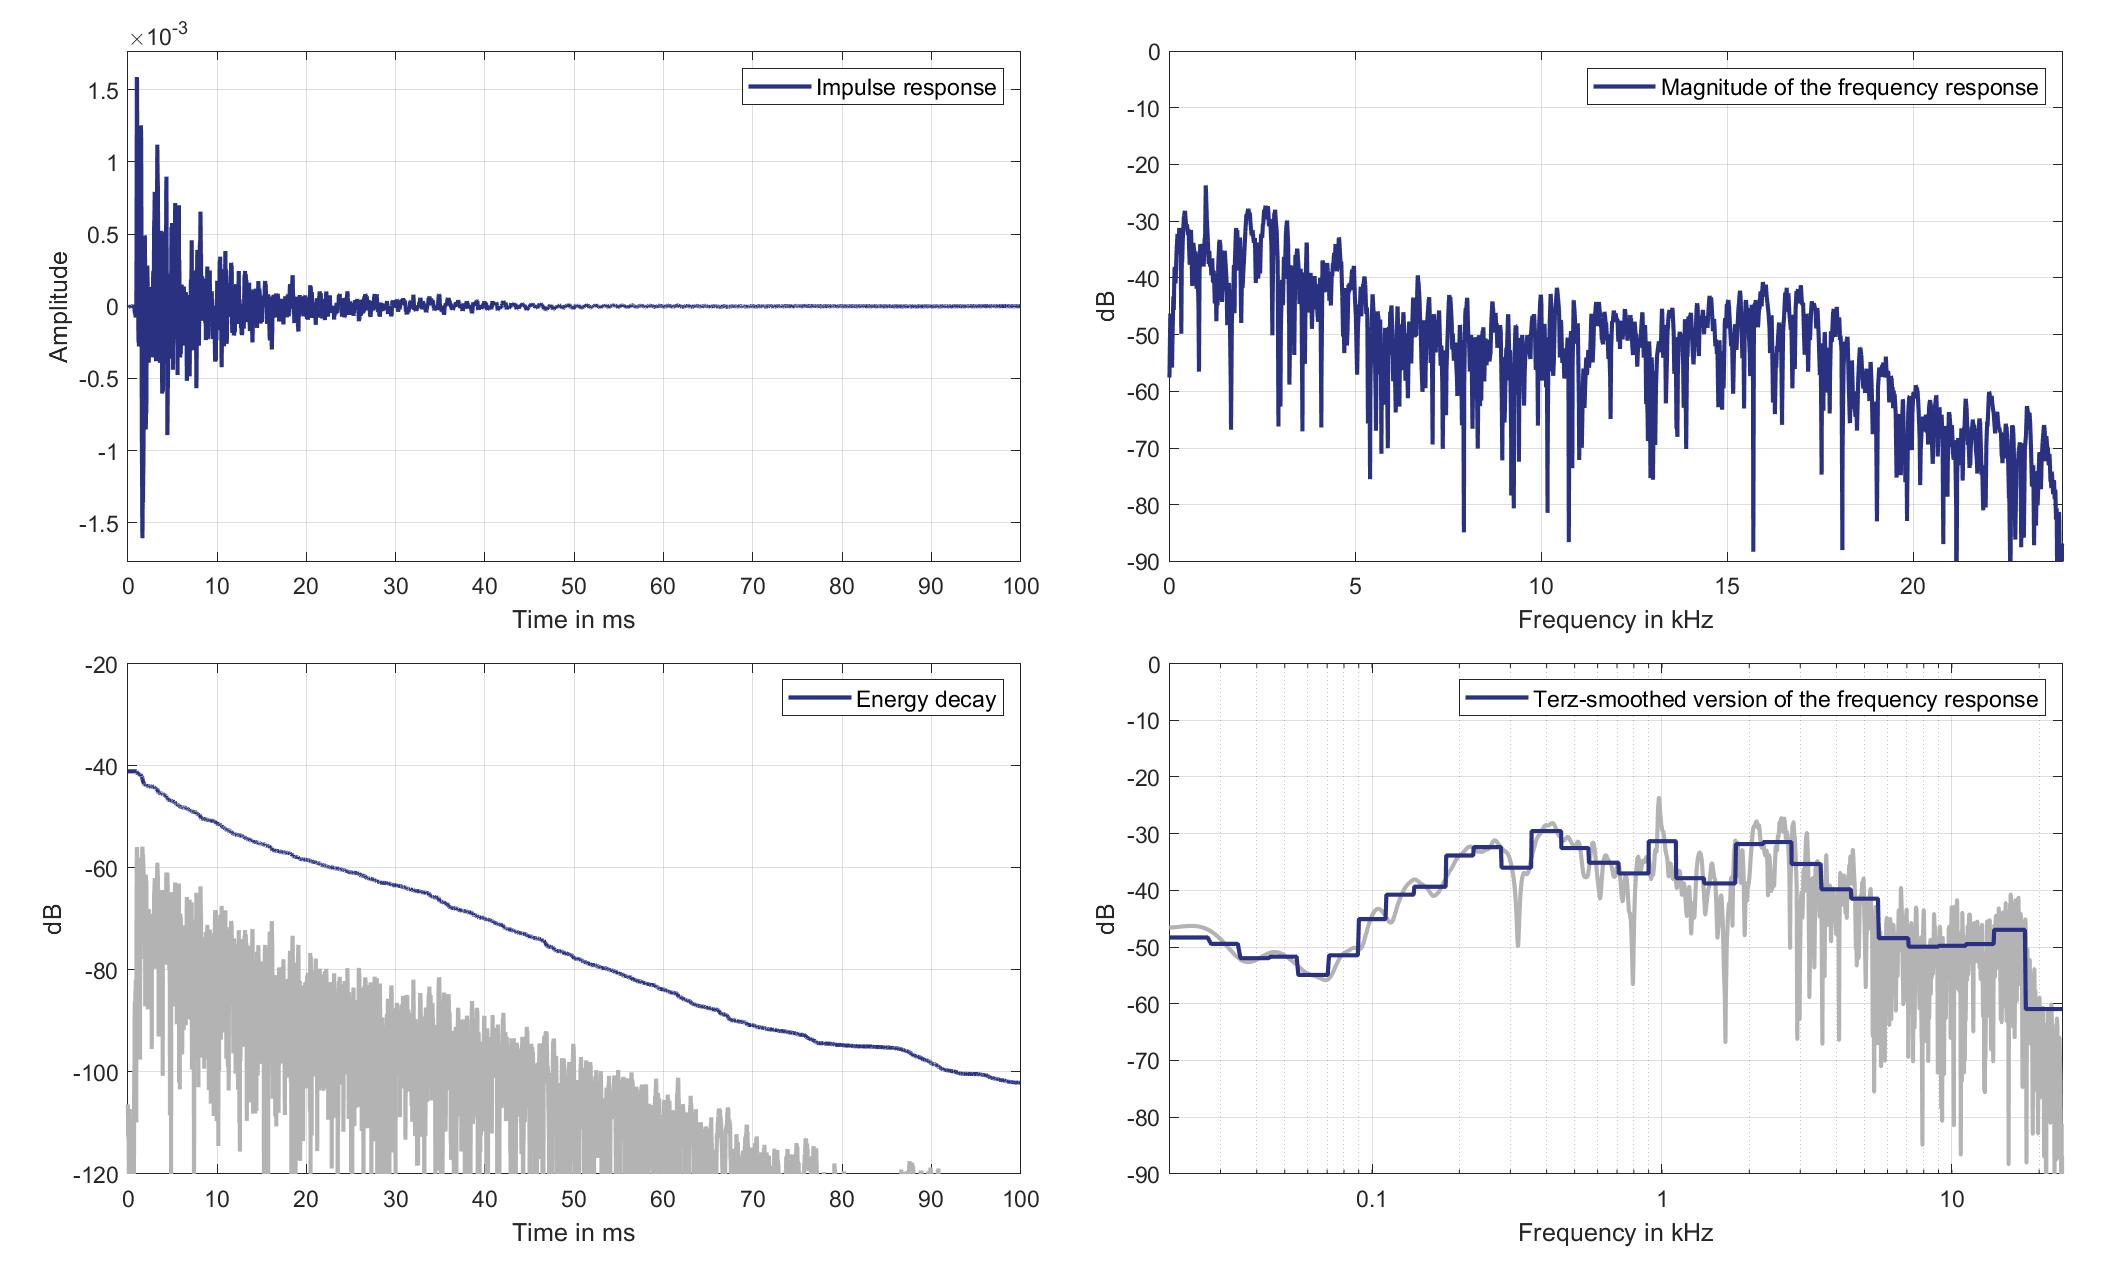
Download impulse response (in ".fir" format).
In the download section you can download all impulse response files as well as format explanation and Matlab as well as Python code examples for loading fir files.
Right lsp. - left ear mic.
Right Headrest Loudspeaker of Zone 6 (Lsp. 9) to Left Ear Microphone of Zone 6 (Mic. 27)
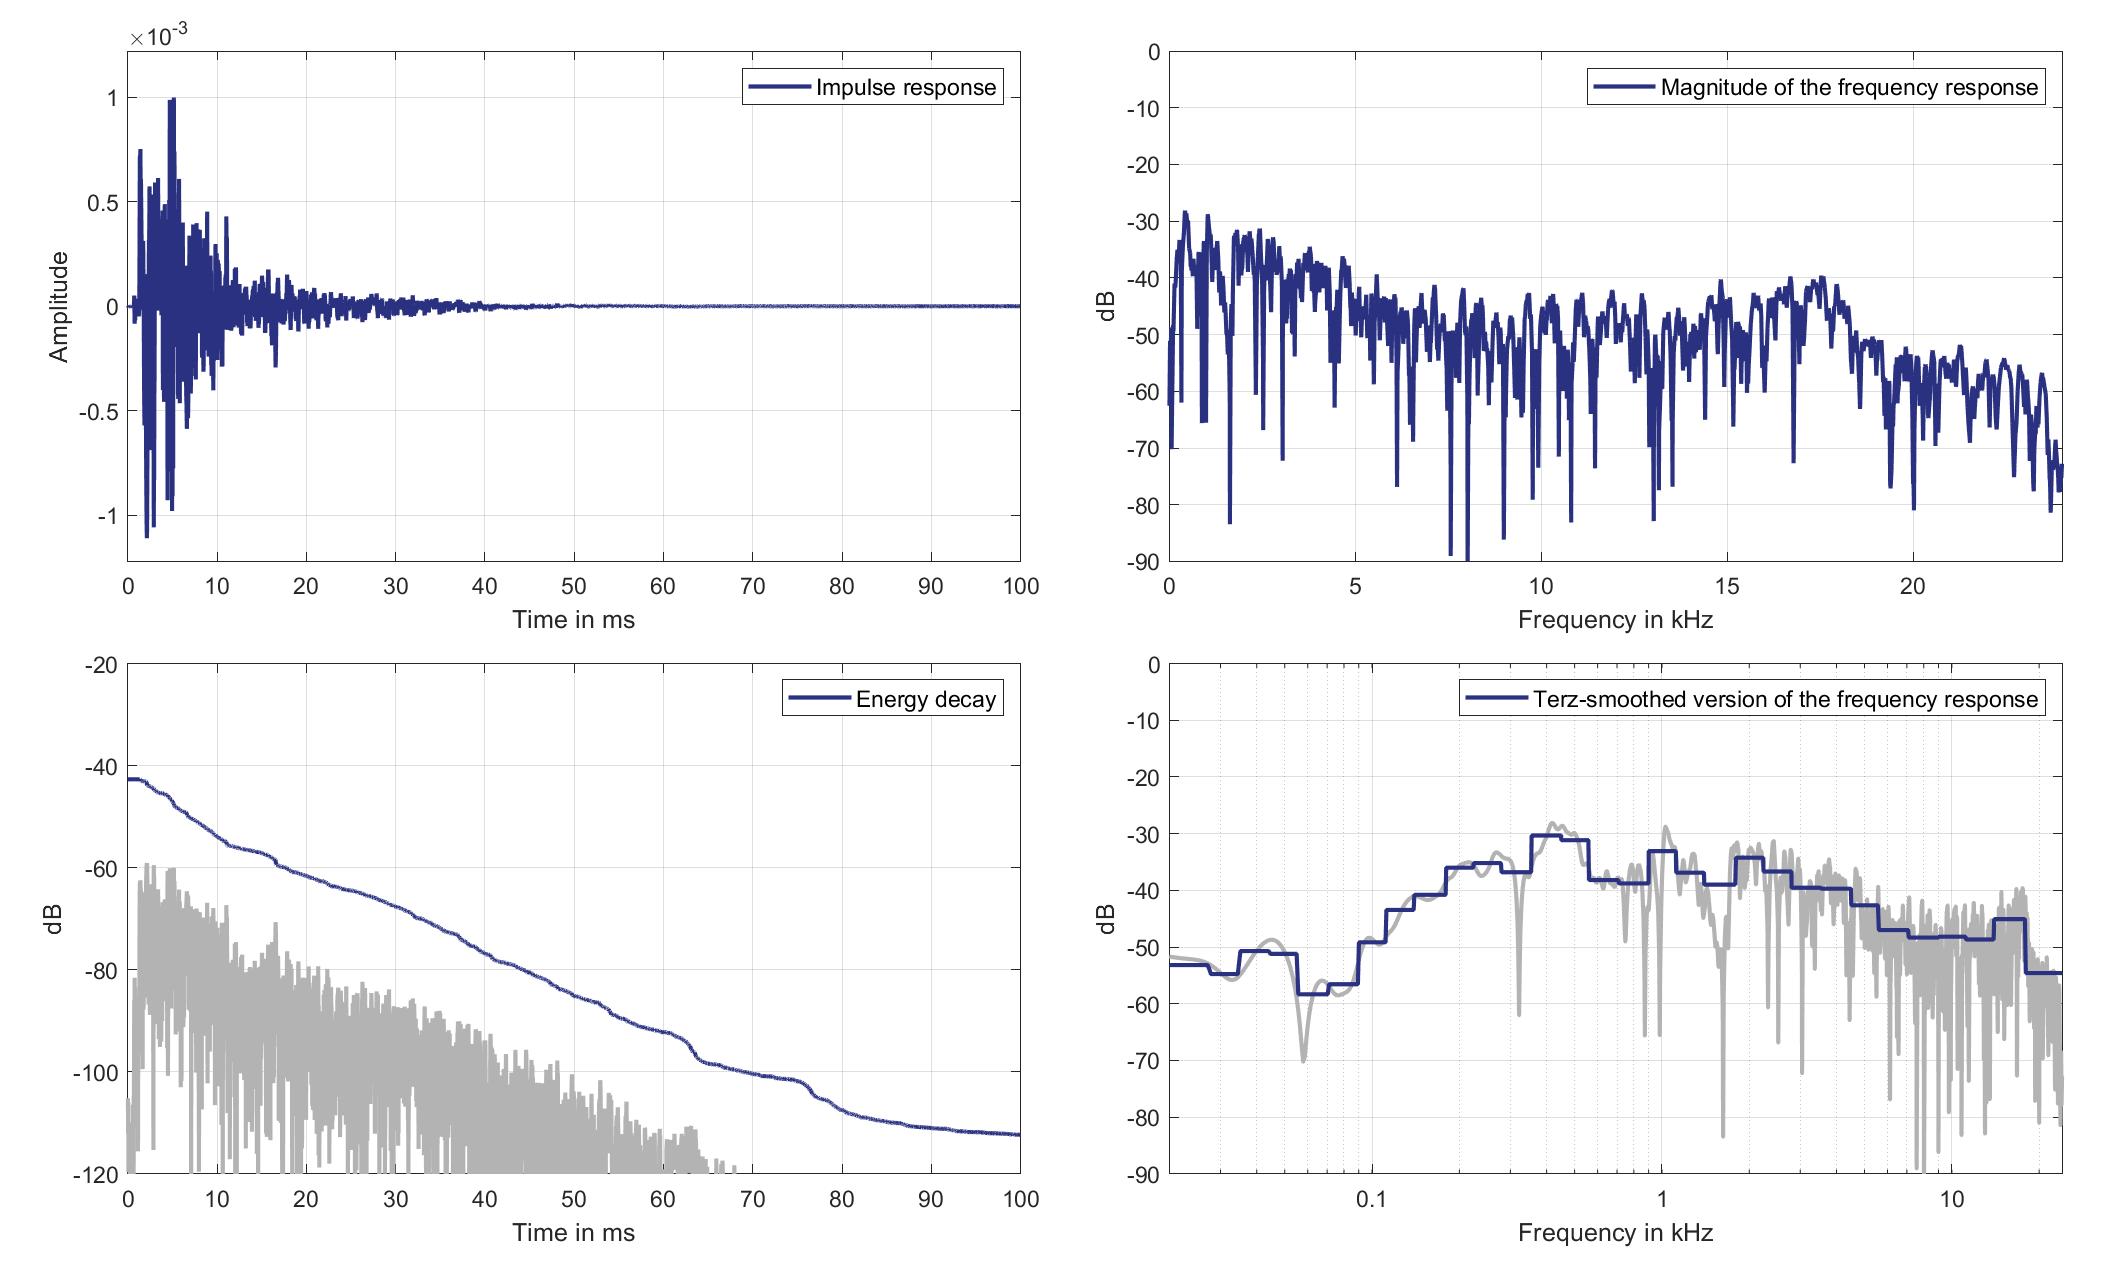
Download impulse response (in ".fir" format).
In the download section you can download all impulse response files as well as format explanation and Matlab as well as Python code examples for loading fir files.
Right lsp. - Right ear mic.
Right Headrest Loudspeaker of Zone 6 (Lsp. 9 to Right Ear Microphone of Zone 6 (Mic. 28)
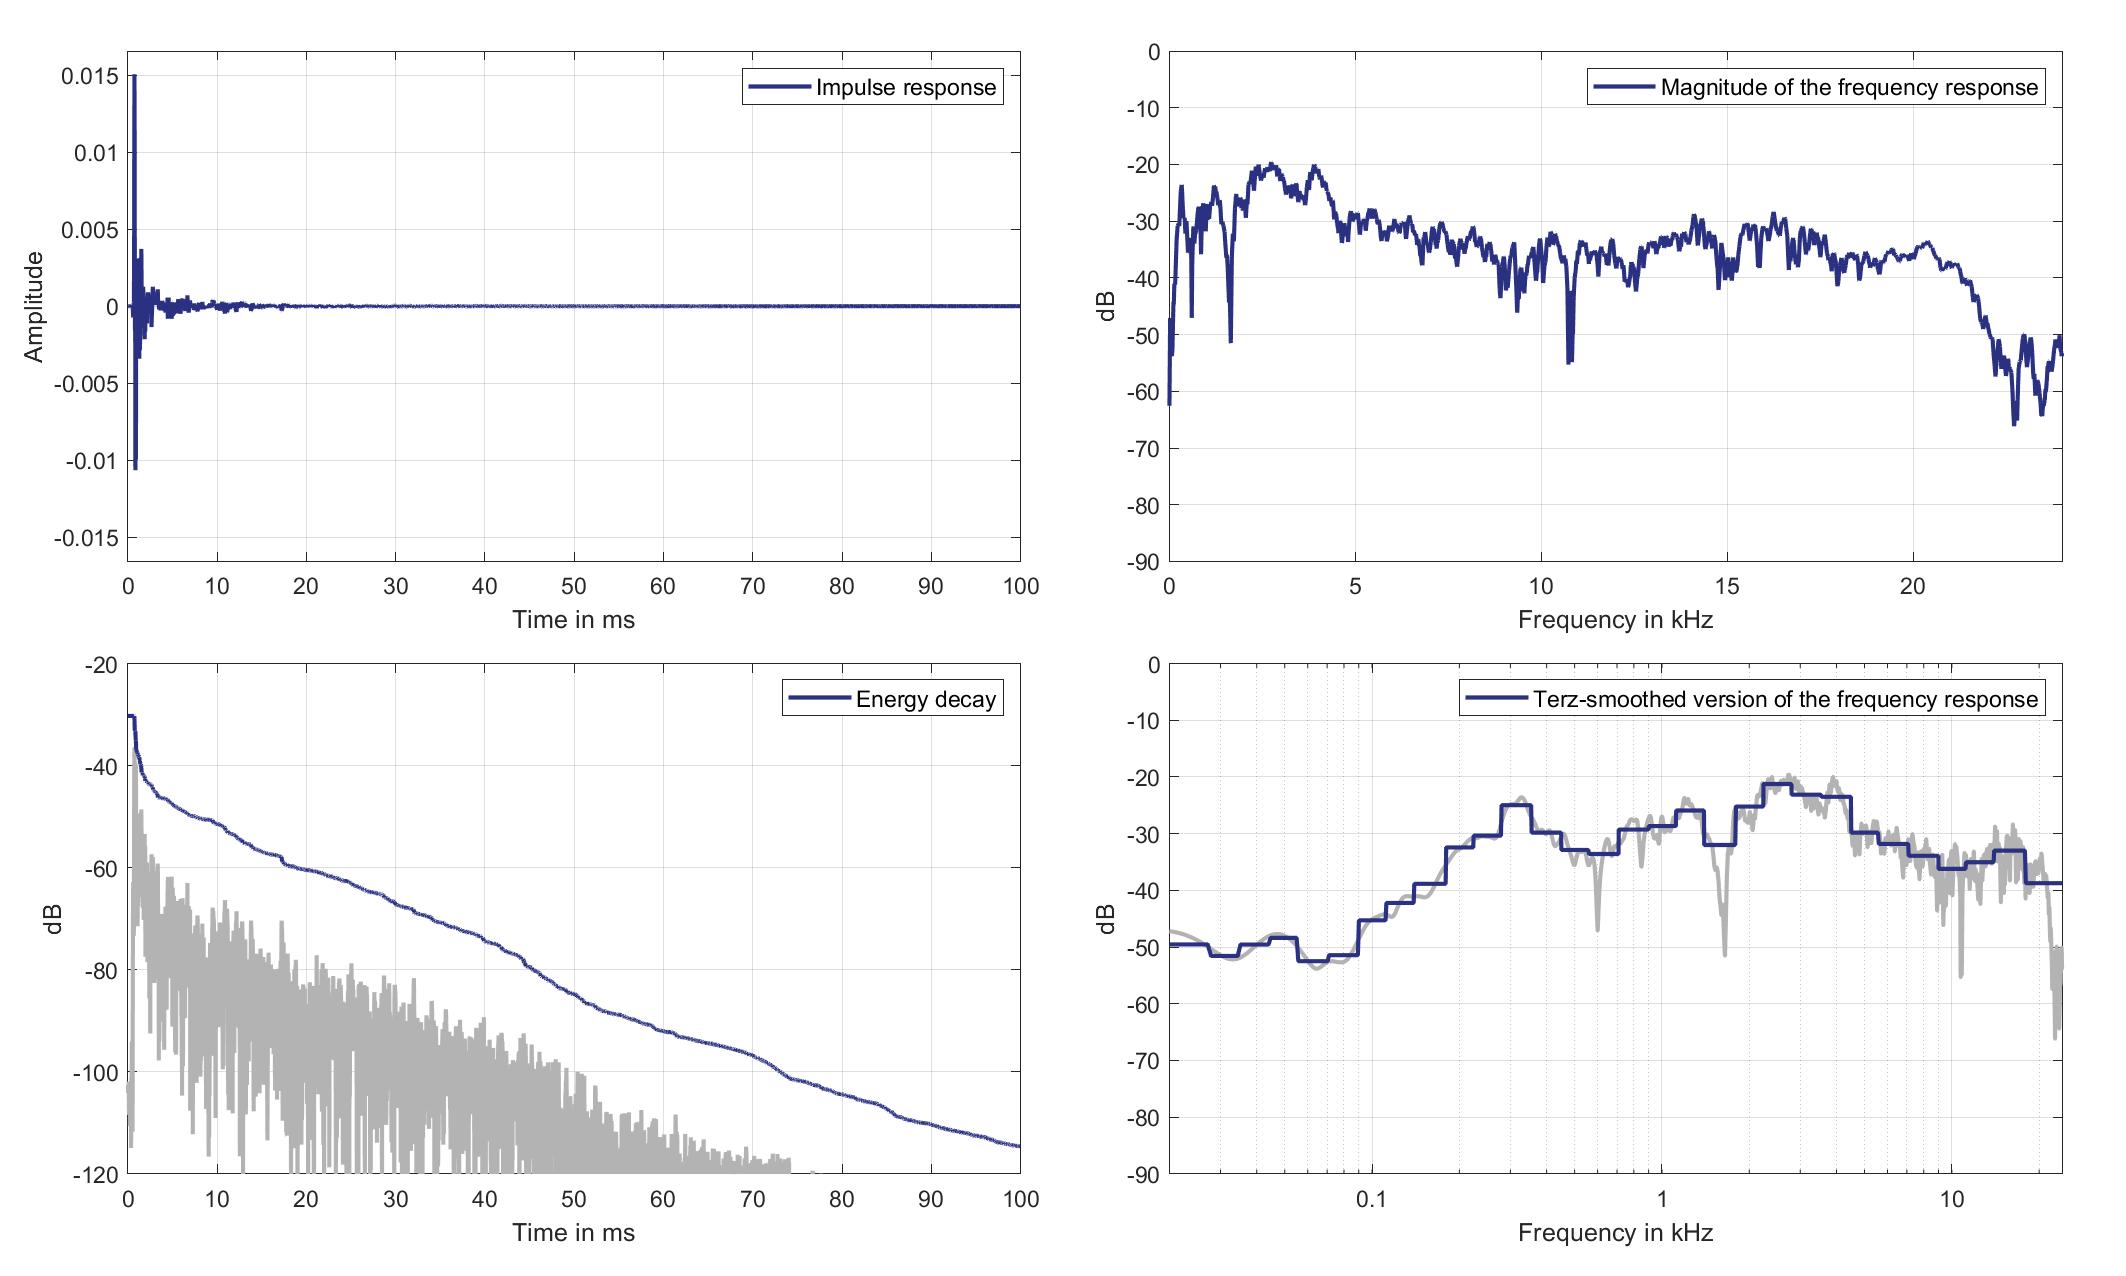
Download impulse response (in ".fir" format).
In the download section you can download all impulse response files as well as format explanation and Matlab as well as Python code examples for loading fir files.
Mics. 29/30
Left lsp. - left ear mic.
Left Headrest Loudspeaker of Zone 6 (Lsp. 8) to Left Ear Microphone of Zone 8 (Mic. 29)
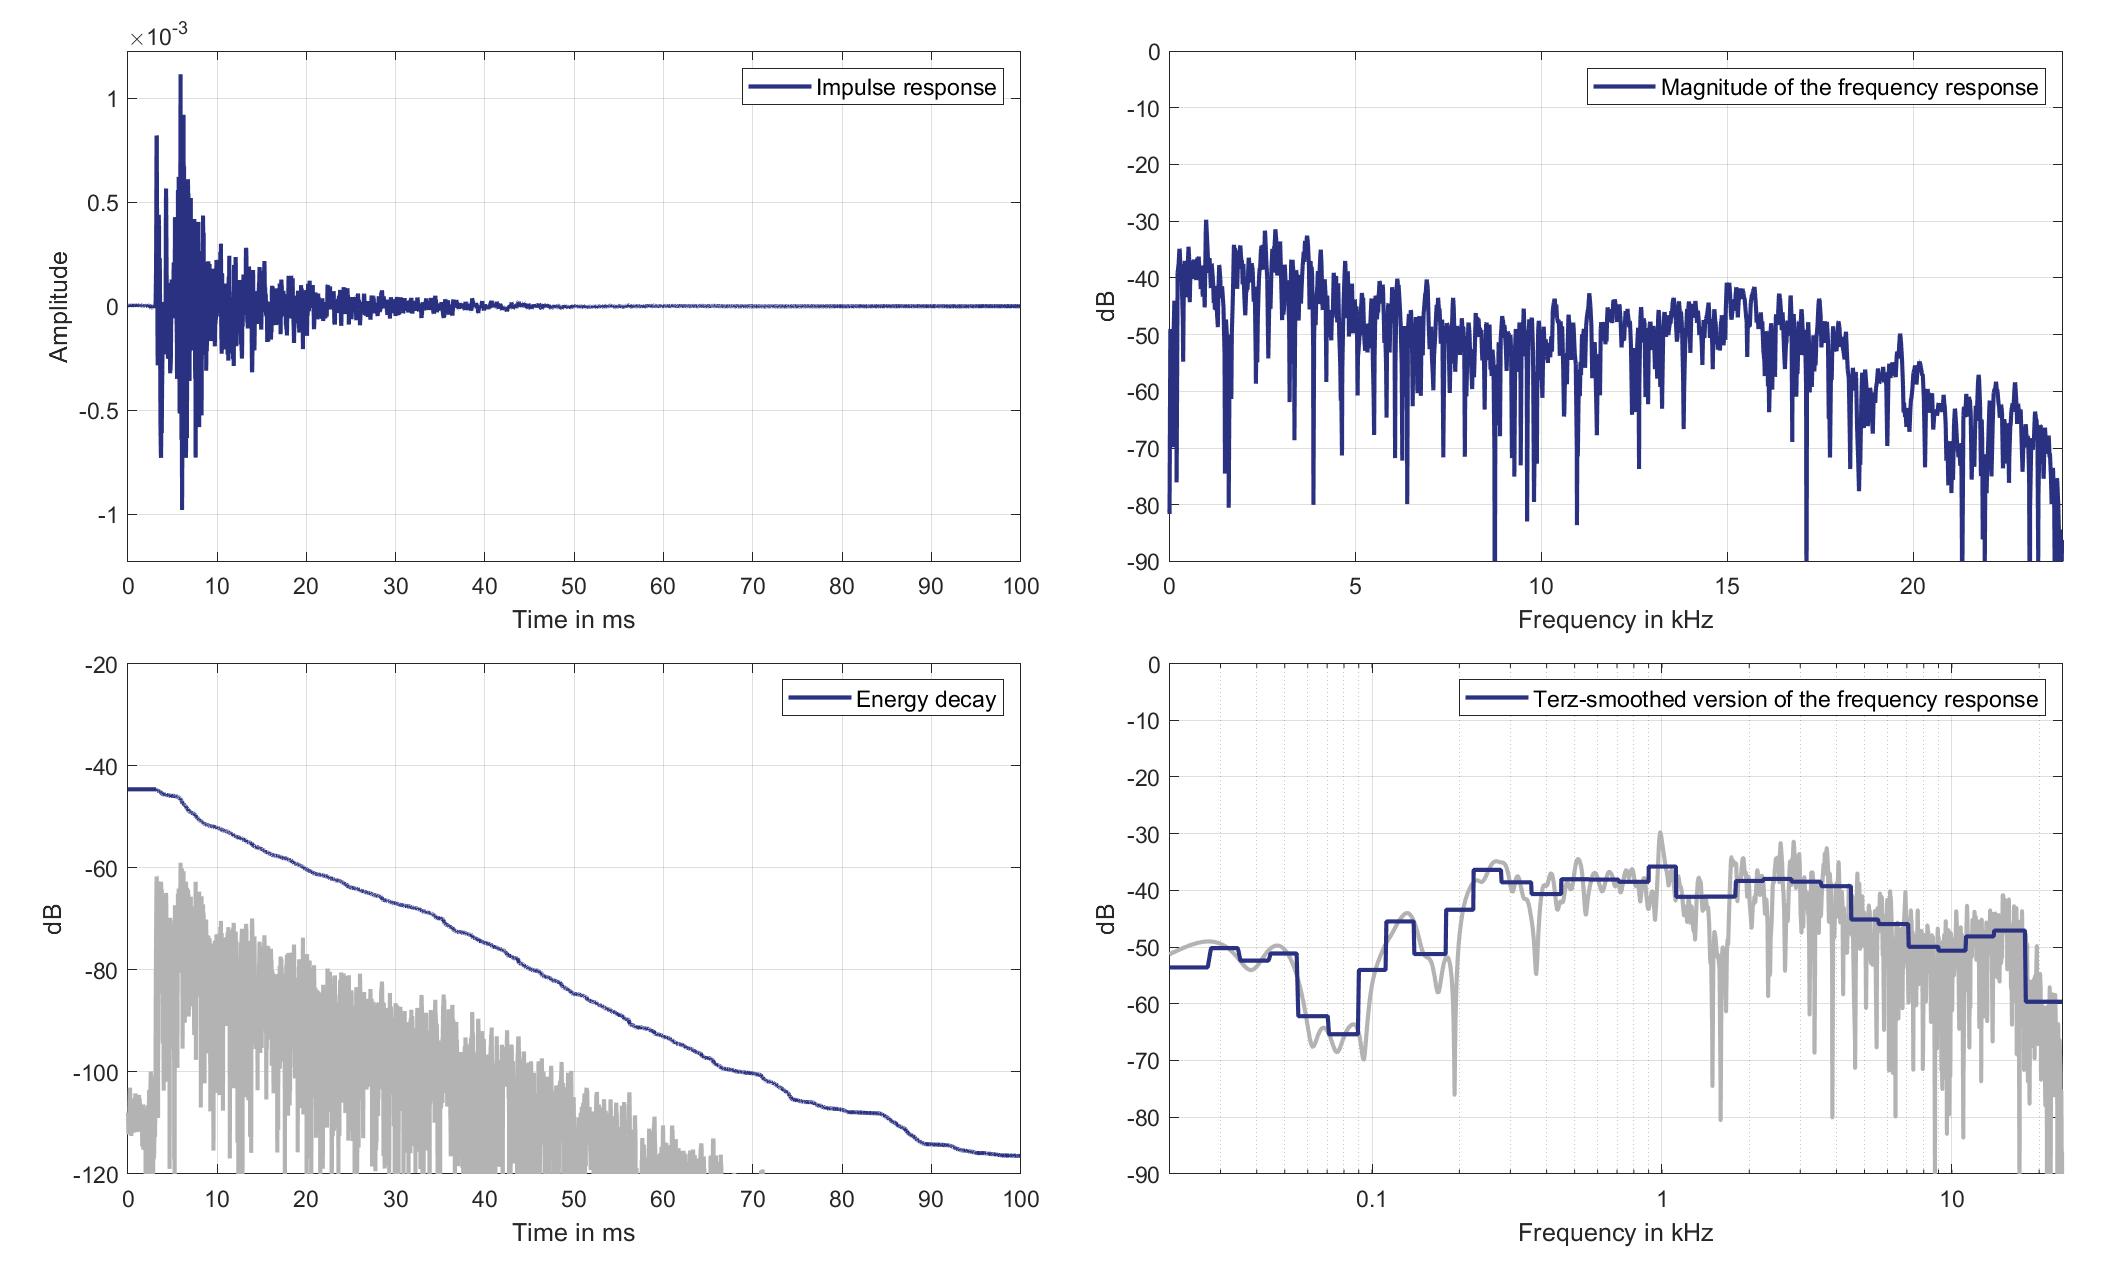
Download impulse response (in ".fir" format).
In the download section you can download all impulse response files as well as format explanation and Matlab as well as Python code examples for loading fir files.
Left lsp. - Right ear mic.
Left Headrest Loudspeaker of Zone 6 (Lsp. 8) to Right Ear Microphone of Zone 8 (Mic. 30)
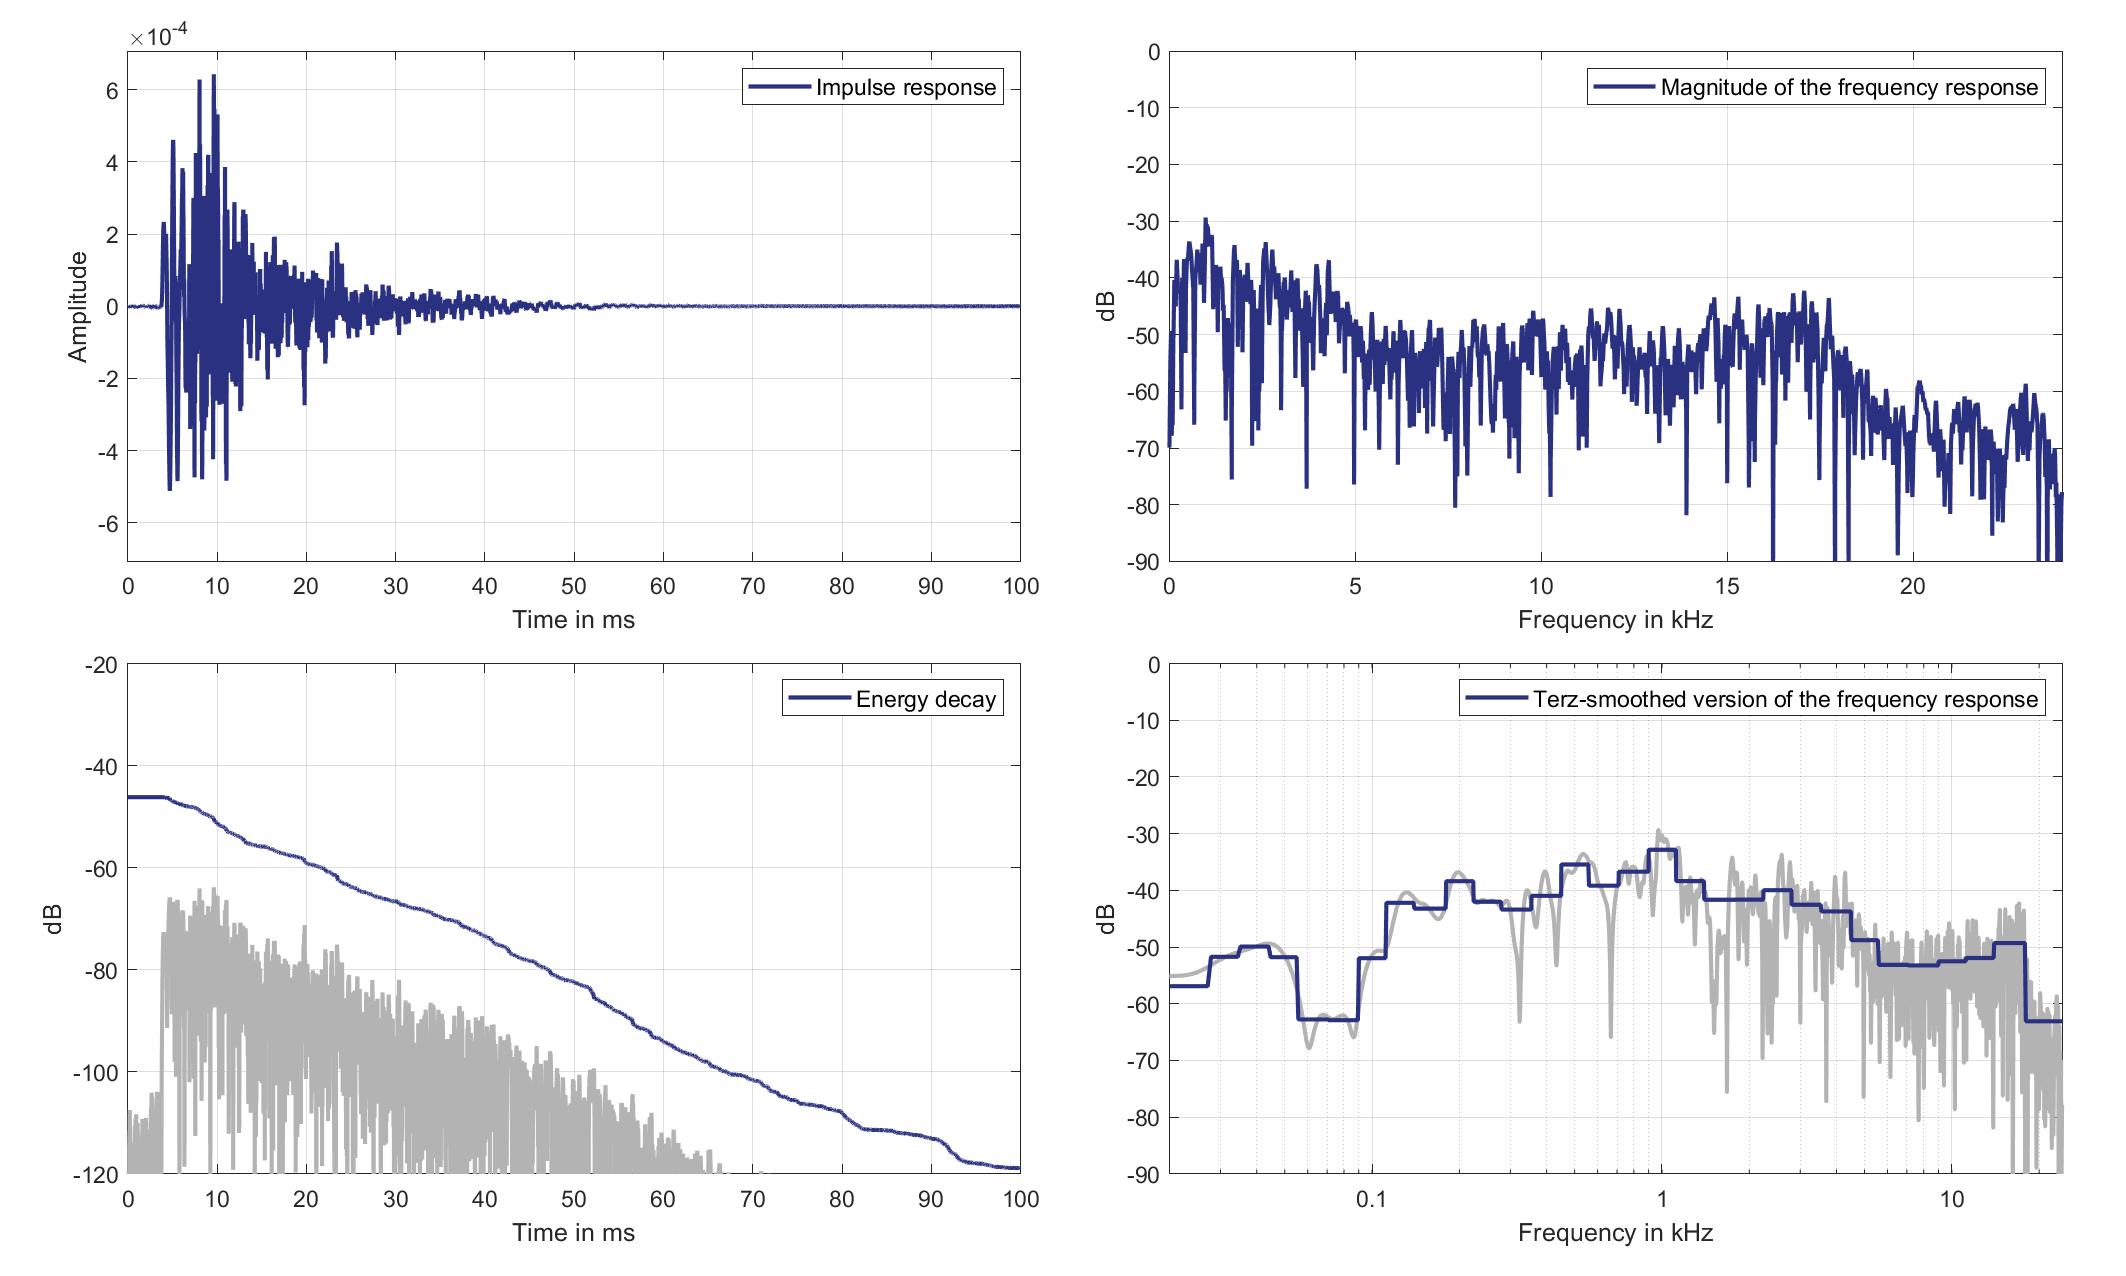
Download impulse response (in ".fir" format).
In the download section you can download all impulse response files as well as format explanation and Matlab as well as Python code examples for loading fir files.
Right lsp. - left ear mic.
Right Headrest Loudspeaker of Zone 6 (Lsp. 9) to Left Ear Microphone of Zone 8 (Mic. 29)
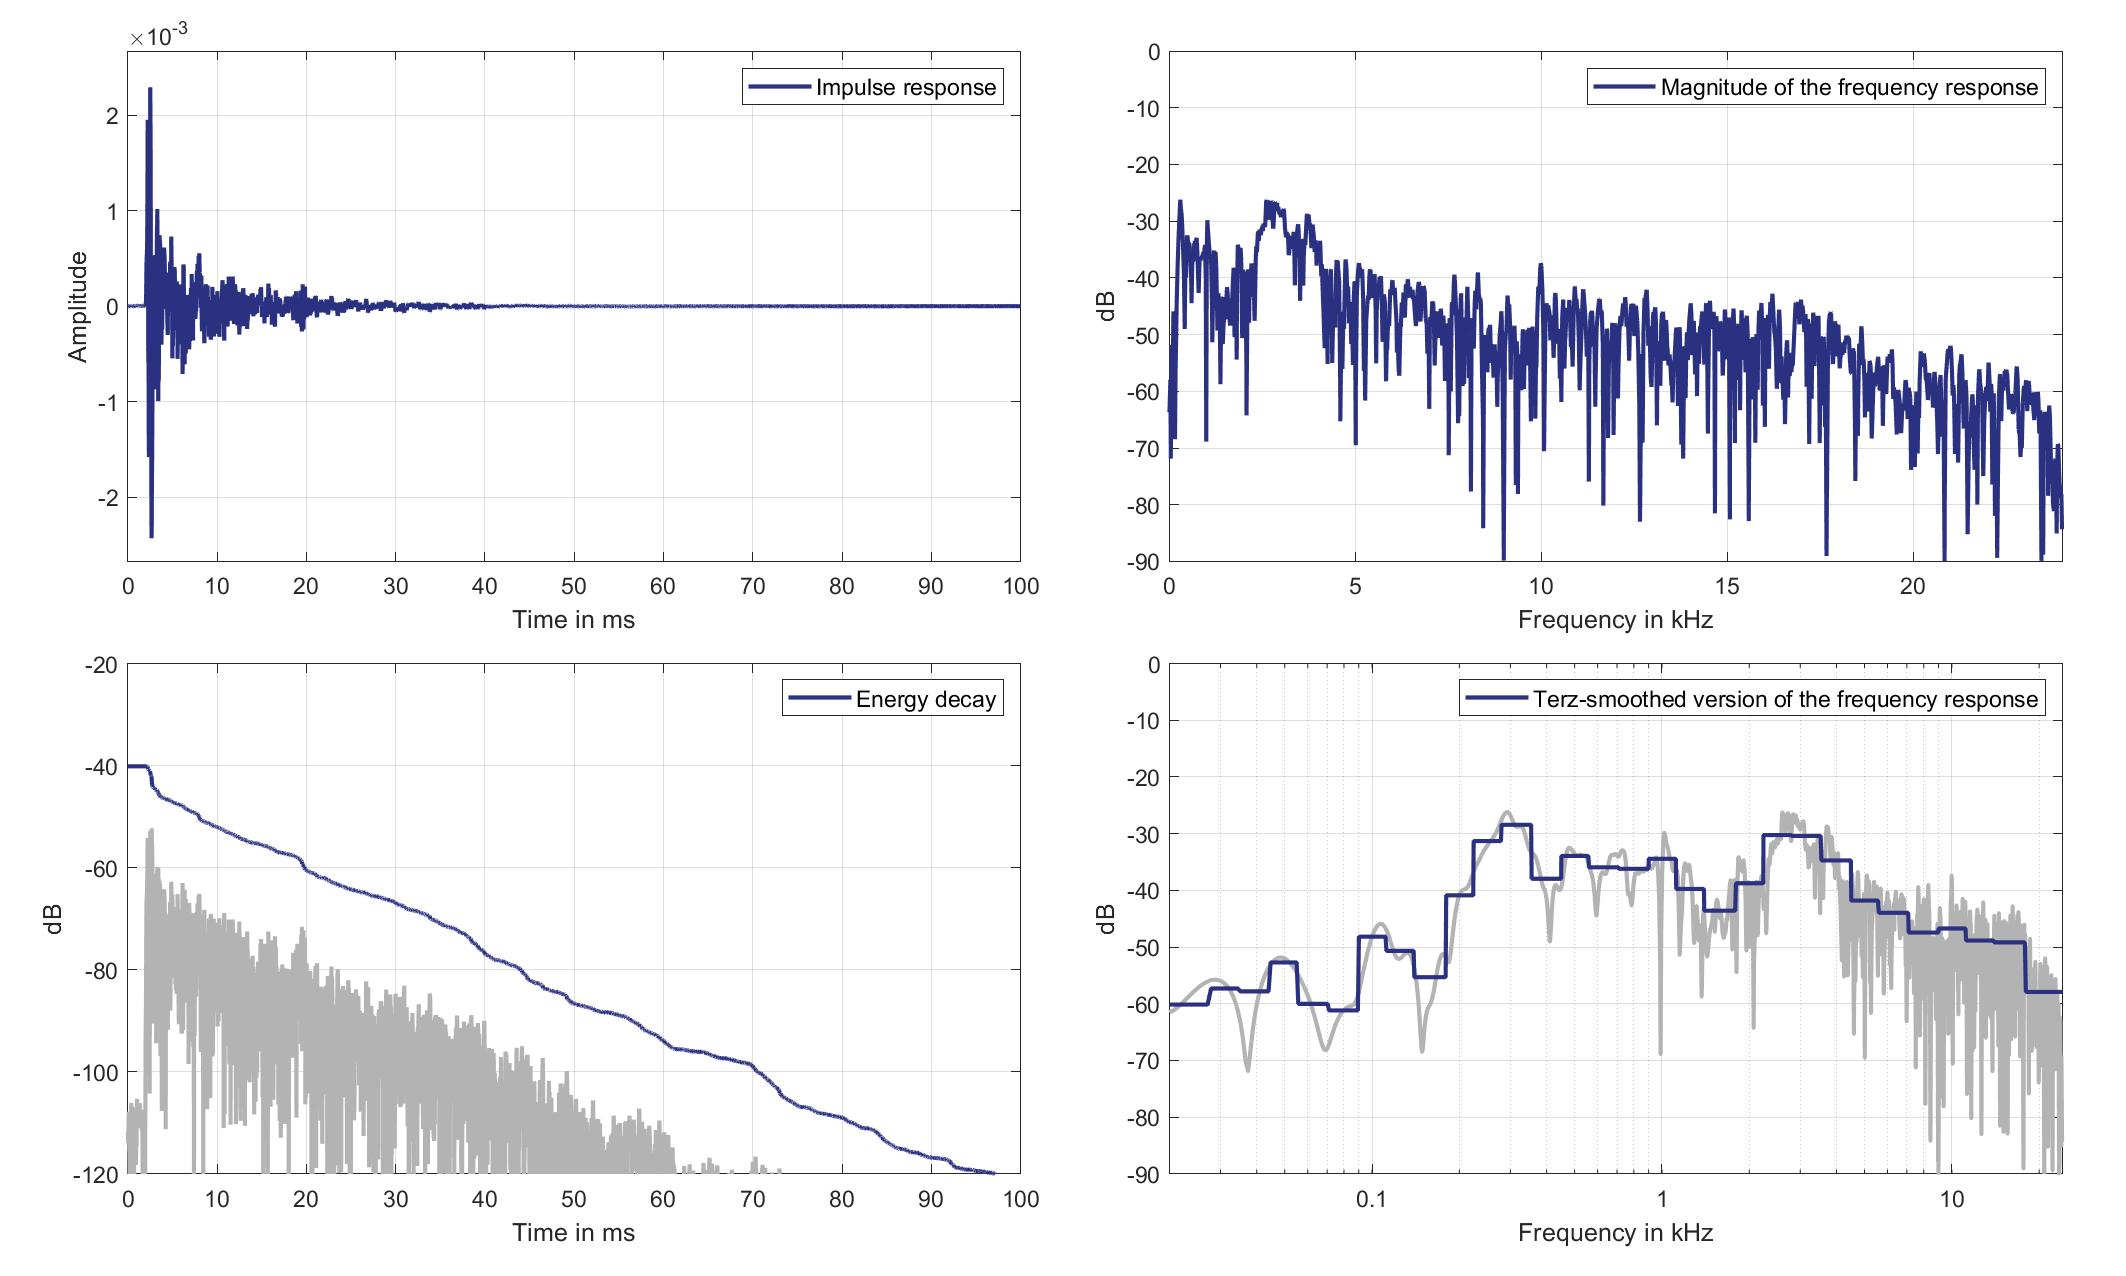
Download impulse response (in ".fir" format).
In the download section you can download all impulse response files as well as format explanation and Matlab as well as Python code examples for loading fir files.
Right lsp. - Right ear mic.
Right Headrest Loudspeaker of Zone 6 (Lsp. 9 to Right Ear Microphone of Zone 8 (Mic. 30)
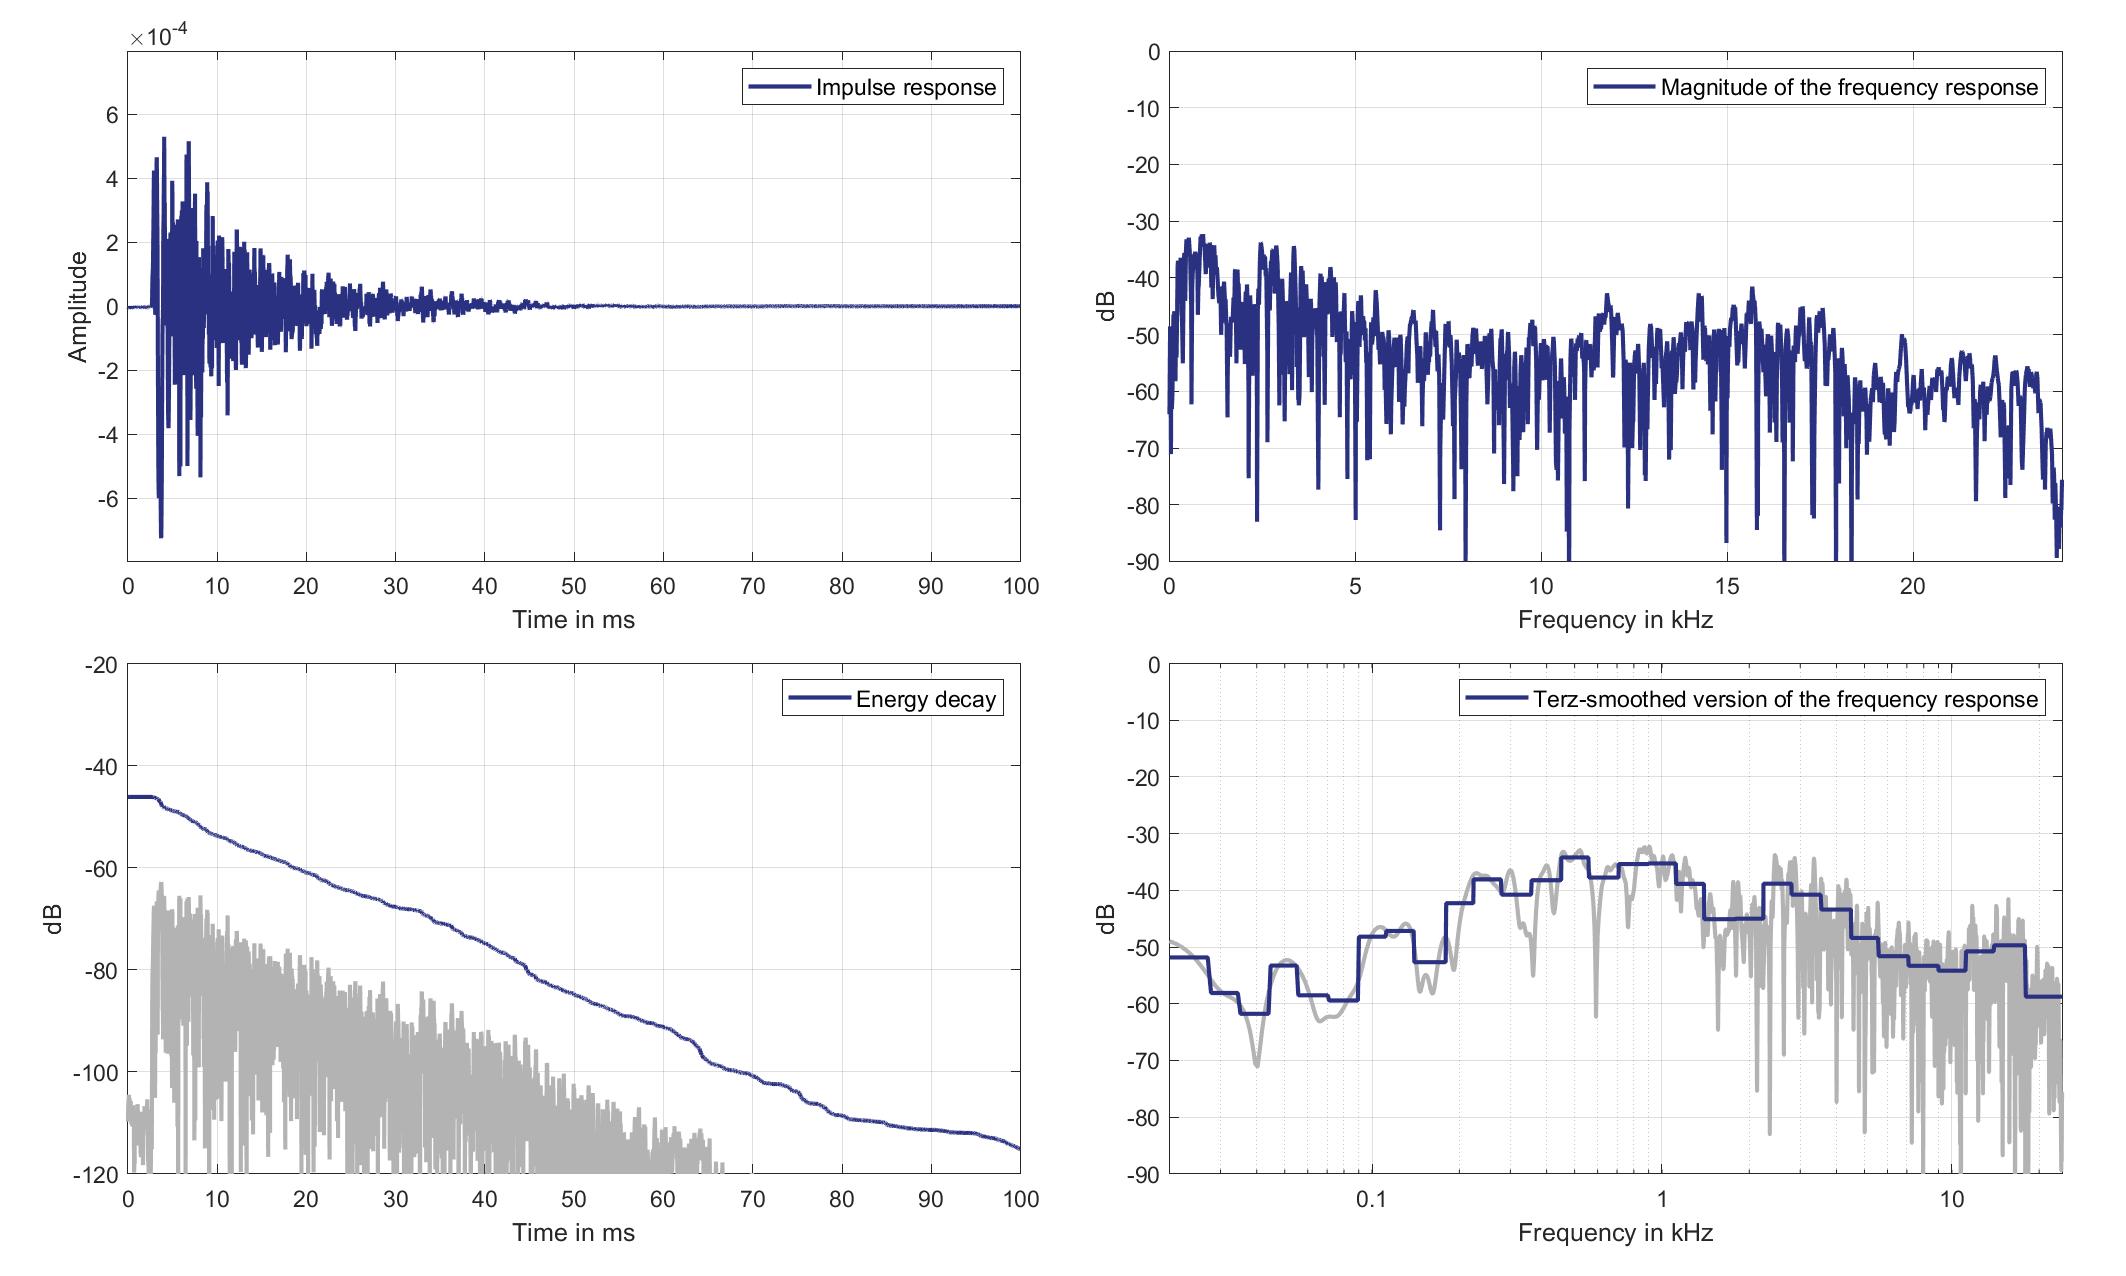
Download impulse response (in ".fir" format).
In the download section you can download all impulse response files as well as format explanation and Matlab as well as Python code examples for loading fir files.
Lsps. 10/11
Mics. 19/20
Left lsp. - left ear mic.
Left Headrest Loudspeaker of Zone 8 (Lsp. 10) to Left Ear Microphone of Zone 1 (Mic. 19)
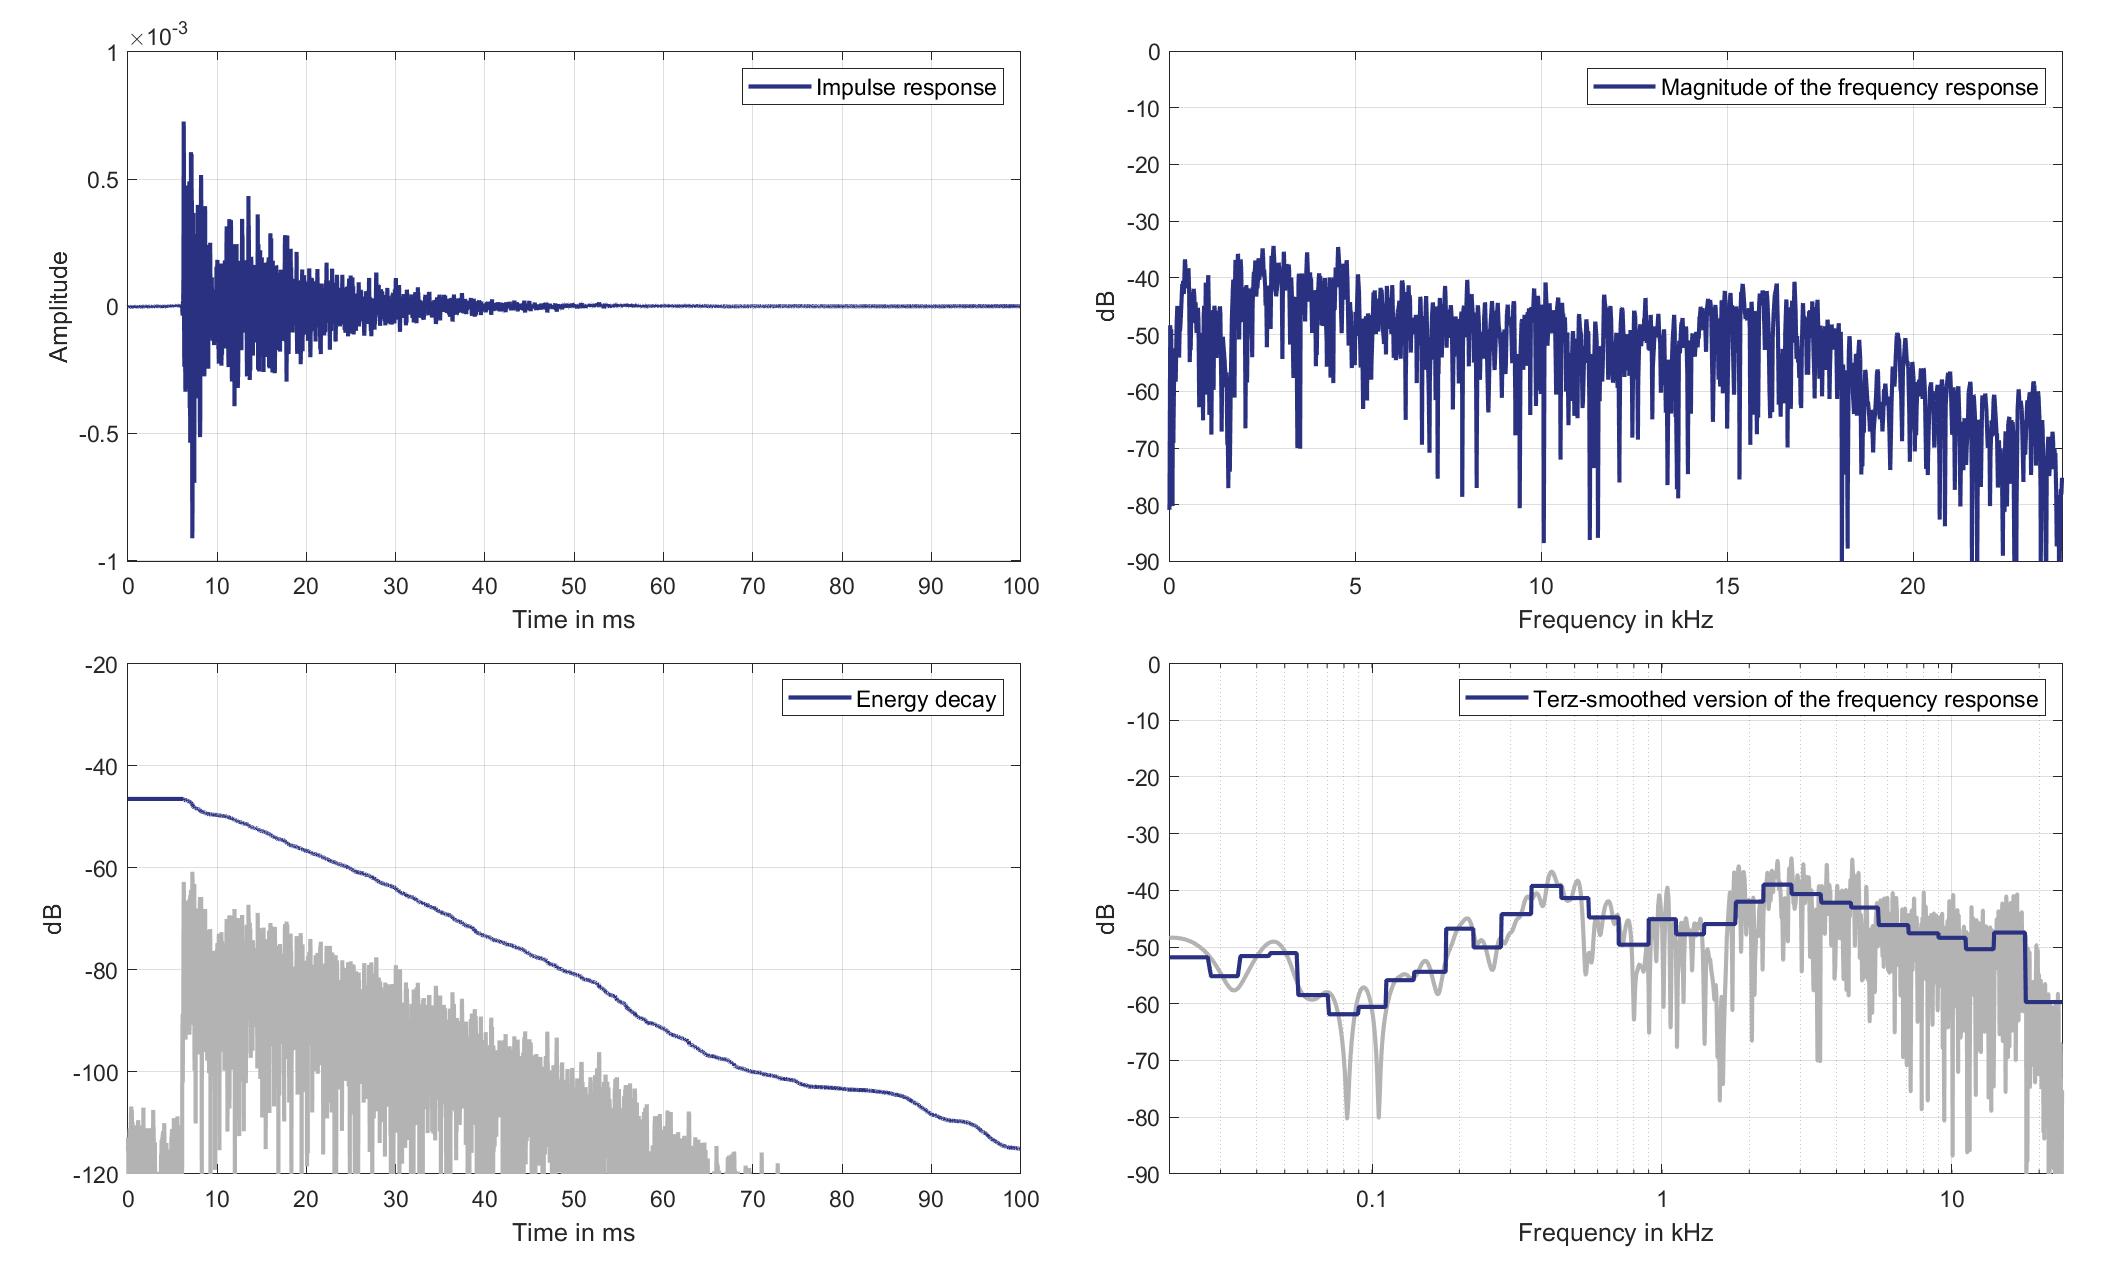
Download impulse response (in ".fir" format).
In the download section you can download all impulse response files as well as format explanation and Matlab as well as Python code examples for loading fir files.
Left lsp. - Right ear mic.
Left Headrest Loudspeaker of Zone 8 (Lsp. 10) to Right Ear Microphone of Zone 1 (Mic. 20)
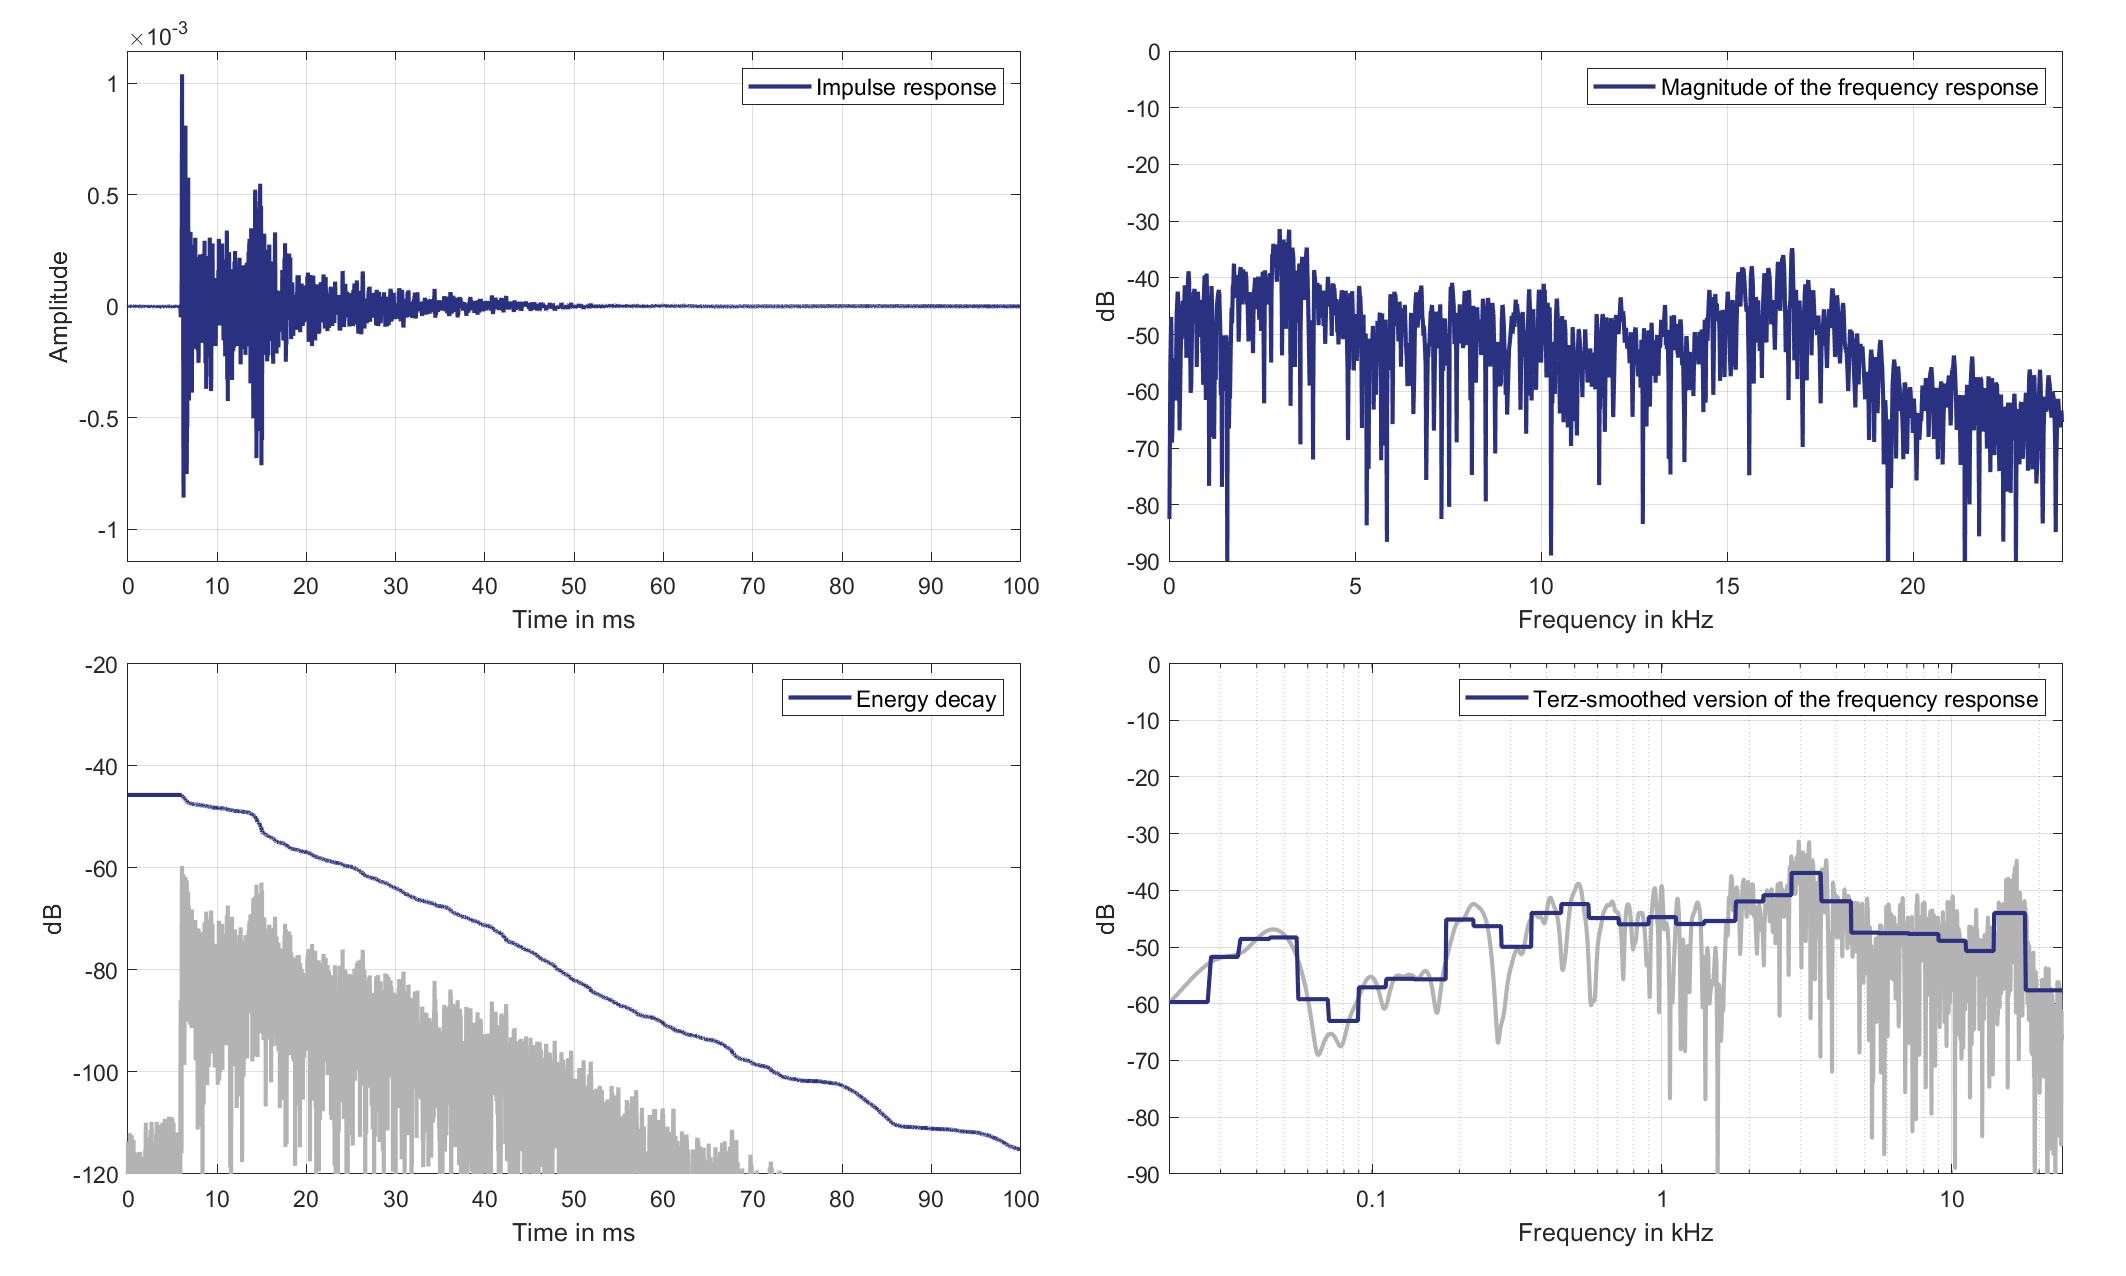
Download impulse response (in ".fir" format).
In the download section you can download all impulse response files as well as format explanation and Matlab as well as Python code examples for loading fir files.
Right lsp. - left ear mic.
Right Headrest Loudspeaker of Zone 8 (Lsp. 11) to Left Ear Microphone of Zone 1 (Mic. 19)
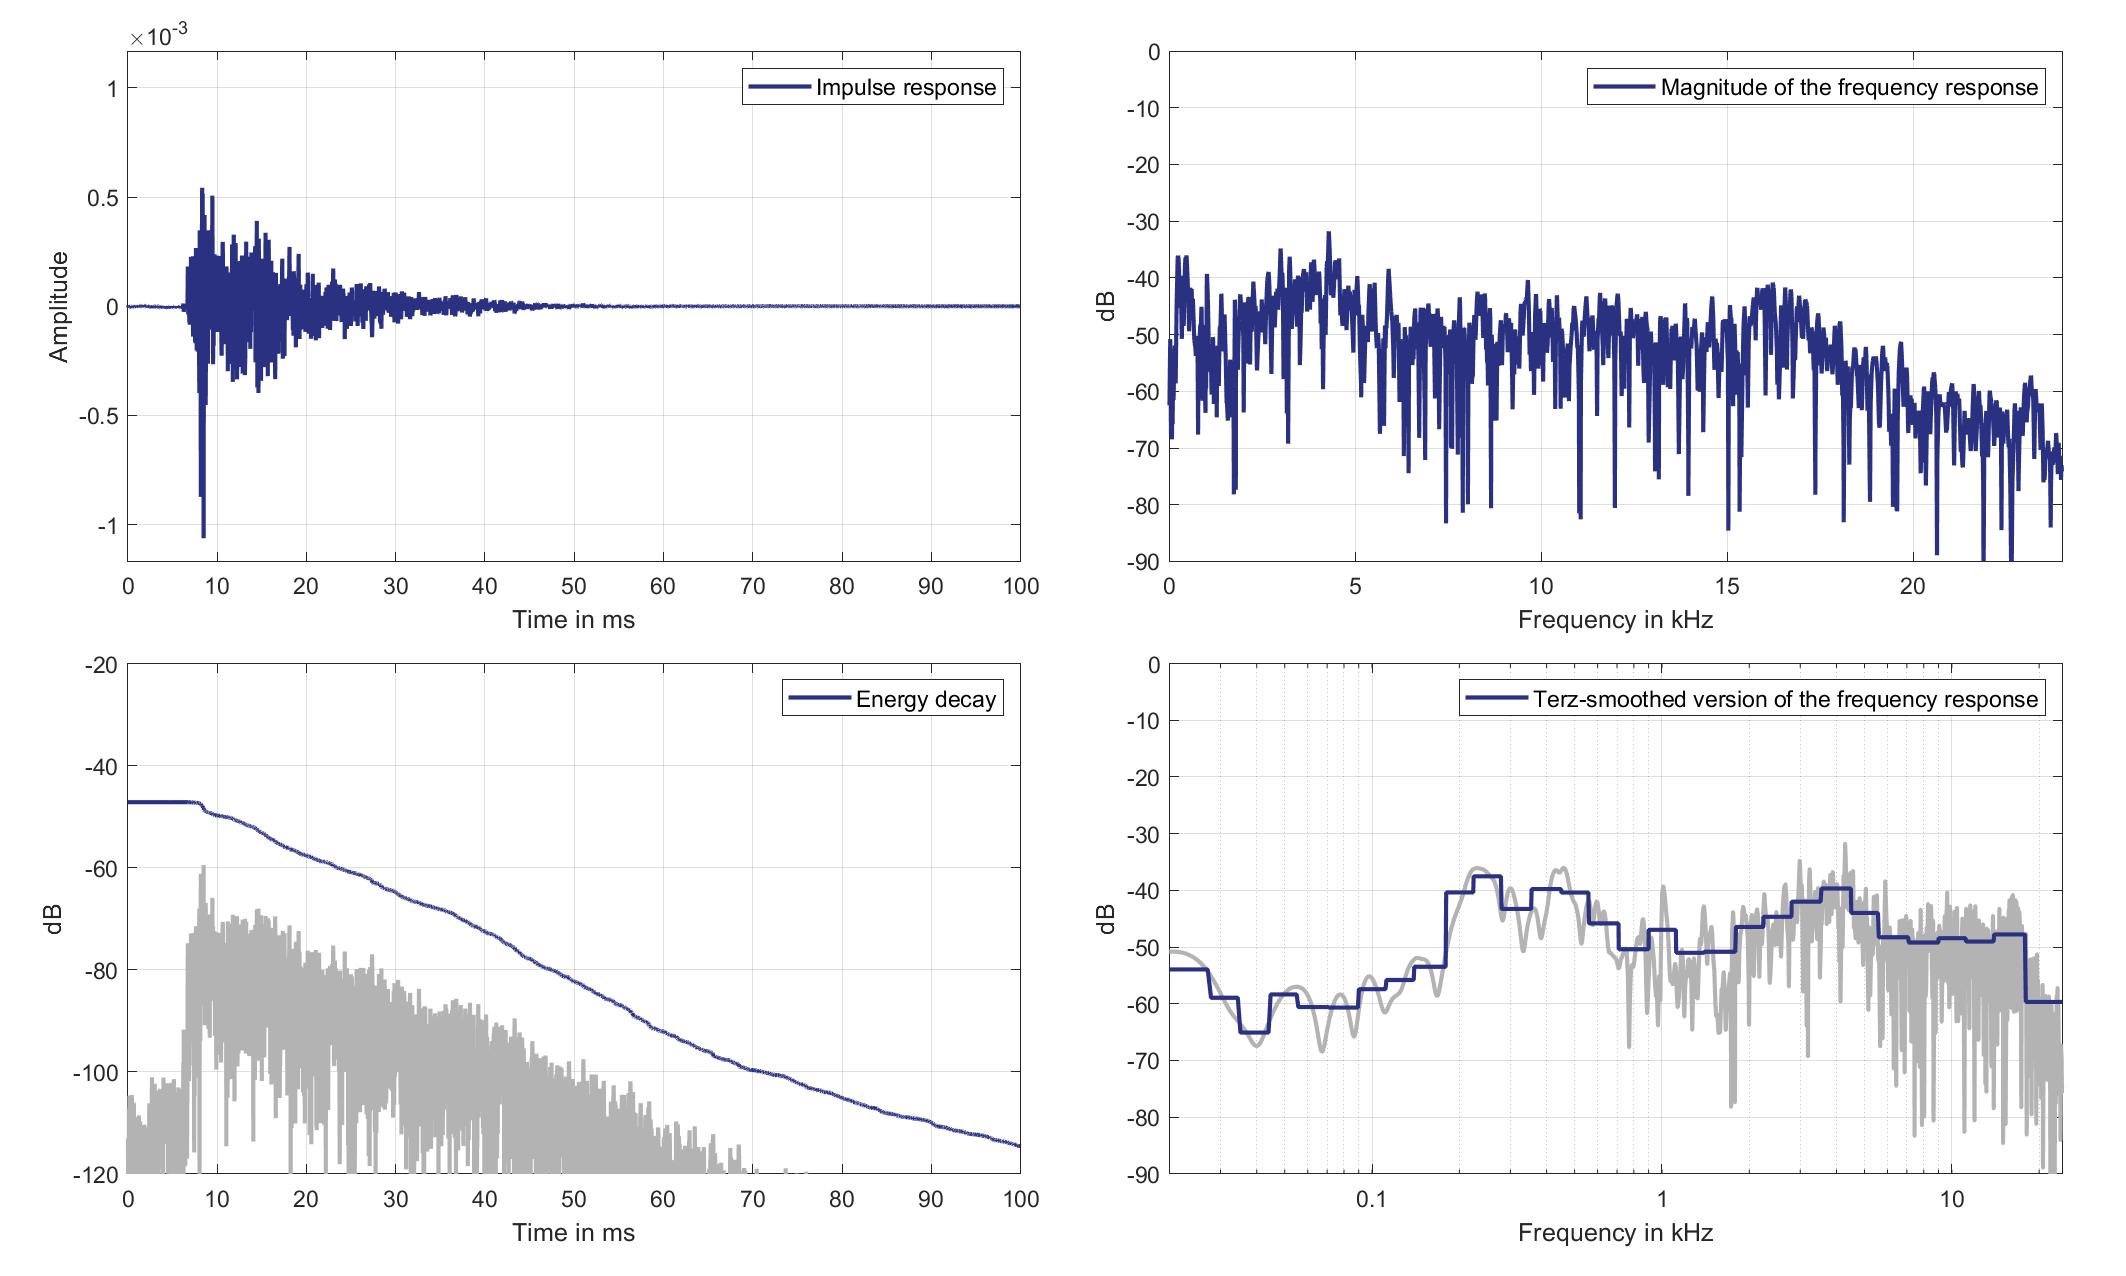
Download impulse response (in ".fir" format).
In the download section you can download all impulse response files as well as format explanation and Matlab as well as Python code examples for loading fir files.
Right lsp. - Right ear mic.
Right Headrest Loudspeaker of Zone 8 (Lsp. 11 to Right Ear Microphone of Zone 1 (Mic. 20)
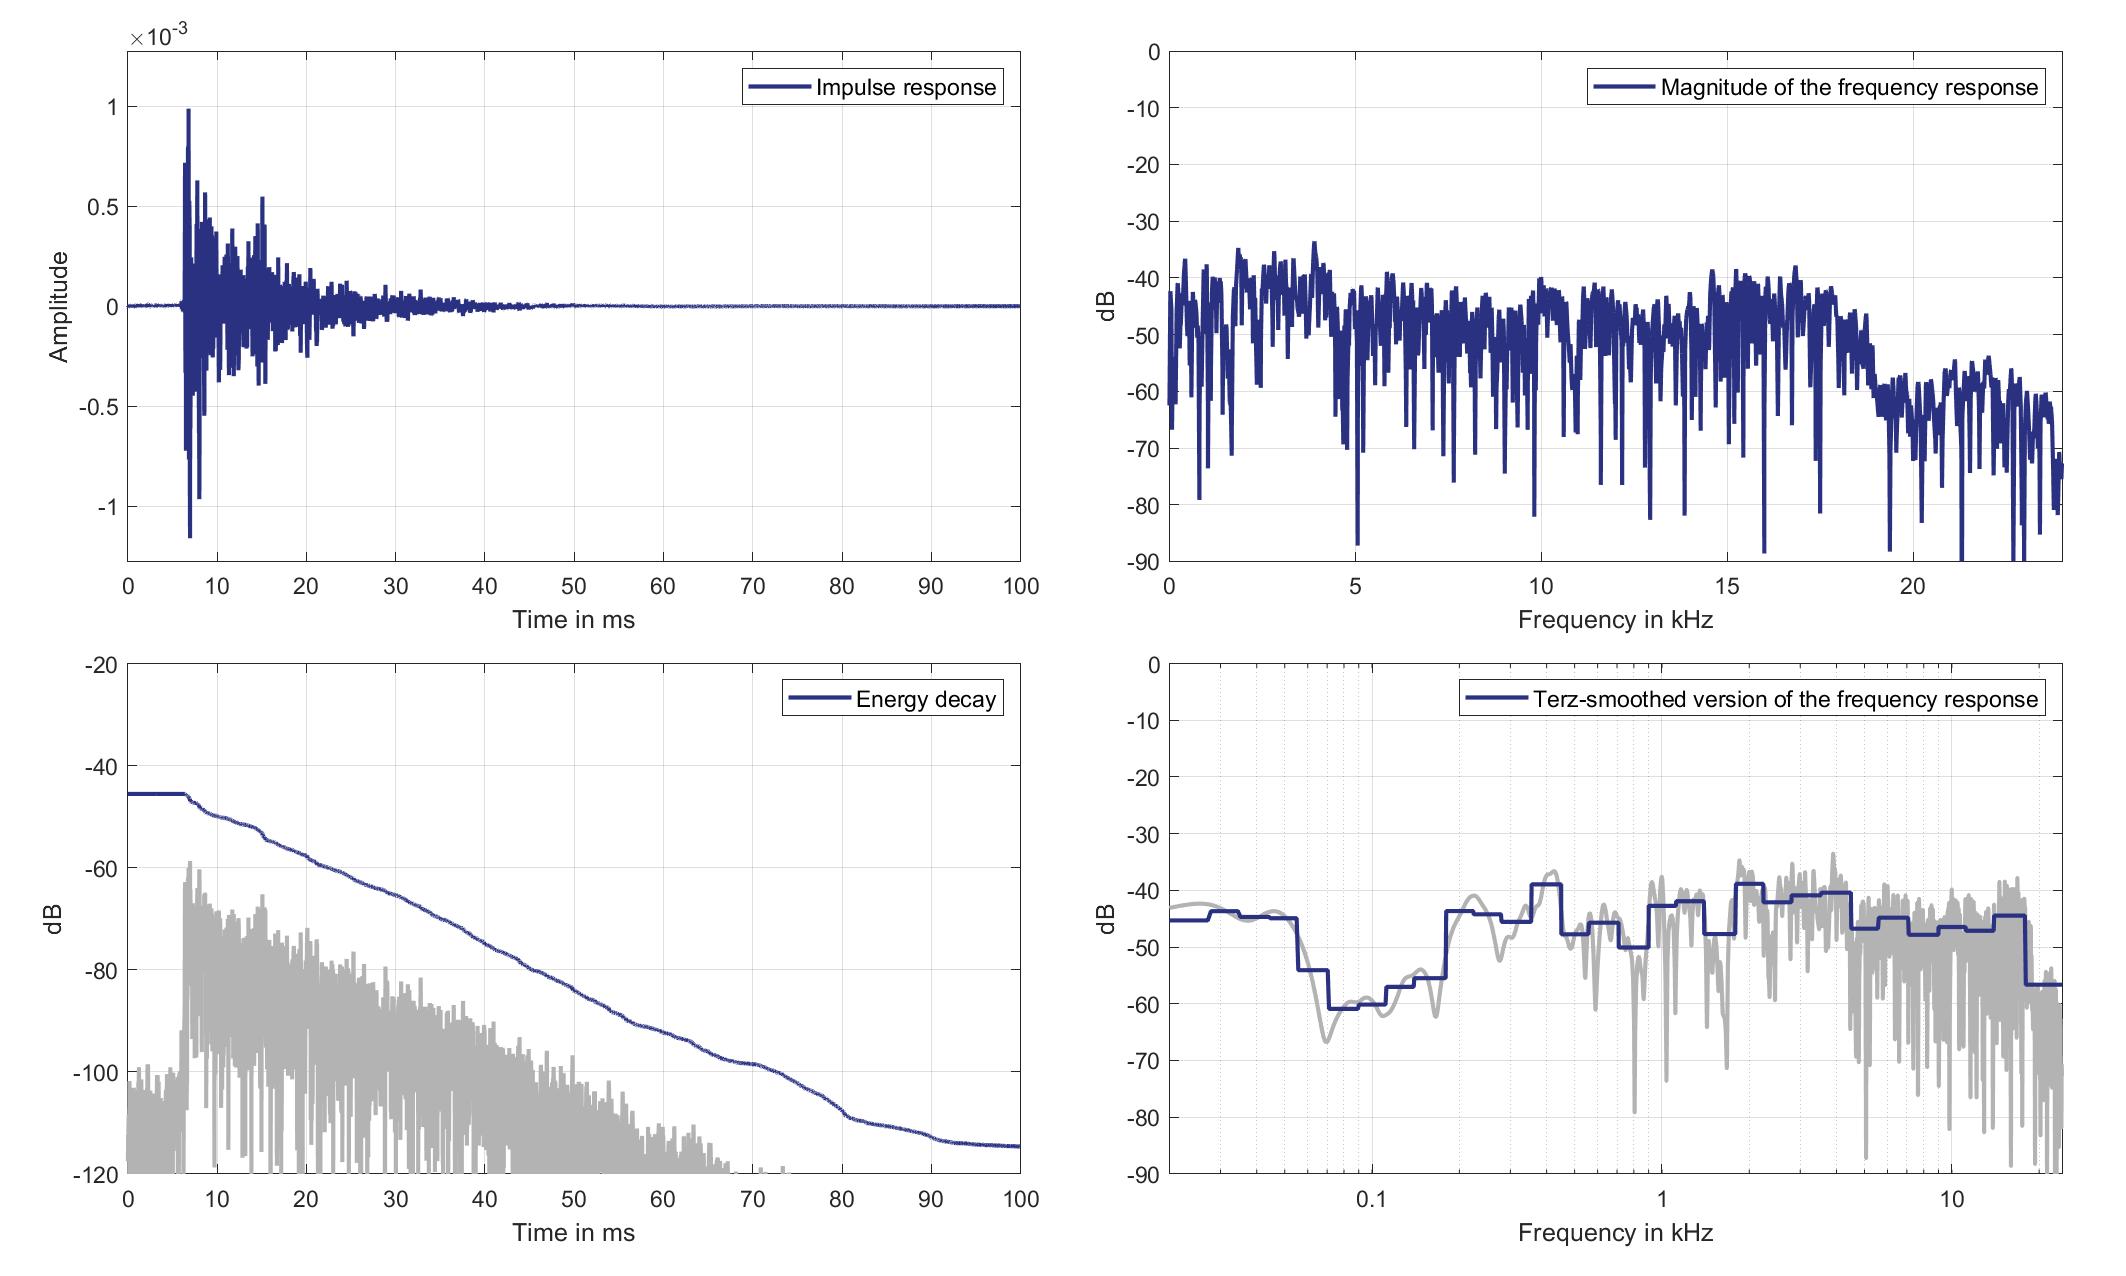
Download impulse response (in ".fir" format).
In the download section you can download all impulse response files as well as format explanation and Matlab as well as Python code examples for loading fir files.
Mics. 21/22
Left lsp. - left ear mic.
Left Headrest Loudspeaker of Zone 8 (Lsp. 10) to Left Ear Microphone of Zone 2 (Mic. 21)
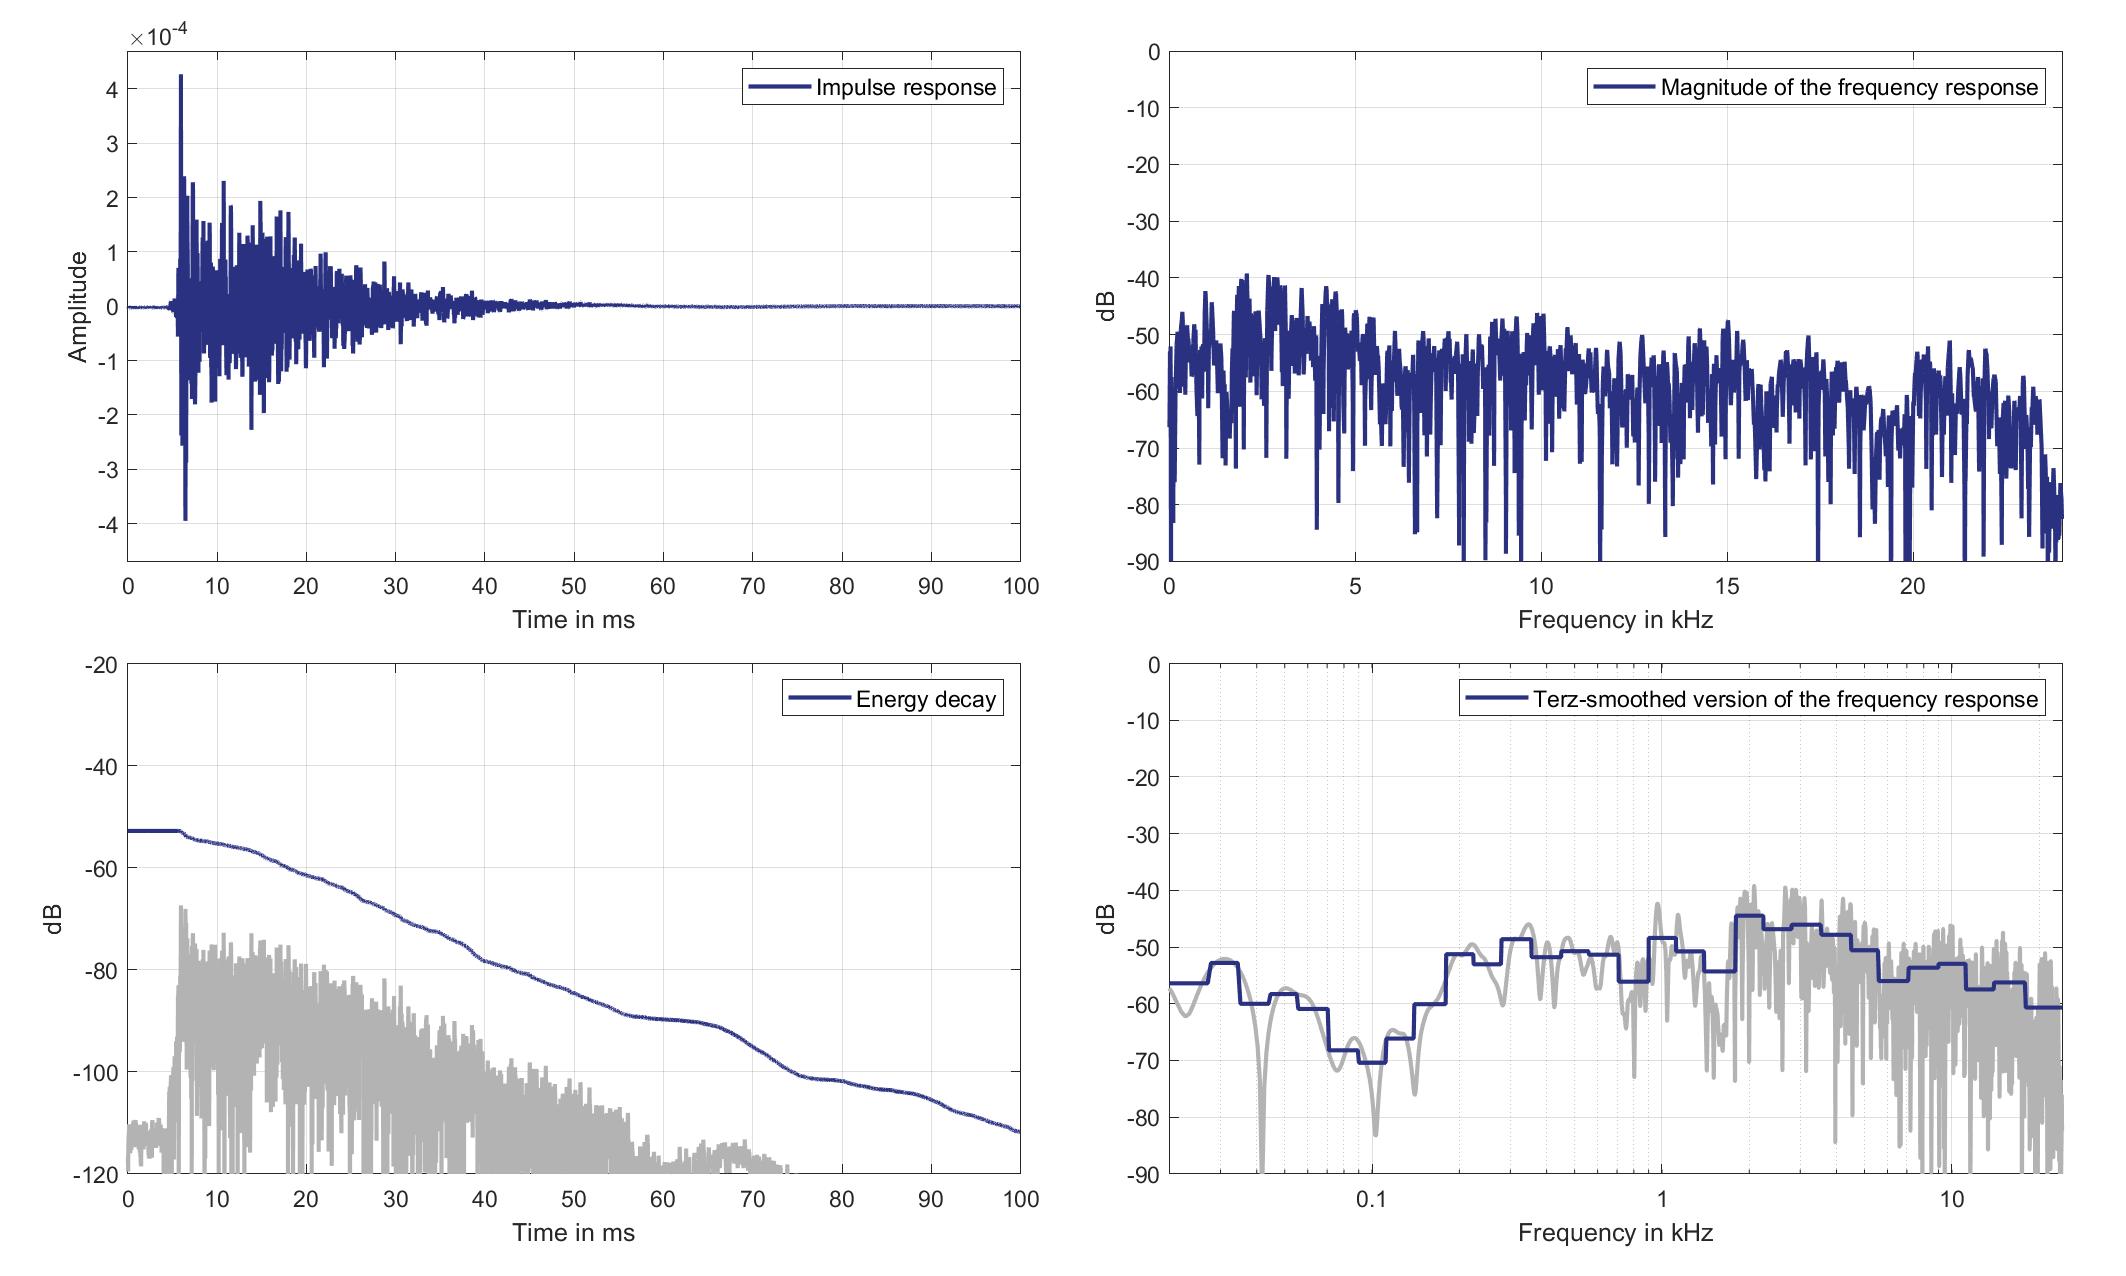
Download impulse response (in ".fir" format).
In the download section you can download all impulse response files as well as format explanation and Matlab as well as Python code examples for loading fir files.
Left lsp. - Right ear mic.
Left Headrest Loudspeaker of Zone 8 (Lsp. 10) to Right Ear Microphone of Zone 2 (Mic. 22)
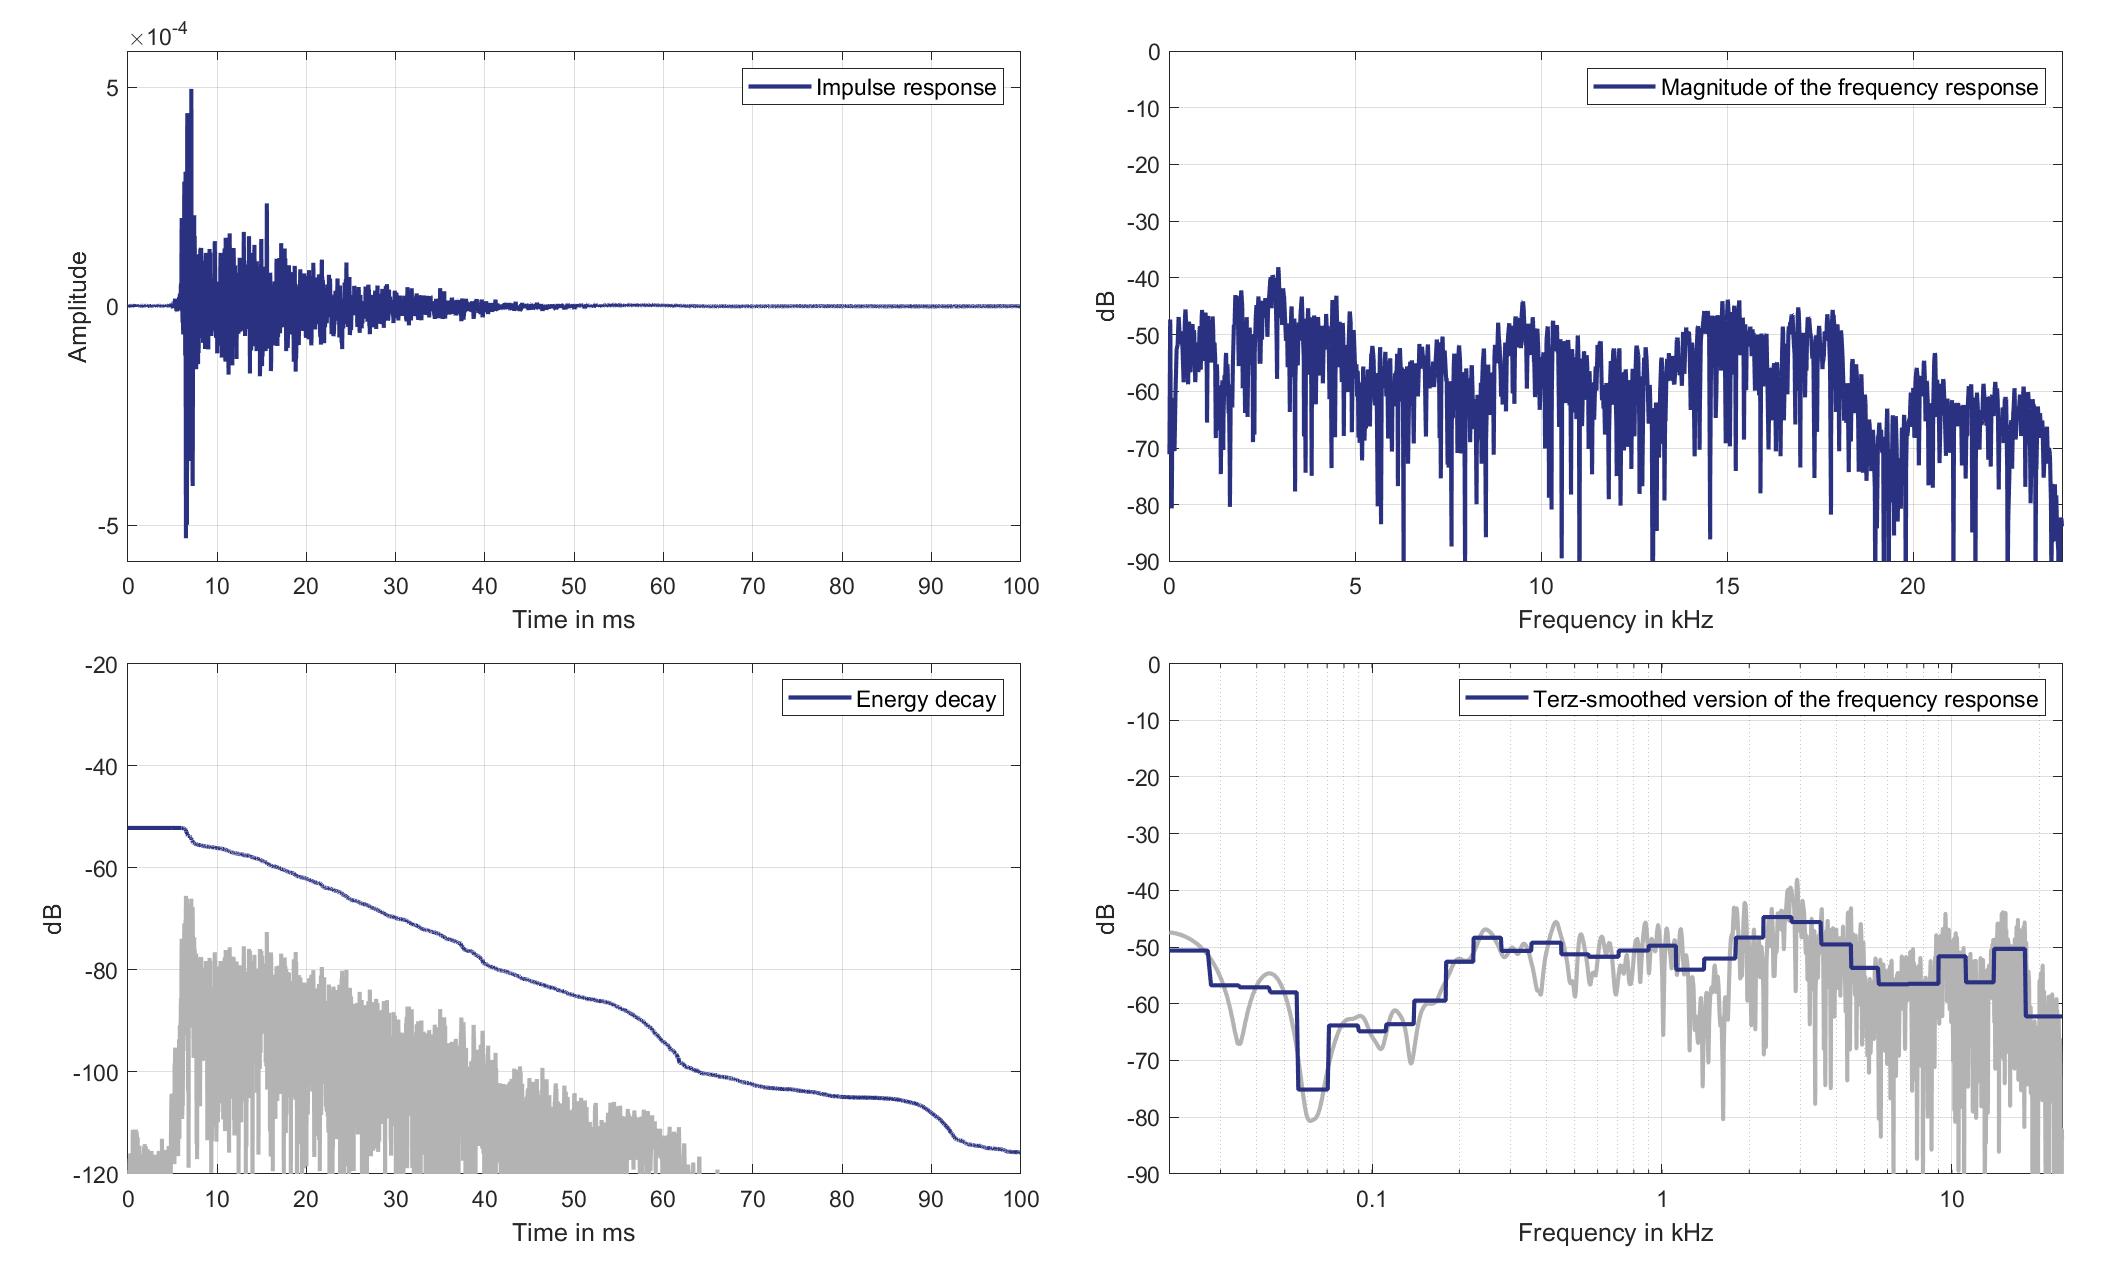
Download impulse response (in ".fir" format).
In the download section you can download all impulse response files as well as format explanation and Matlab as well as Python code examples for loading fir files.
Right lsp. - left ear mic.
Right Headrest Loudspeaker of Zone 8 (Lsp. 11) to Left Ear Microphone of Zone 2 (Mic. 21)
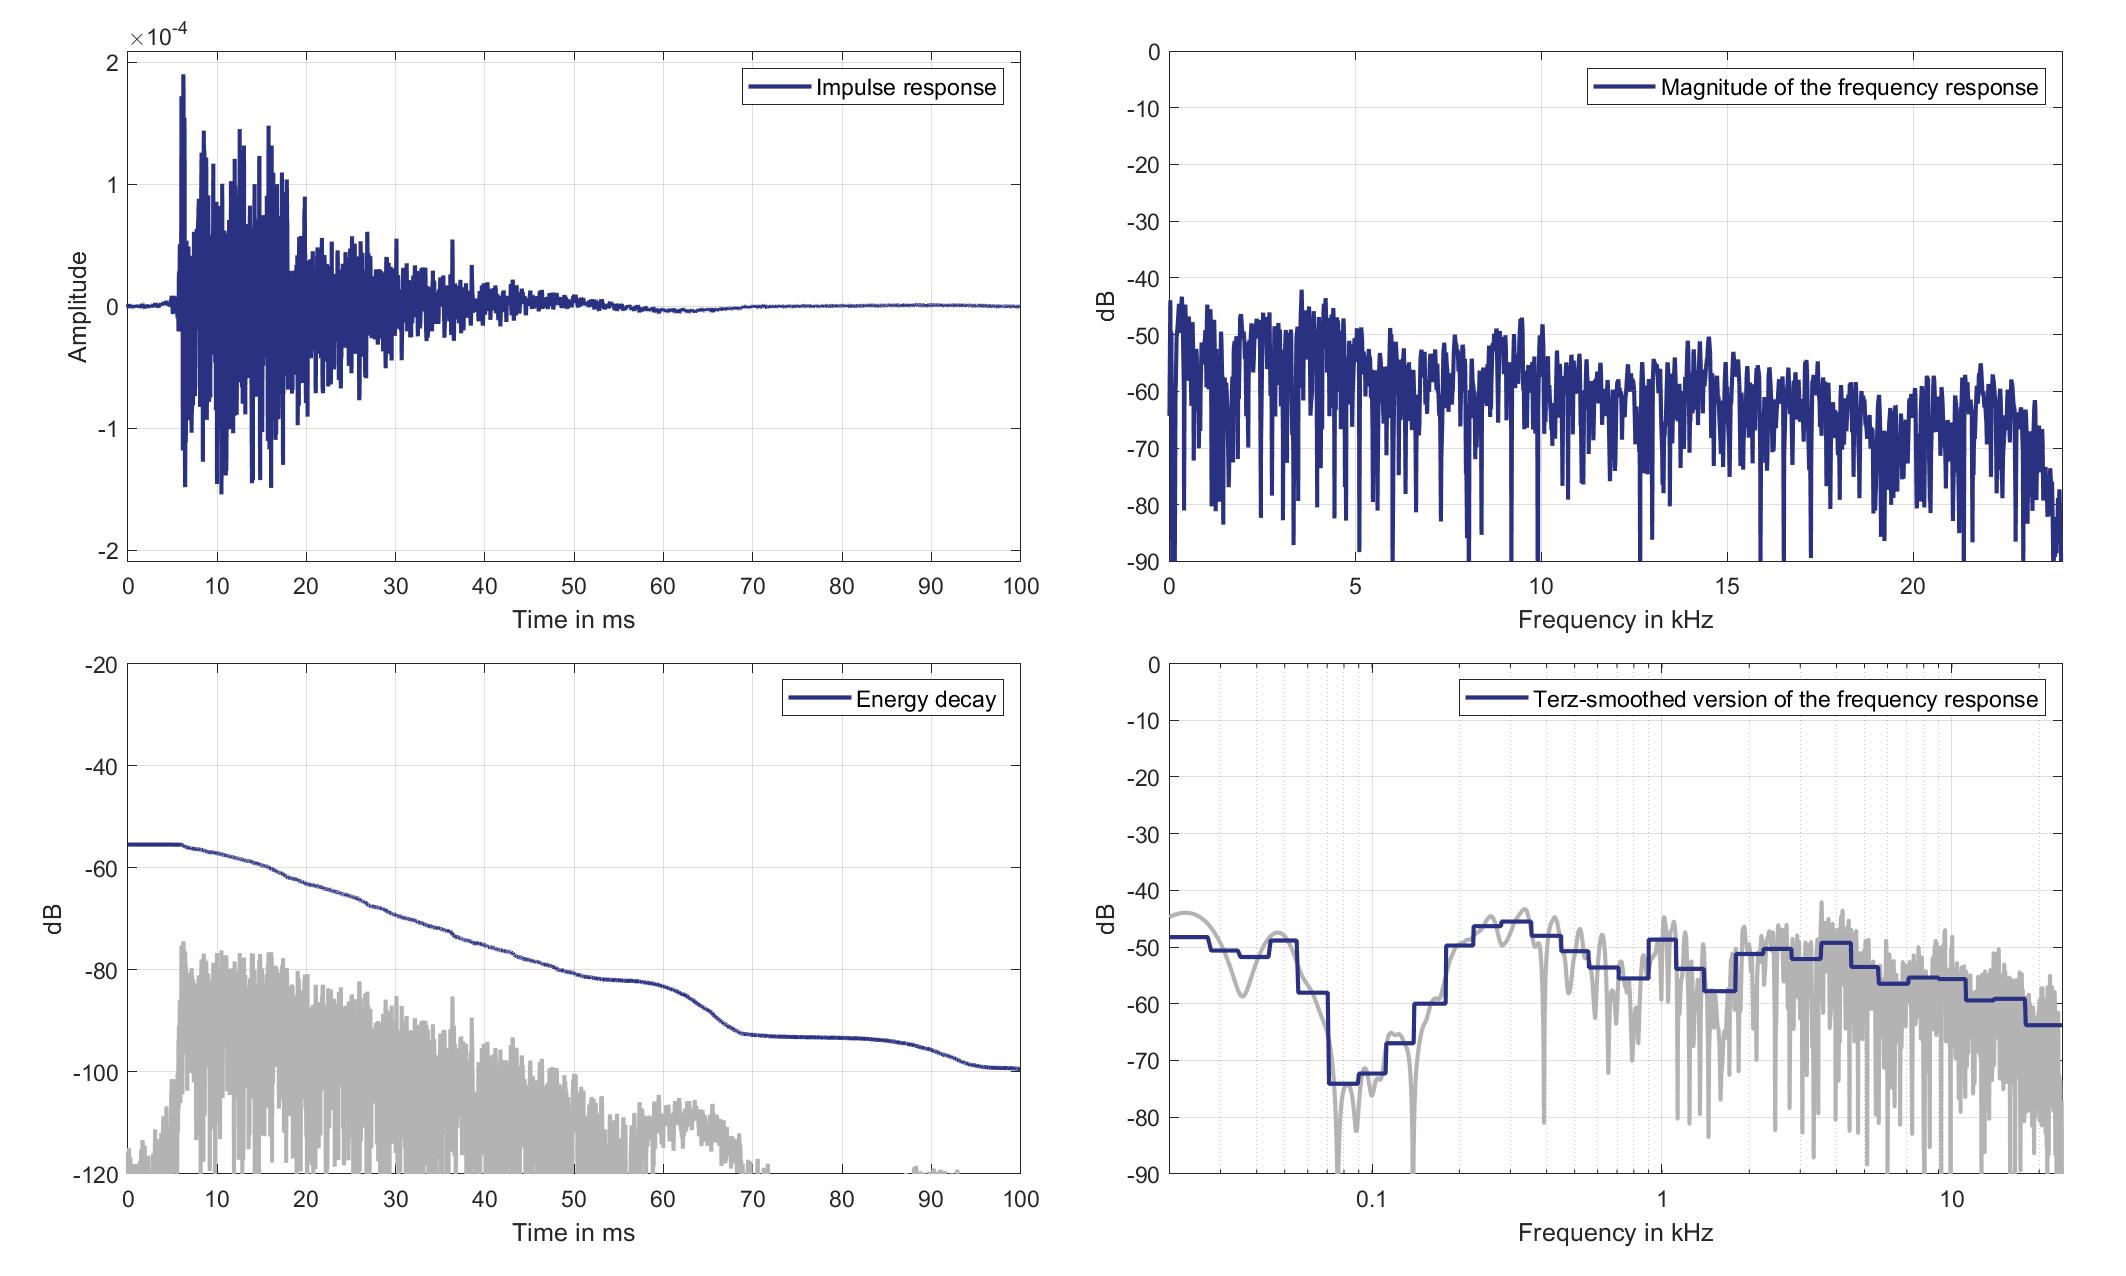
Download impulse response (in ".fir" format).
In the download section you can download all impulse response files as well as format explanation and Matlab as well as Python code examples for loading fir files.
Right lsp. - Right ear mic.
Right Headrest Loudspeaker of Zone 8 (Lsp. 11 to Right Ear Microphone of Zone 2 (Mic. 22)
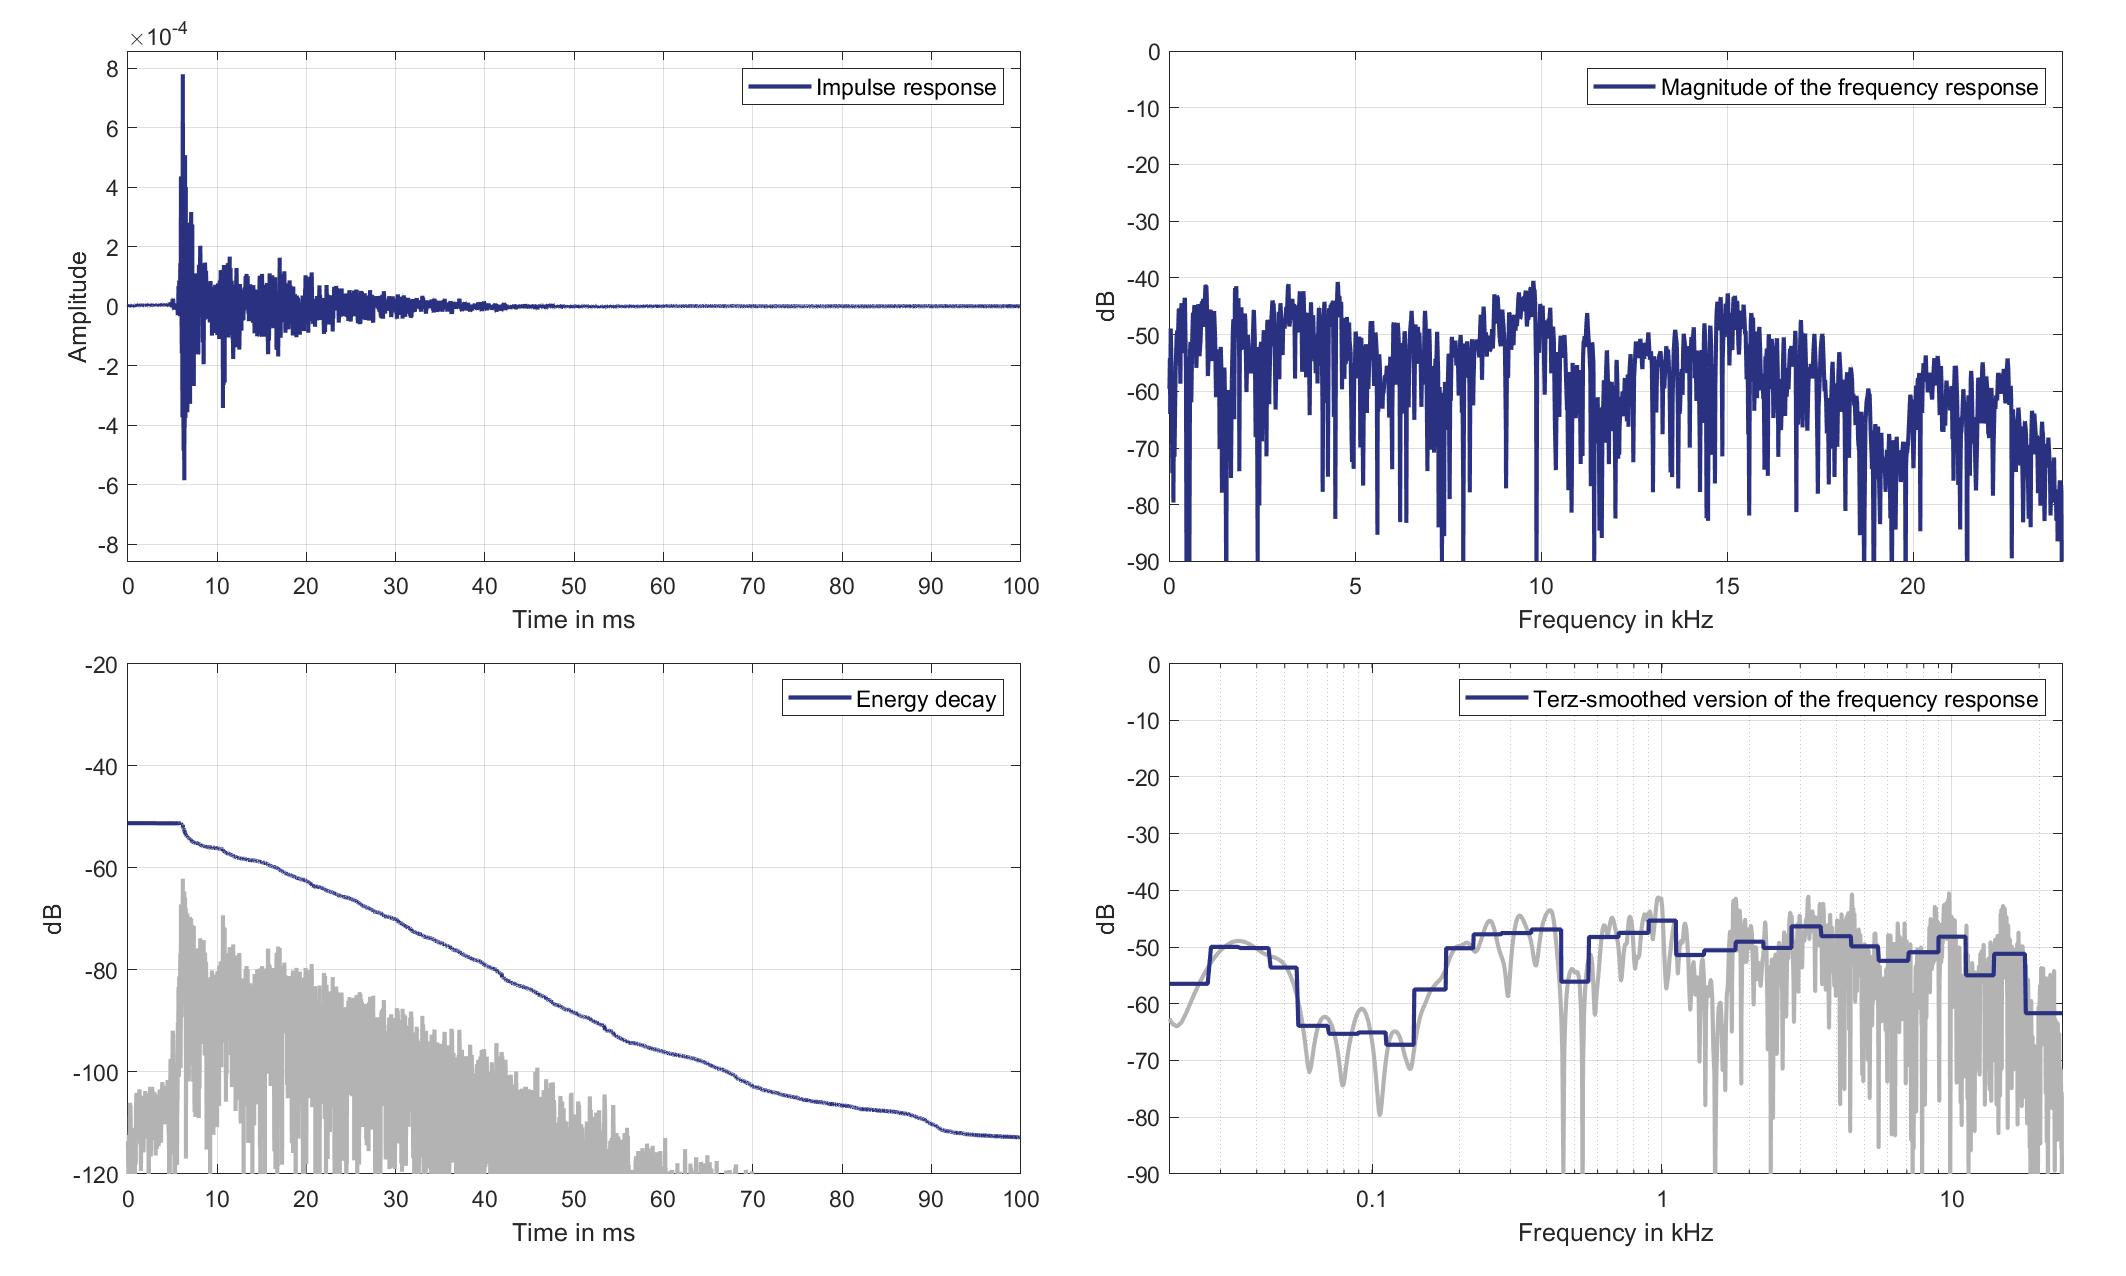
Download impulse response (in ".fir" format).
In the download section you can download all impulse response files as well as format explanation and Matlab as well as Python code examples for loading fir files.
Mics. 23/24
Left lsp. - left ear mic.
Left Headrest Loudspeaker of Zone 8 (Lsp. 10) to Left Ear Microphone of Zone 3 (Mic. 23)
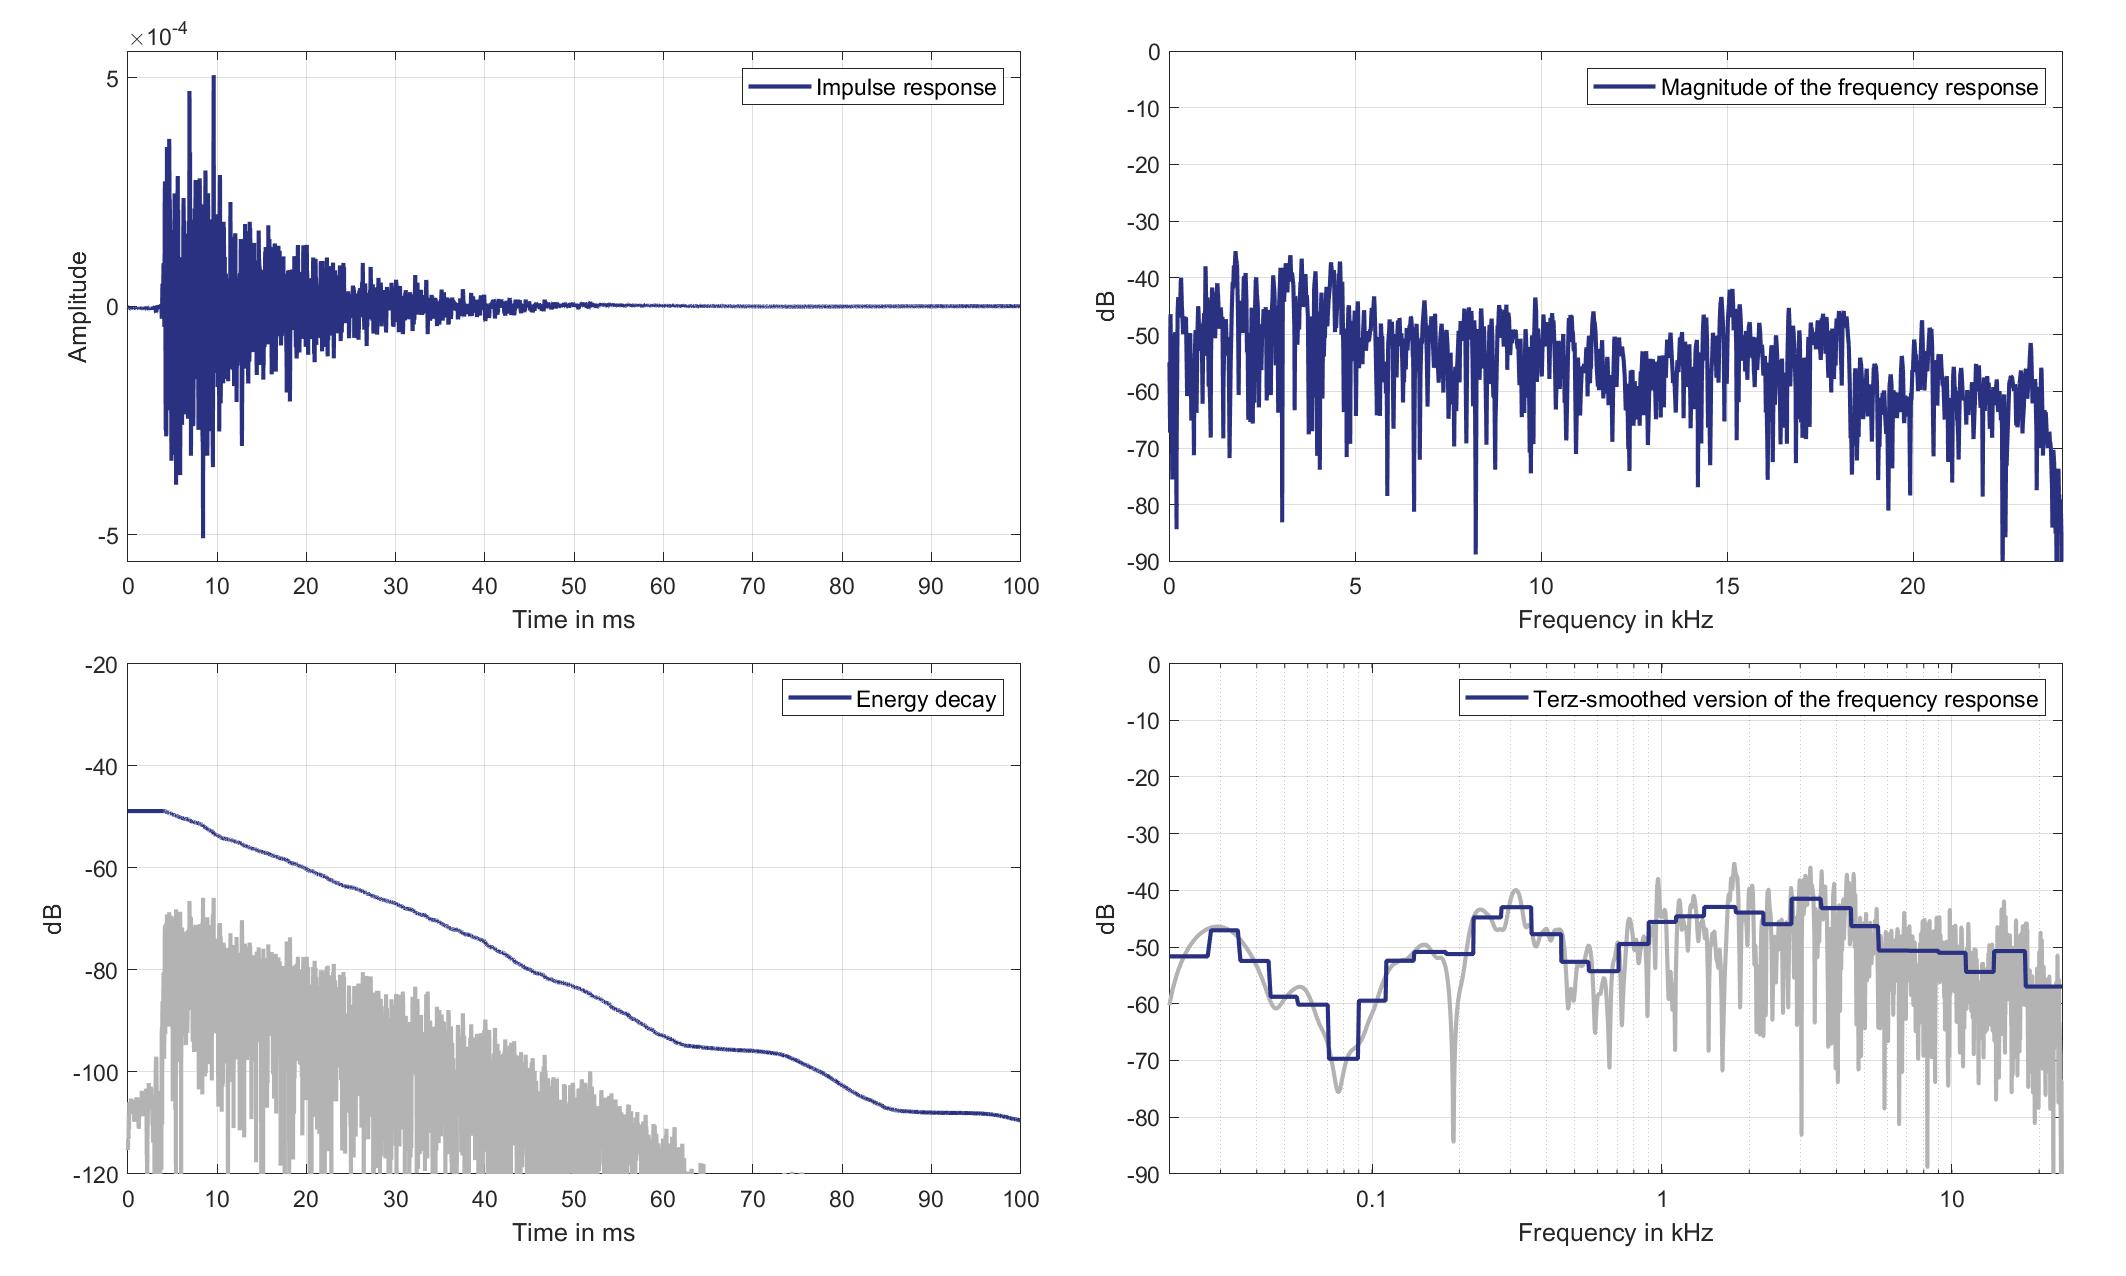
Download impulse response (in ".fir" format).
In the download section you can download all impulse response files as well as format explanation and Matlab as well as Python code examples for loading fir files.
Left lsp. - Right ear mic.
Left Headrest Loudspeaker of Zone 8 (Lsp. 10) to Right Ear Microphone of Zone 3 (Mic. 24)
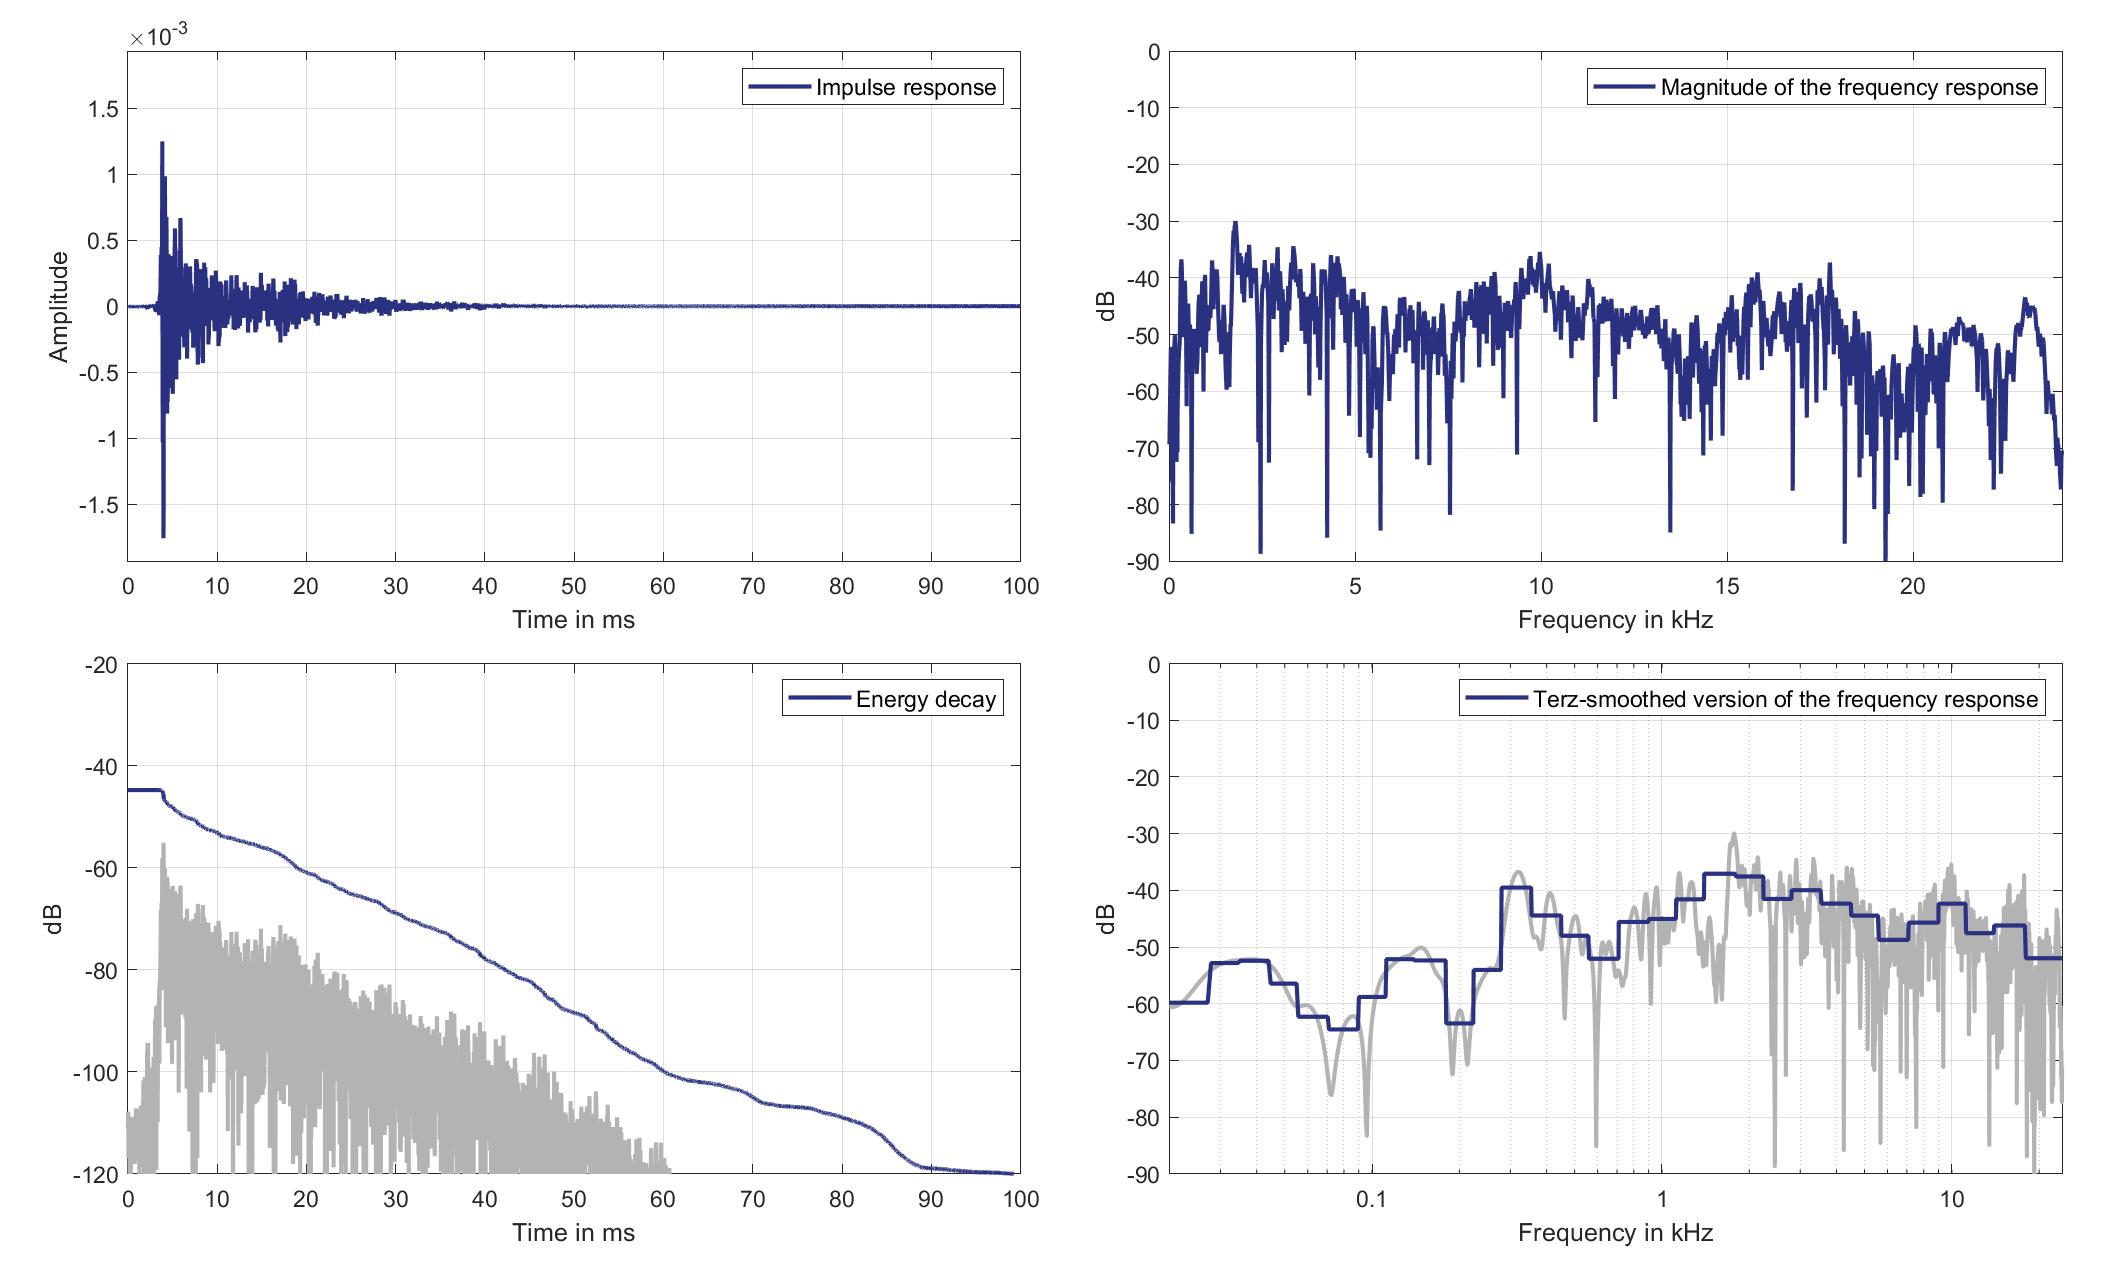
Download impulse response (in ".fir" format).
In the download section you can download all impulse response files as well as format explanation and Matlab as well as Python code examples for loading fir files.
Right lsp. - left ear mic.
Right Headrest Loudspeaker of Zone 8 (Lsp. 11) to Left Ear Microphone of Zone 3 (Mic. 23)
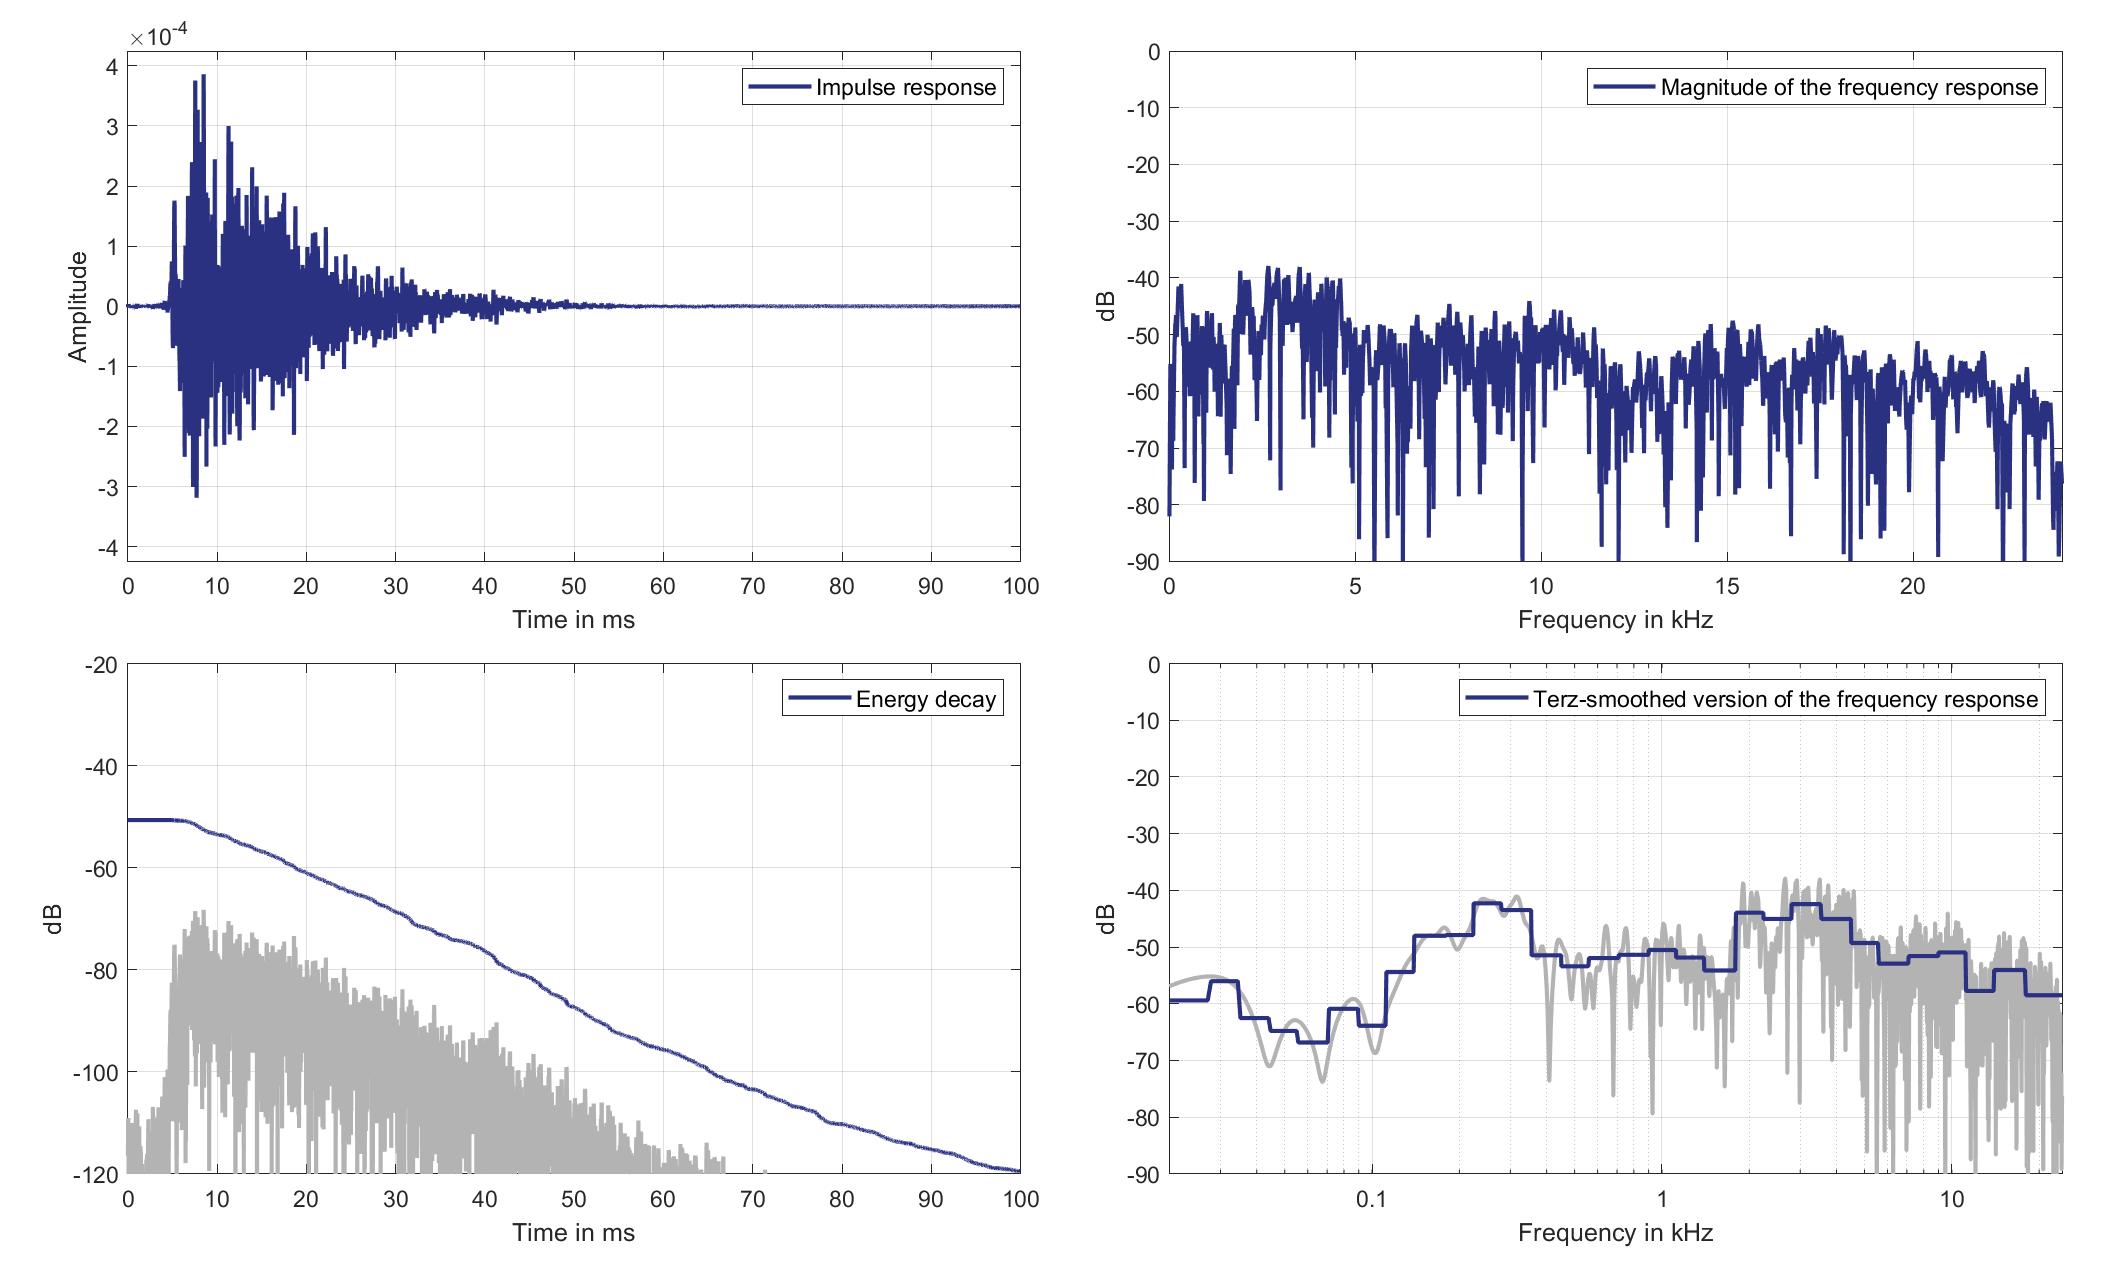
Download impulse response (in ".fir" format).
In the download section you can download all impulse response files as well as format explanation and Matlab as well as Python code examples for loading fir files.
Right lsp. - Right ear mic.
Right Headrest Loudspeaker of Zone 8 (Lsp. 11 to Right Ear Microphone of Zone 3 (Mic. 24)
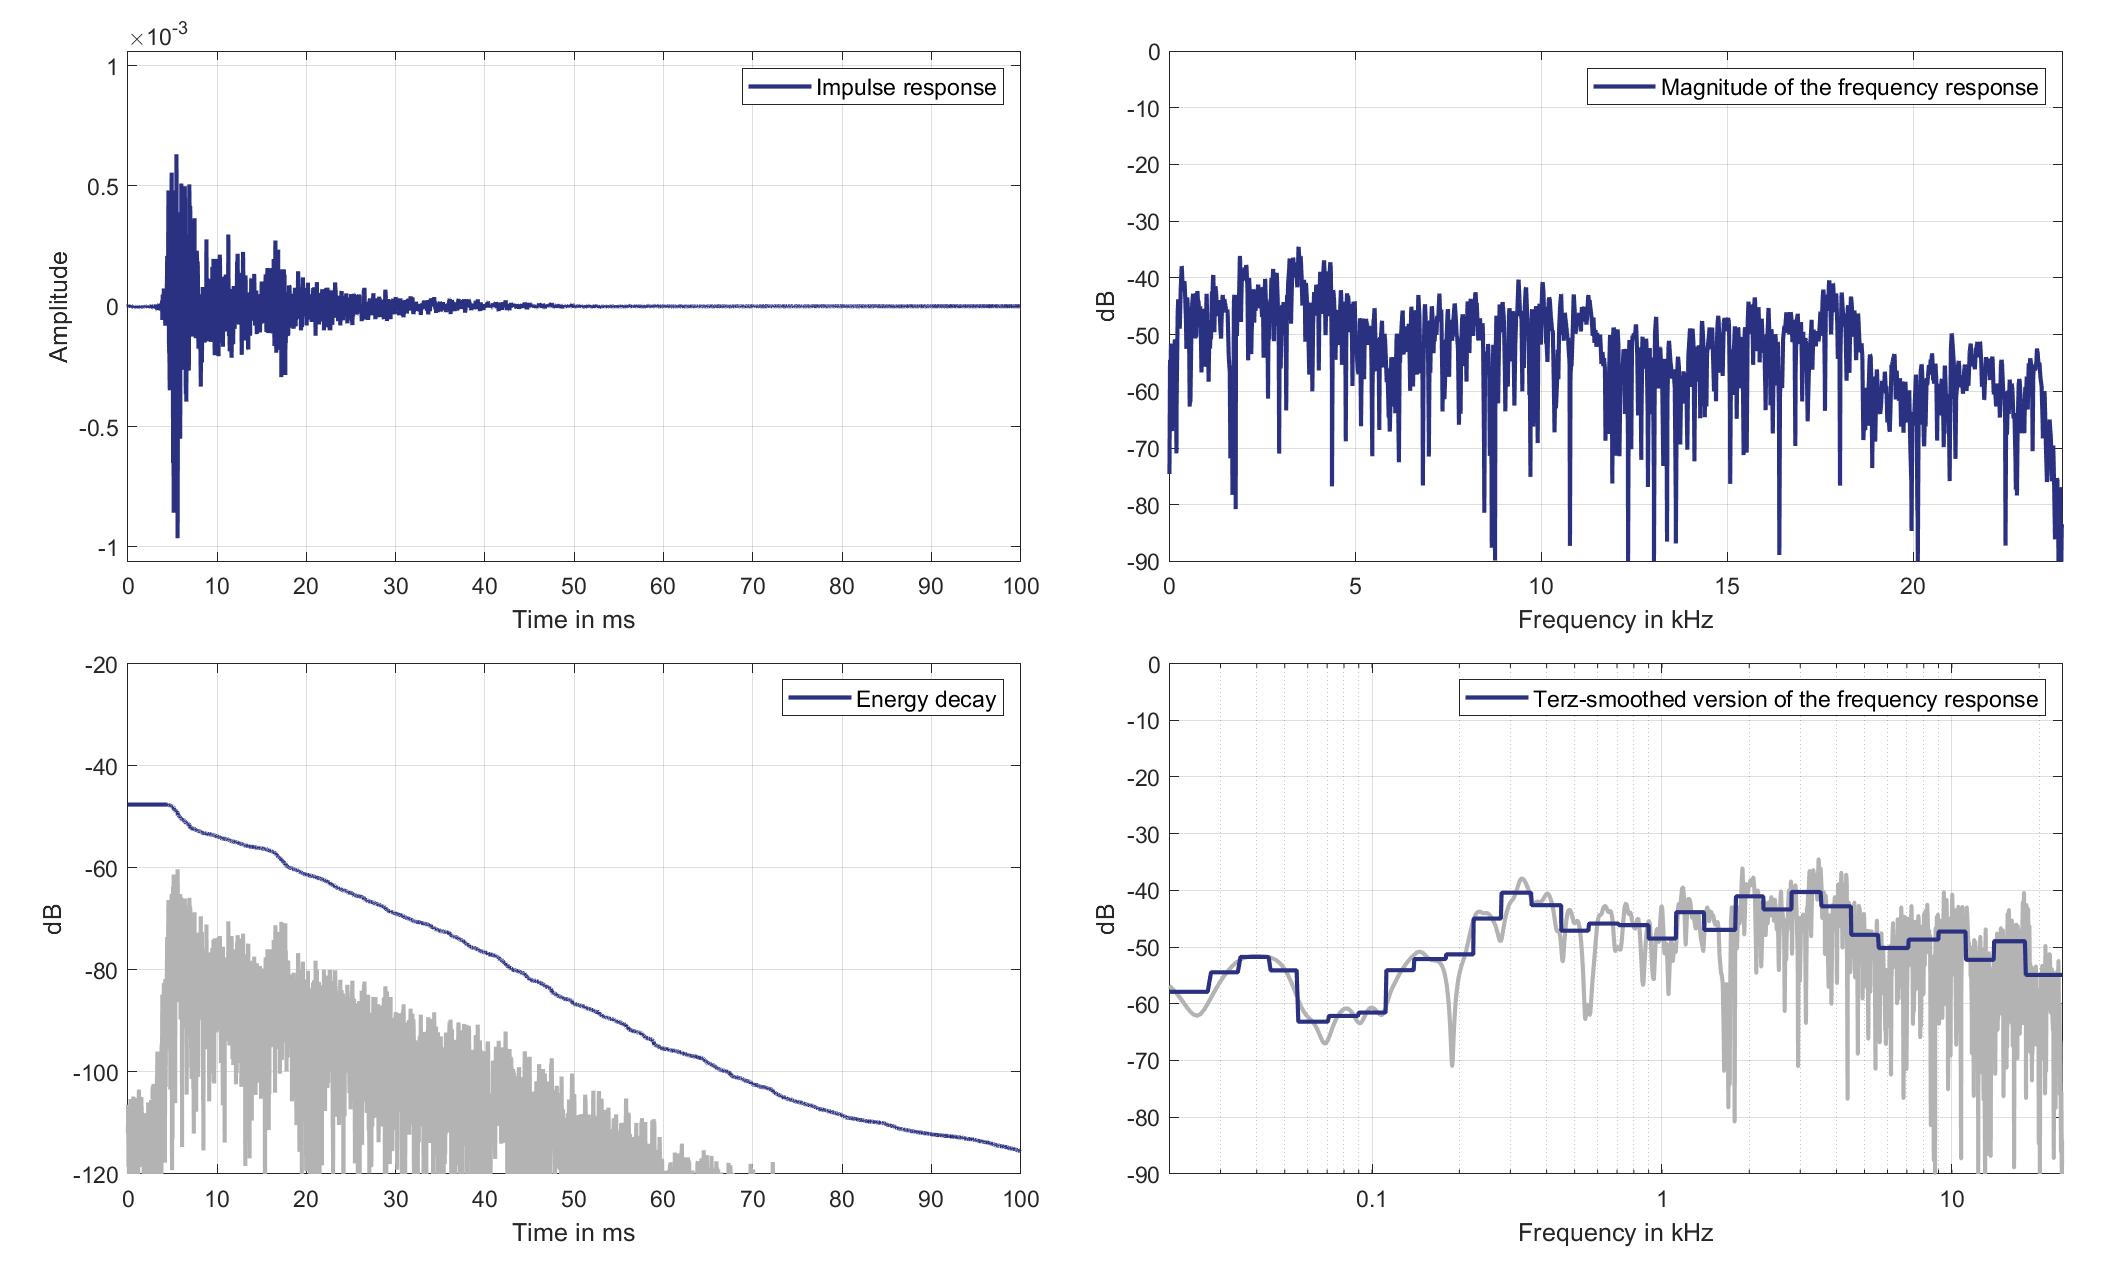
Download impulse response (in ".fir" format).
In the download section you can download all impulse response files as well as format explanation and Matlab as well as Python code examples for loading fir files.
Mics. 25/26
Left lsp. - left ear mic.
Left Headrest Loudspeaker of Zone 8 (Lsp. 10) to Left Ear Microphone of Zone 5 (Mic. 25)
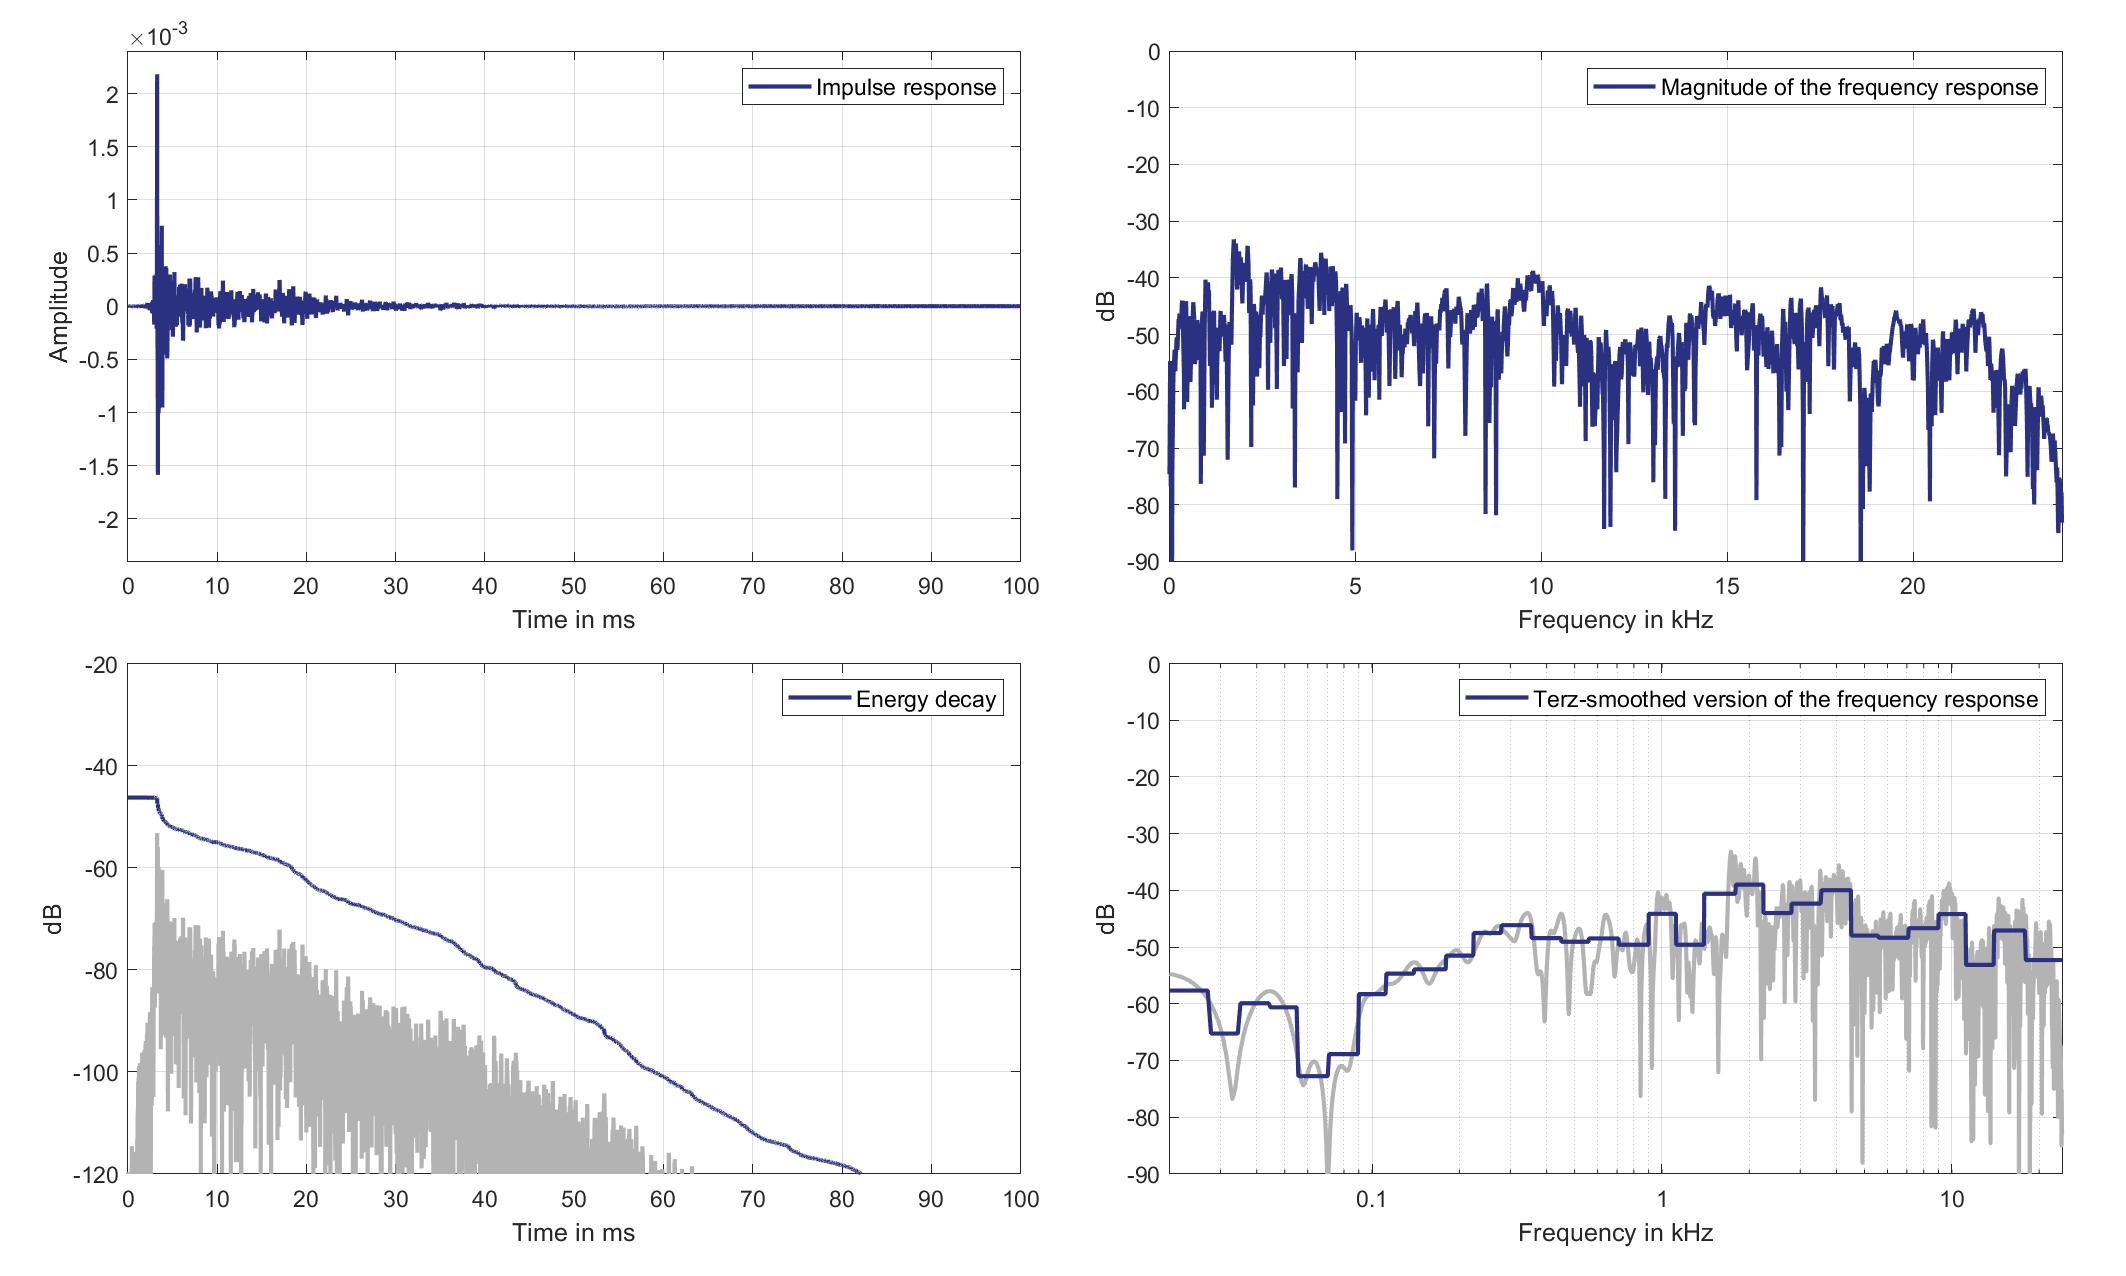
Download impulse response (in ".fir" format).
In the download section you can download all impulse response files as well as format explanation and Matlab as well as Python code examples for loading fir files.
Left lsp. - Right ear mic.
Left Headrest Loudspeaker of Zone 8 (Lsp. 10) to Right Ear Microphone of Zone 5 (Mic. 26)
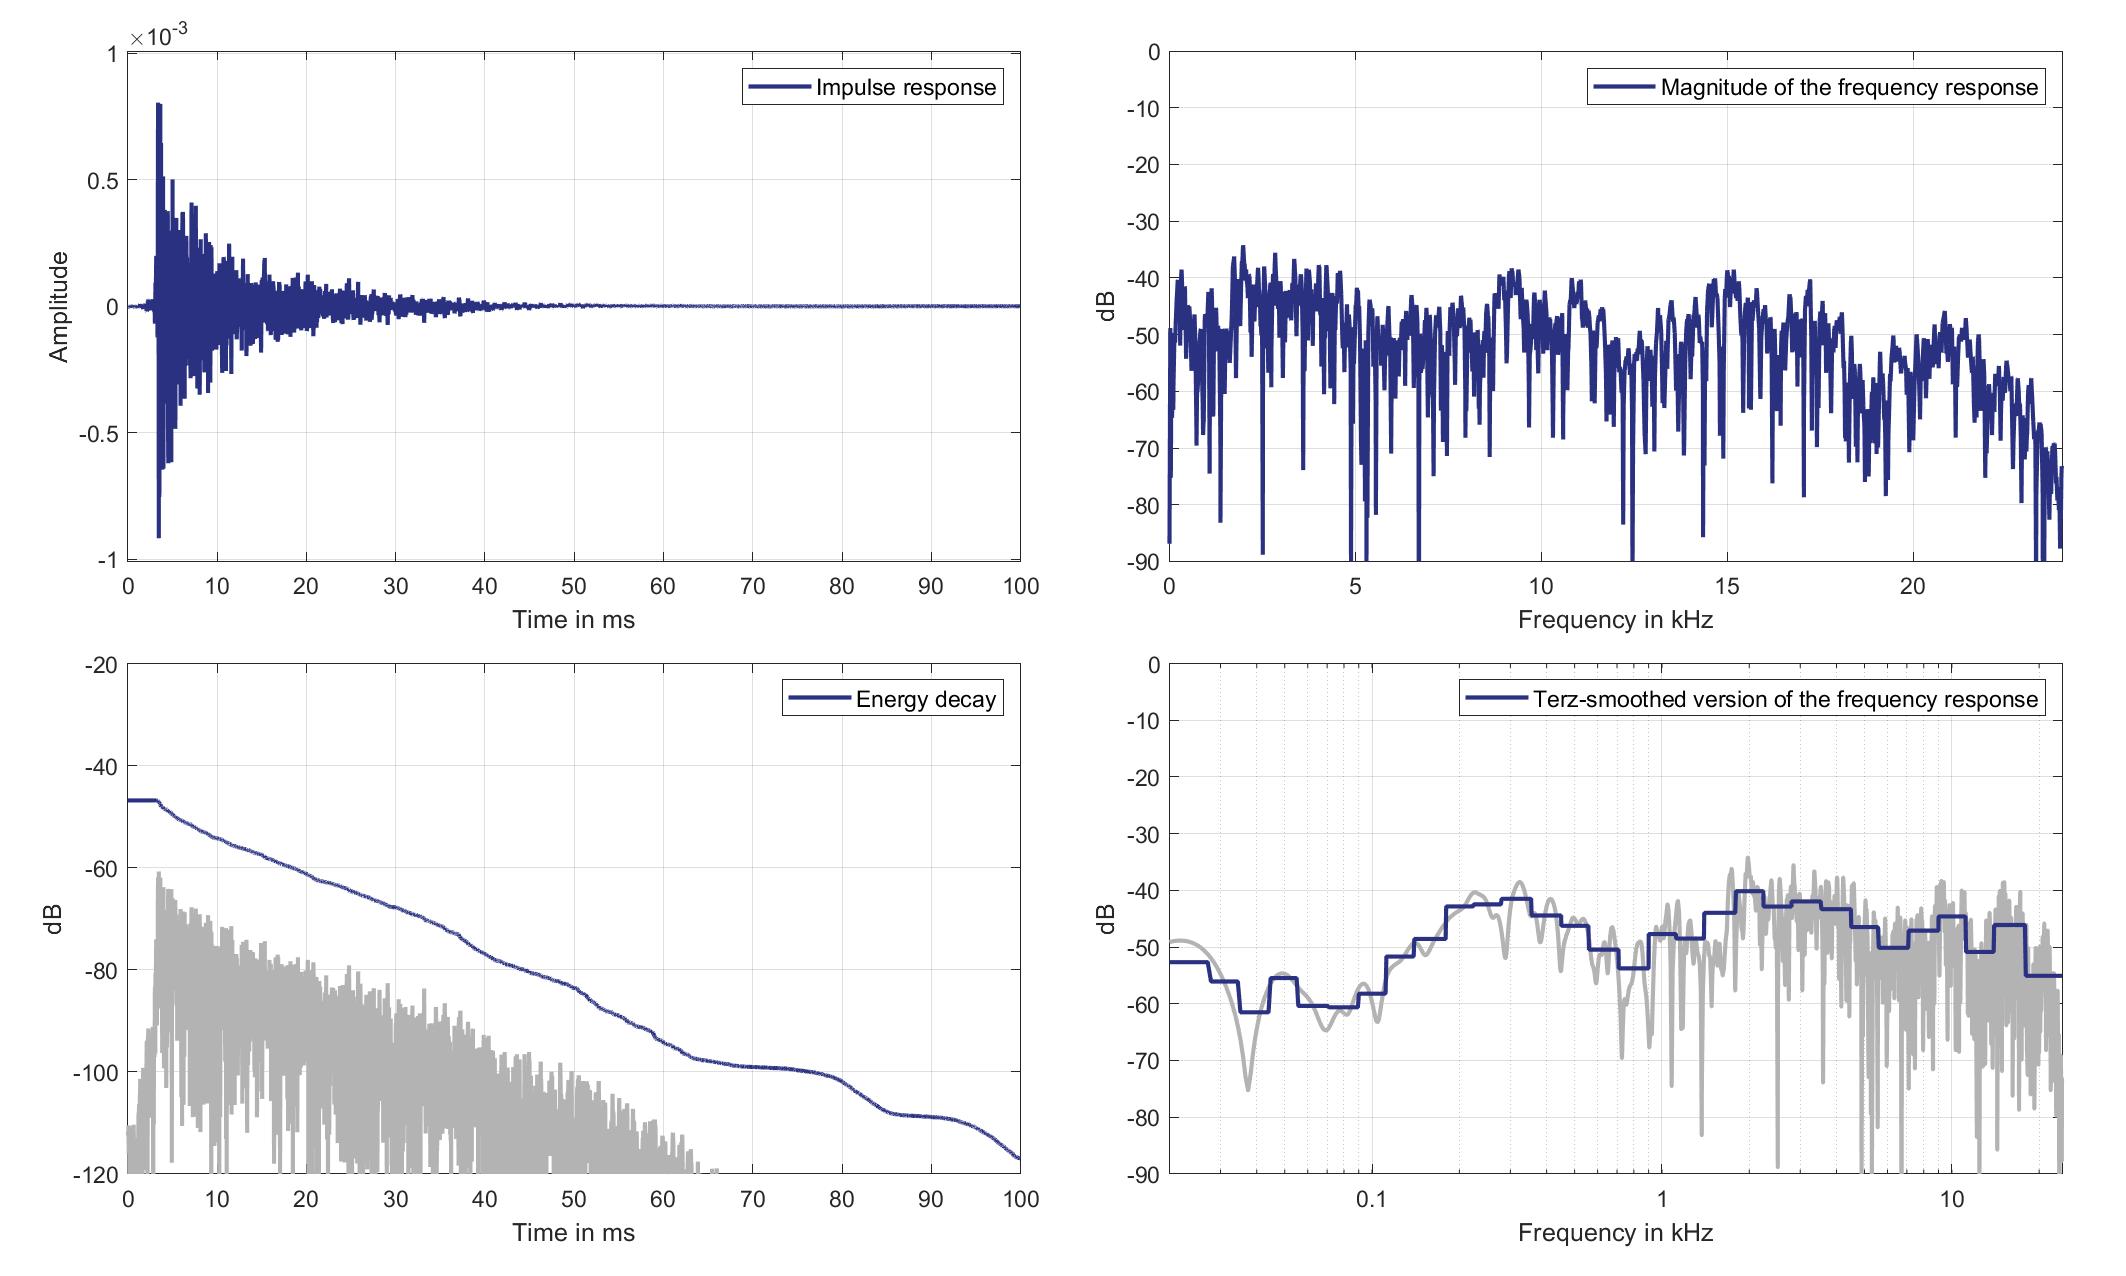
Download impulse response (in ".fir" format).
In the download section you can download all impulse response files as well as format explanation and Matlab as well as Python code examples for loading fir files.
Right lsp. - left ear mic.
Right Headrest Loudspeaker of Zone 8 (Lsp. 11) to Left Ear Microphone of Zone 5 (Mic. 25)
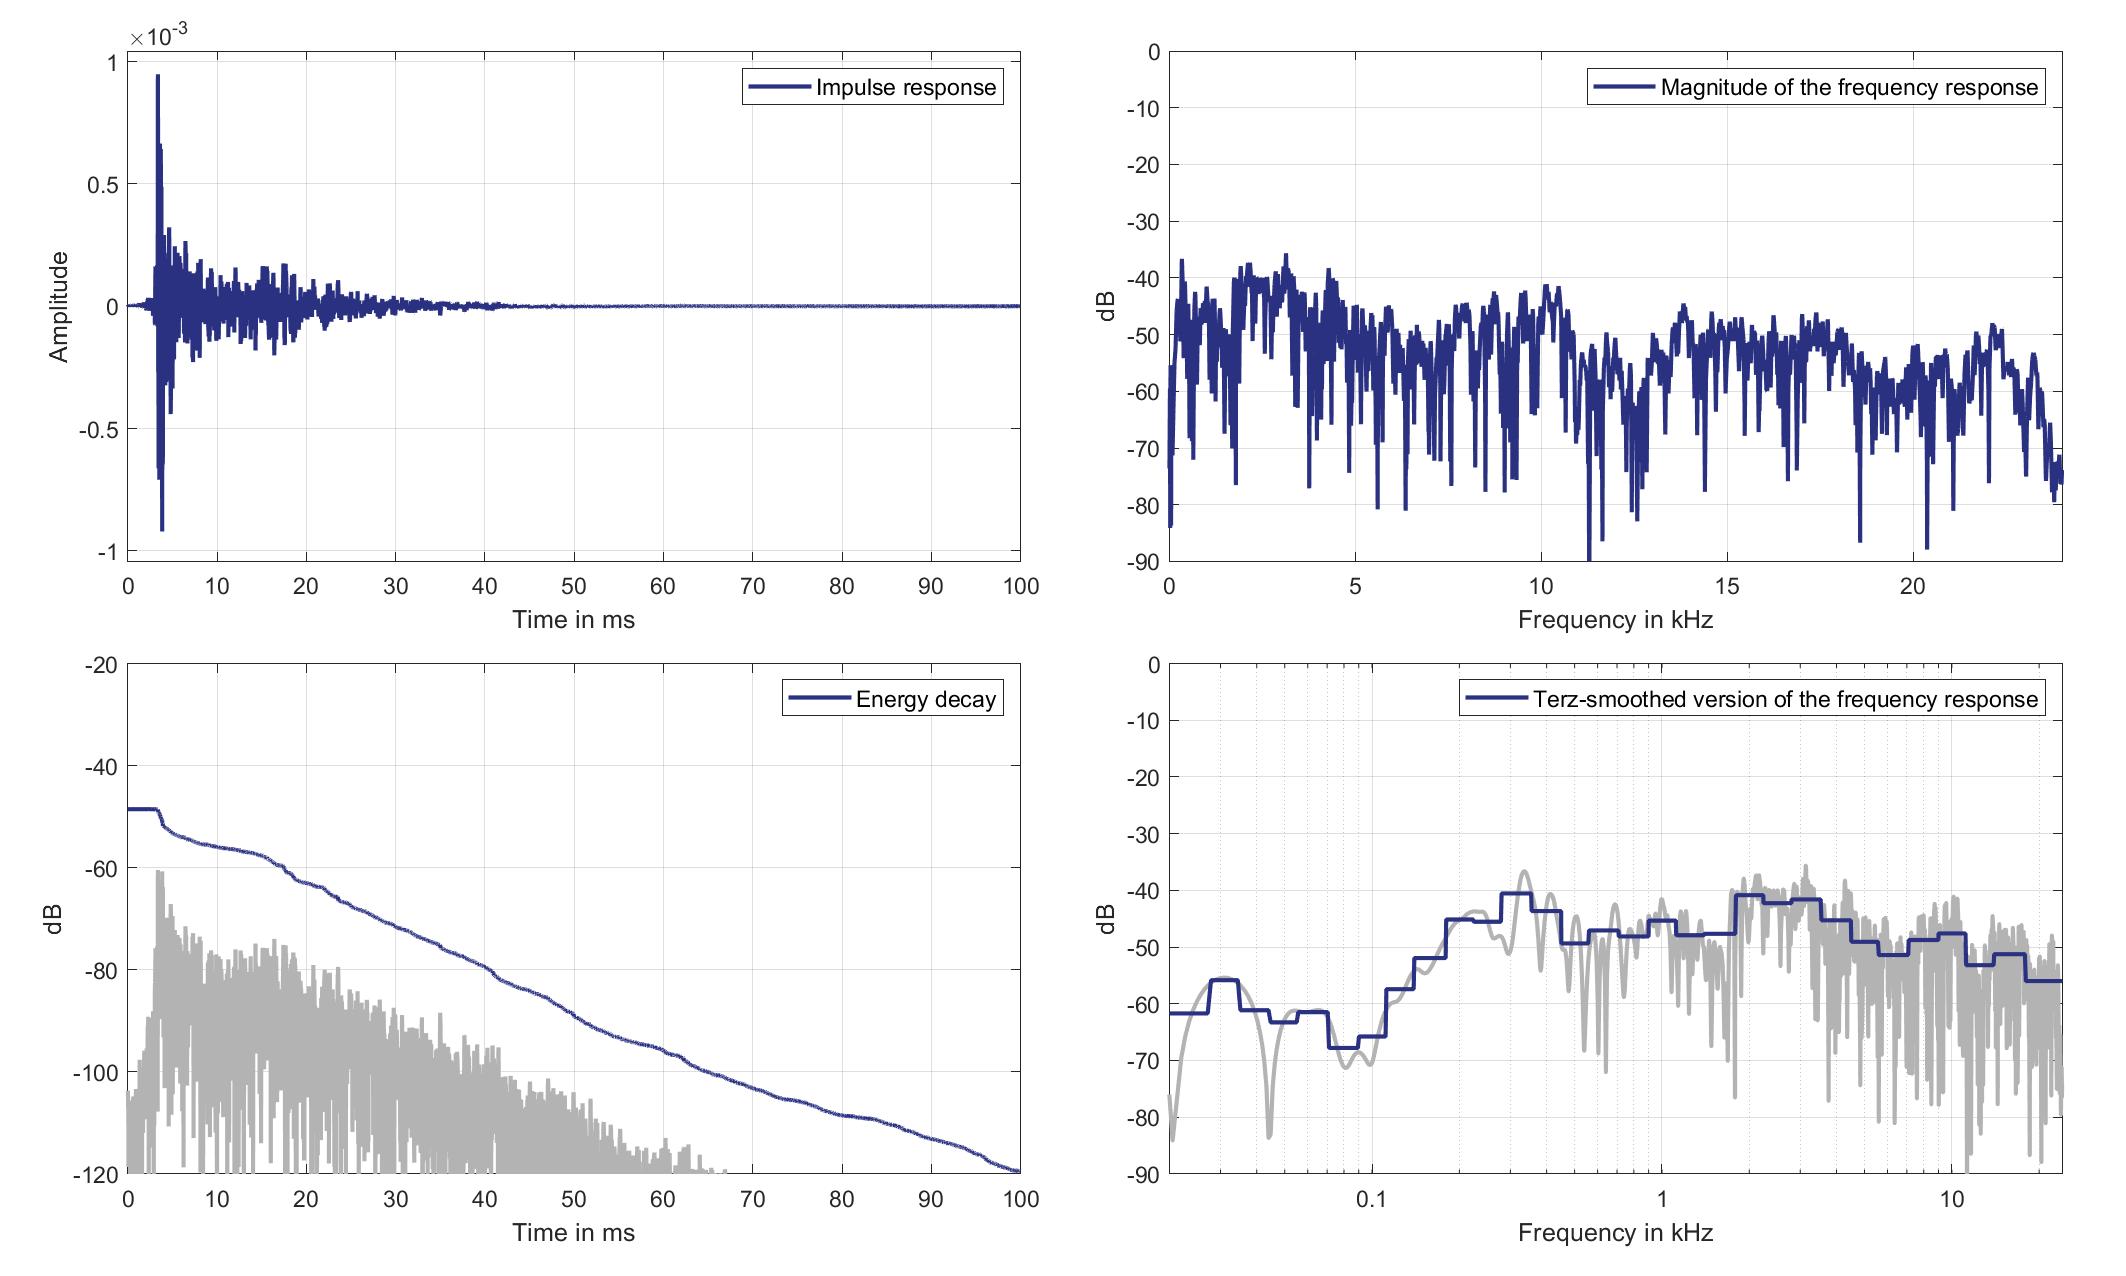
Download impulse response (in ".fir" format).
In the download section you can download all impulse response files as well as format explanation and Matlab as well as Python code examples for loading fir files.
Right lsp. - Right ear mic.
Right Headrest Loudspeaker of Zone 8 (Lsp. 11 to Right Ear Microphone of Zone 5 (Mic. 26)
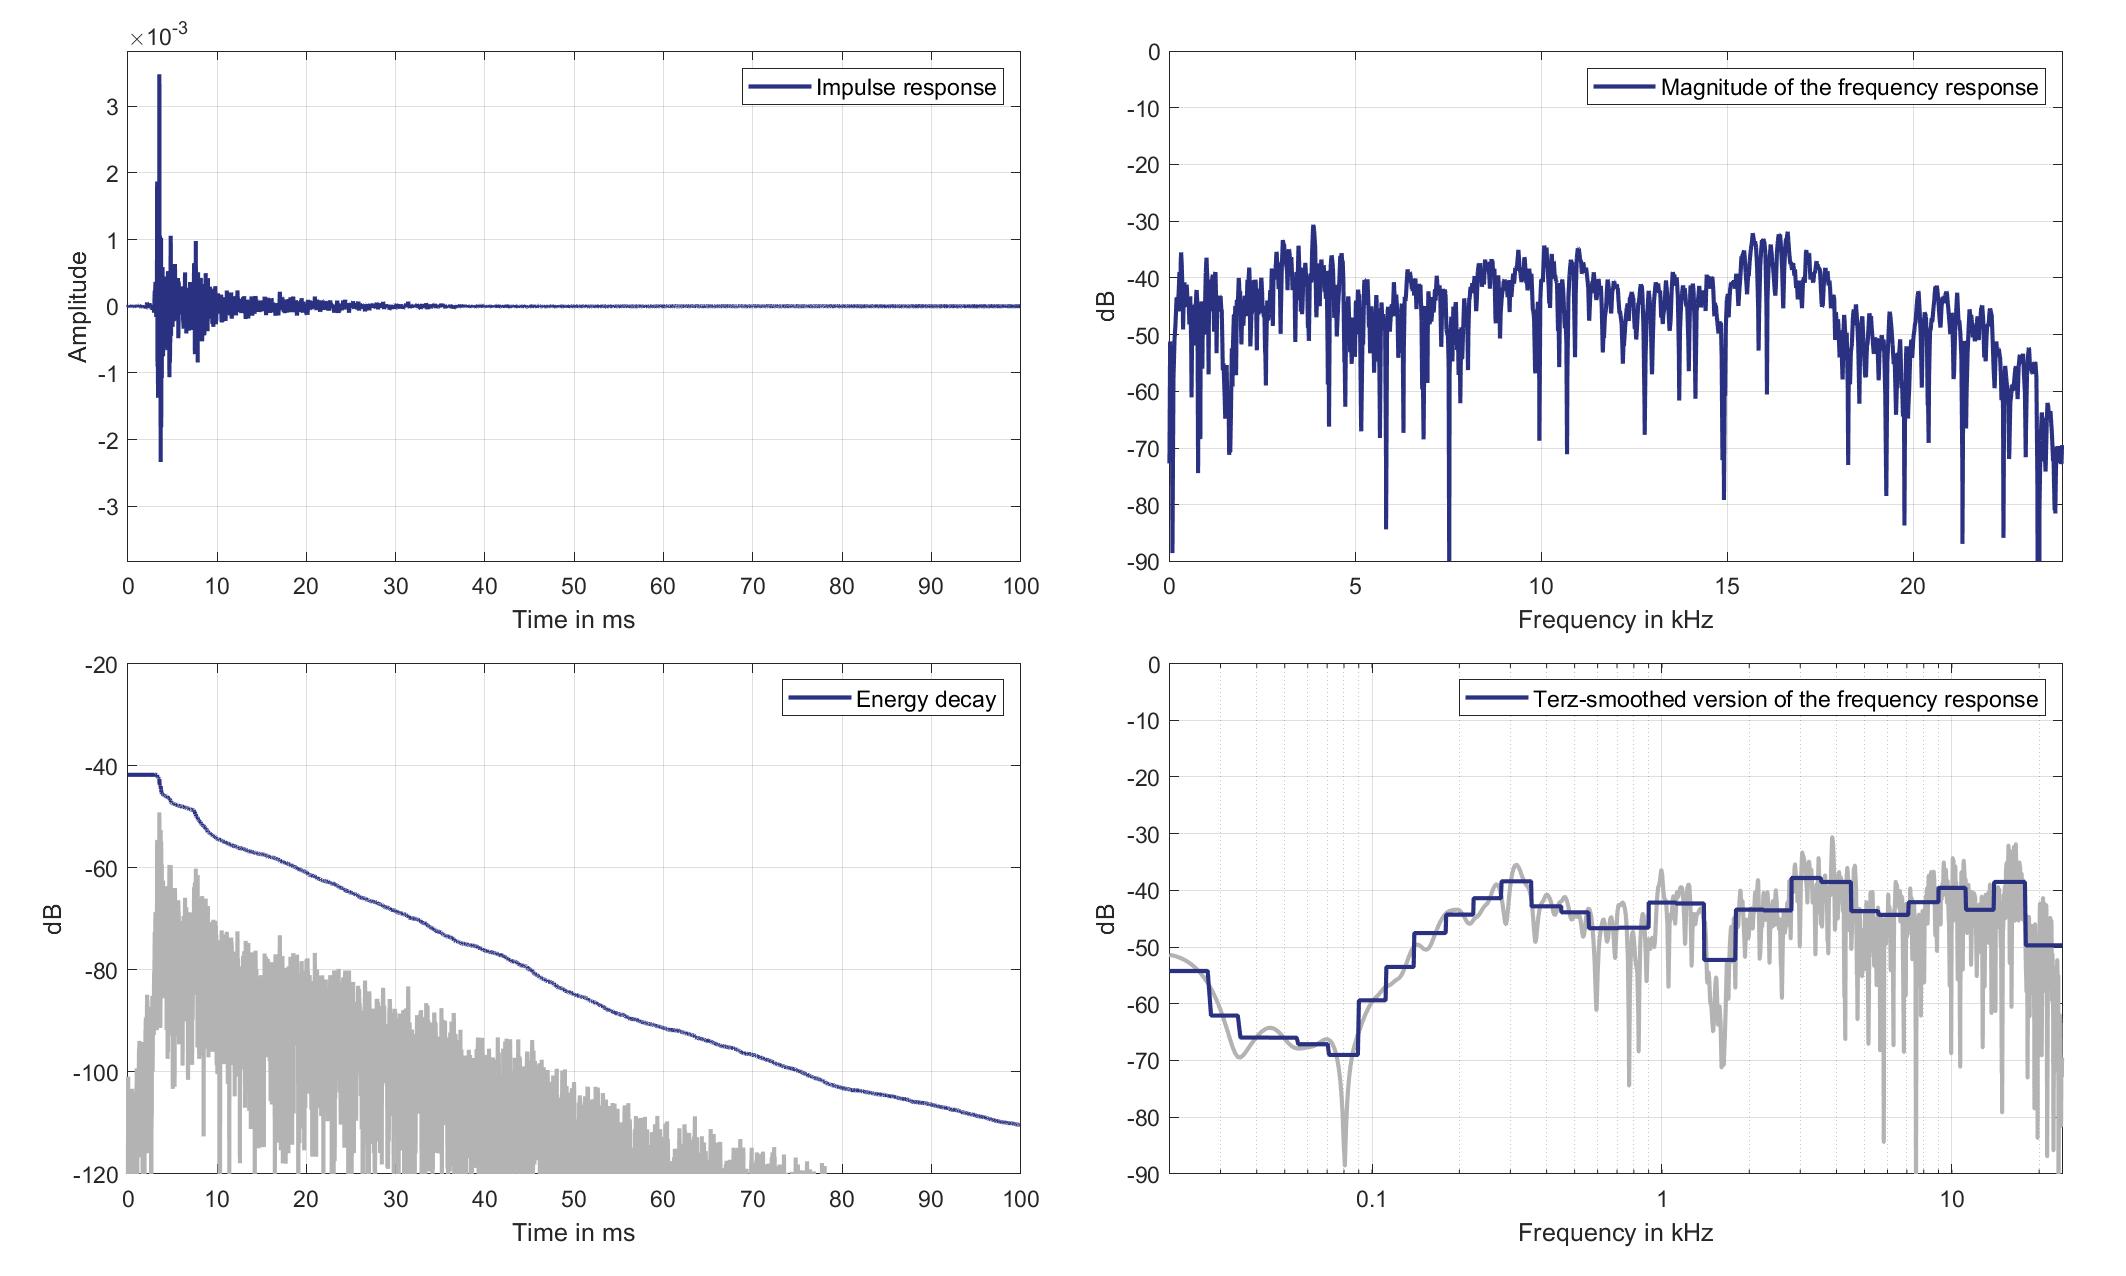
Download impulse response (in ".fir" format).
In the download section you can download all impulse response files as well as format explanation and Matlab as well as Python code examples for loading fir files.
Mics. 27/28
Left lsp. - left ear mic.
Left Headrest Loudspeaker of Zone 8 (Lsp. 10) to Left Ear Microphone of Zone 6 (Mic. 27)
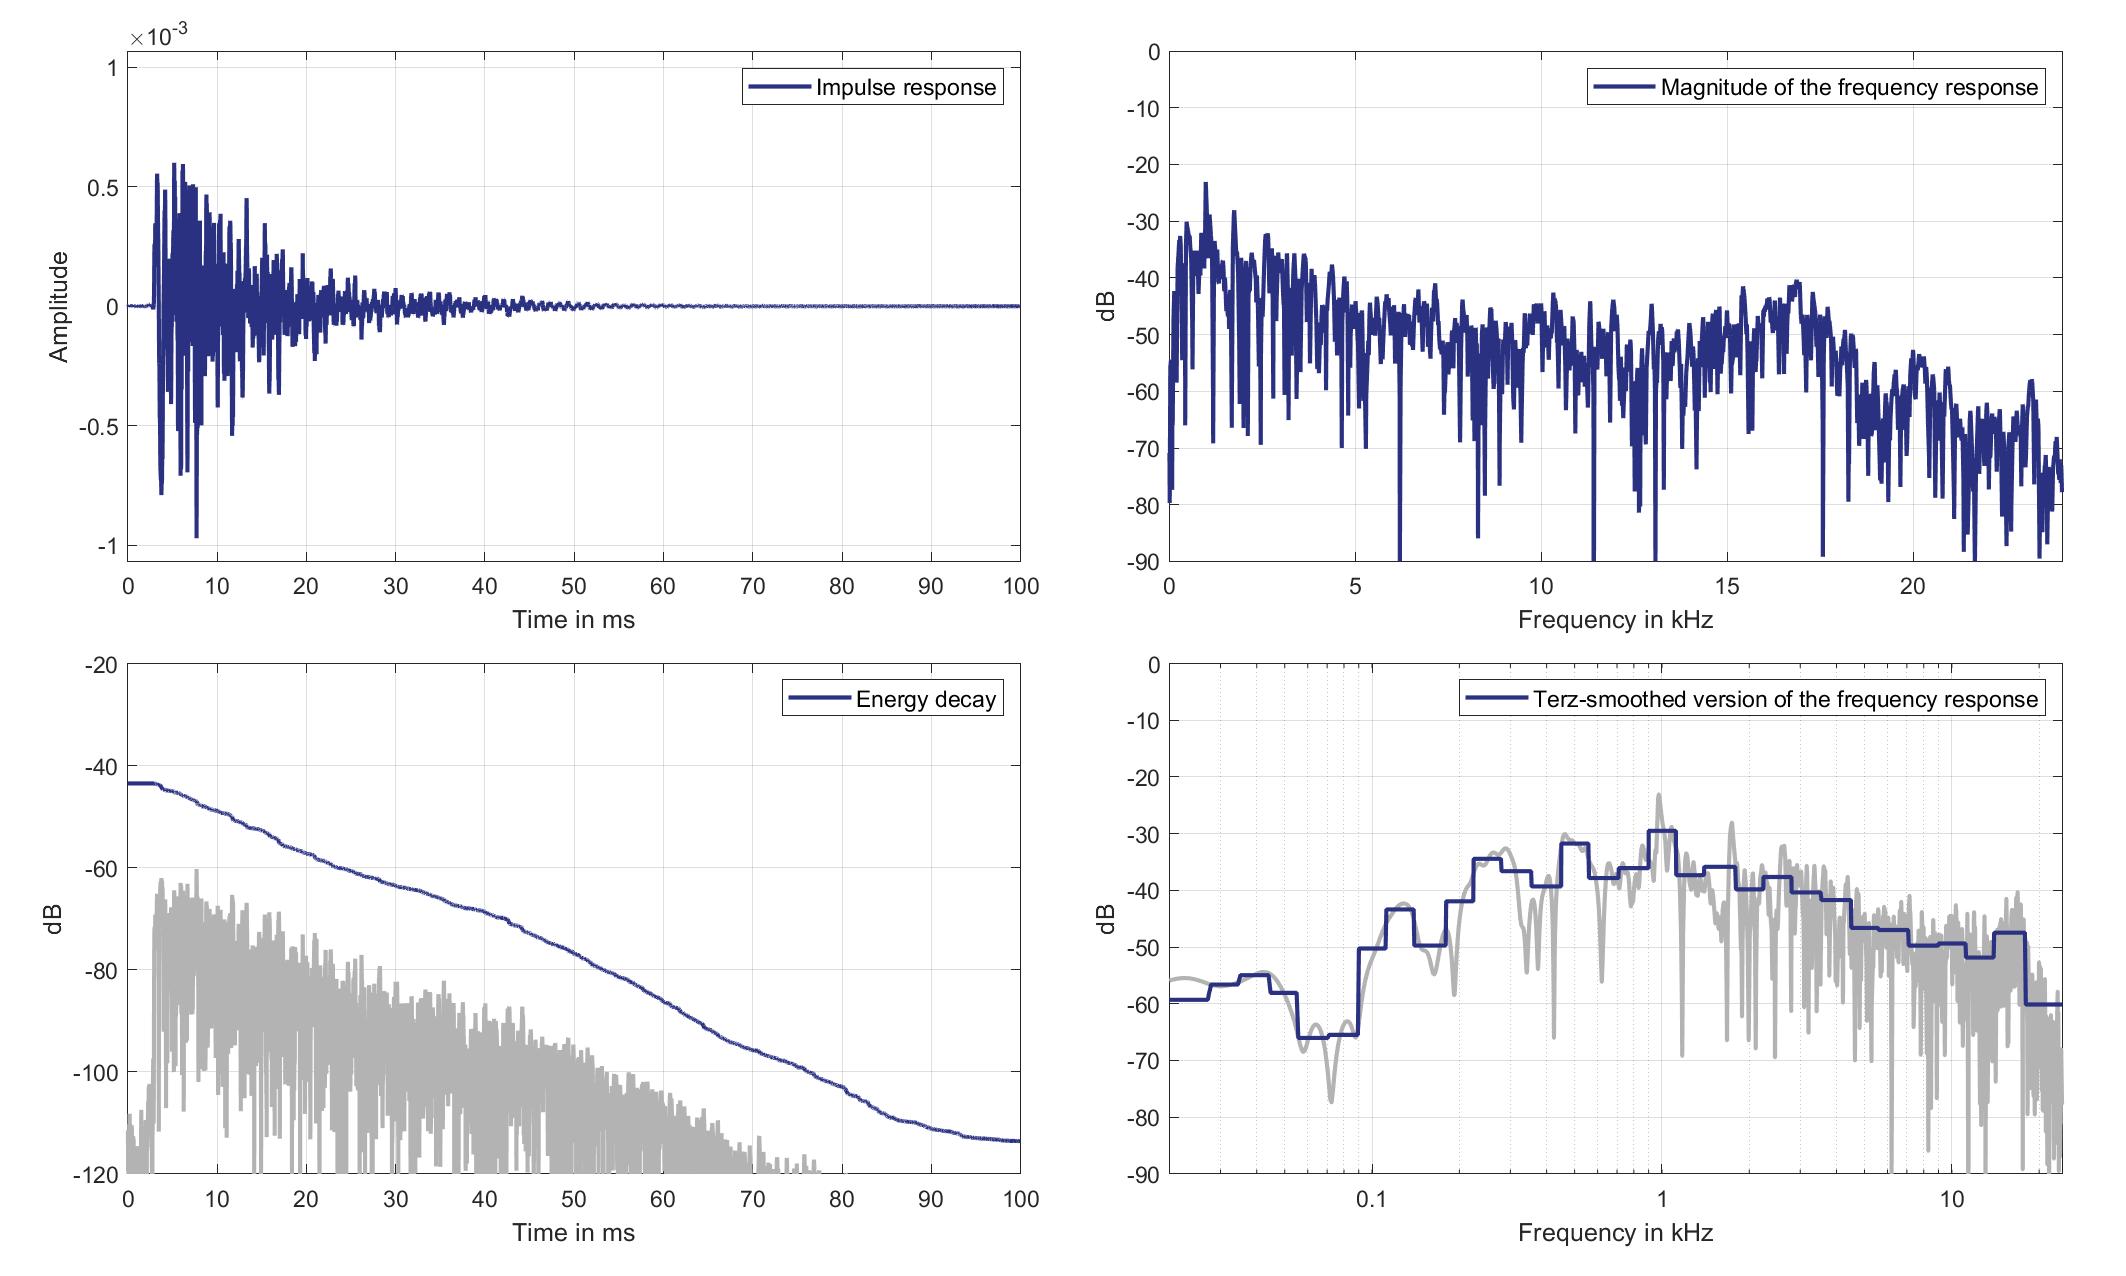
Download impulse response (in ".fir" format).
In the download section you can download all impulse response files as well as format explanation and Matlab as well as Python code examples for loading fir files.
Left lsp. - Right ear mic.
Left Headrest Loudspeaker of Zone 8 (Lsp. 10) to Right Ear Microphone of Zone 6 (Mic. 28)
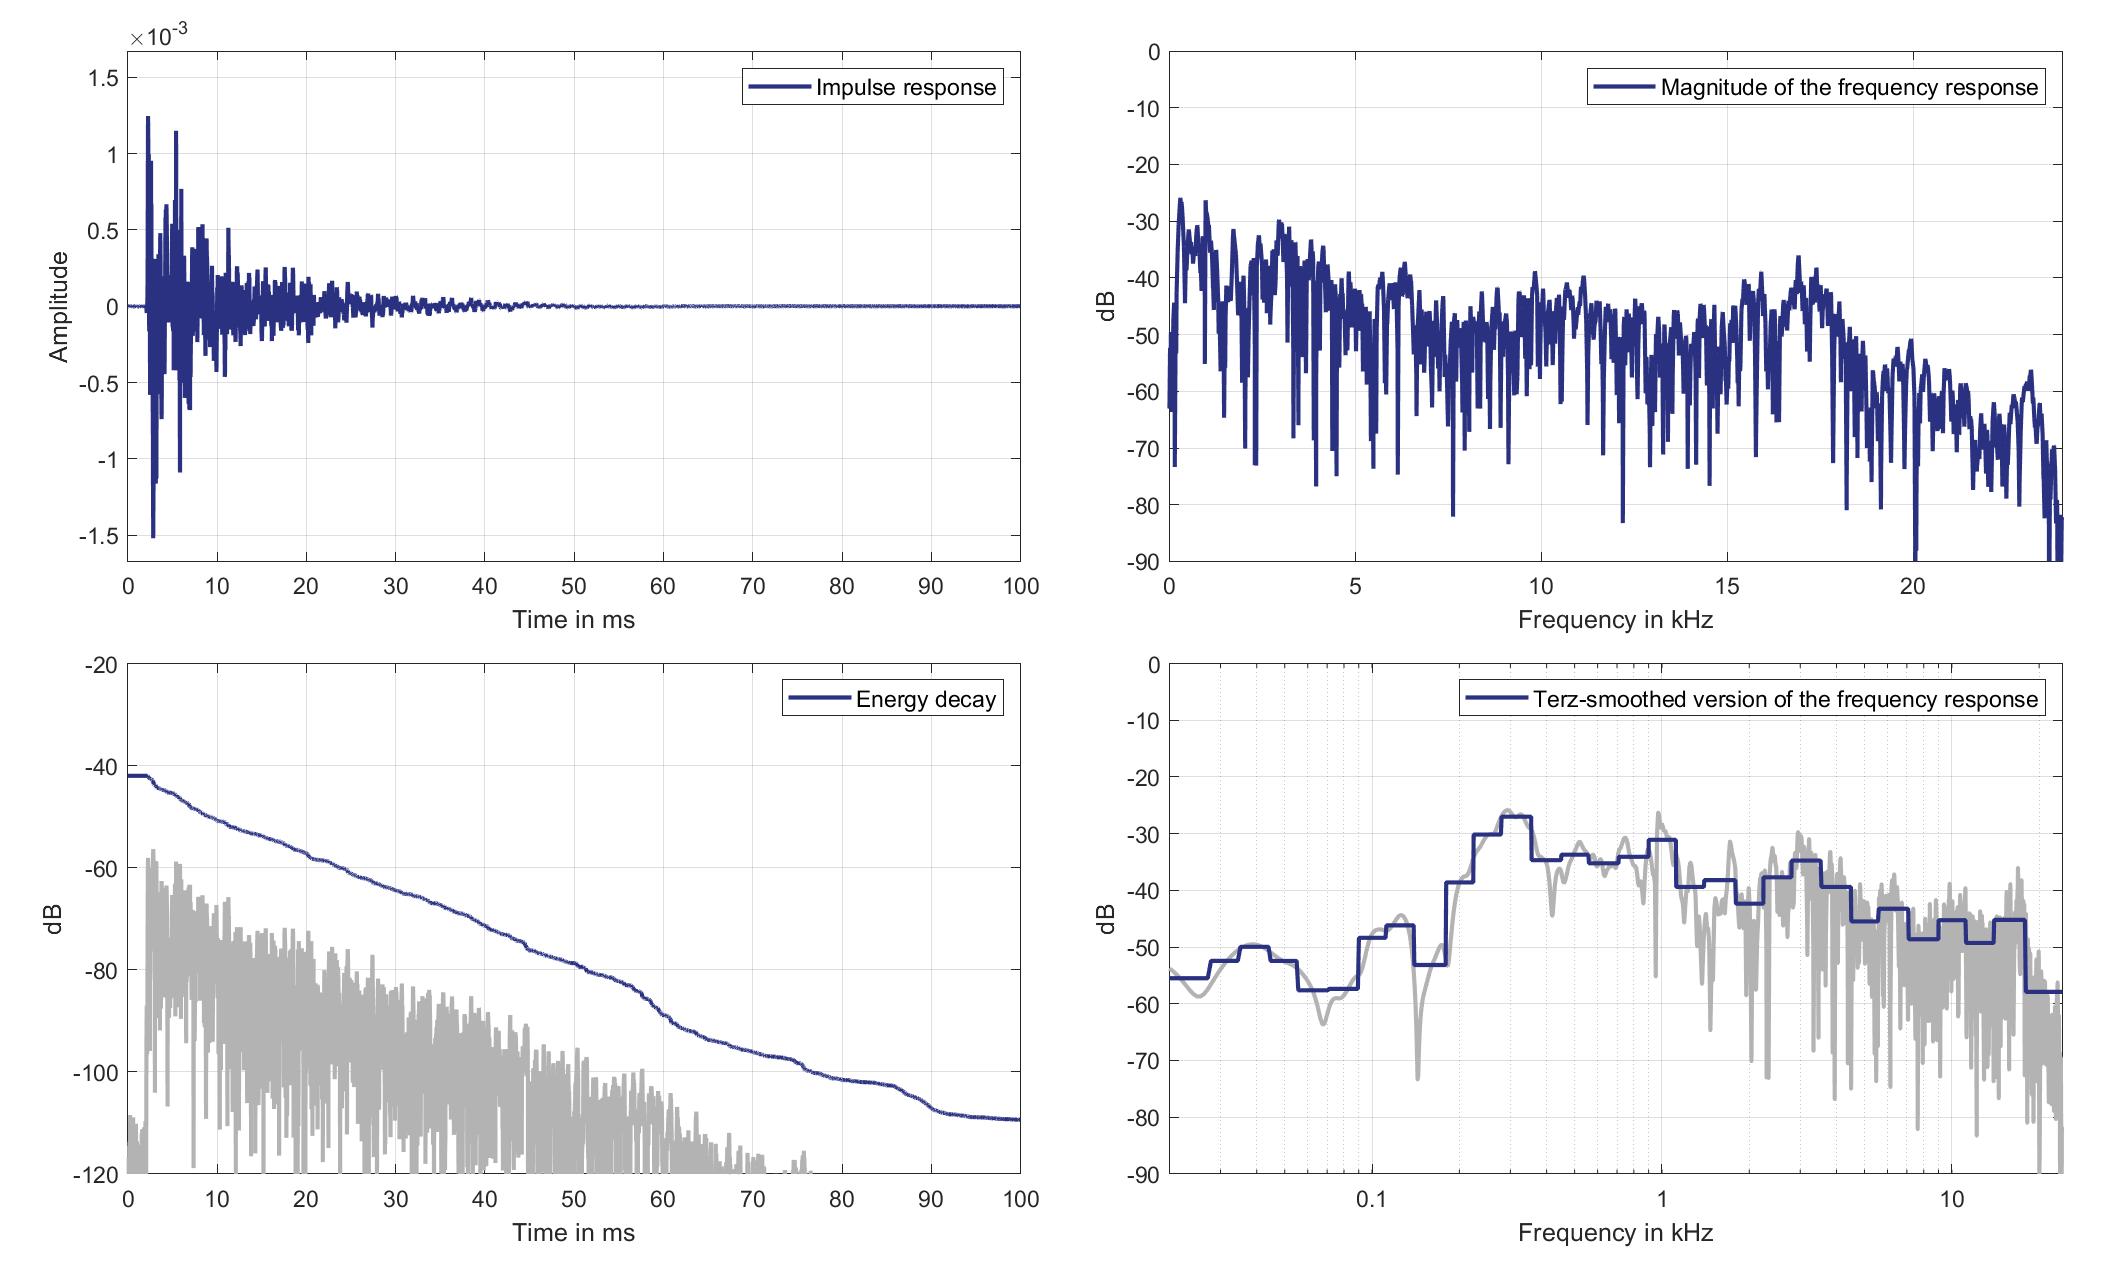
Download impulse response (in ".fir" format).
In the download section you can download all impulse response files as well as format explanation and Matlab as well as Python code examples for loading fir files.
Right lsp. - left ear mic.
Right Headrest Loudspeaker of Zone 8 (Lsp. 11) to Left Ear Microphone of Zone 6 (Mic. 27)
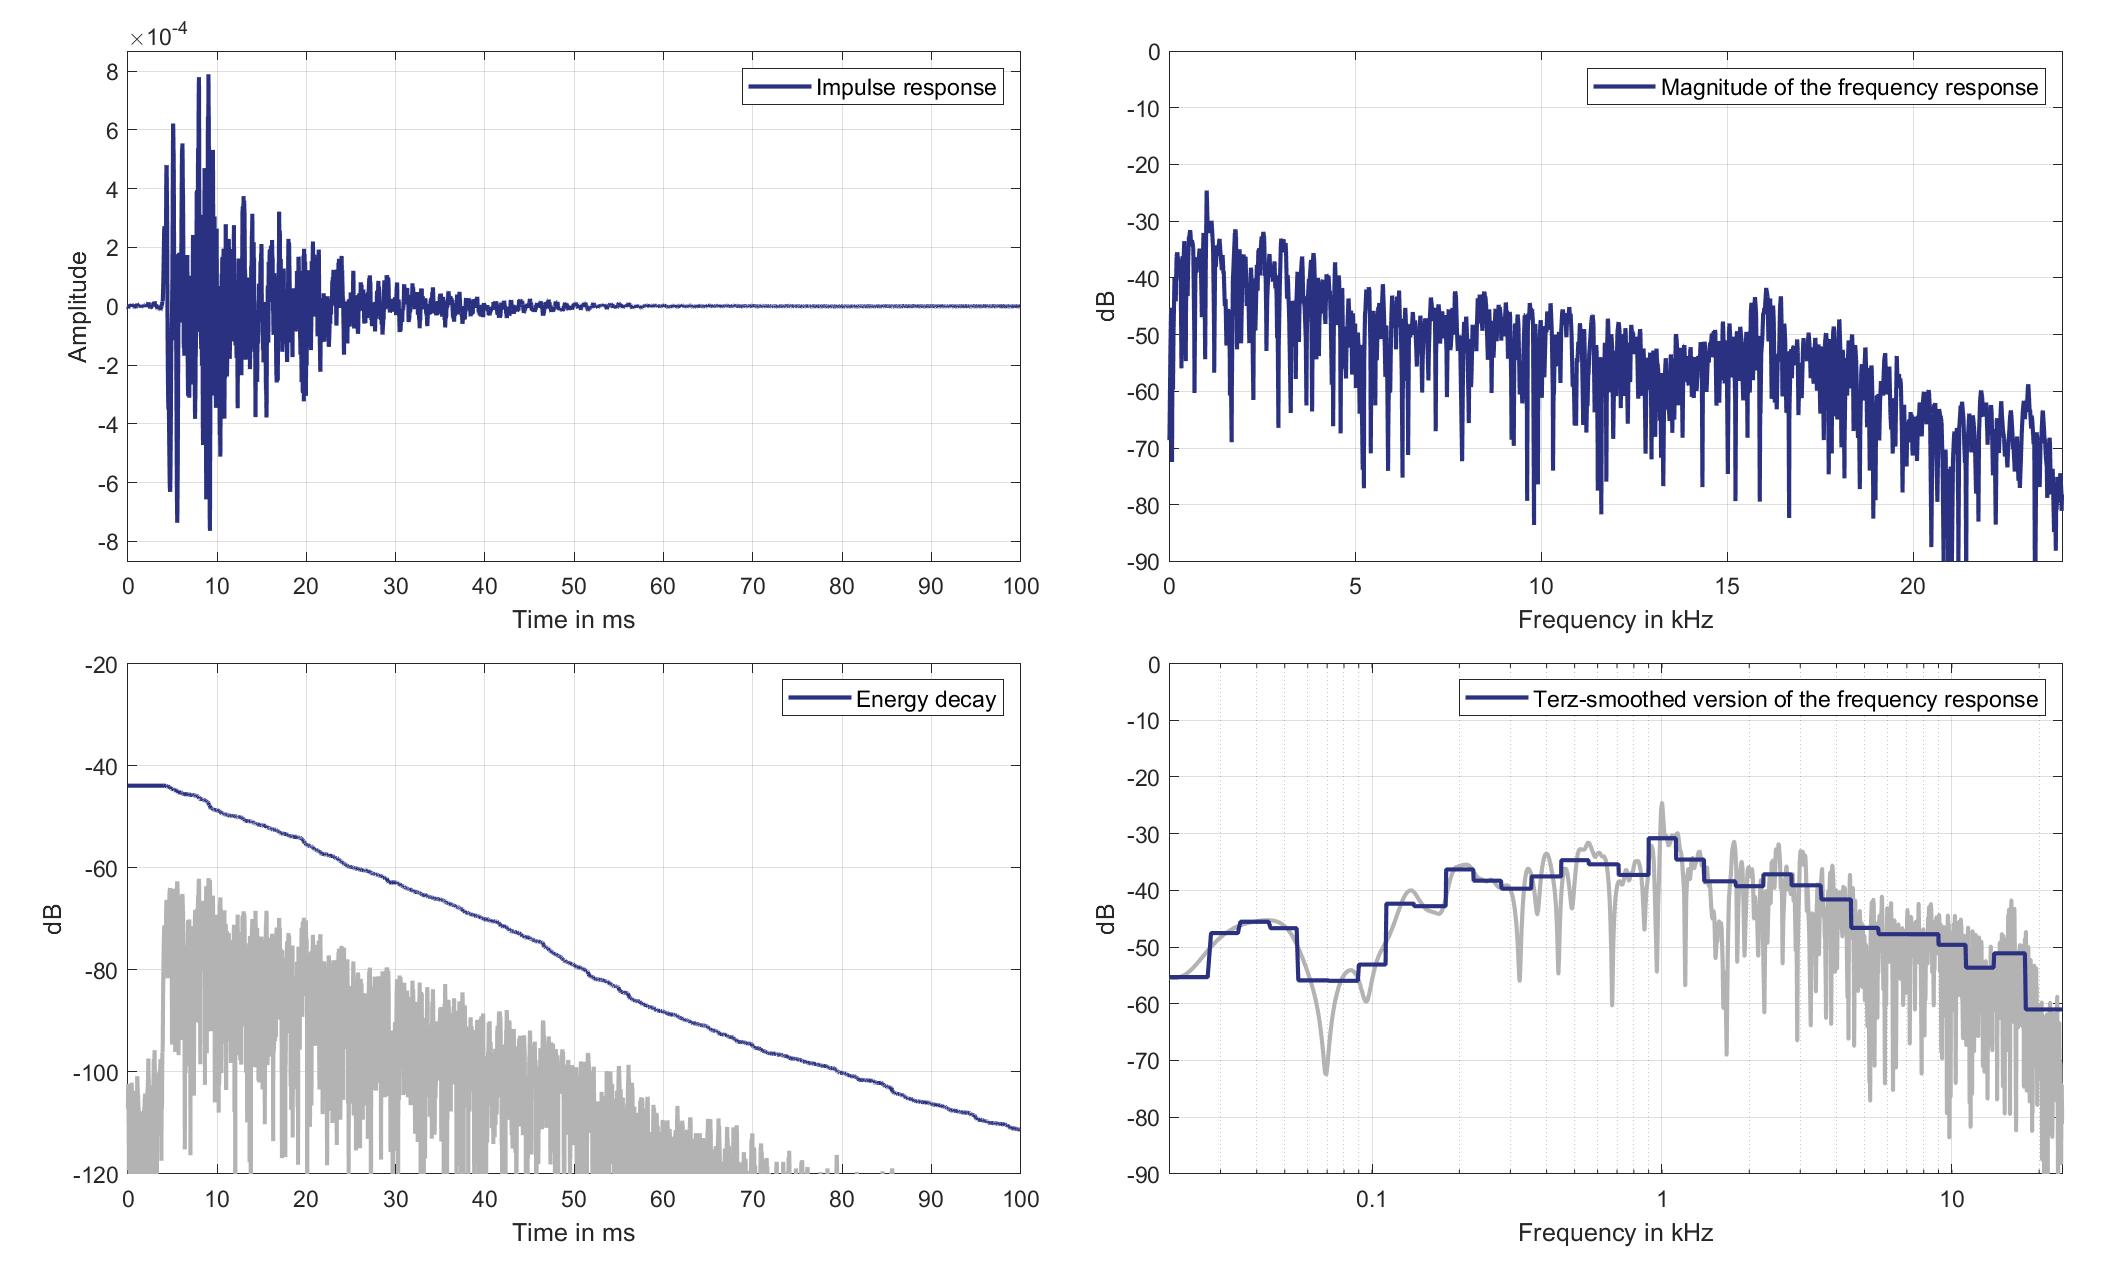
Download impulse response (in ".fir" format).
In the download section you can download all impulse response files as well as format explanation and Matlab as well as Python code examples for loading fir files.
Right lsp. - Right ear mic.
Right Headrest Loudspeaker of Zone 8 (Lsp. 11 to Right Ear Microphone of Zone 6 (Mic. 28)
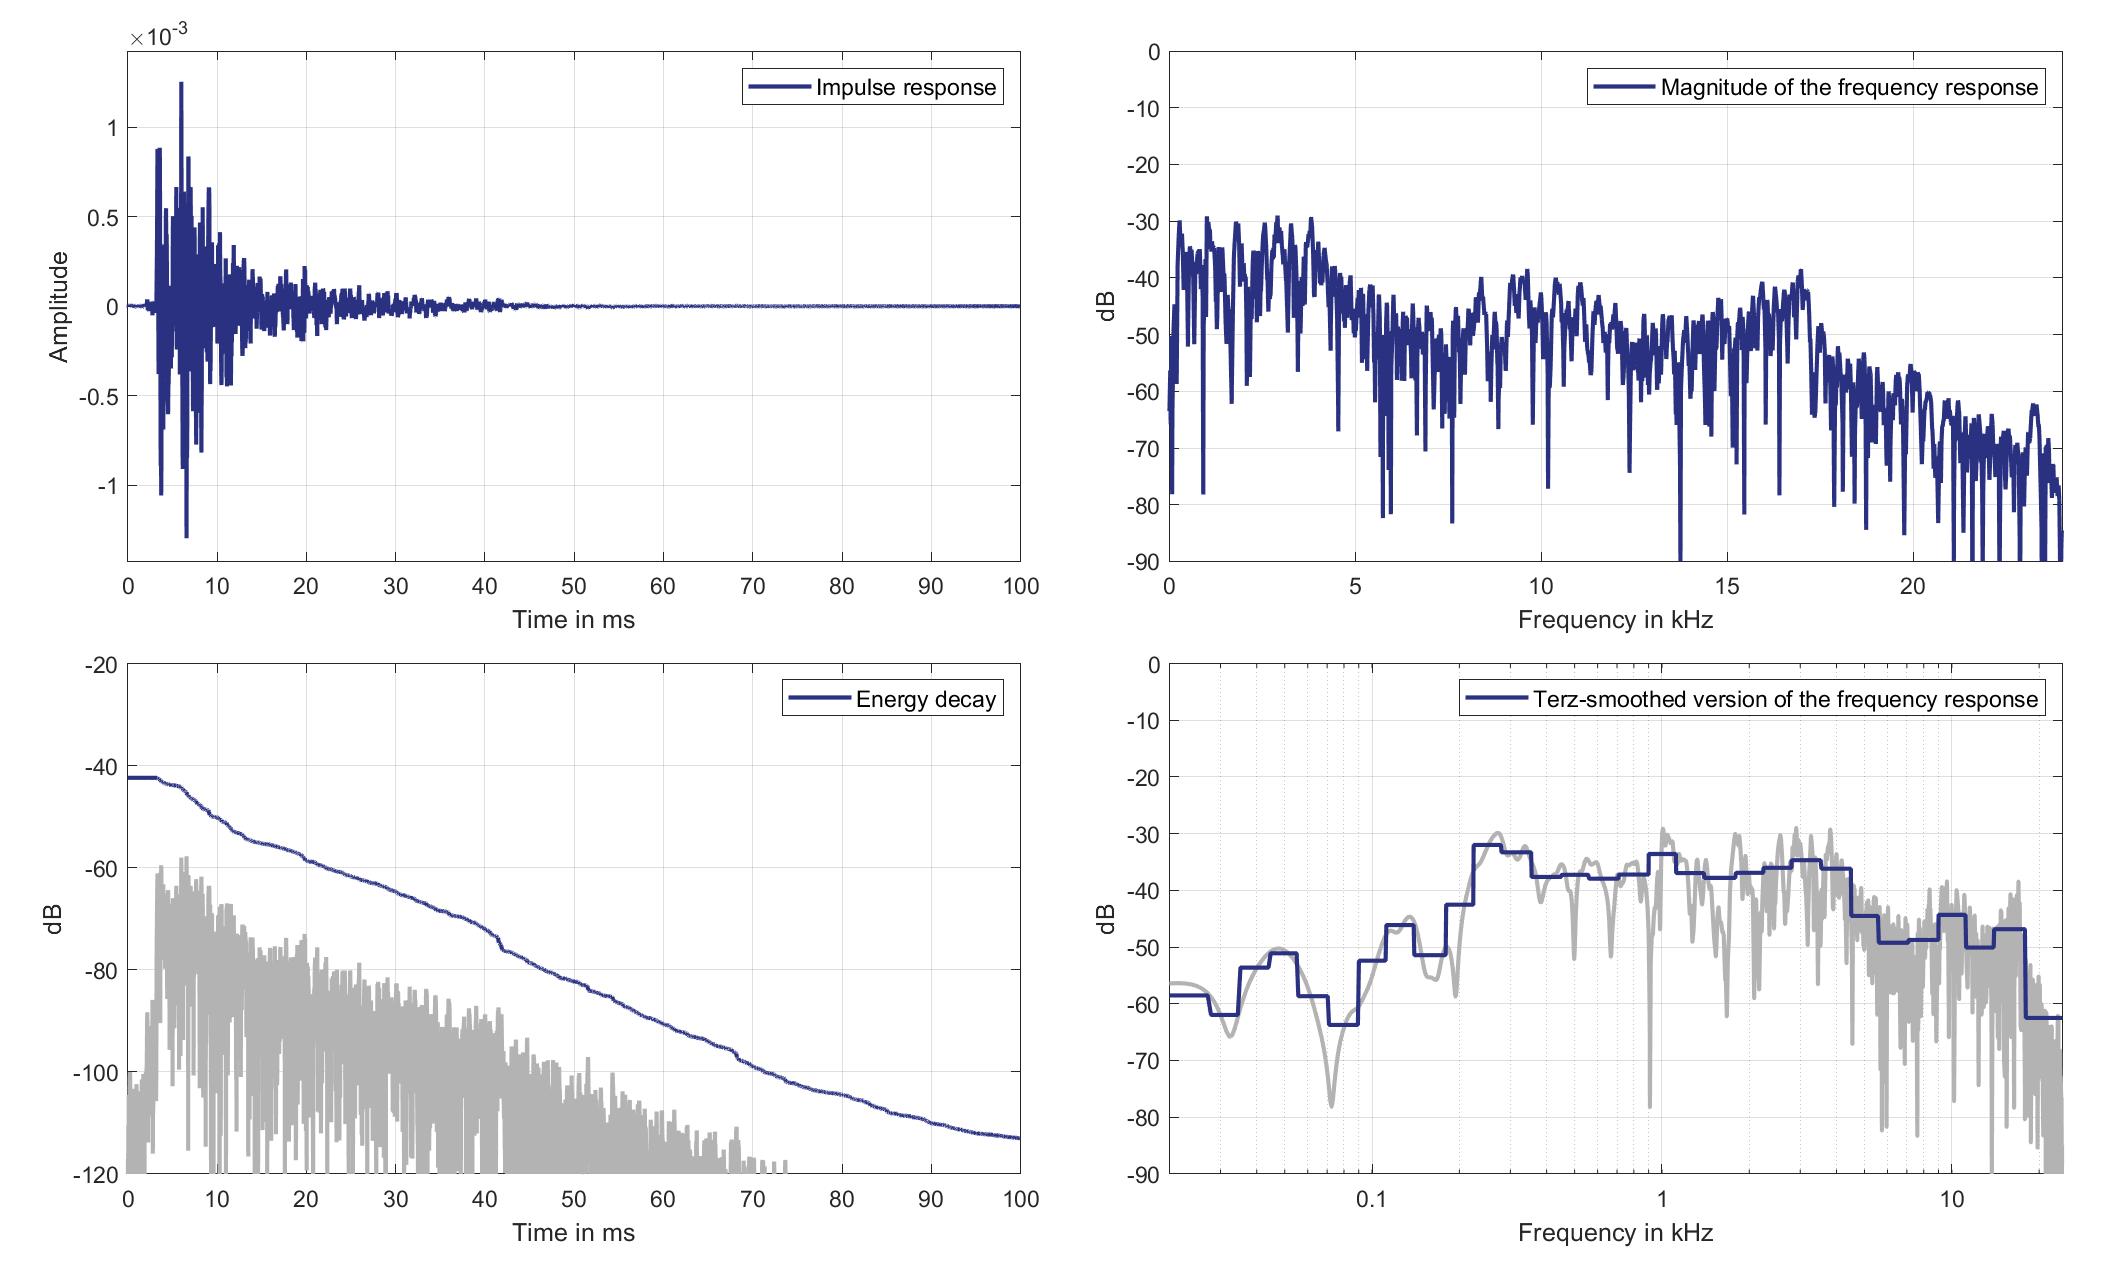
Download impulse response (in ".fir" format).
In the download section you can download all impulse response files as well as format explanation and Matlab as well as Python code examples for loading fir files.
Mics. 29/30
Left lsp. - left ear mic.
Left Headrest Loudspeaker of Zone 8 (Lsp. 10) to Left Ear Microphone of Zone 8 (Mic. 29)
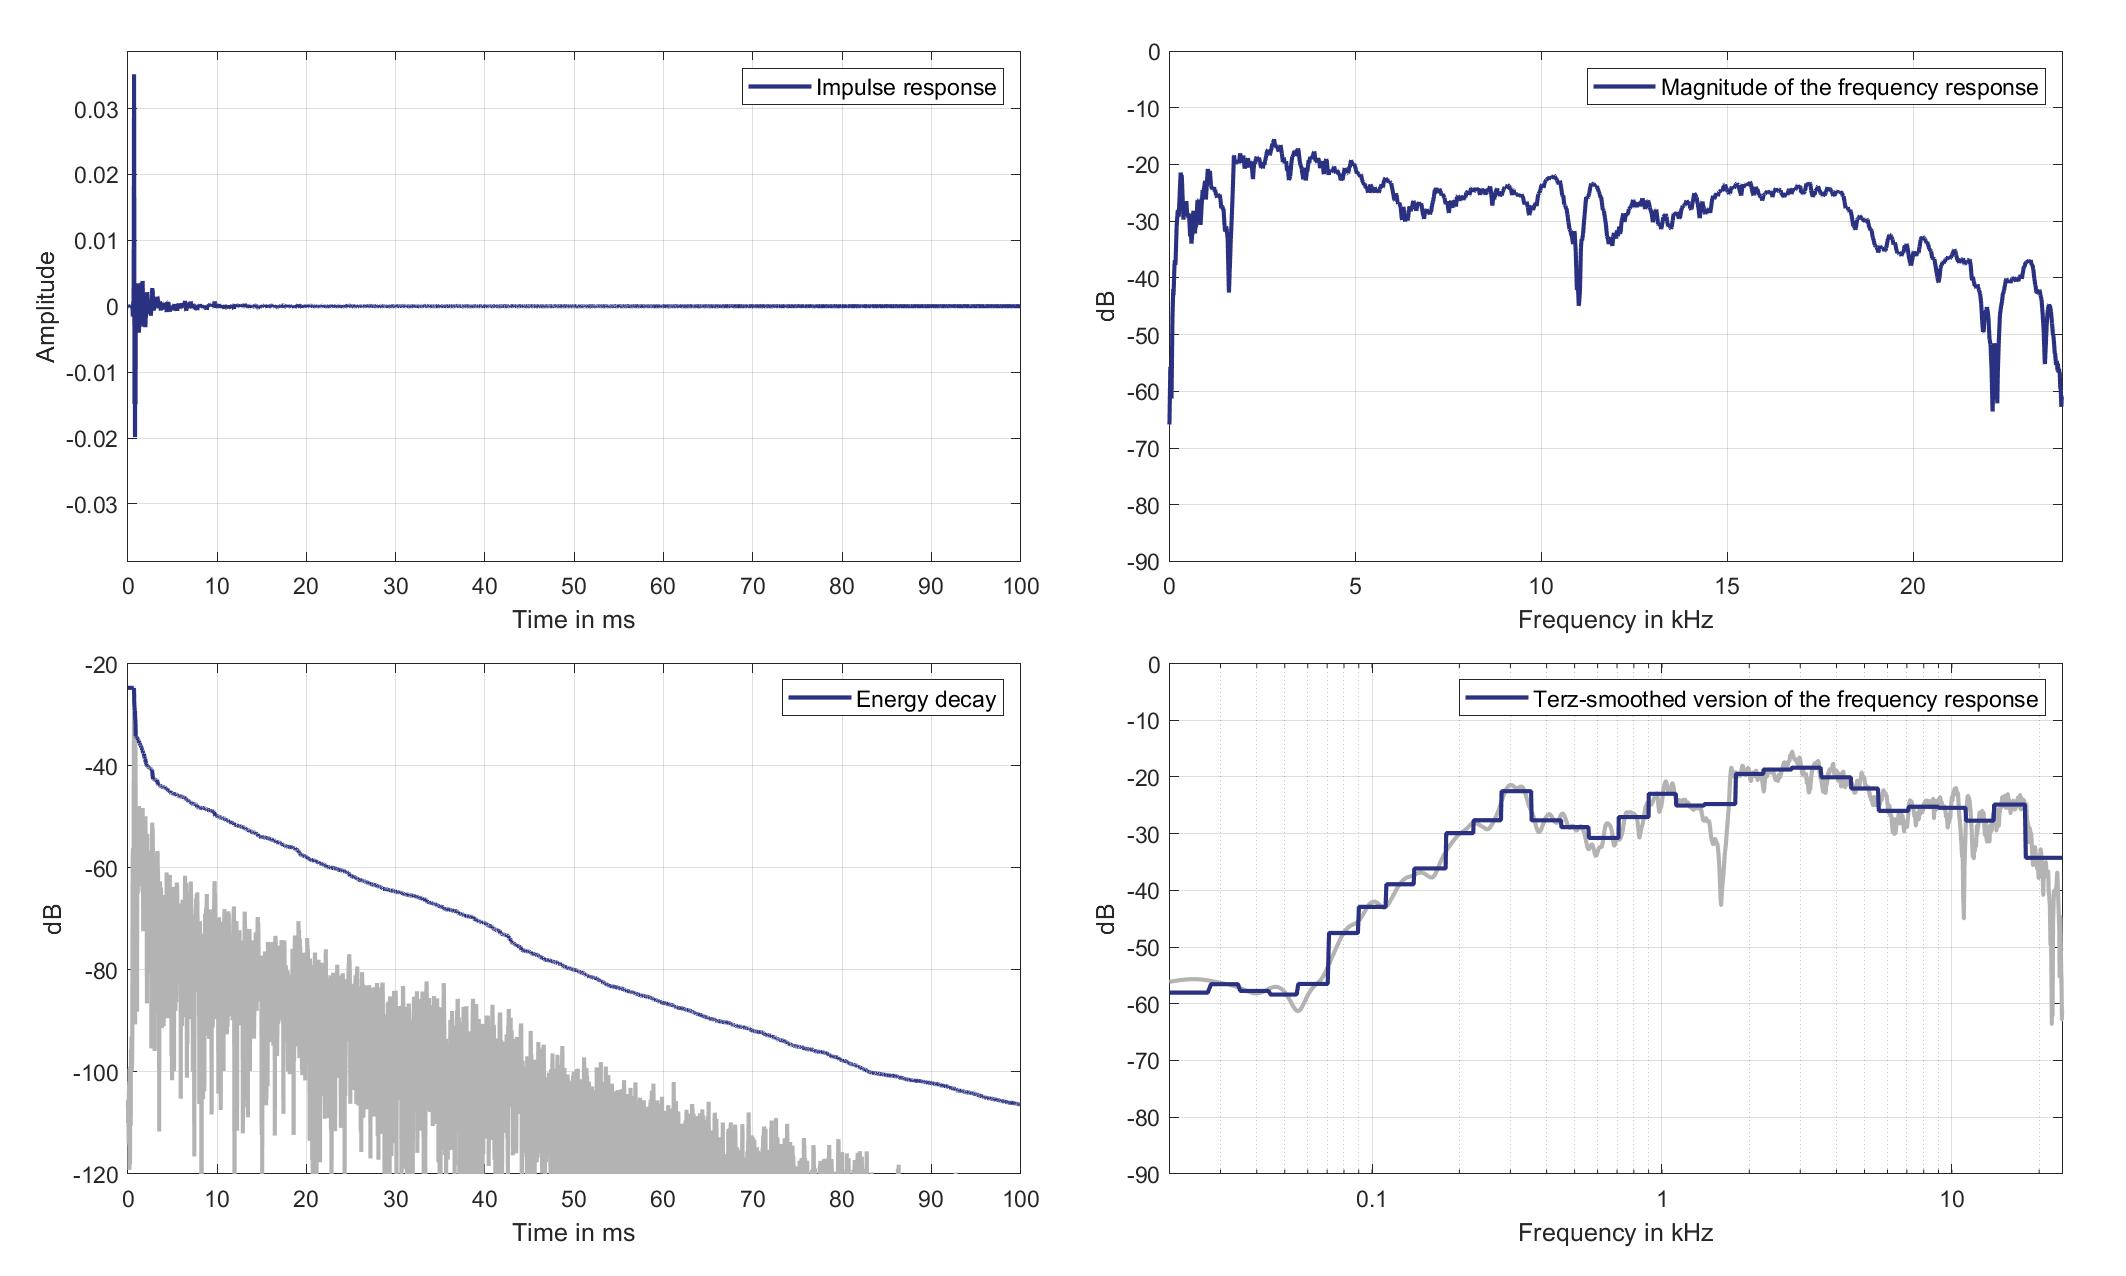
Download impulse response (in ".fir" format).
In the download section you can download all impulse response files as well as format explanation and Matlab as well as Python code examples for loading fir files.
Left lsp. - Right ear mic.
Left Headrest Loudspeaker of Zone 8 (Lsp. 10) to Right Ear Microphone of Zone 8 (Mic. 30)
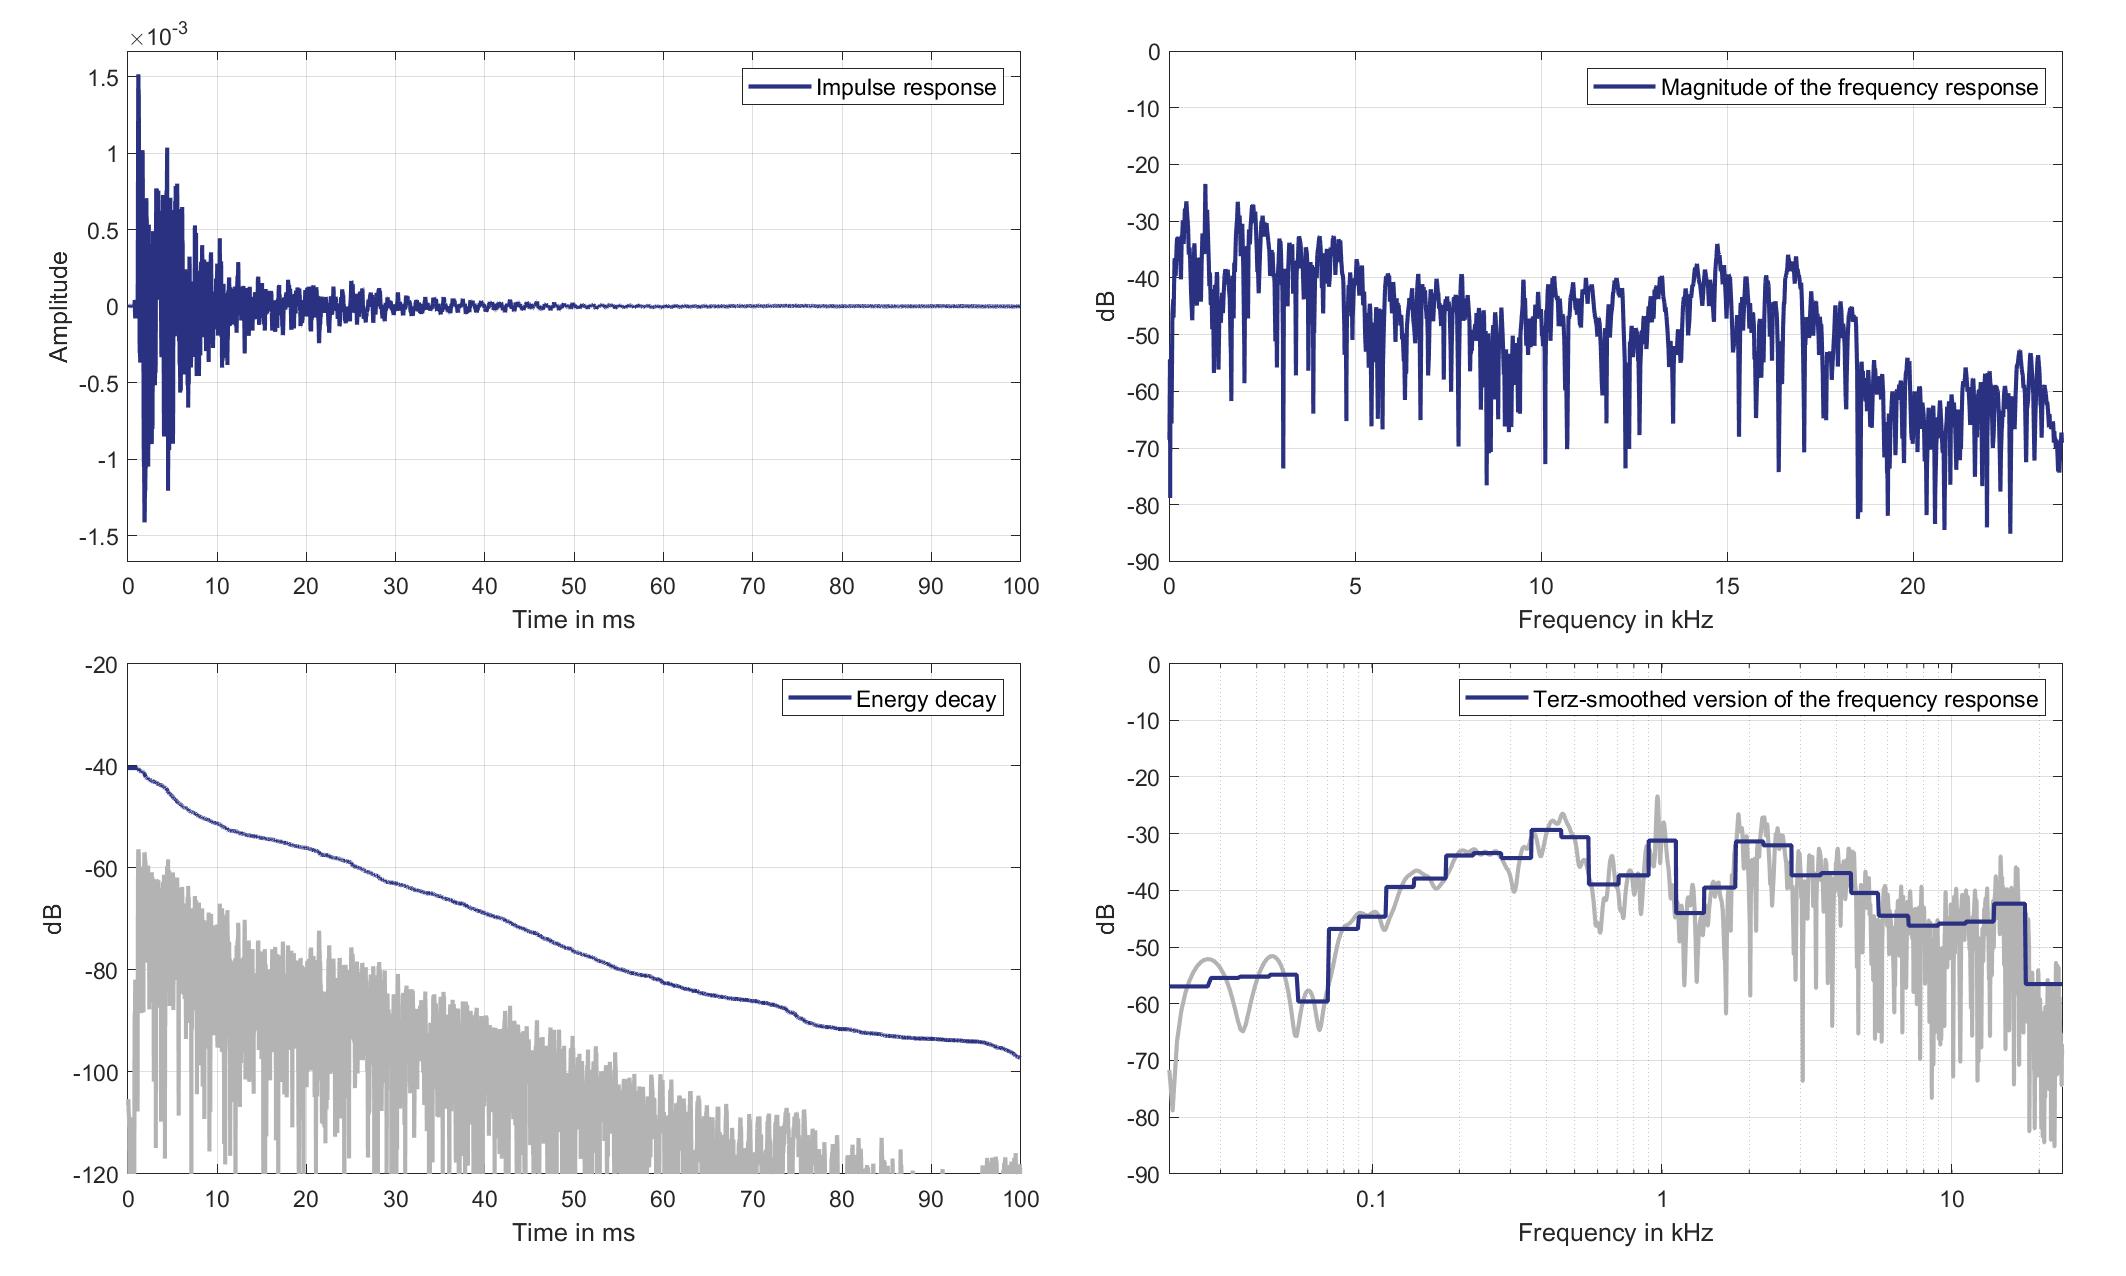
Download impulse response (in ".fir" format).
In the download section you can download all impulse response files as well as format explanation and Matlab as well as Python code examples for loading fir files.
Right lsp. - left ear mic.
Right Headrest Loudspeaker of Zone 8 (Lsp. 11) to Left Ear Microphone of Zone 8 (Mic. 29)
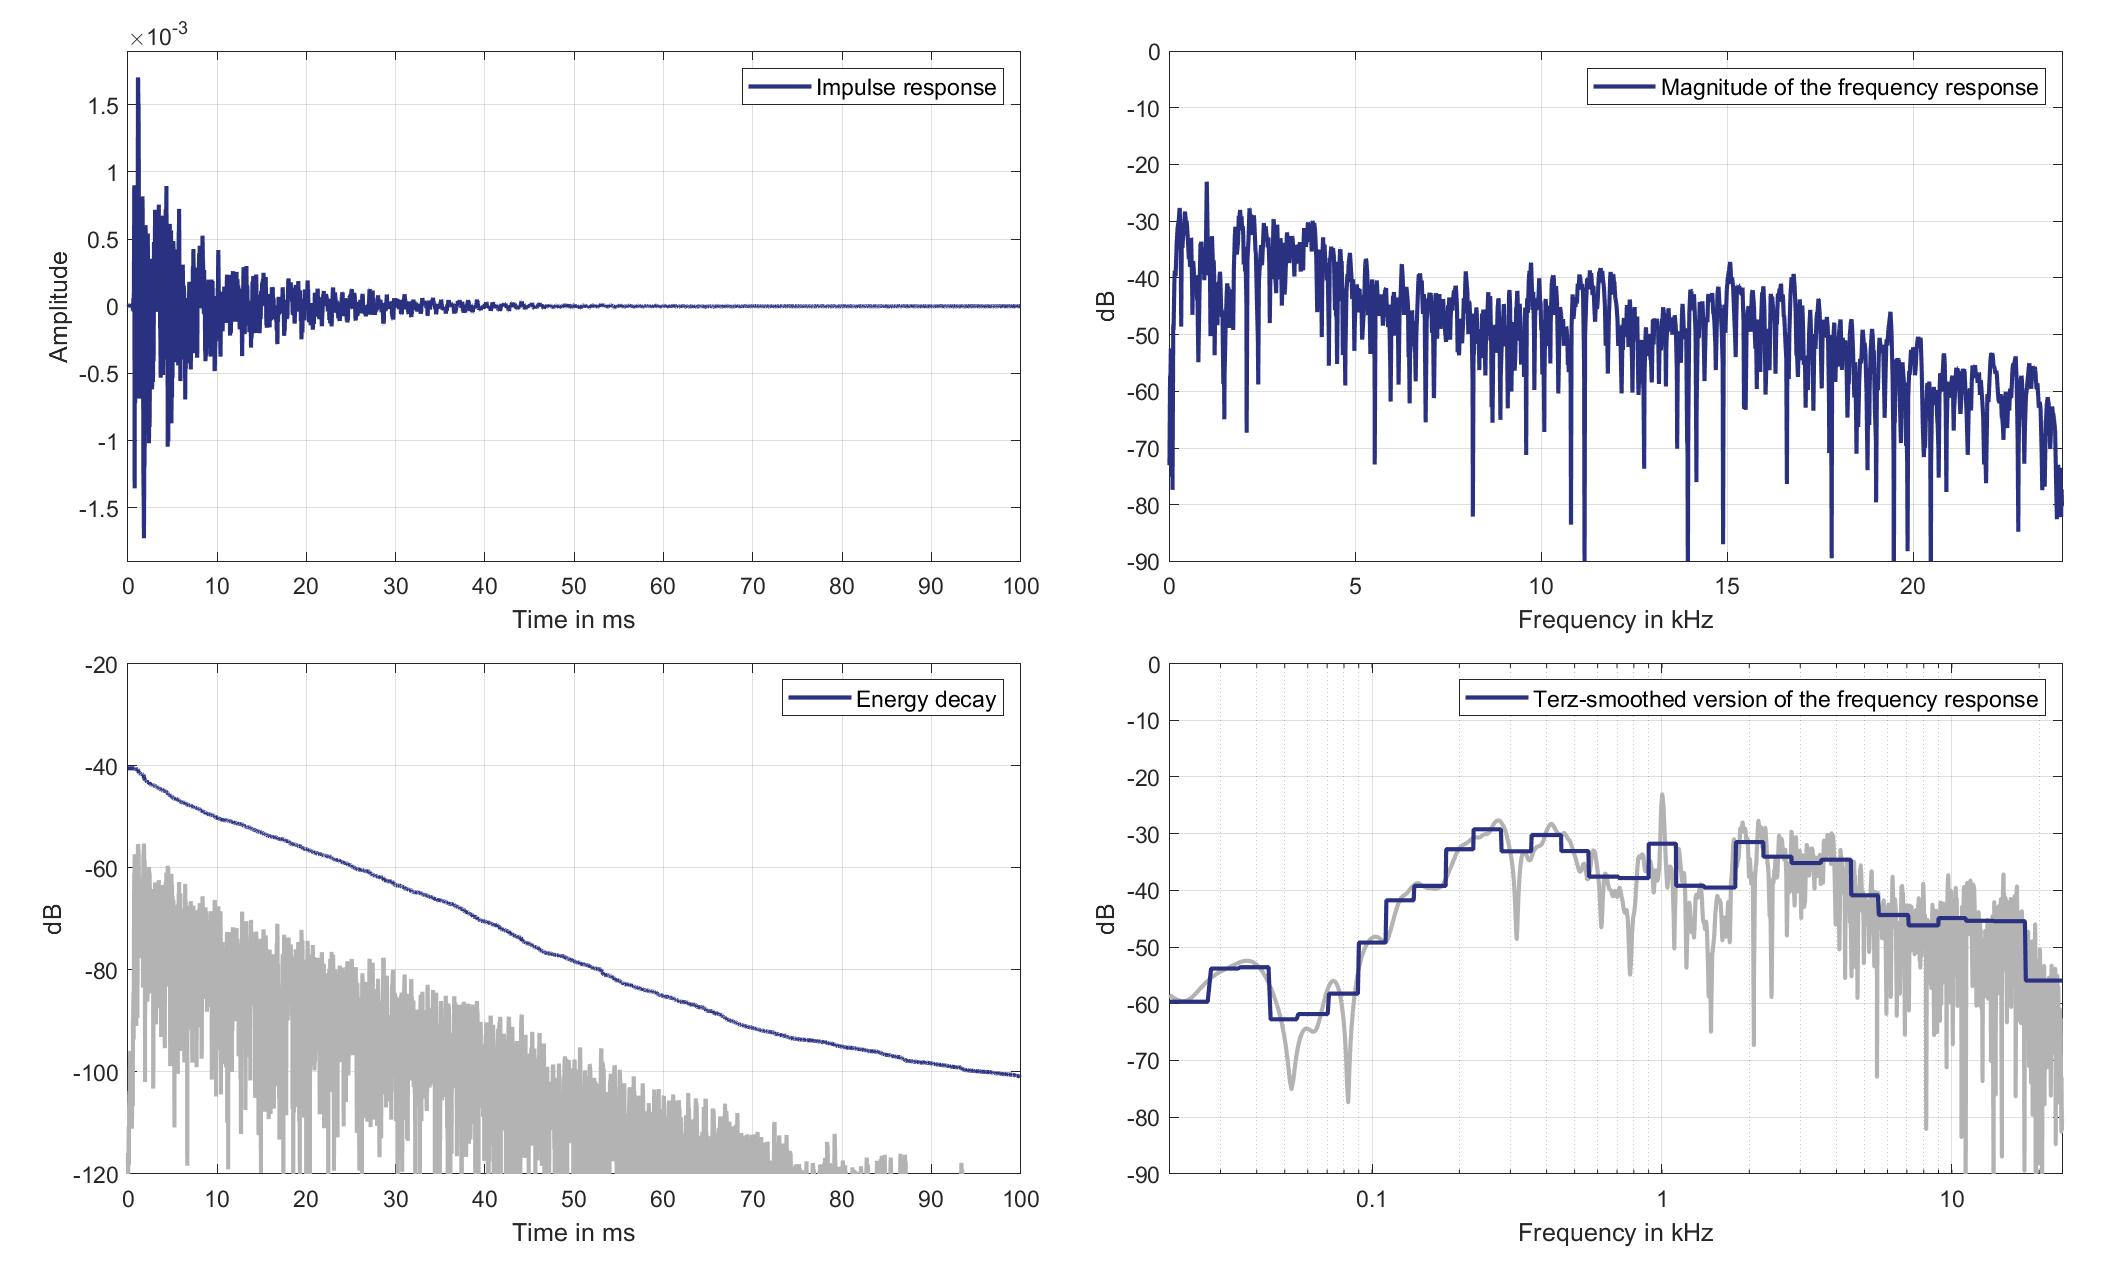
Download impulse response (in ".fir" format).
In the download section you can download all impulse response files as well as format explanation and Matlab as well as Python code examples for loading fir files.
Right lsp. - Right ear mic.
Right Headrest Loudspeaker of Zone 8 (Lsp. 11 to Right Ear Microphone of Zone 8 (Mic. 30)
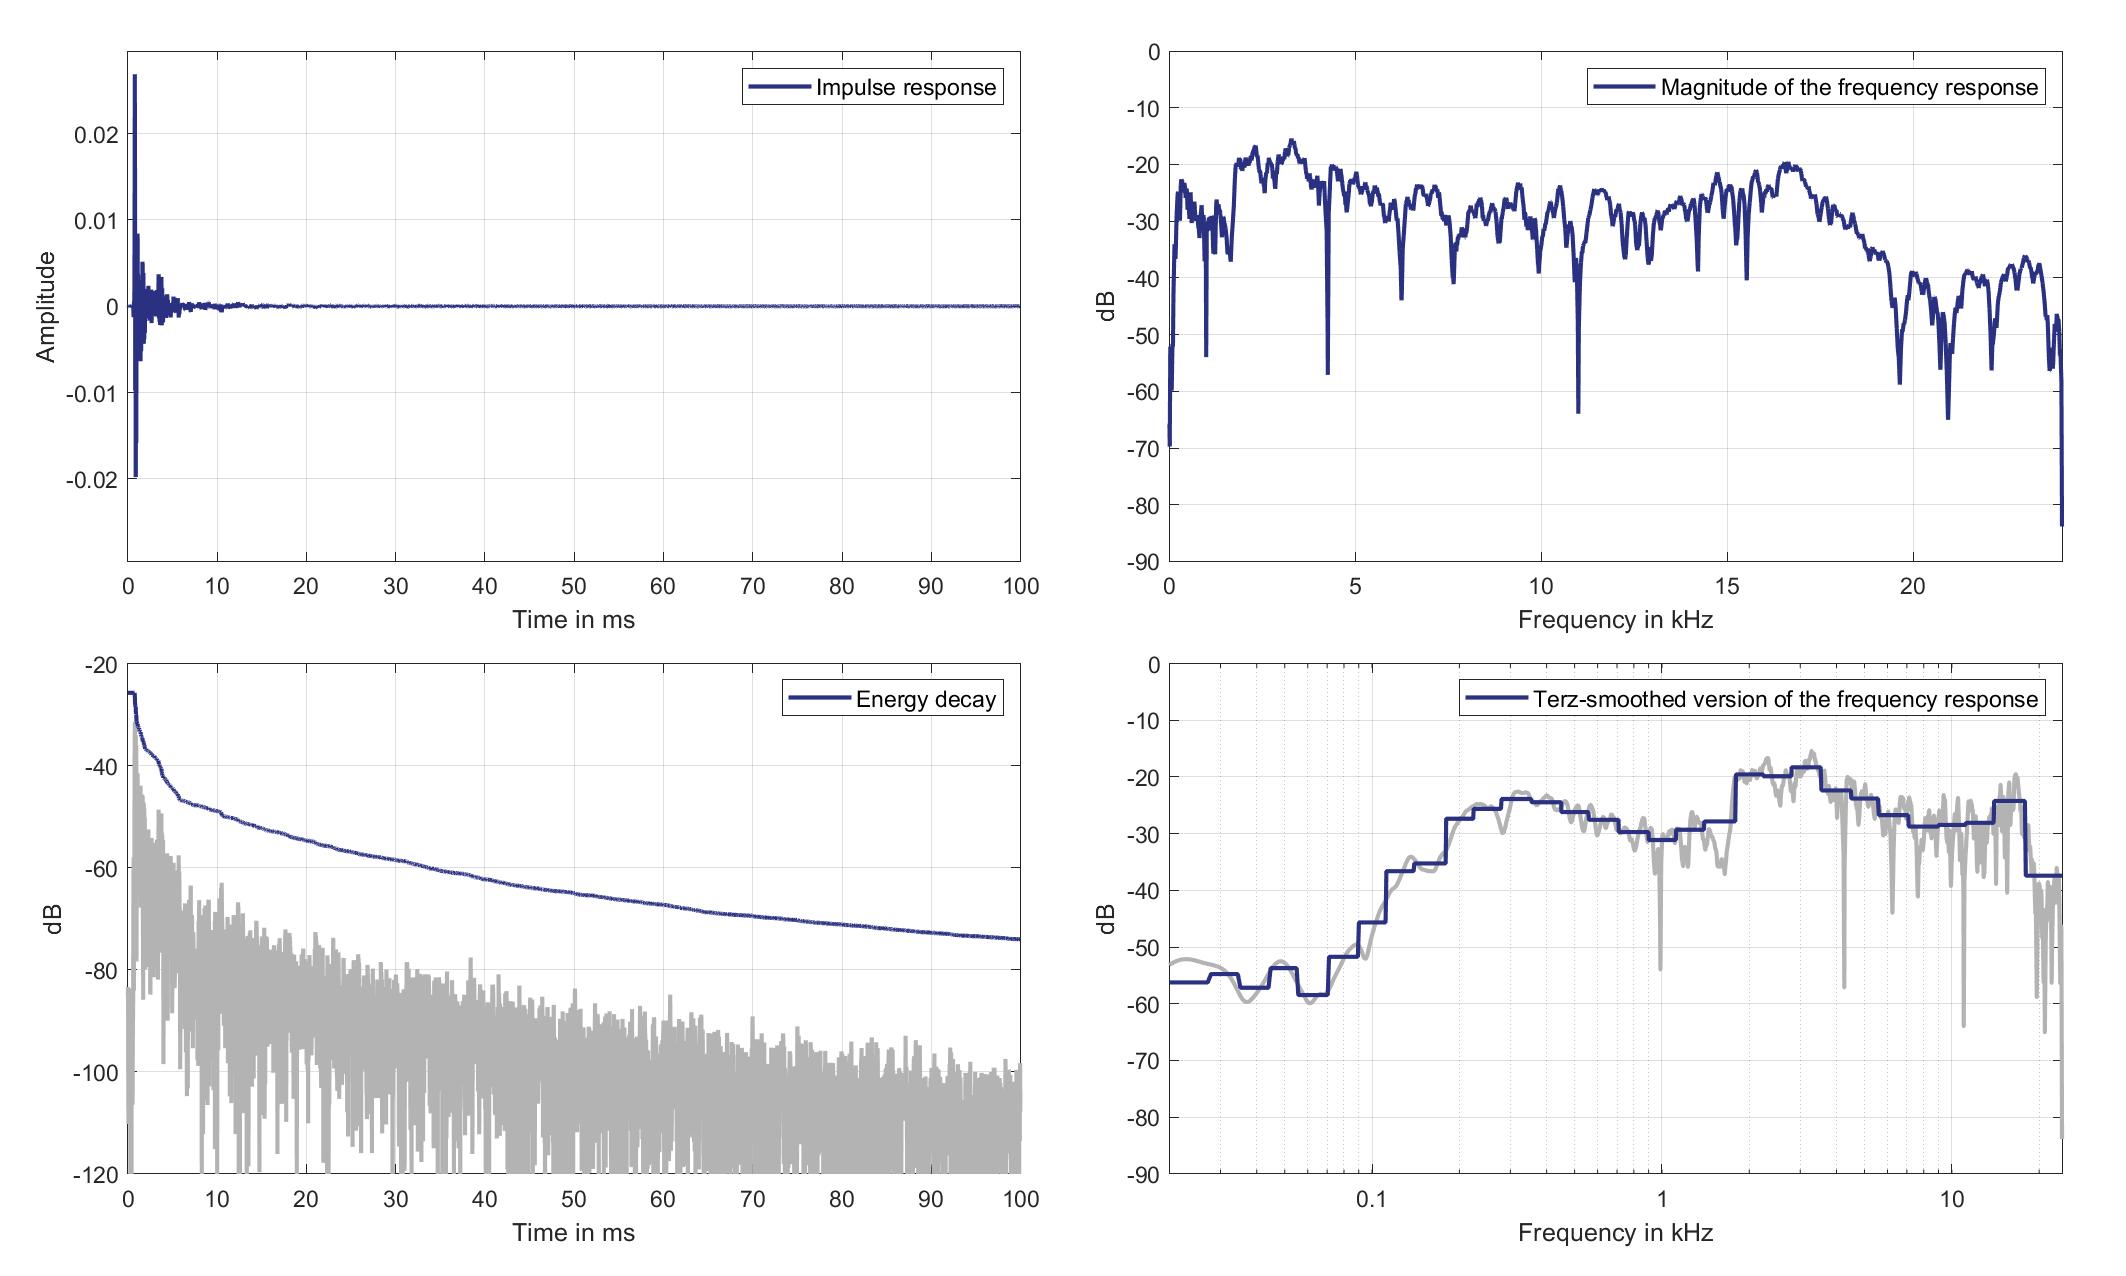
Download impulse response (in ".fir" format).
In the download section you can download all impulse response files as well as format explanation and Matlab as well as Python code examples for loading fir files.
Mouth Loudspeakers to Standard Car Microphones
Lsp. 12
Mic. 0
Mouth Loudspeaker of Zone 1 (Lsp. 12) to Standard Car Microphone 0 (Mic. 0)
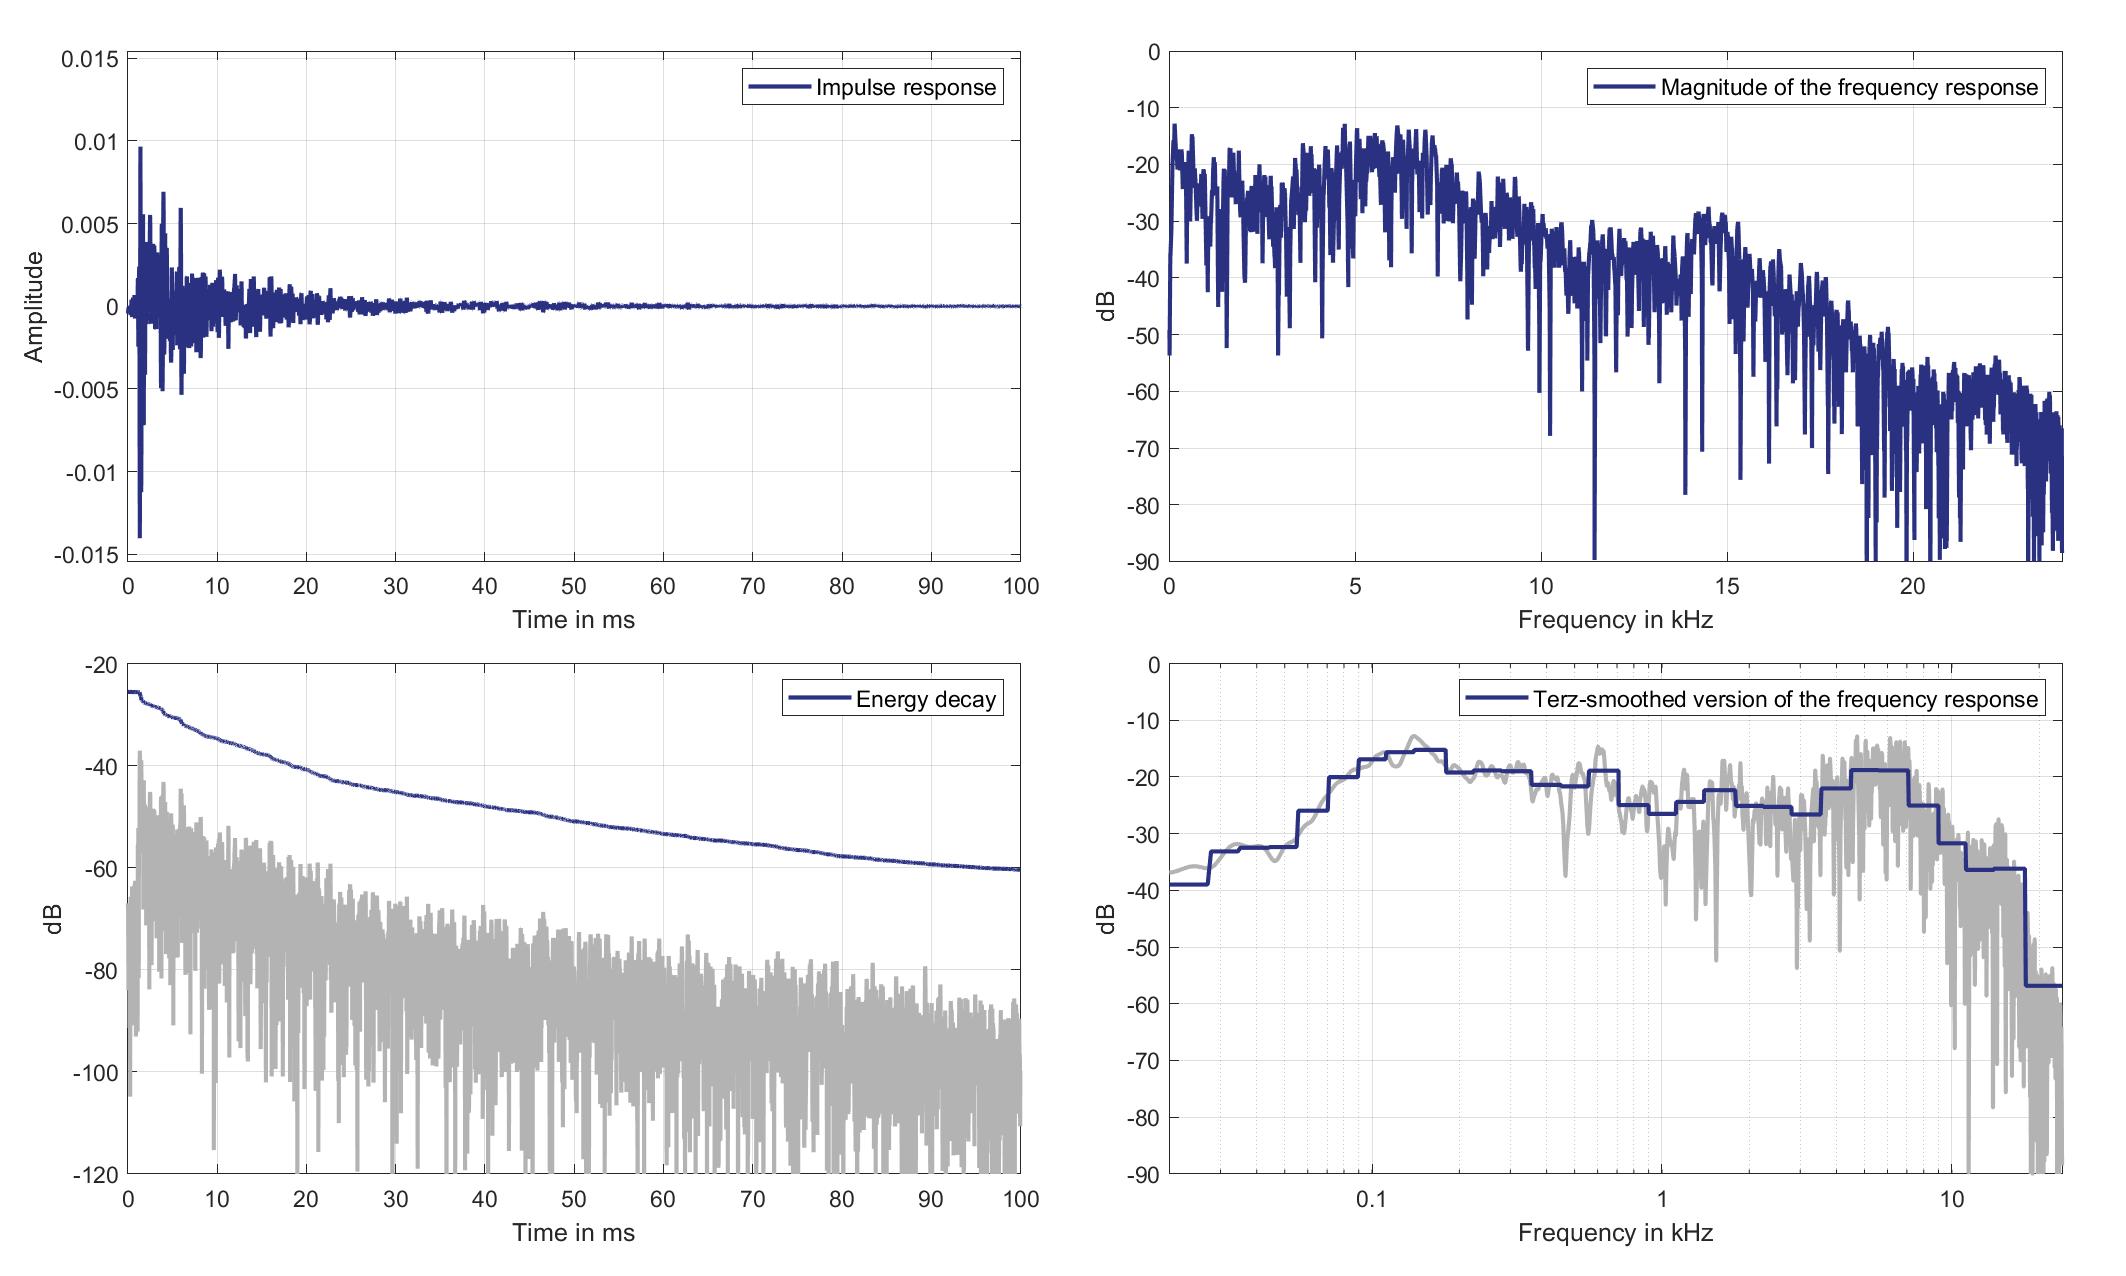
Download impulse response (in ".fir" format).
In the download section you can download all impulse response files as well as format explanation and Matlab as well as Python code examples for loading fir files.
Mic. 1
Mouth Loudspeaker of Zone 1 (Lsp. 12) to Standard Car Microphone 1 (Mic. 1)
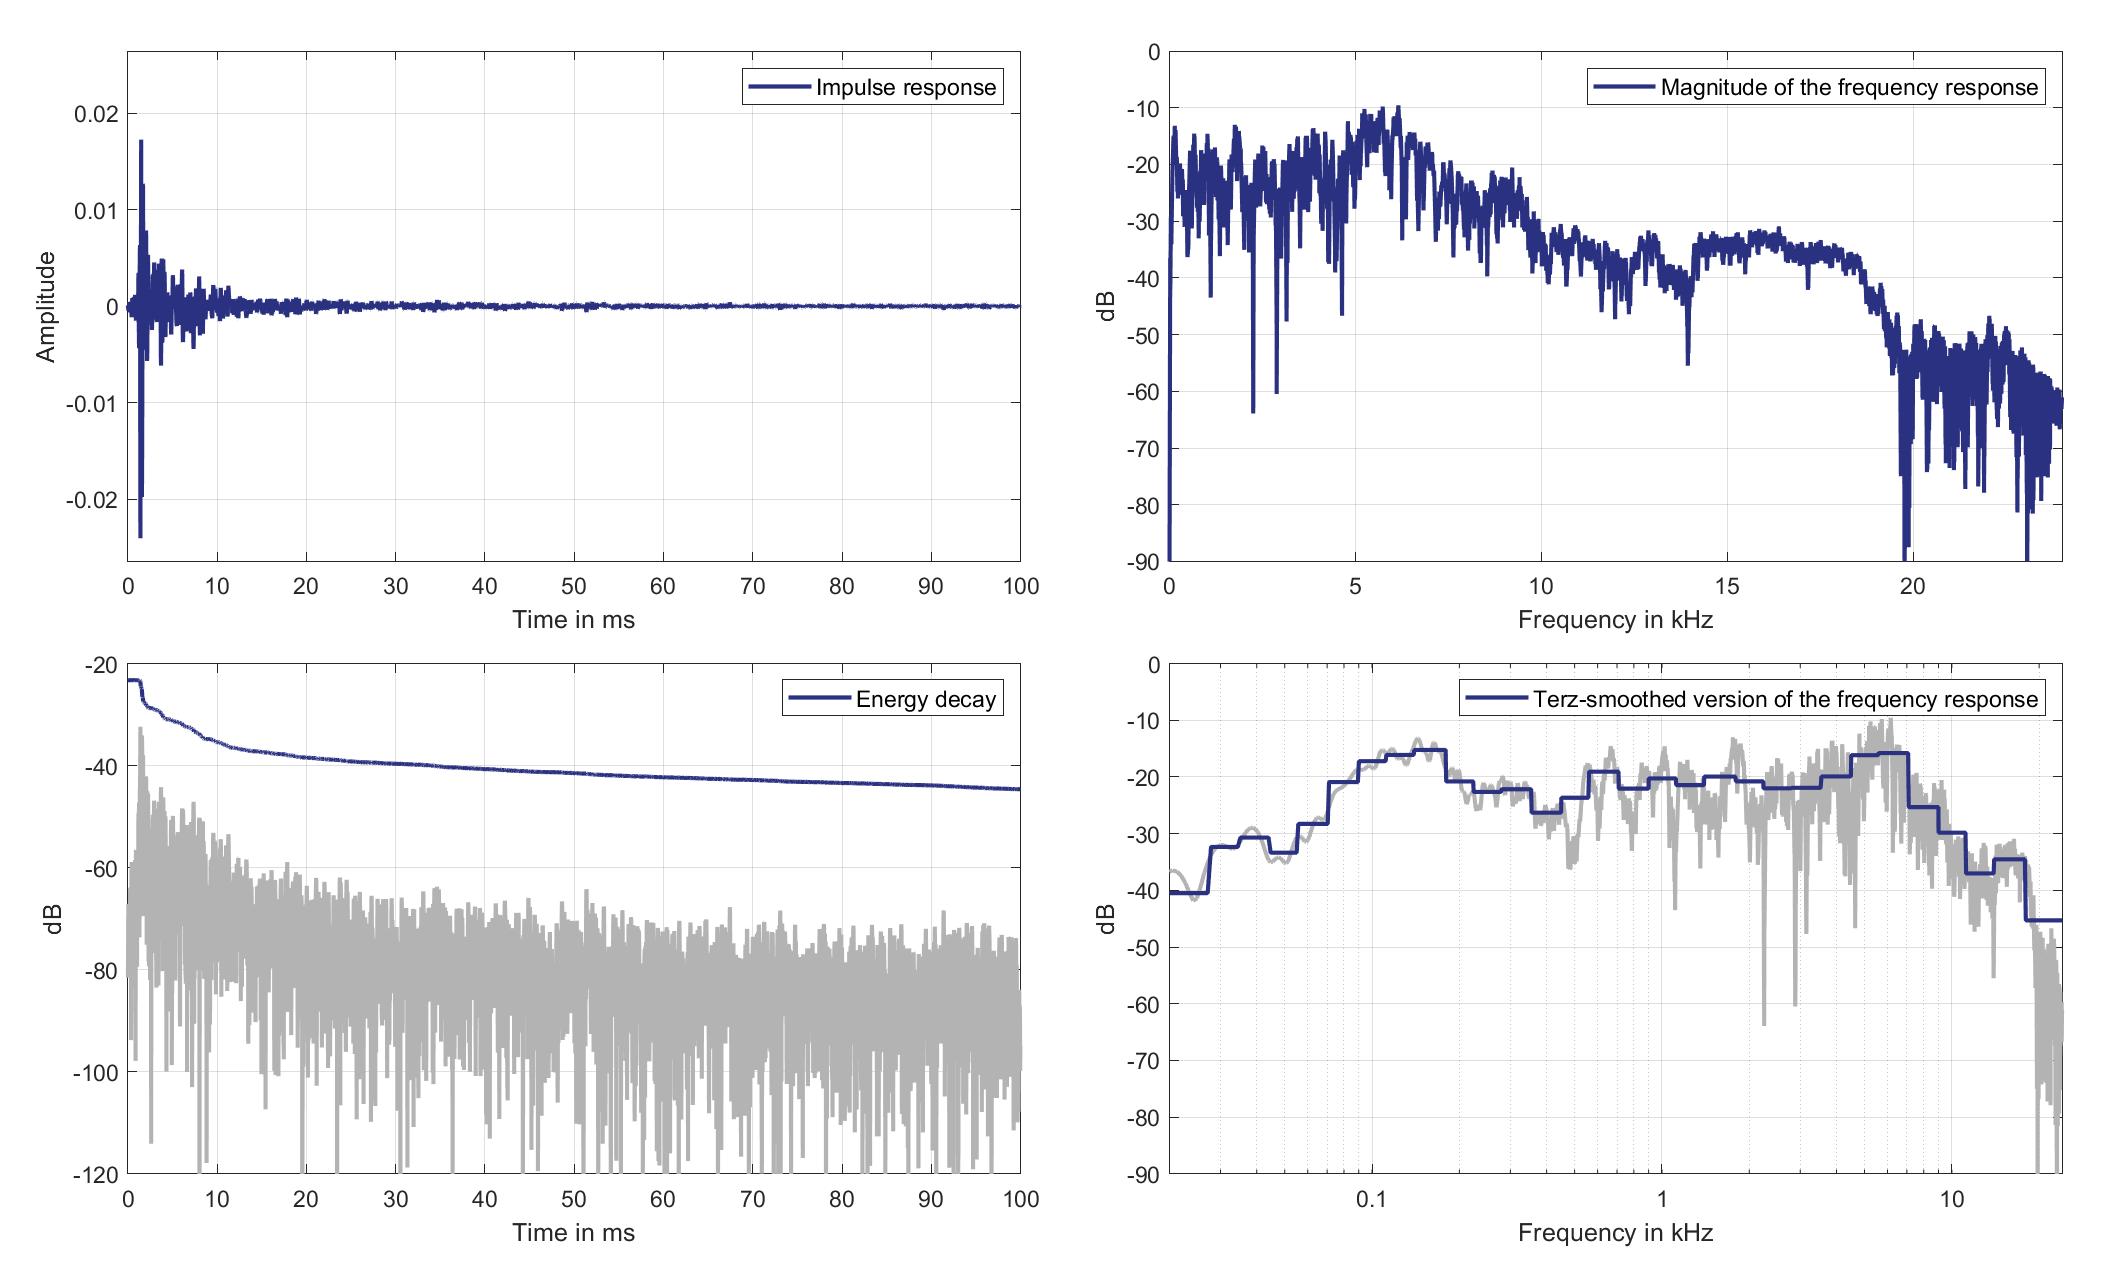
Download impulse response (in ".fir" format).
In the download section you can download all impulse response files as well as format explanation and Matlab as well as Python code examples for loading fir files.
Mic. 2
Mouth Loudspeaker of Zone 1 (Lsp. 12) to Standard Car Microphone 2 (Mic. 2)
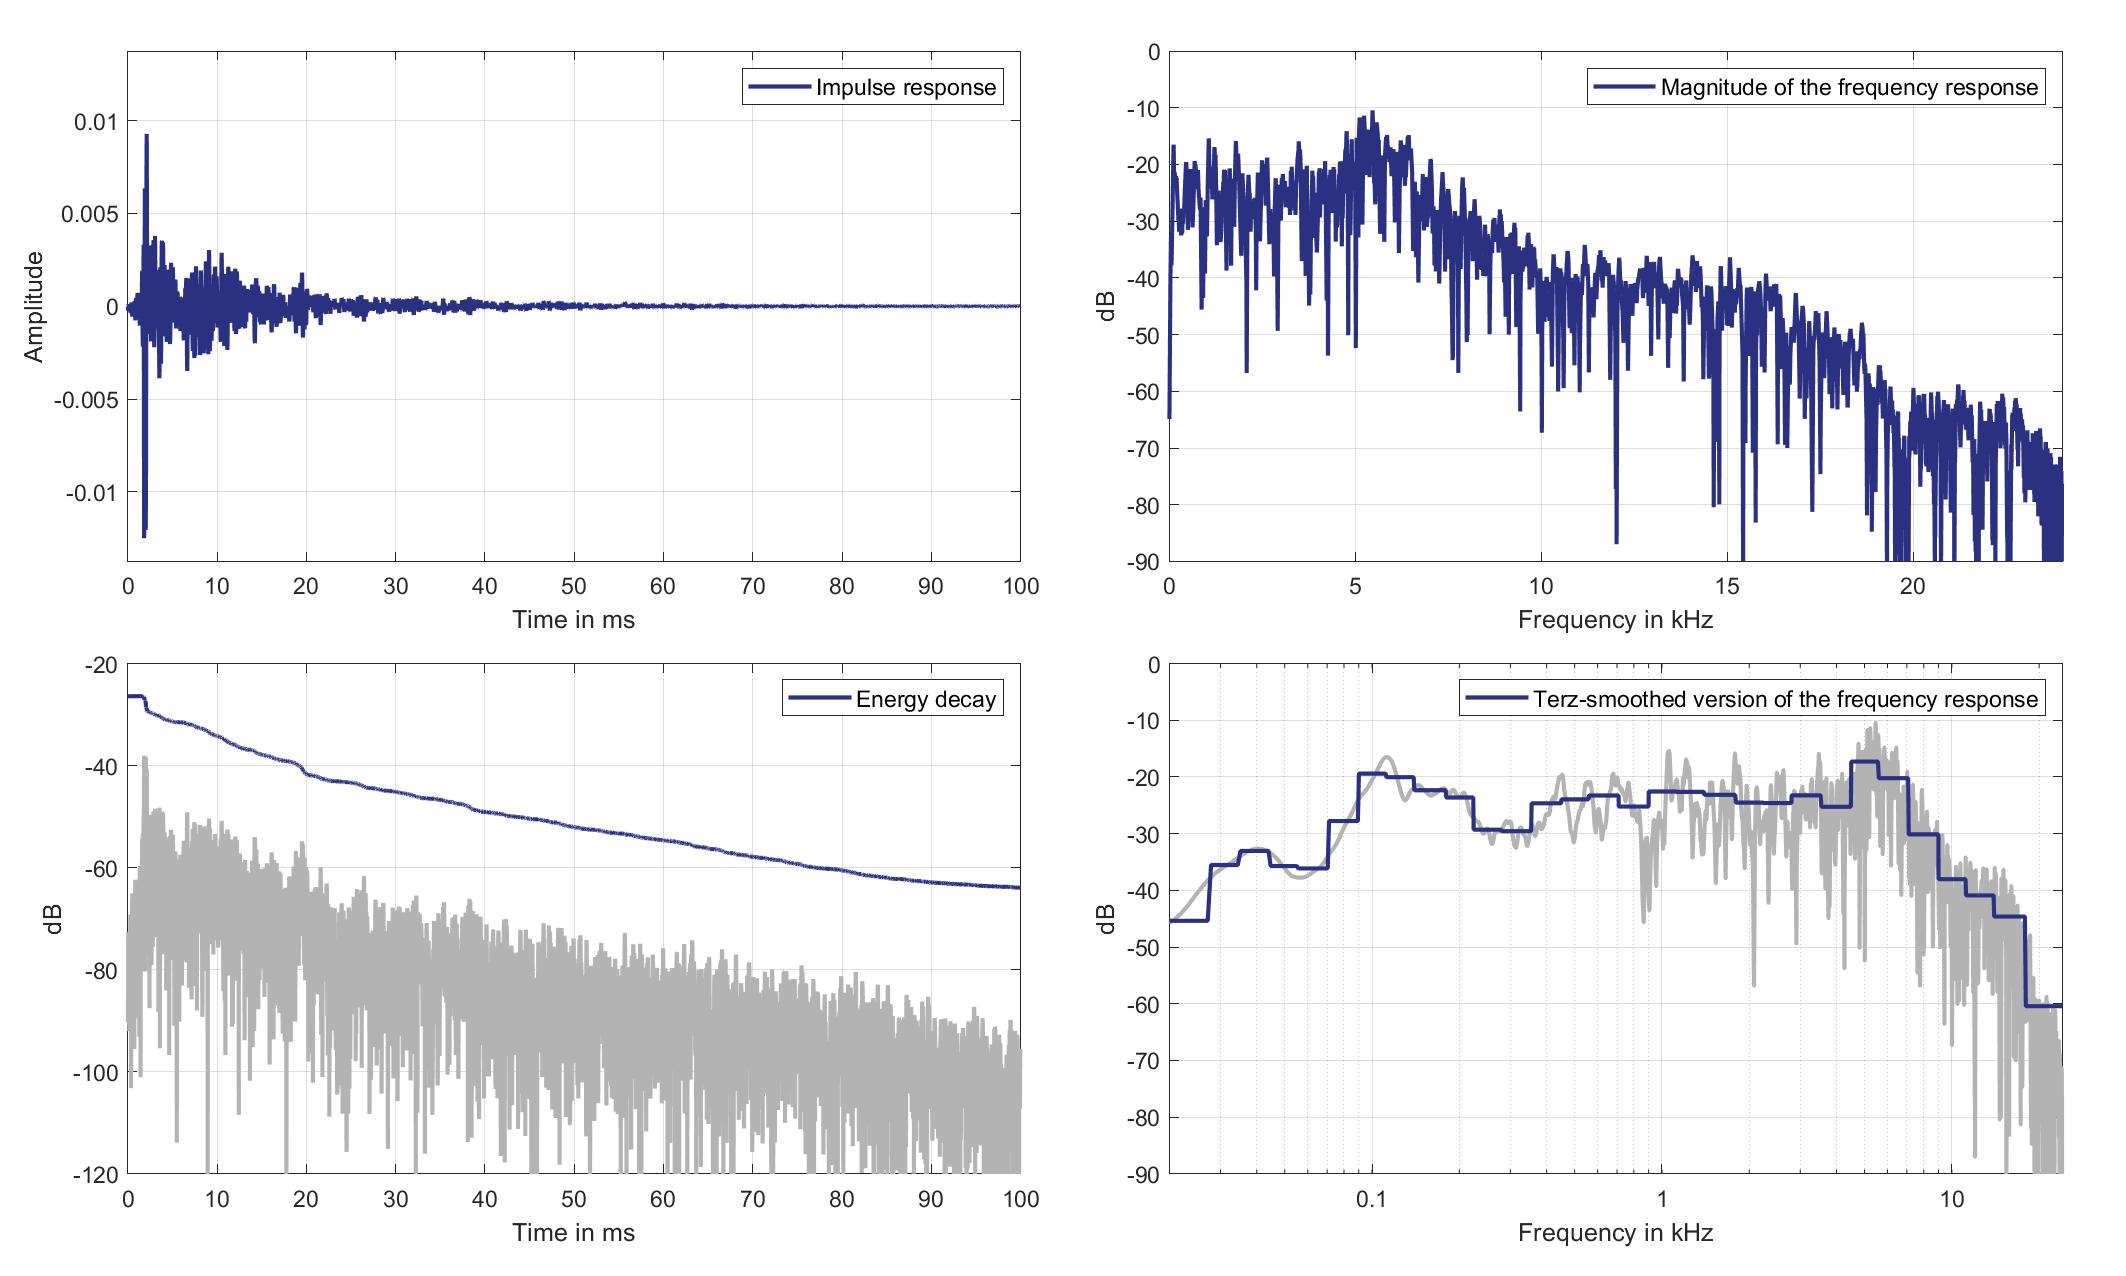
Download impulse response (in ".fir" format).
In the download section you can download all impulse response files as well as format explanation and Matlab as well as Python code examples for loading fir files.
Mic. 3
Mouth Loudspeaker of Zone 1 (Lsp. 12) to Standard Car Microphone 3 (Mic. 3)
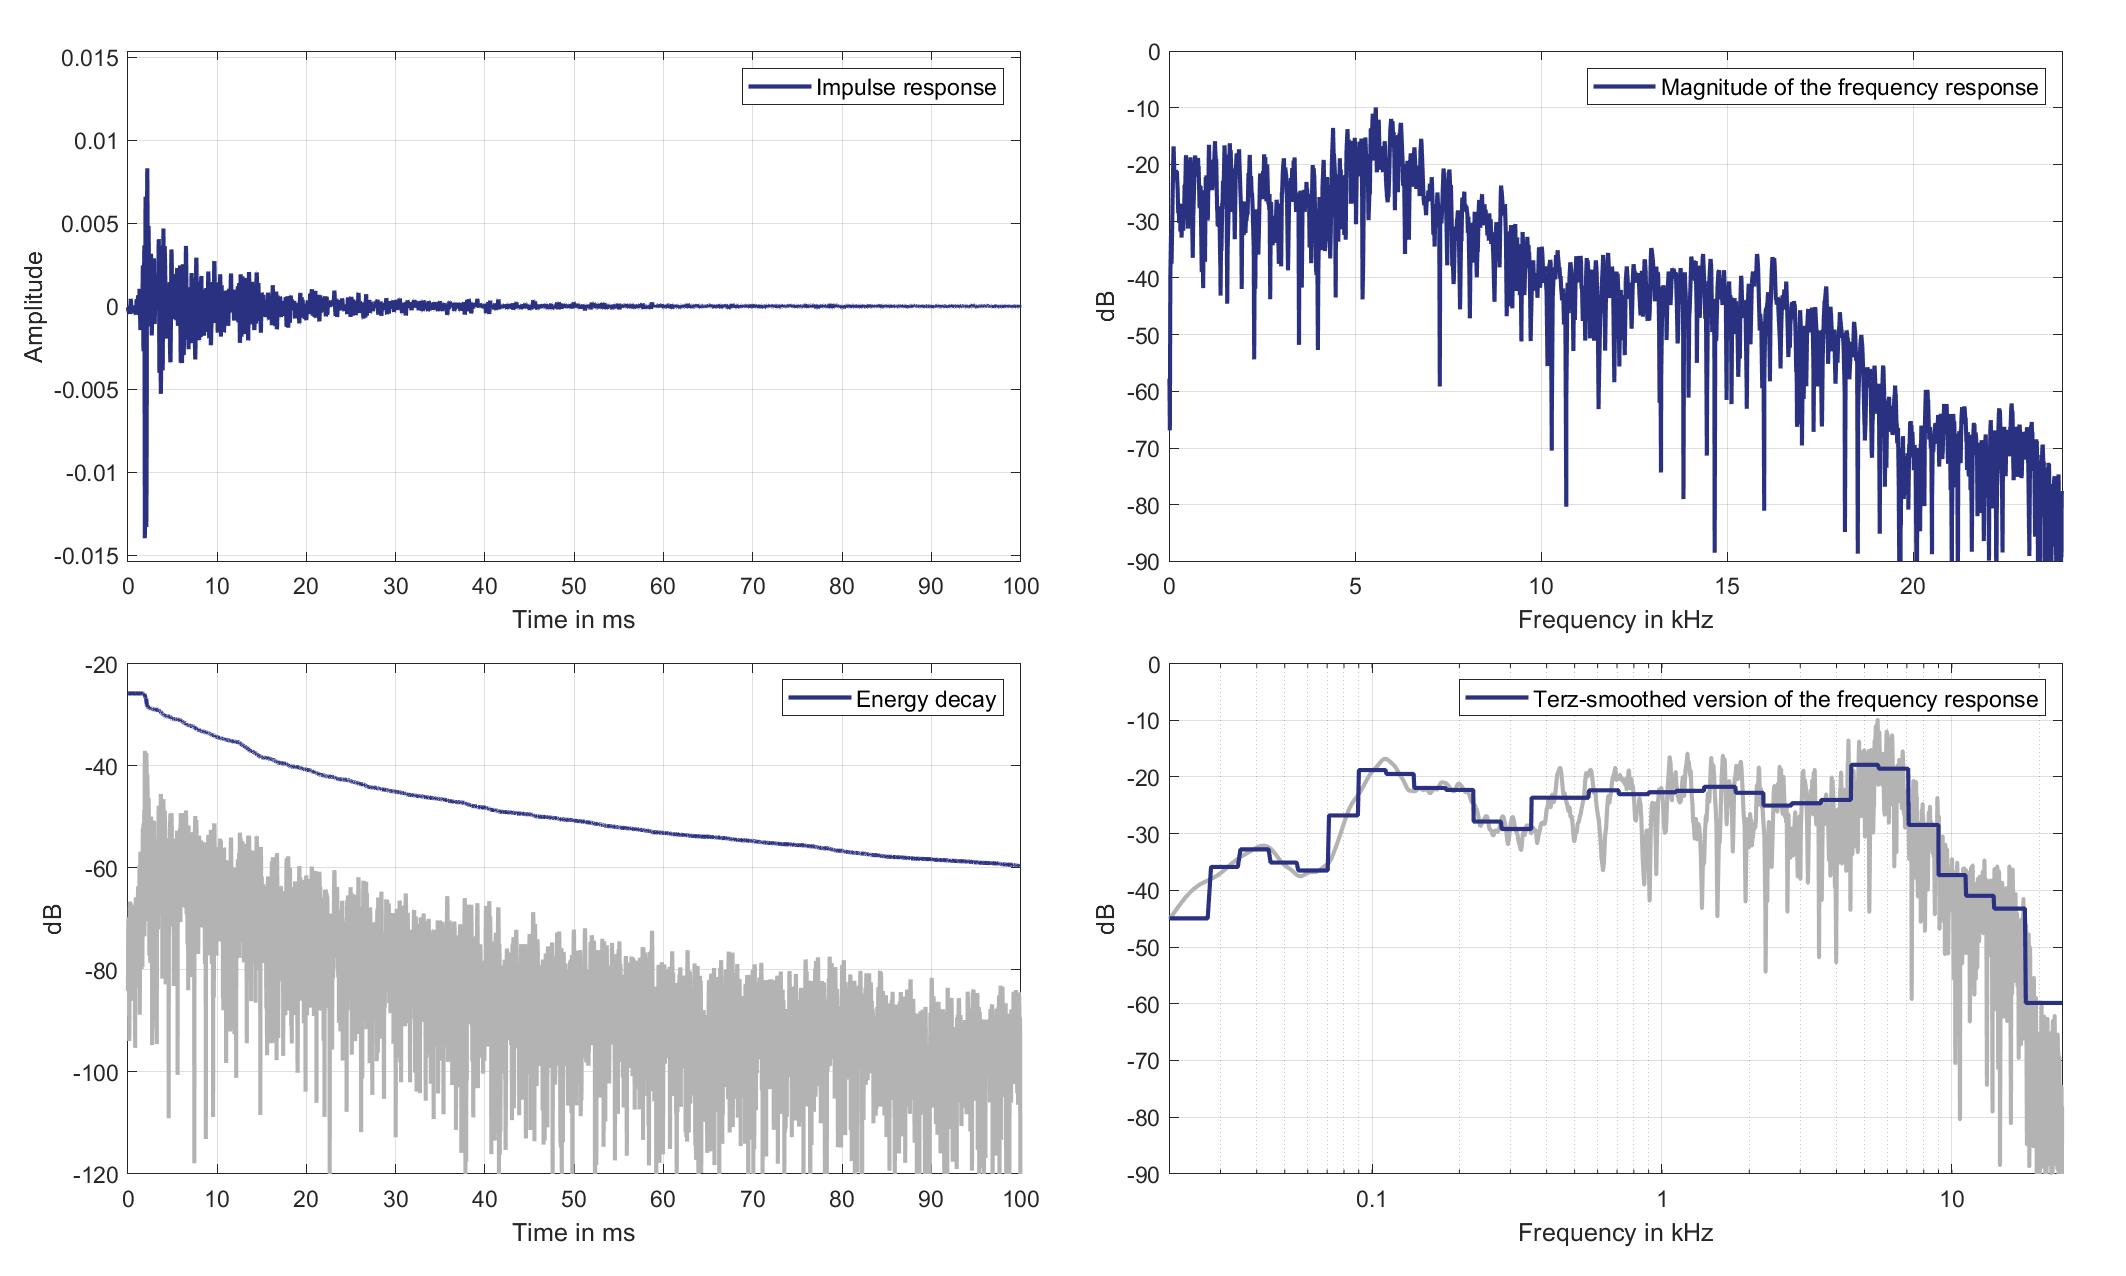
Download impulse response (in ".fir" format).
In the download section you can download all impulse response files as well as format explanation and Matlab as well as Python code examples for loading fir files.
Mic. 4
Mouth Loudspeaker of Zone 1 (Lsp. 12) to Standard Car Microphone 4 (Mic. 4)

Download impulse response (in ".fir" format).
In the download section you can download all impulse response files as well as format explanation and Matlab as well as Python code examples for loading fir files.
Mic. 5
Mouth Loudspeaker of Zone 1 (Lsp. 12) to Standard Car Microphone 5 (Mic. 5)
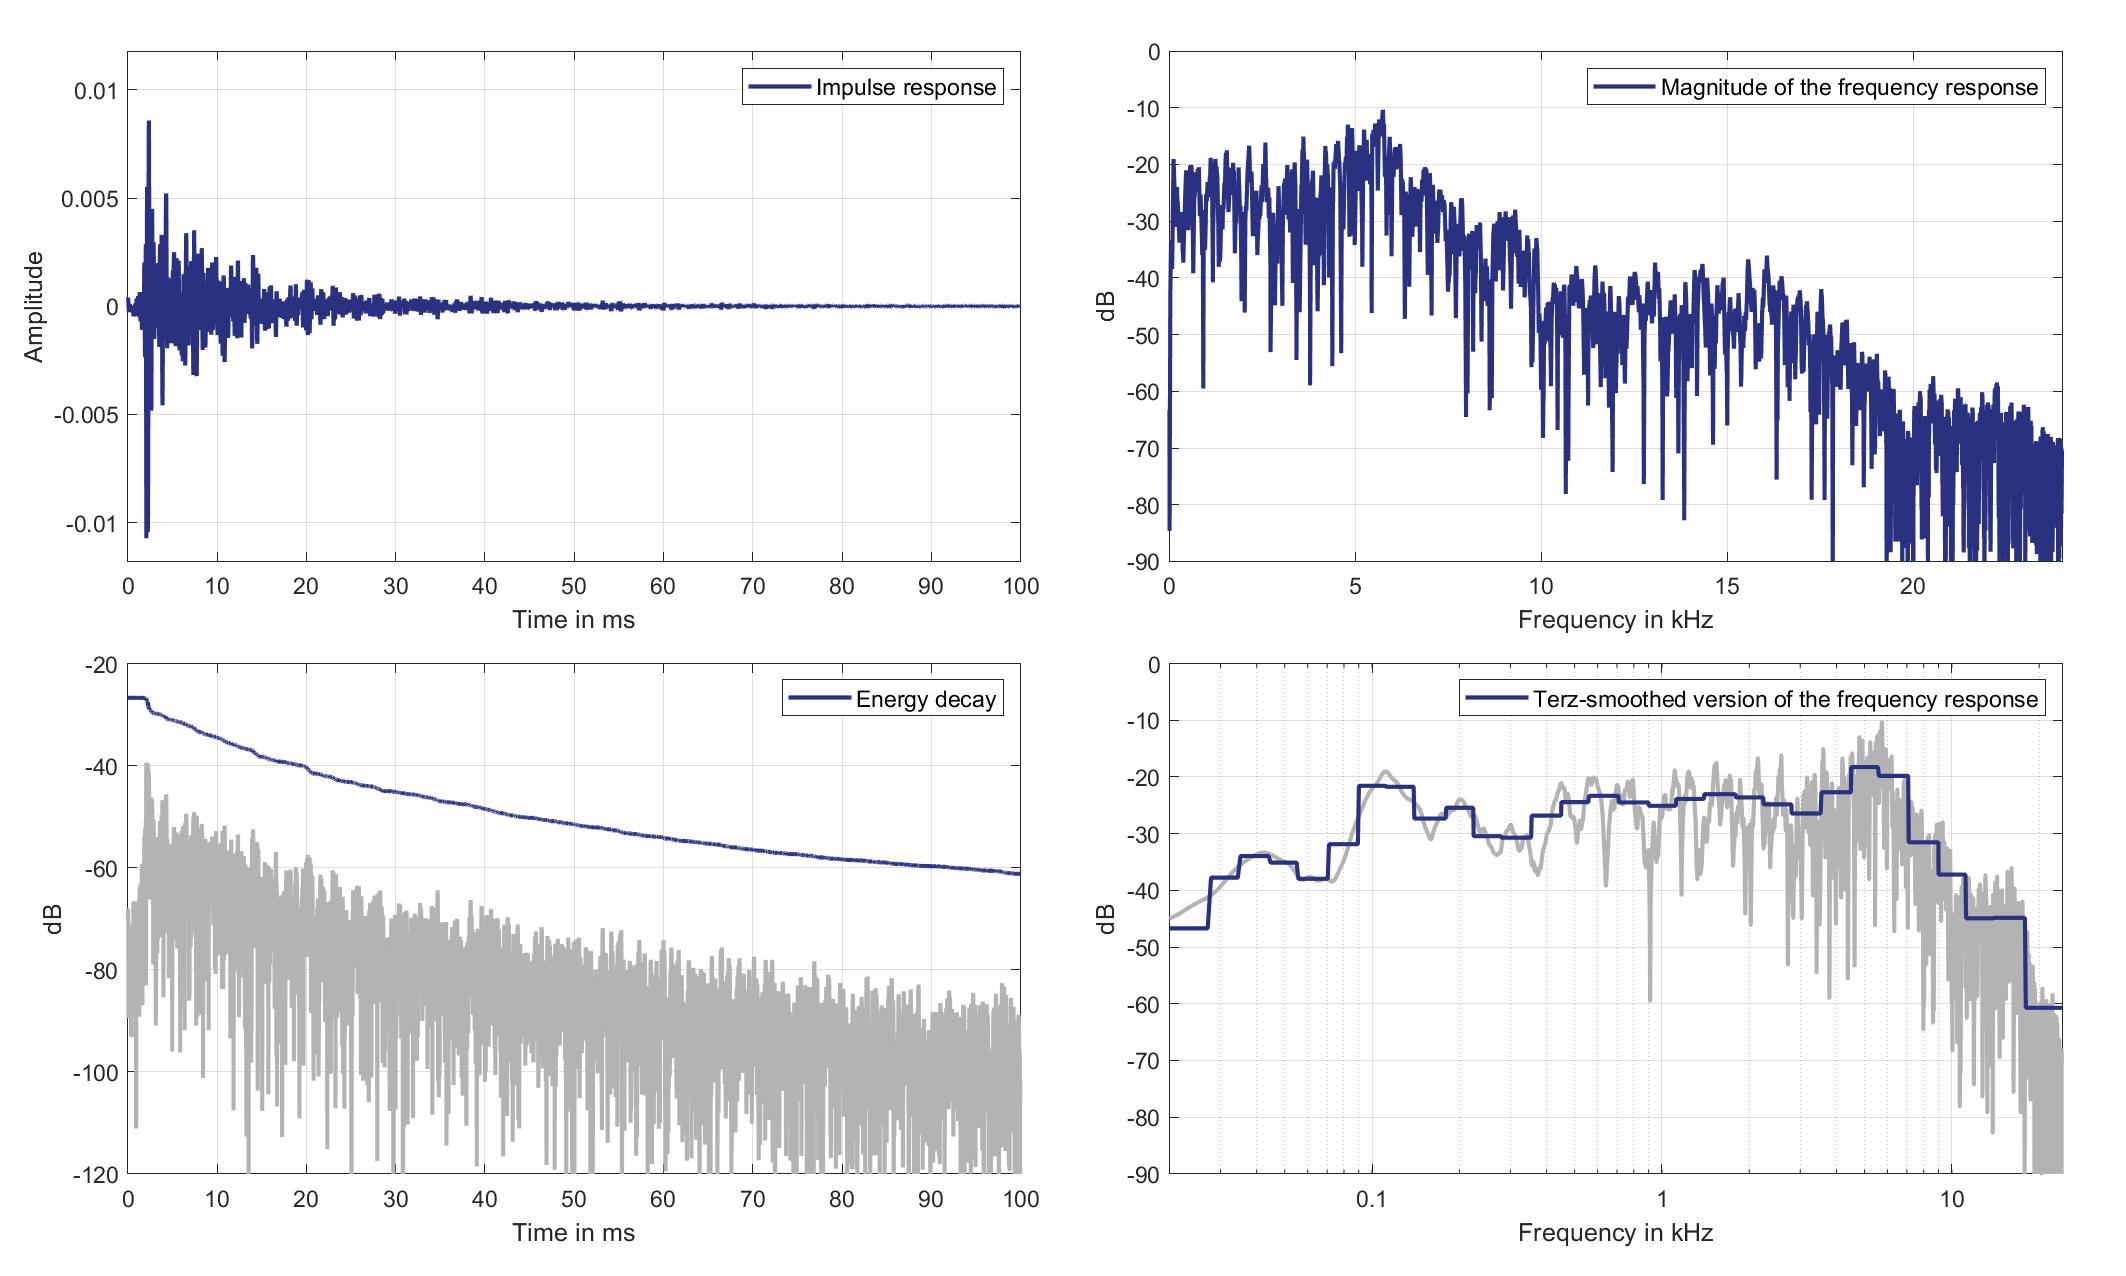
Download impulse response (in ".fir" format).
In the download section you can download all impulse response files as well as format explanation and Matlab as well as Python code examples for loading fir files.
Mic. 6
Mouth Loudspeaker of Zone 1 (Lsp. 12) to Standard Car Microphone 6 (Mic. 6)
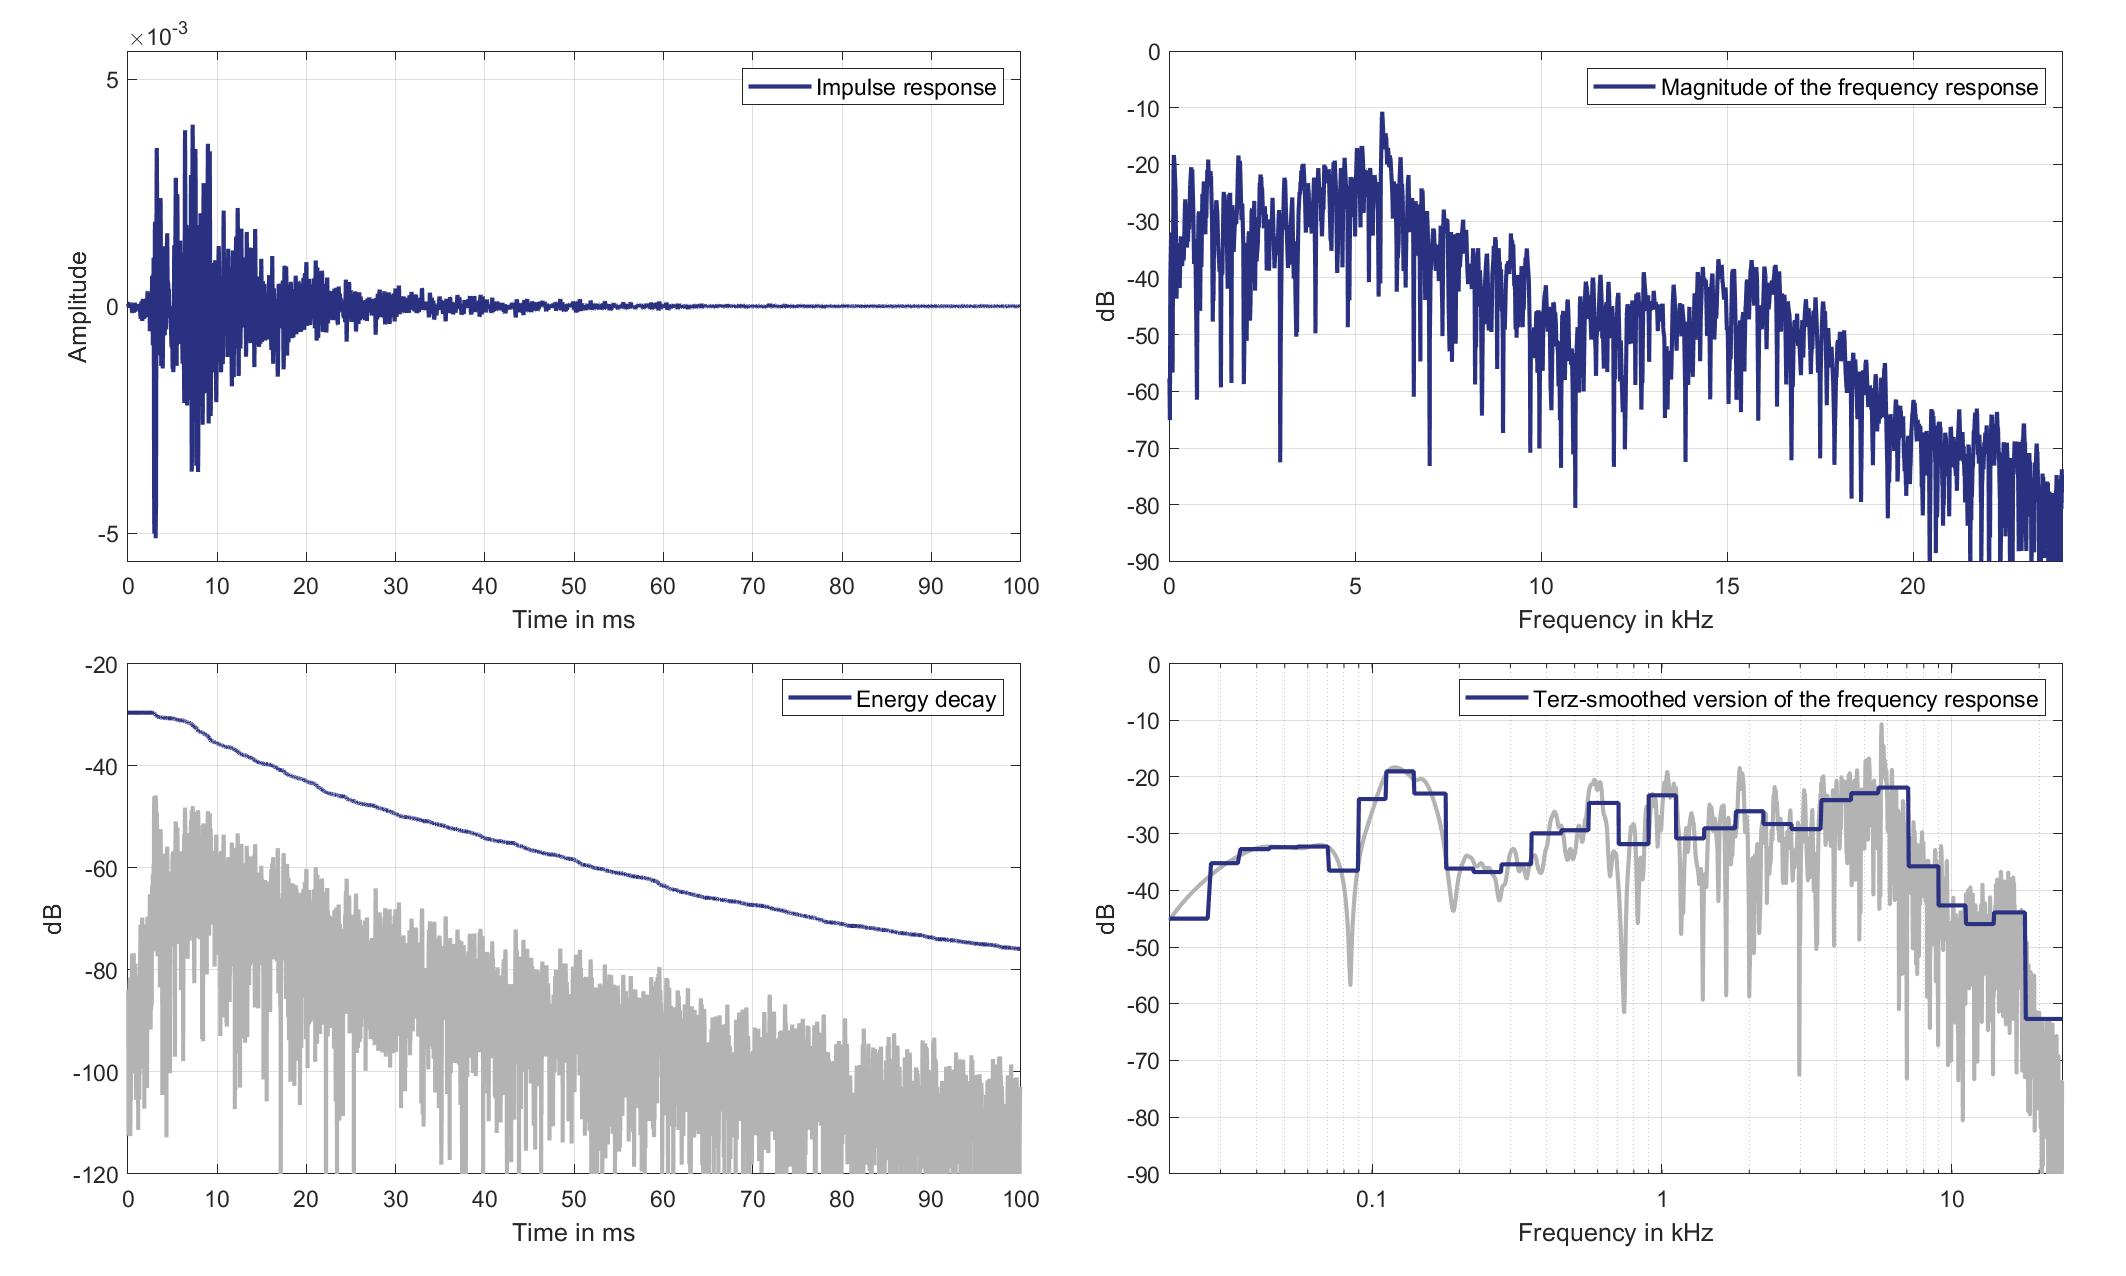
Download impulse response (in ".fir" format).
In the download section you can download all impulse response files as well as format explanation and Matlab as well as Python code examples for loading fir files.
Mic. 7
Mouth Loudspeaker of Zone 1 (Lsp. 12) to Standard Car Microphone 7 (Mic. 7)
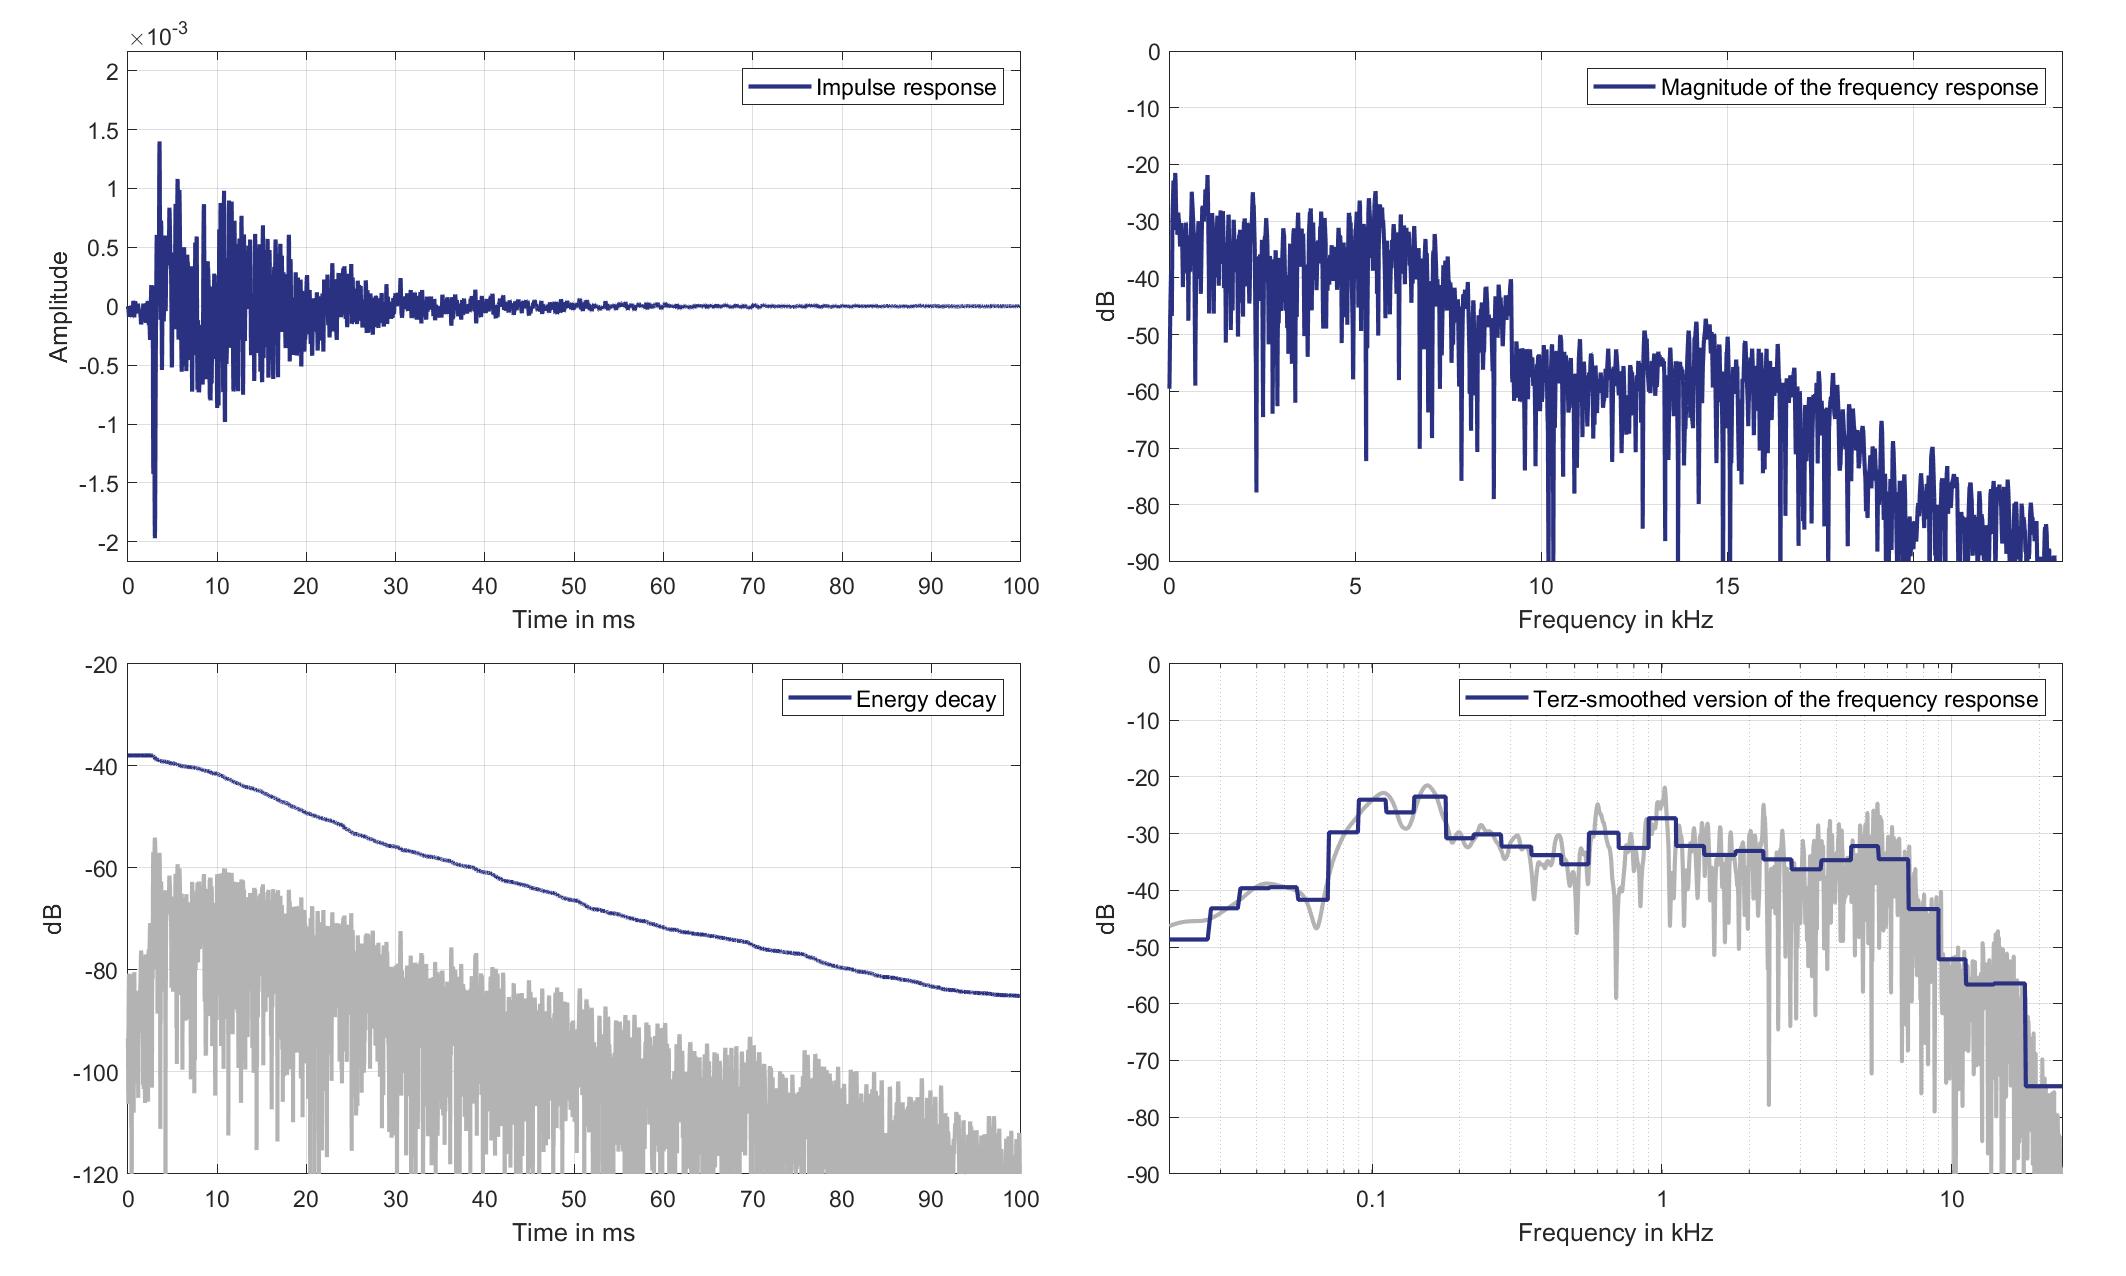
Download impulse response (in ".fir" format).
In the download section you can download all impulse response files as well as format explanation and Matlab as well as Python code examples for loading fir files.
Mic. 8
Mouth Loudspeaker of Zone 1 (Lsp. 12) to Standard Car Microphone 8 (Mic. 8)
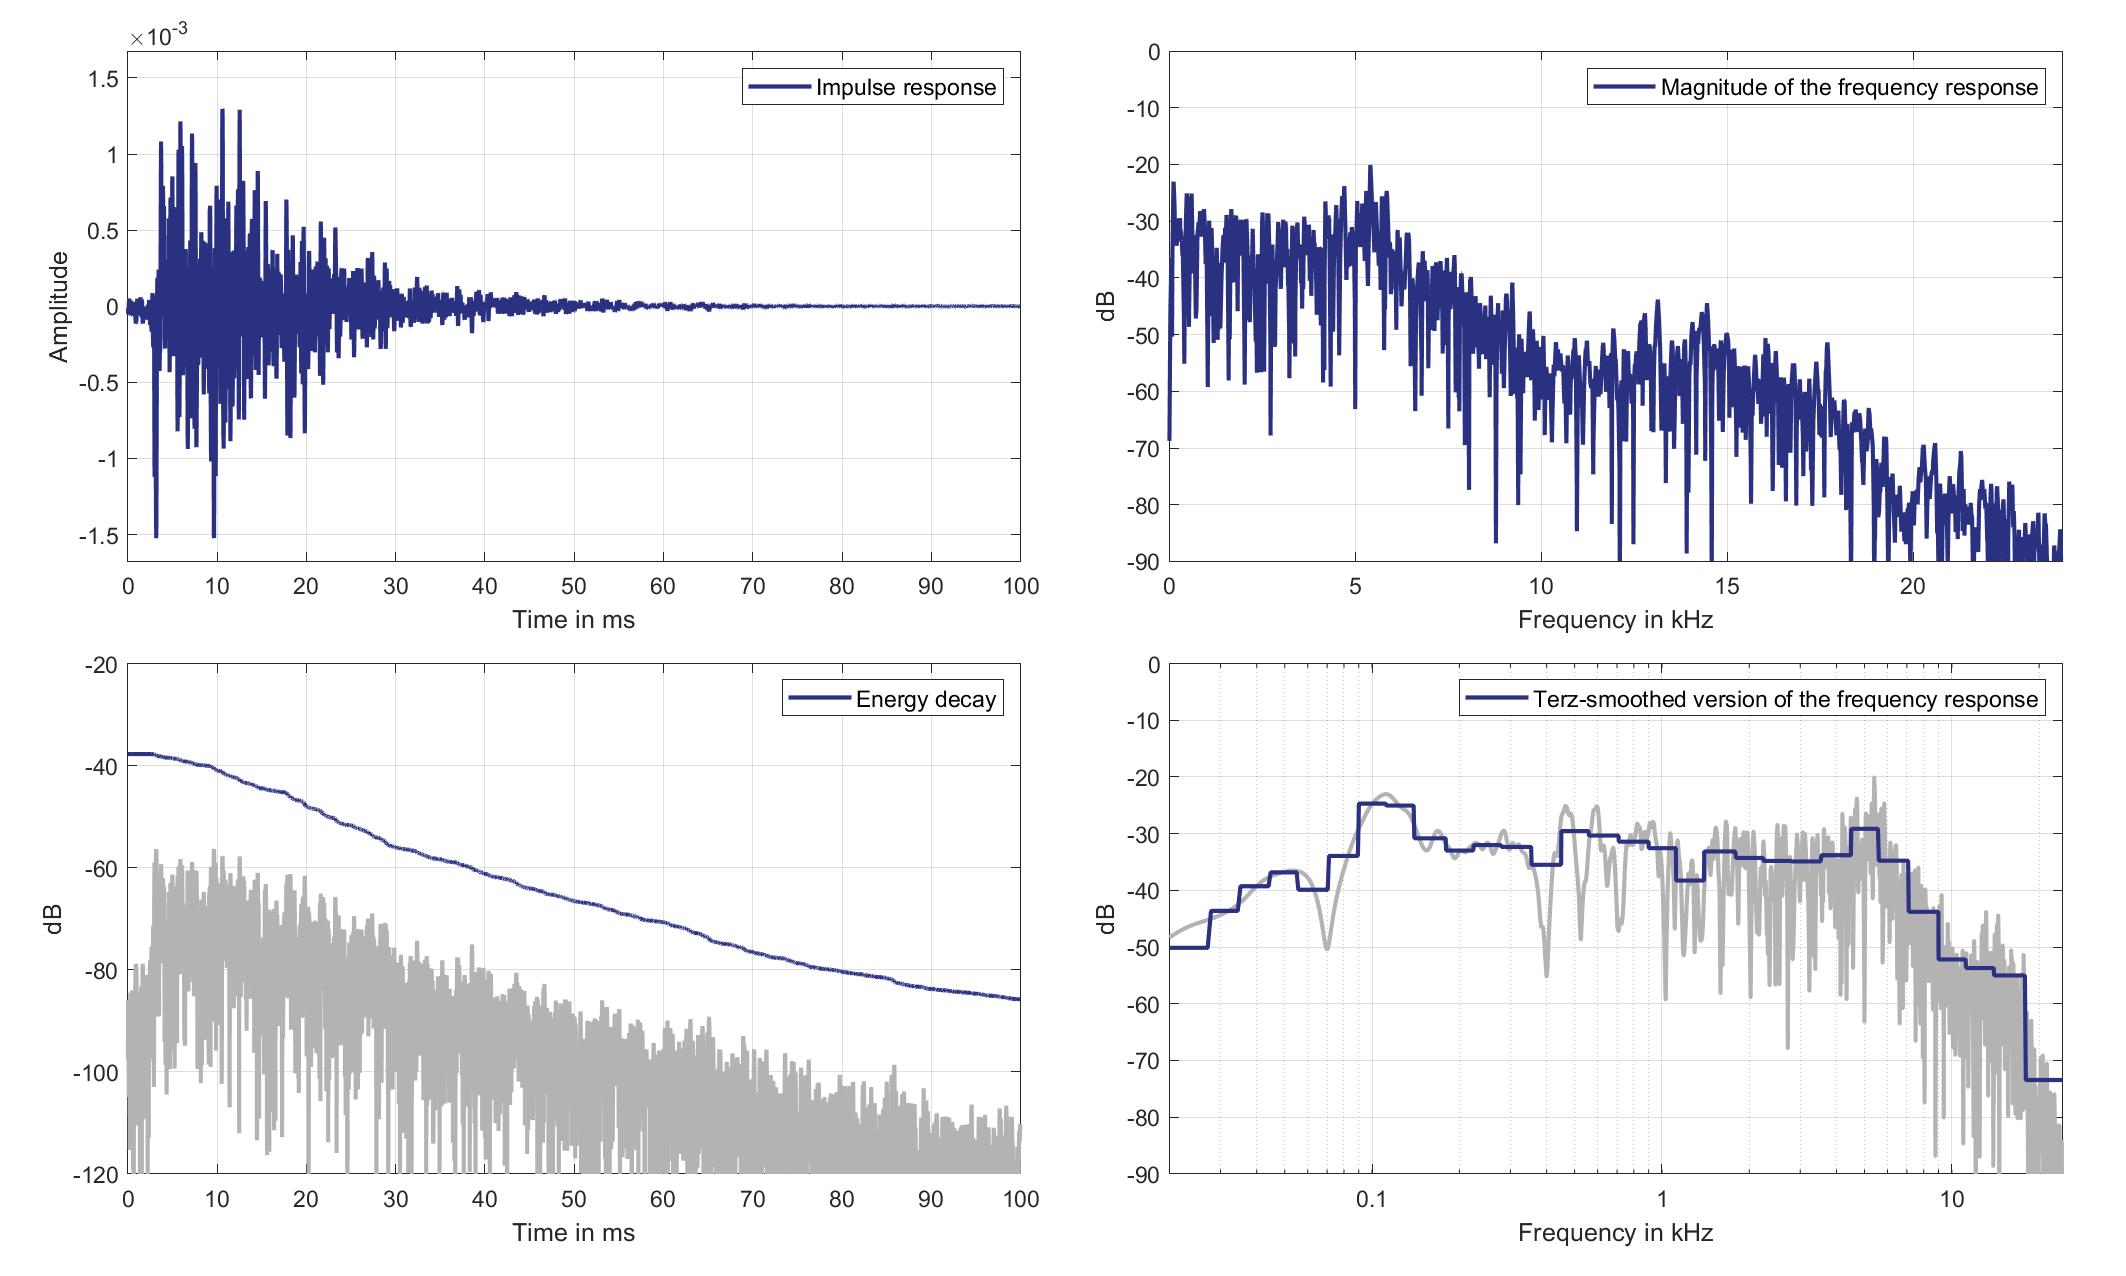
Download impulse response (in ".fir" format).
In the download section you can download all impulse response files as well as format explanation and Matlab as well as Python code examples for loading fir files.
Mic. 9
Mouth Loudspeaker of Zone 1 (Lsp. 12) to Standard Car Microphone 9 (Mic. 9)
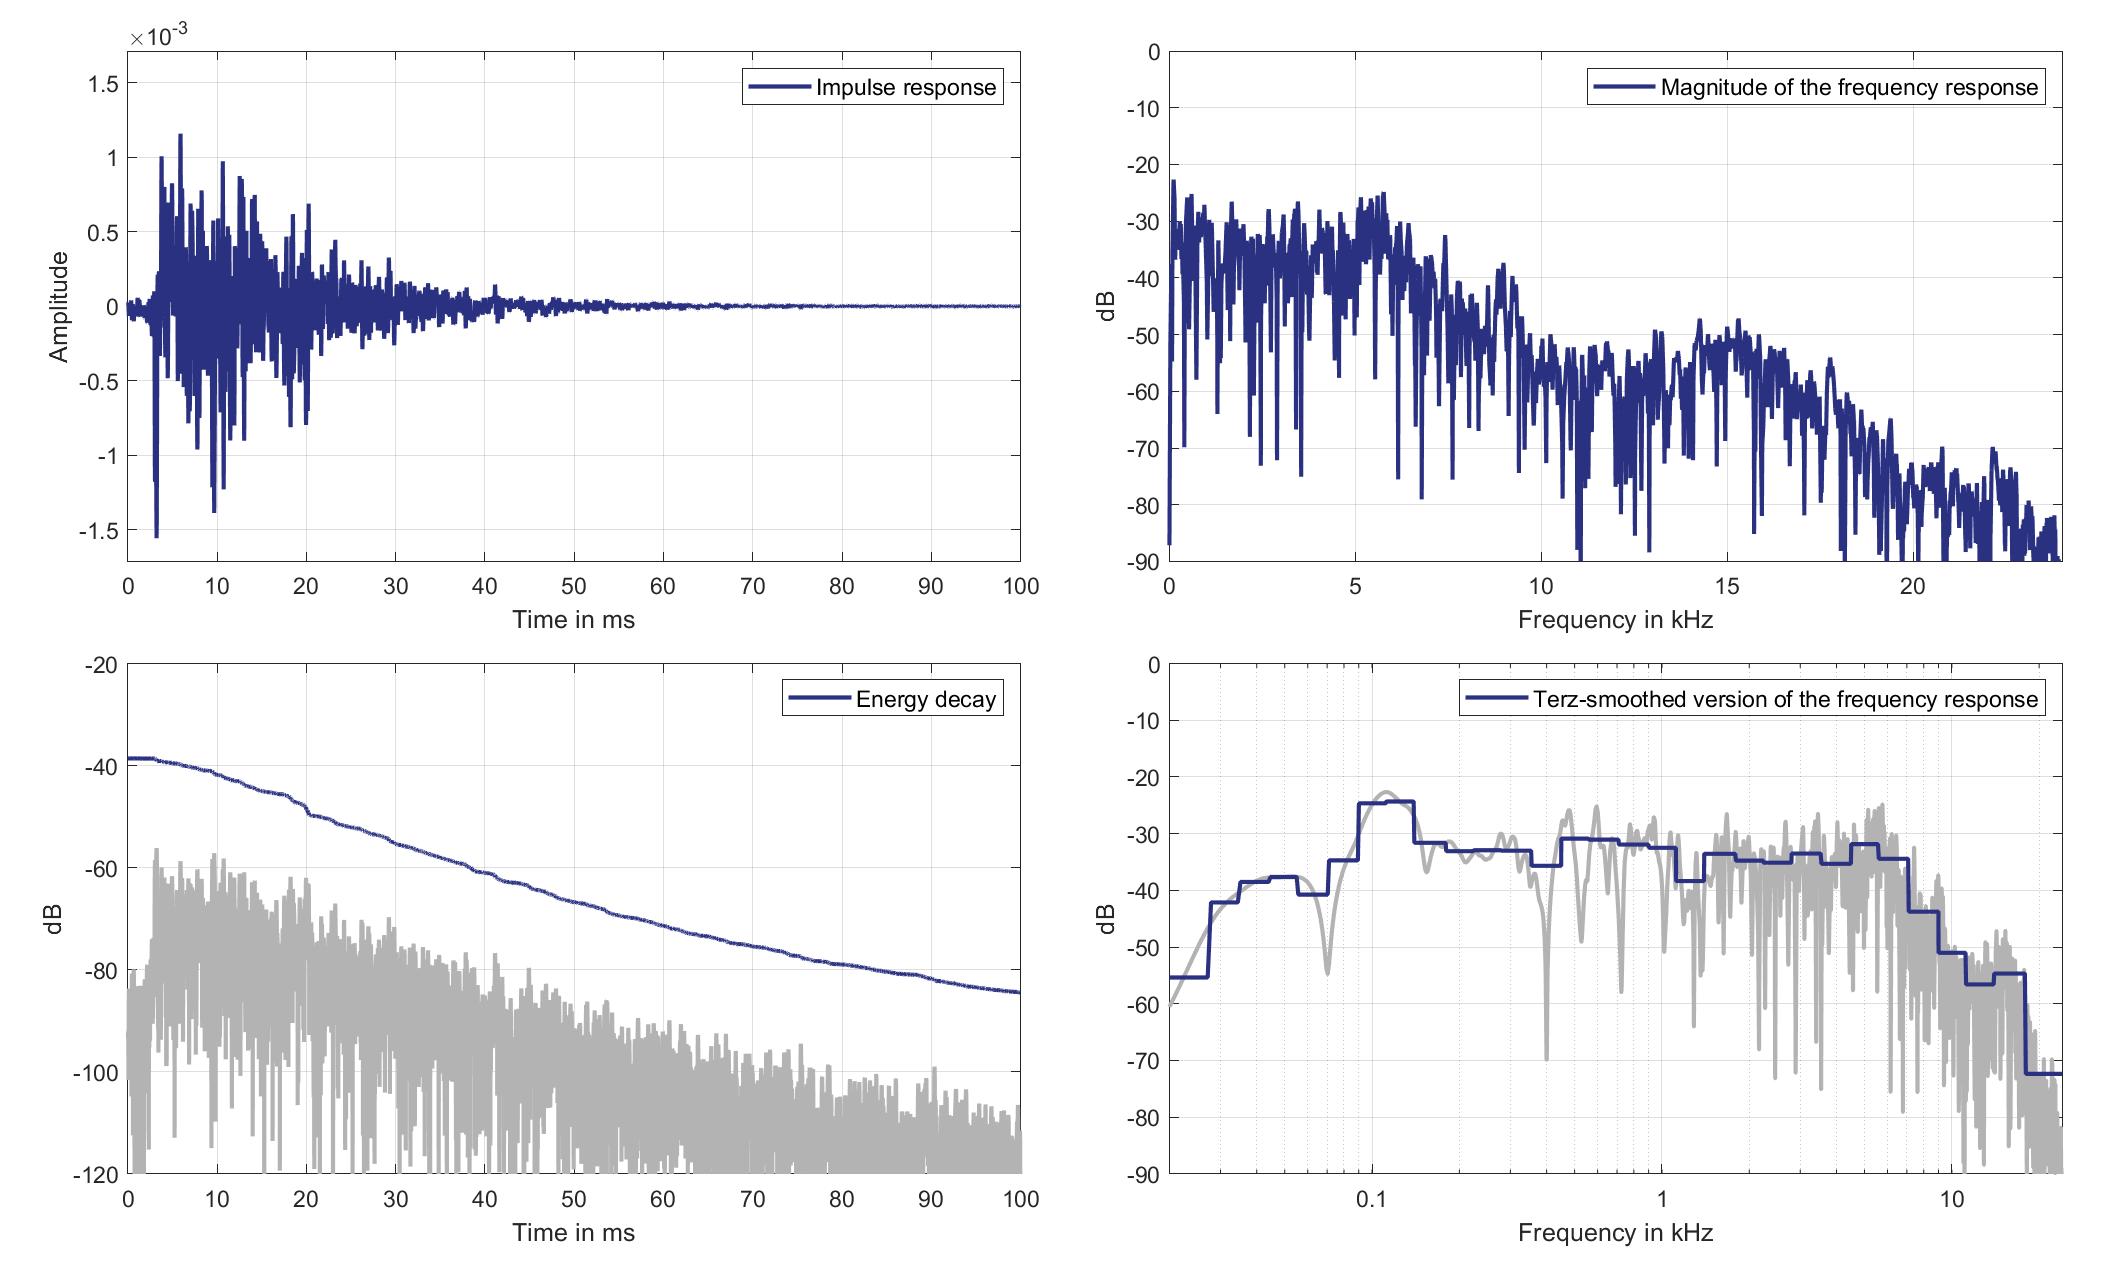
Download impulse response (in ".fir" format).
In the download section you can download all impulse response files as well as format explanation and Matlab as well as Python code examples for loading fir files.
Mic. 10
Mouth Loudspeaker of Zone 1 (Lsp. 12) to Standard Car Microphone 10 (Mic. 10)

Download impulse response (in ".fir" format).
In the download section you can download all impulse response files as well as format explanation and Matlab as well as Python code examples for loading fir files.
Mic. 11
Mouth Loudspeaker of Zone 1 (Lsp. 12) to Standard Car Microphone 11 (Mic. 11)
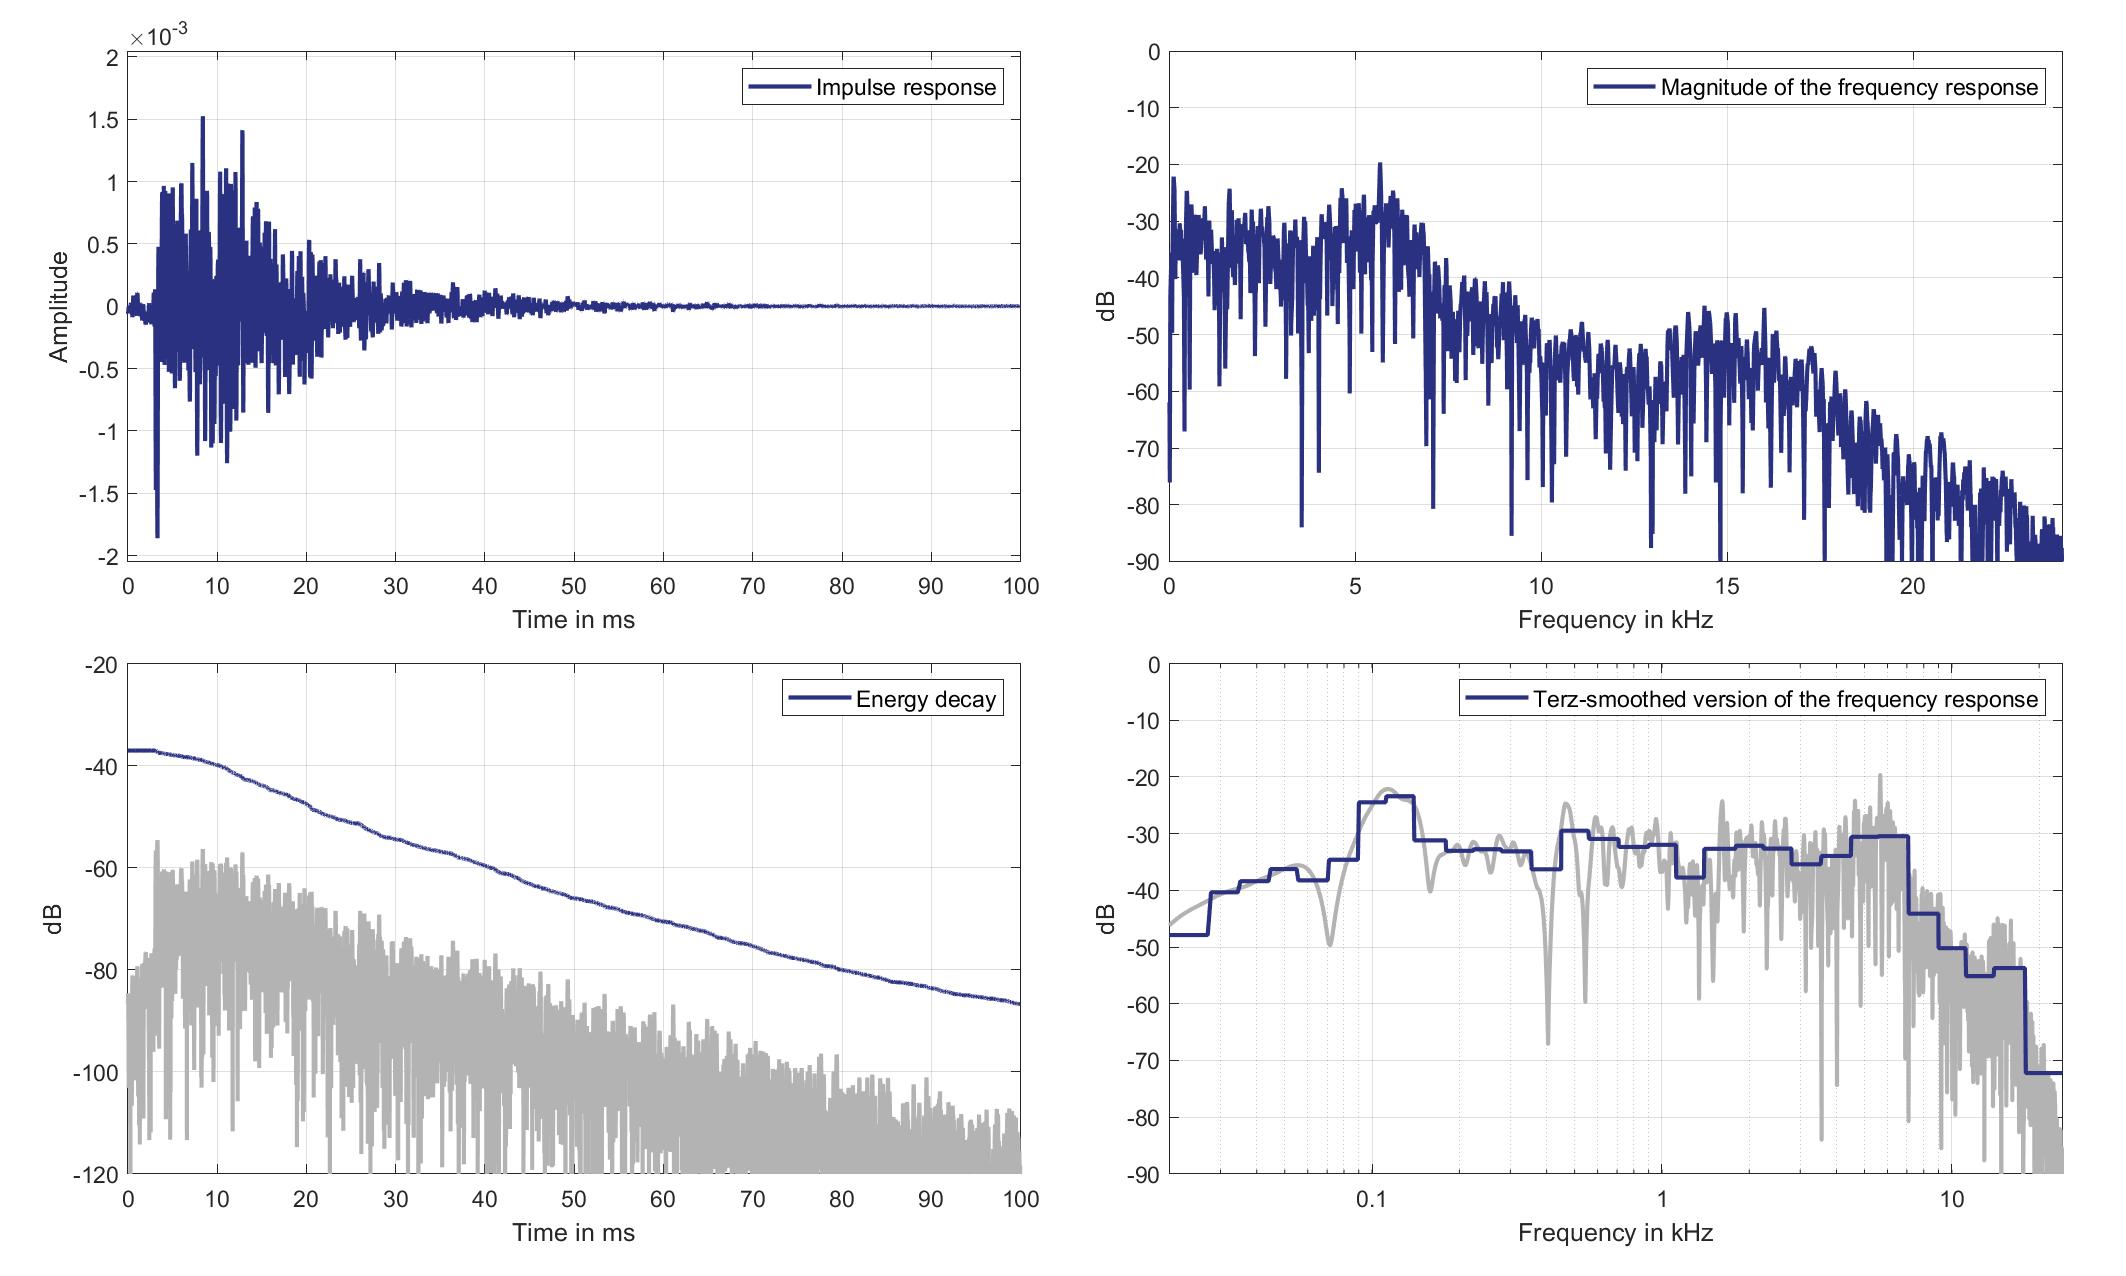
Download impulse response (in ".fir" format).
In the download section you can download all impulse response files as well as format explanation and Matlab as well as Python code examples for loading fir files.
Mic. 12
Mouth Loudspeaker of Zone 1 (Lsp. 12) to Standard Car Microphone 12 (Mic. 12)
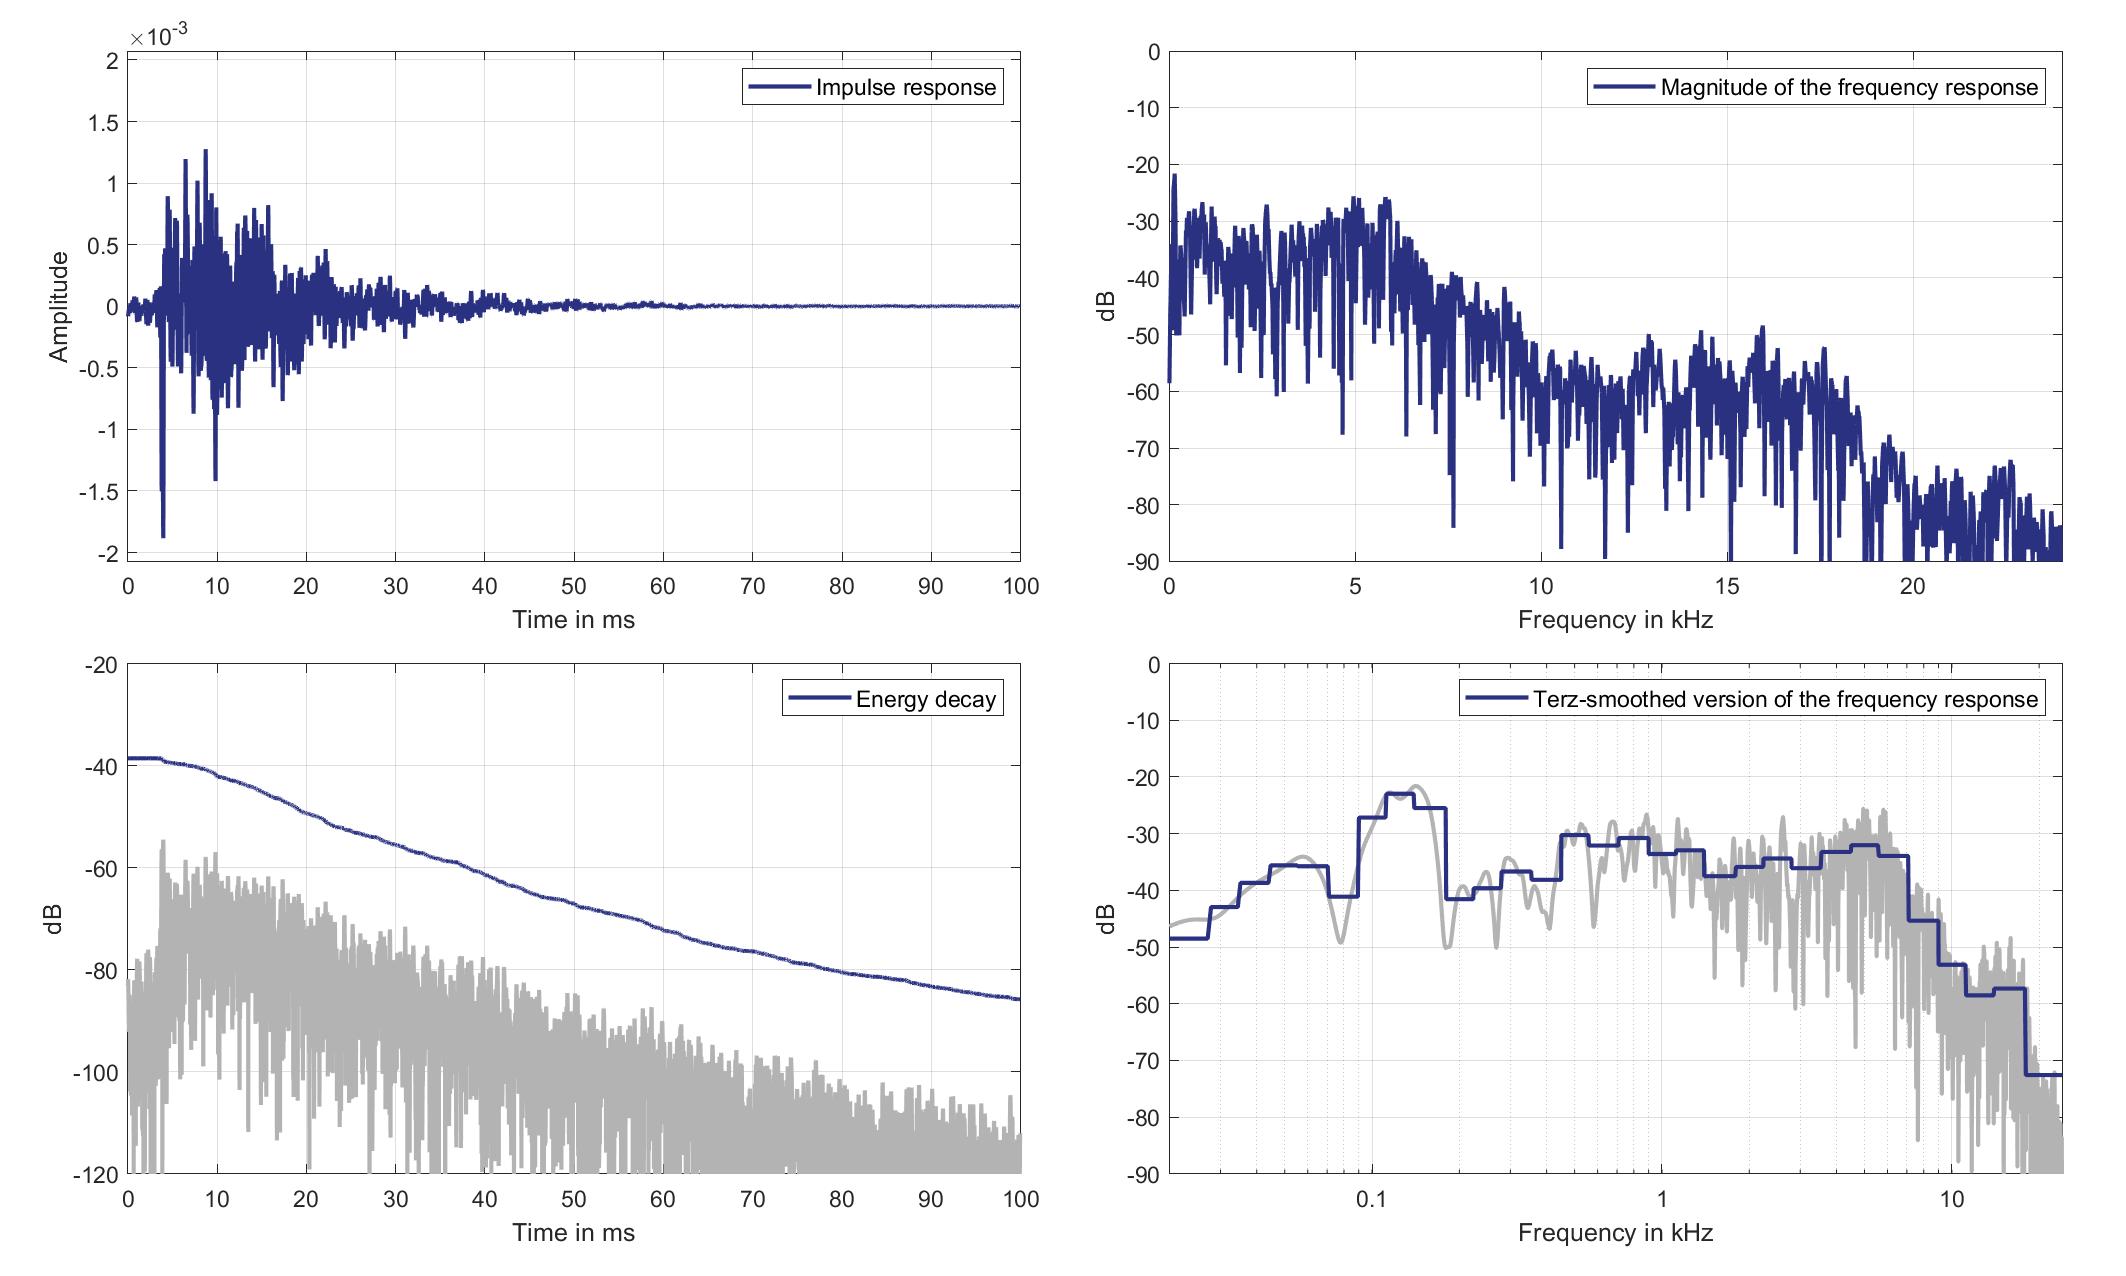
Download impulse response (in ".fir" format).
In the download section you can download all impulse response files as well as format explanation and Matlab as well as Python code examples for loading fir files.
Mic. 13
Mouth Loudspeaker of Zone 1 (Lsp. 12) to Standard Car Microphone 13 (Mic. 13)
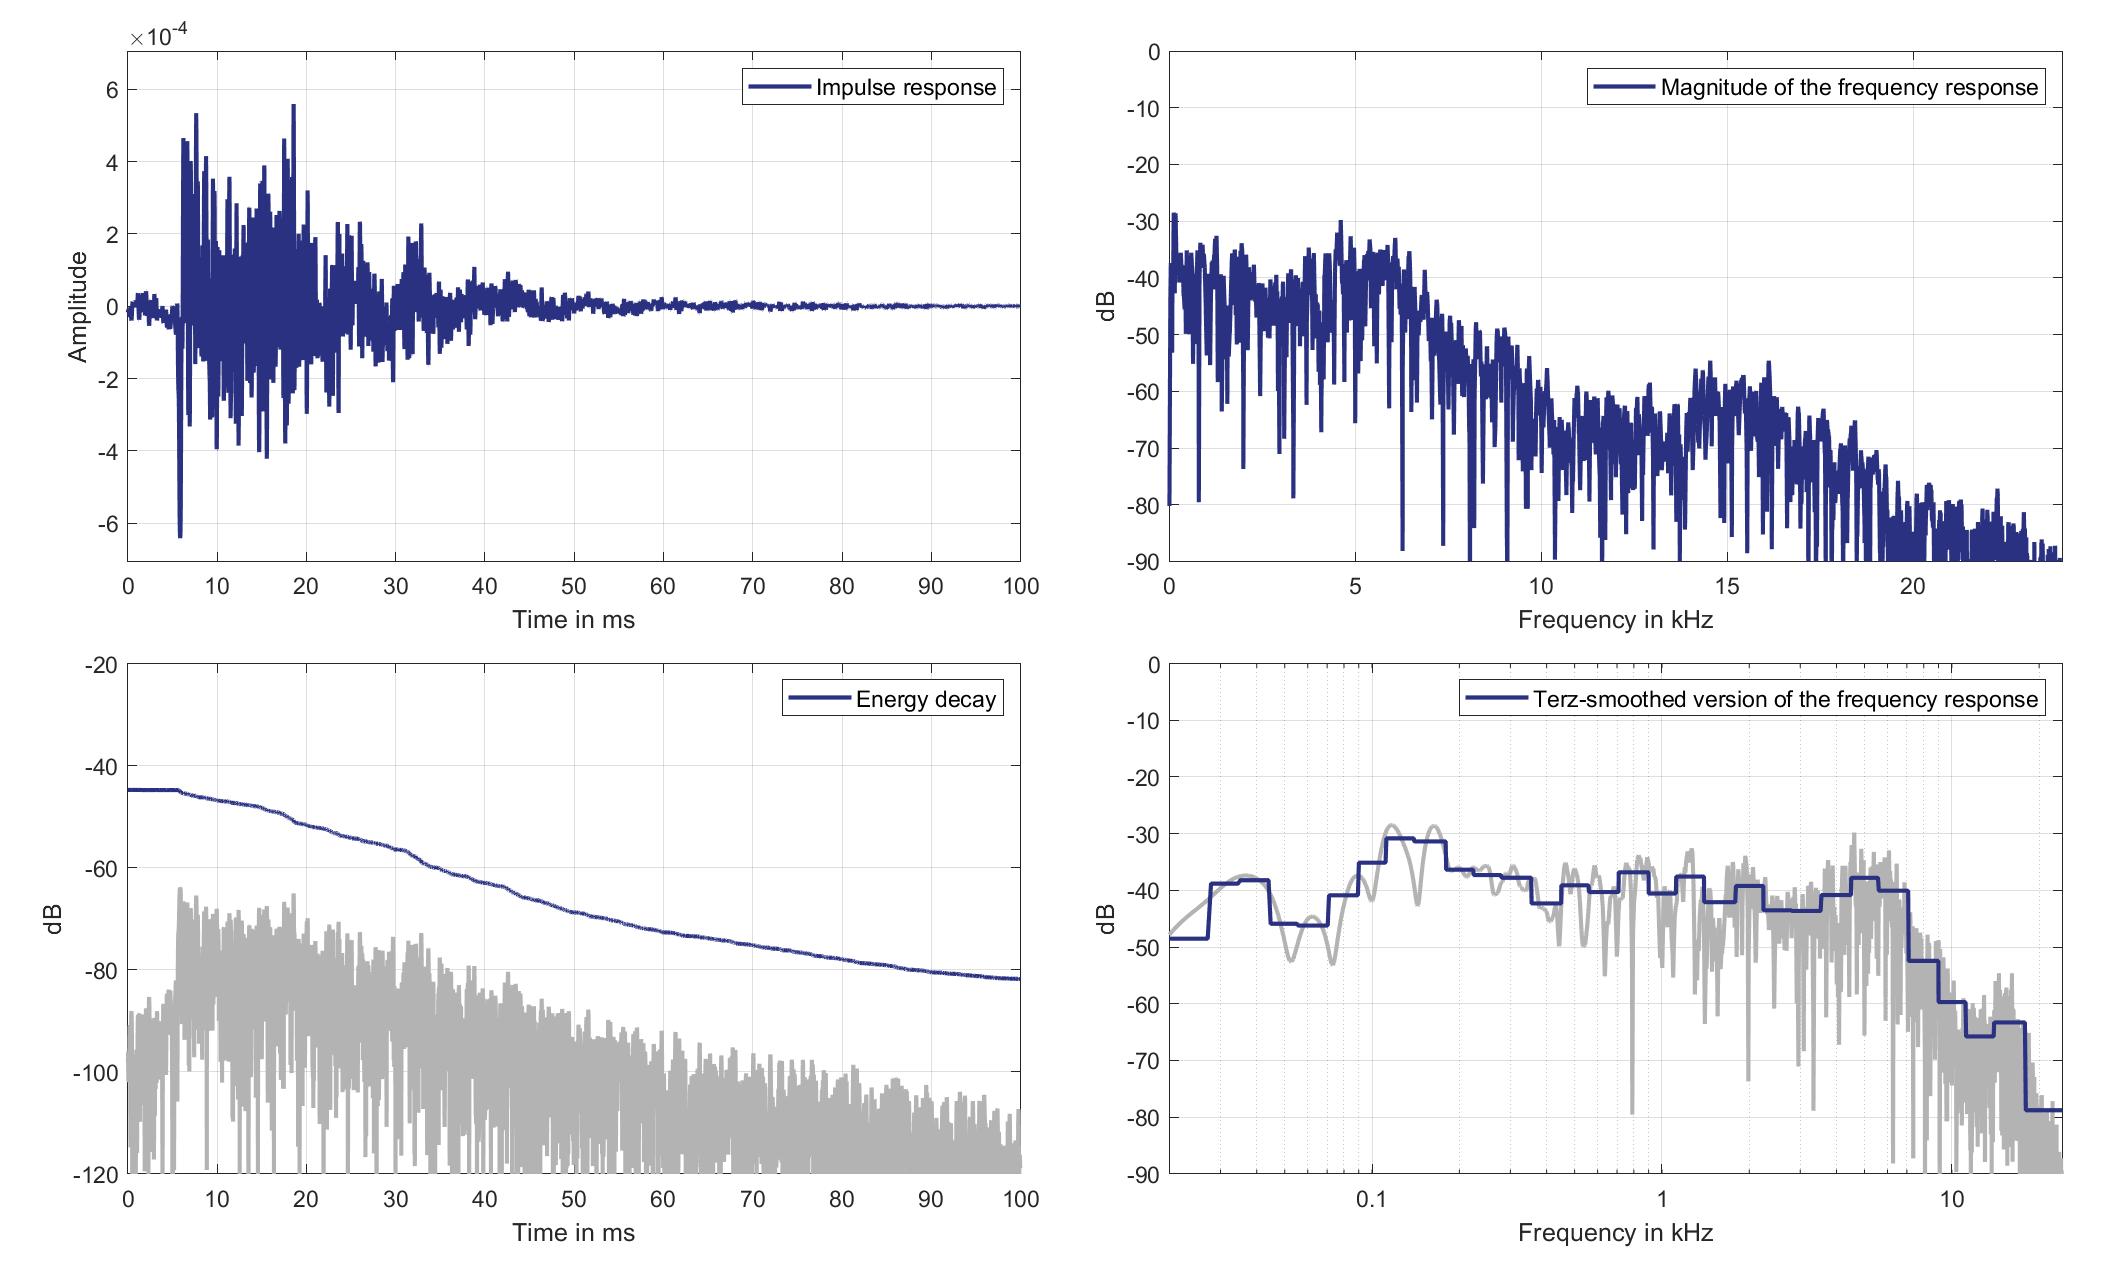
Download impulse response (in ".fir" format).
In the download section you can download all impulse response files as well as format explanation and Matlab as well as Python code examples for loading fir files.
Mic. 14
Mouth Loudspeaker of Zone 1 (Lsp. 12) to Standard Car Microphone 14 (Mic. 14)

Download impulse response (in ".fir" format).
In the download section you can download all impulse response files as well as format explanation and Matlab as well as Python code examples for loading fir files.
Mic. 15
Mouth Loudspeaker of Zone 1 (Lsp. 12) to Standard Car Microphone 15 (Mic. 15)

Download impulse response (in ".fir" format).
In the download section you can download all impulse response files as well as format explanation and Matlab as well as Python code examples for loading fir files.
Mic. 16
Mouth Loudspeaker of Zone 1 (Lsp. 12) to Standard Car Microphone 16 (Mic. 16)

Download impulse response (in ".fir" format).
In the download section you can download all impulse response files as well as format explanation and Matlab as well as Python code examples for loading fir files.
Mic. 17
Mouth Loudspeaker of Zone 1 (Lsp. 12) to Standard Car Microphone 17 (Mic. 17)
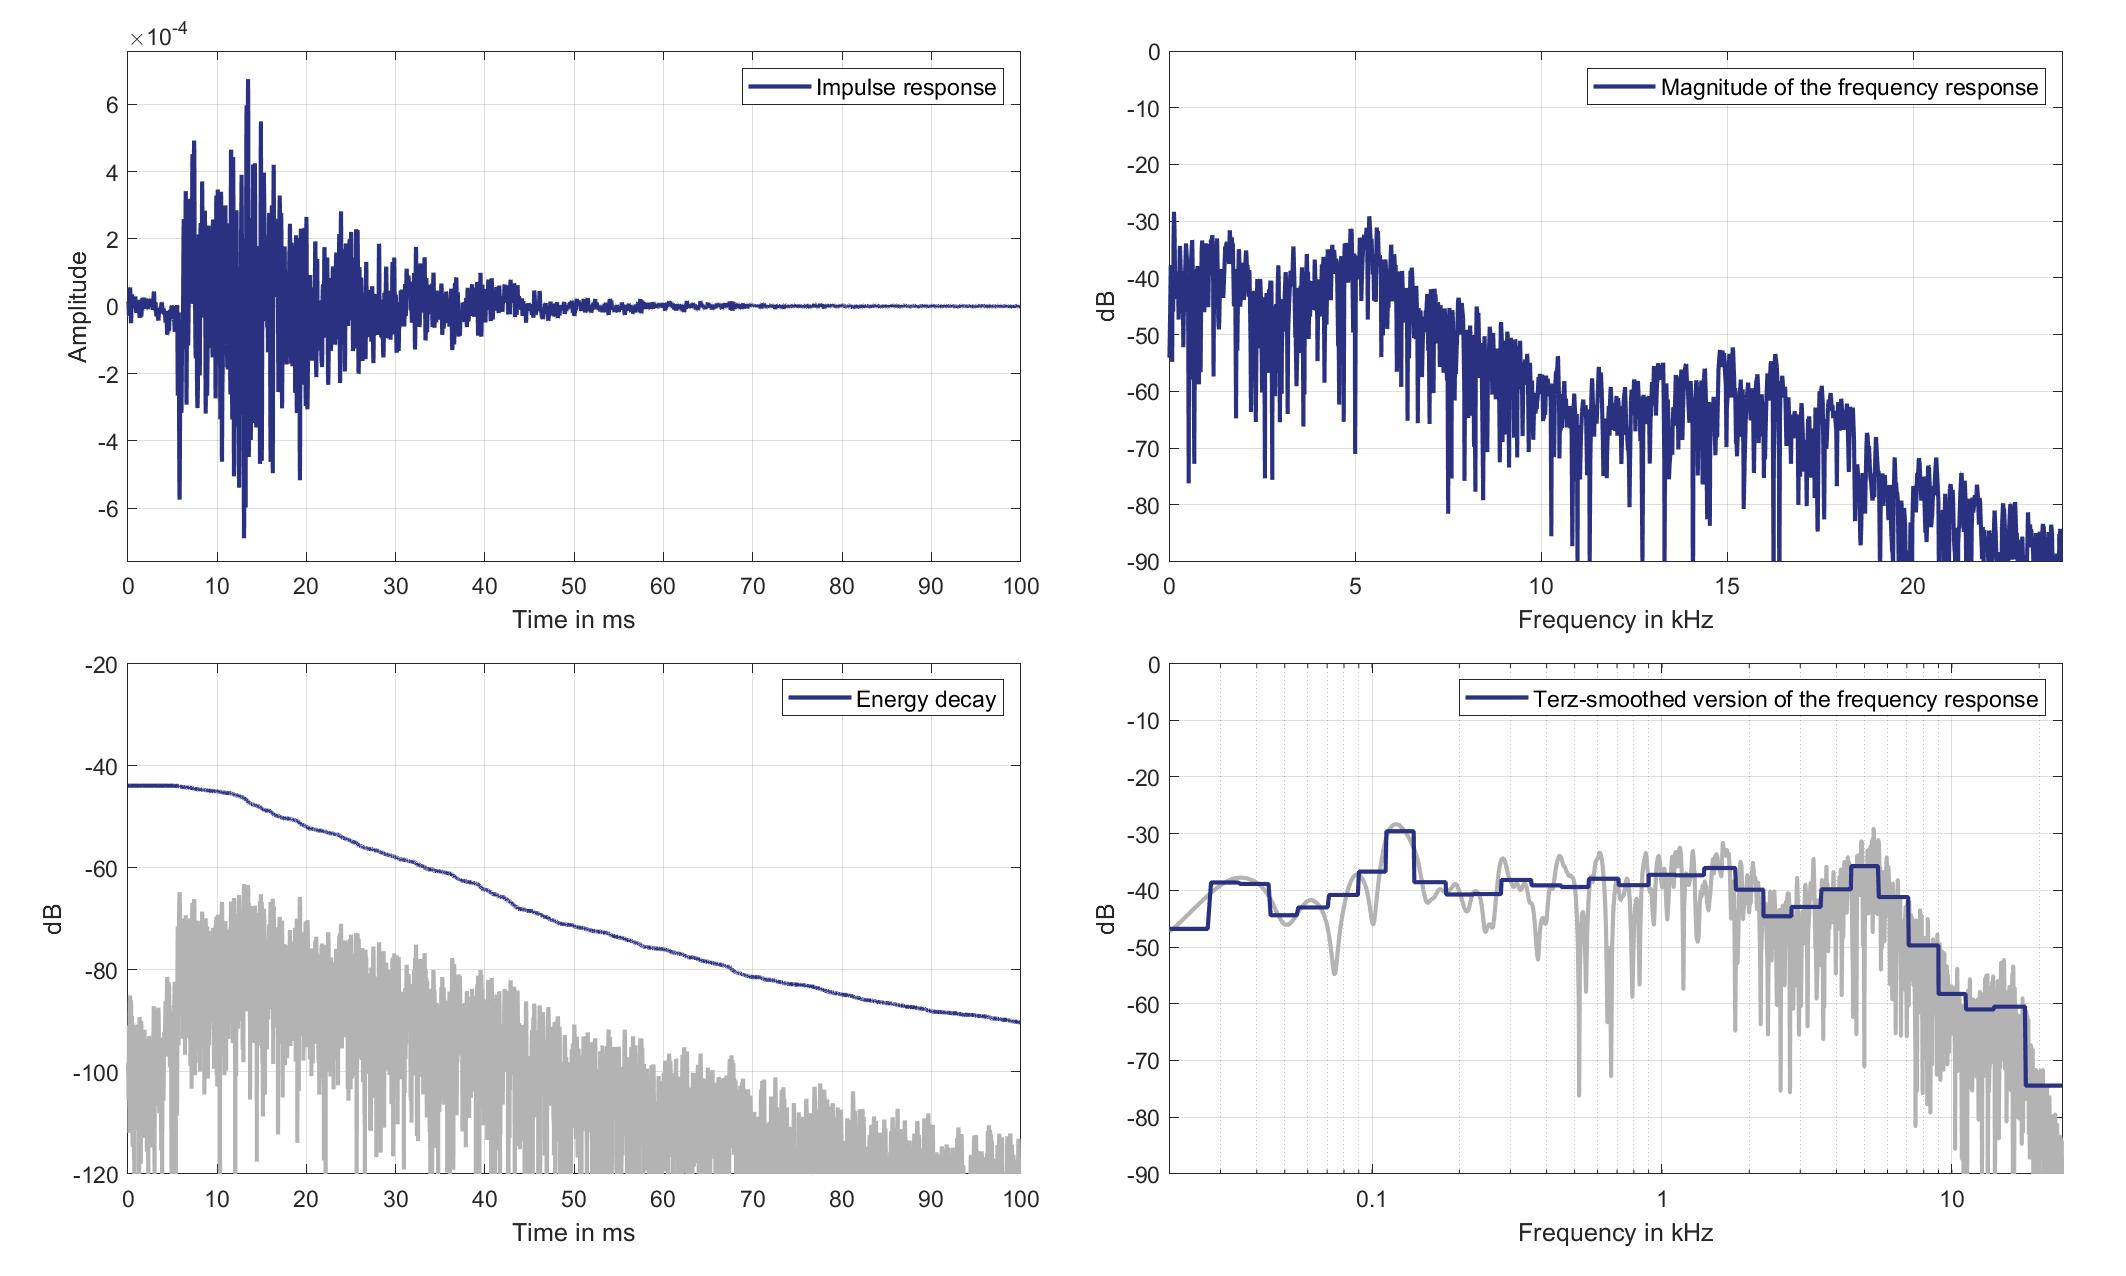
Download impulse response (in ".fir" format).
In the download section you can download all impulse response files as well as format explanation and Matlab as well as Python code examples for loading fir files.
Mic. 18
Mouth Loudspeaker of Zone 1 (Lsp. 12) to Standard Car Microphone 18 (Mic. 18)
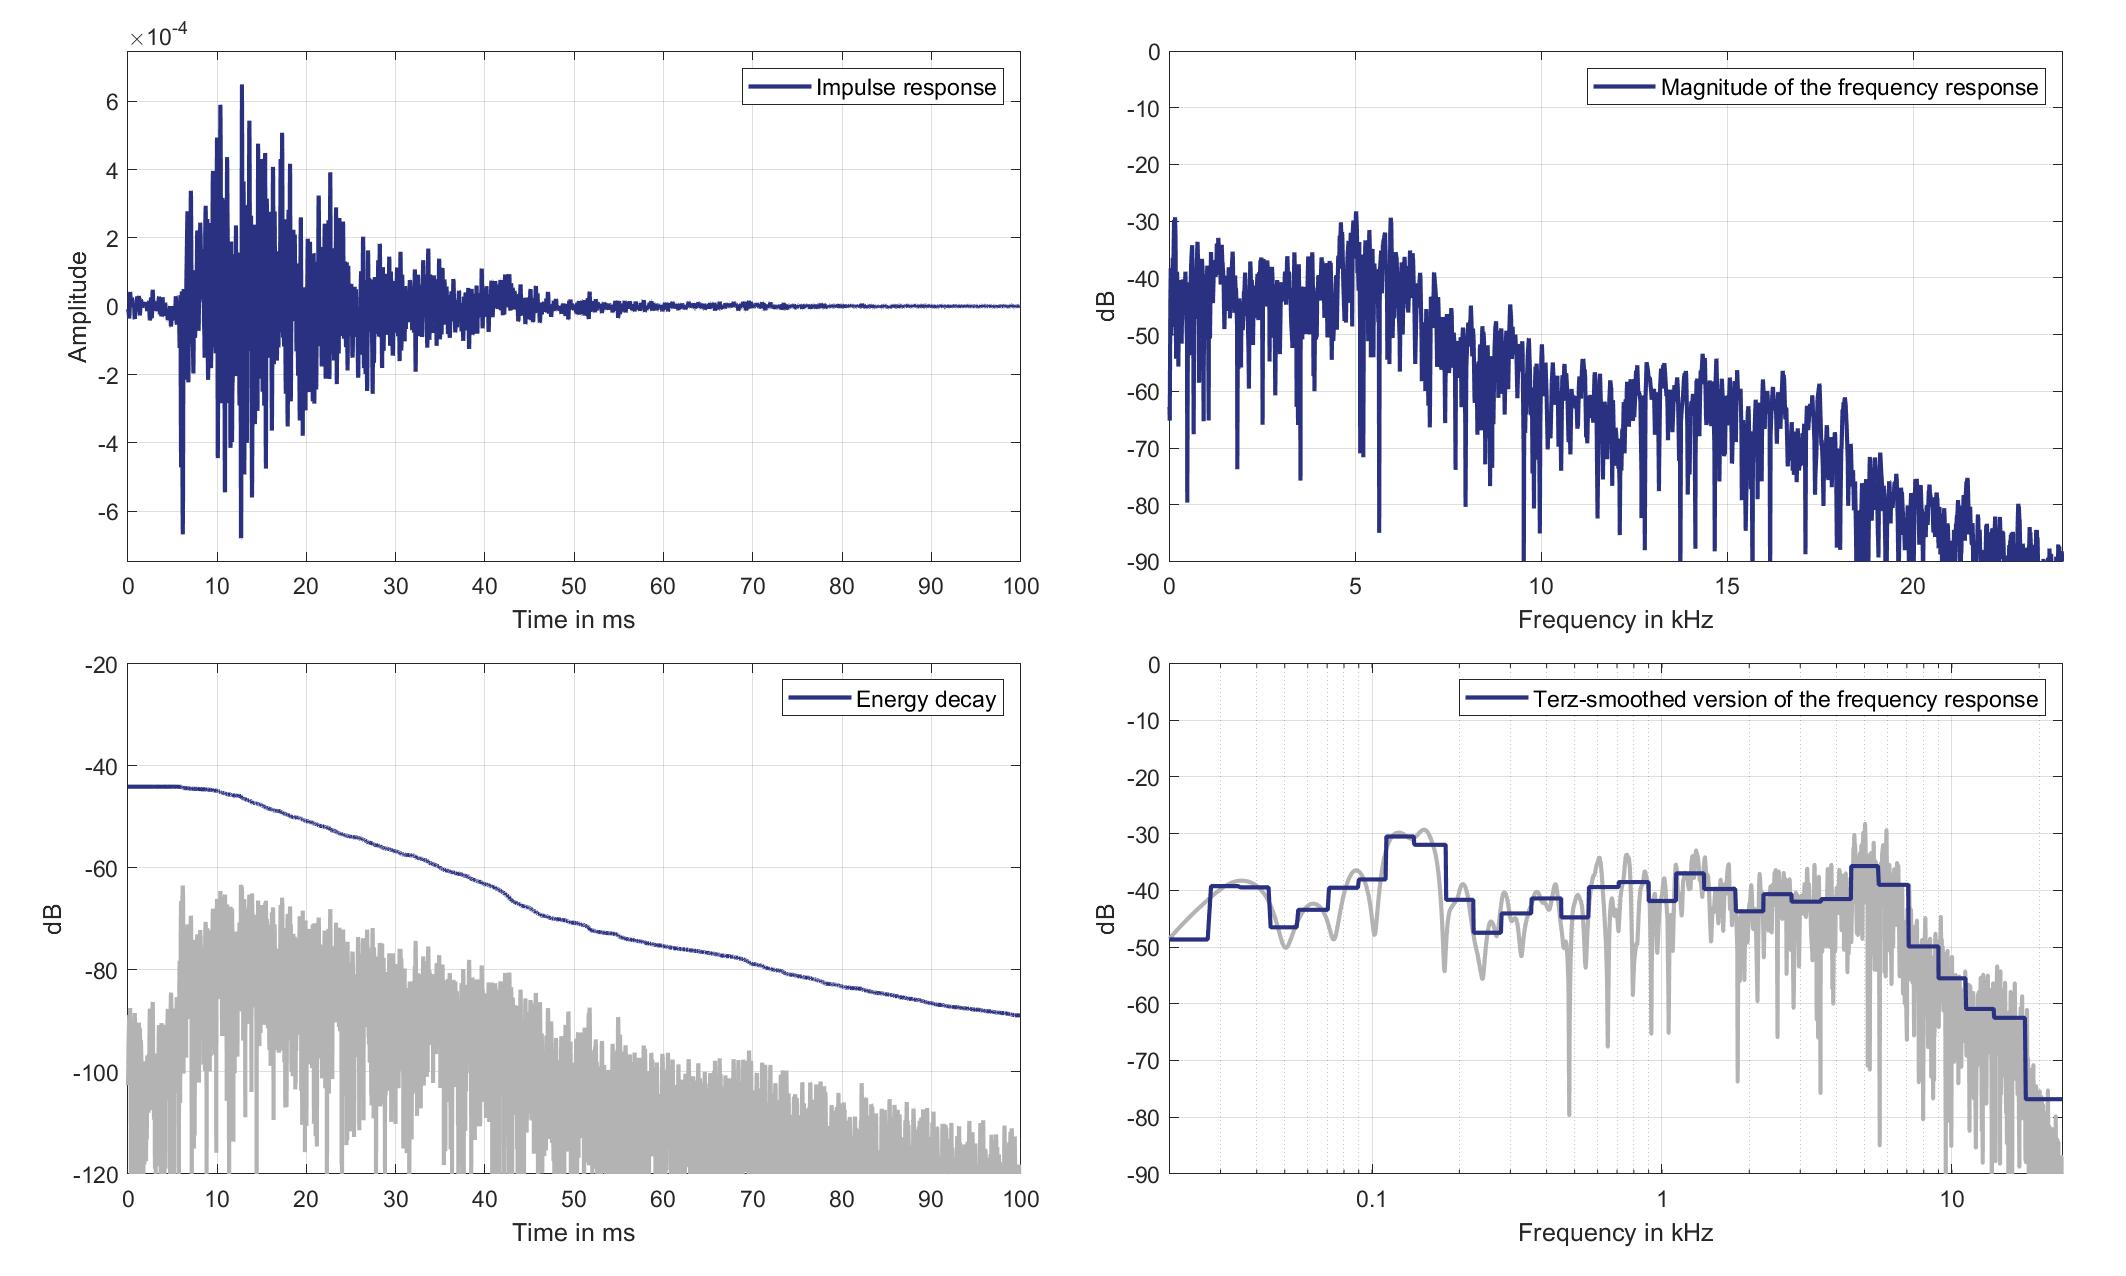
Download impulse response (in ".fir" format).
In the download section you can download all impulse response files as well as format explanation and Matlab as well as Python code examples for loading fir files.
Lsp. 13
Mic. 0
Mouth Loudspeaker of Zone 2 (Lsp. 13) to Standard Car Microphone 0 (Mic. 0)
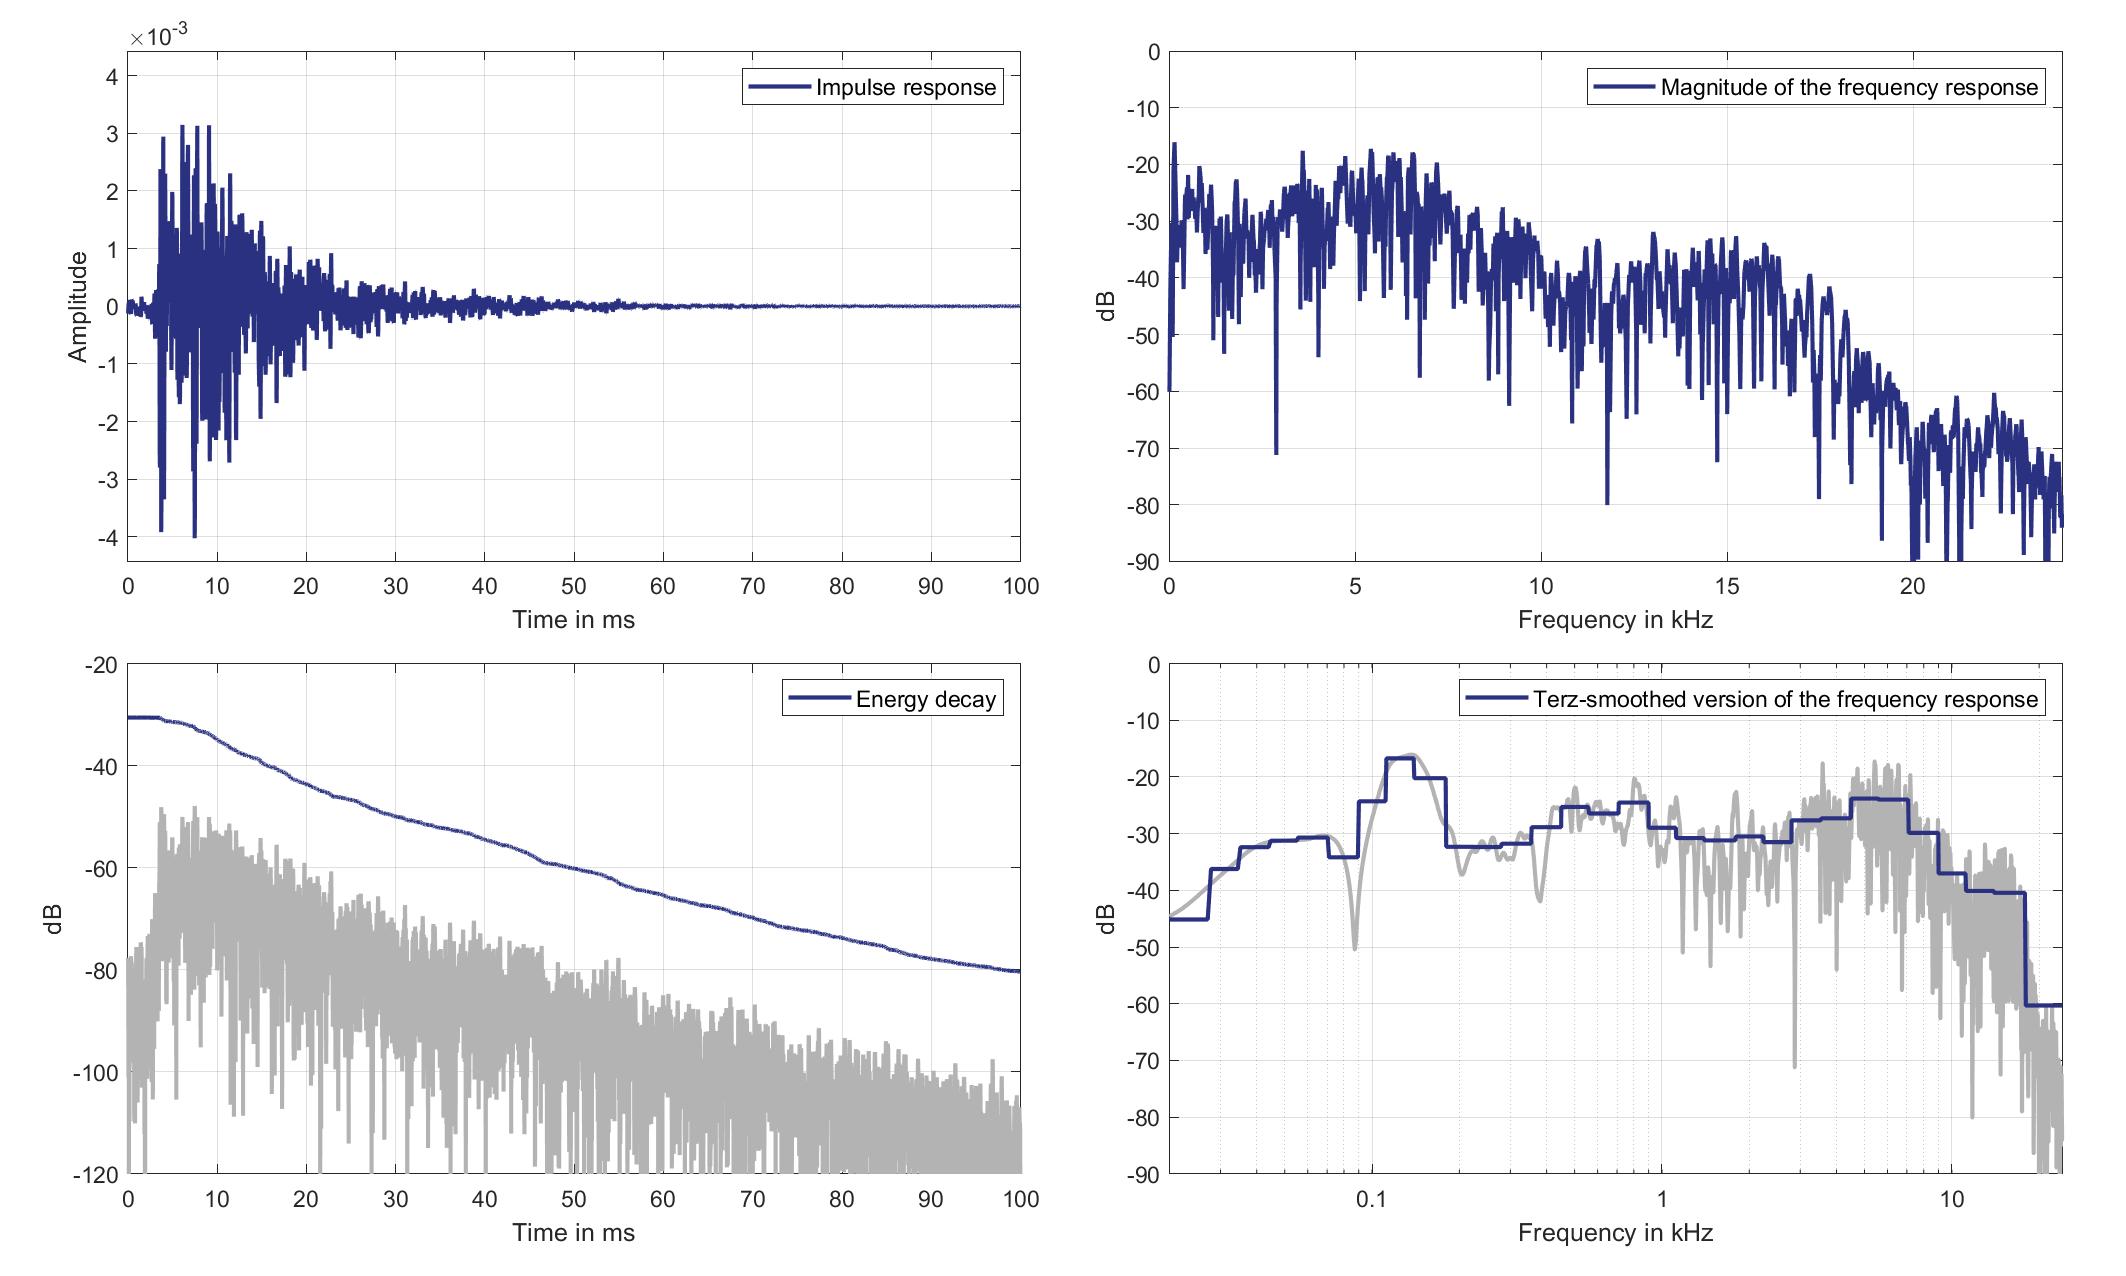
Download impulse response (in ".fir" format).
In the download section you can download all impulse response files as well as format explanation and Matlab as well as Python code examples for loading fir files.
Mic. 1
Mouth Loudspeaker of Zone 2 (Lsp. 13) to Standard Car Microphone 1 (Mic. 1)
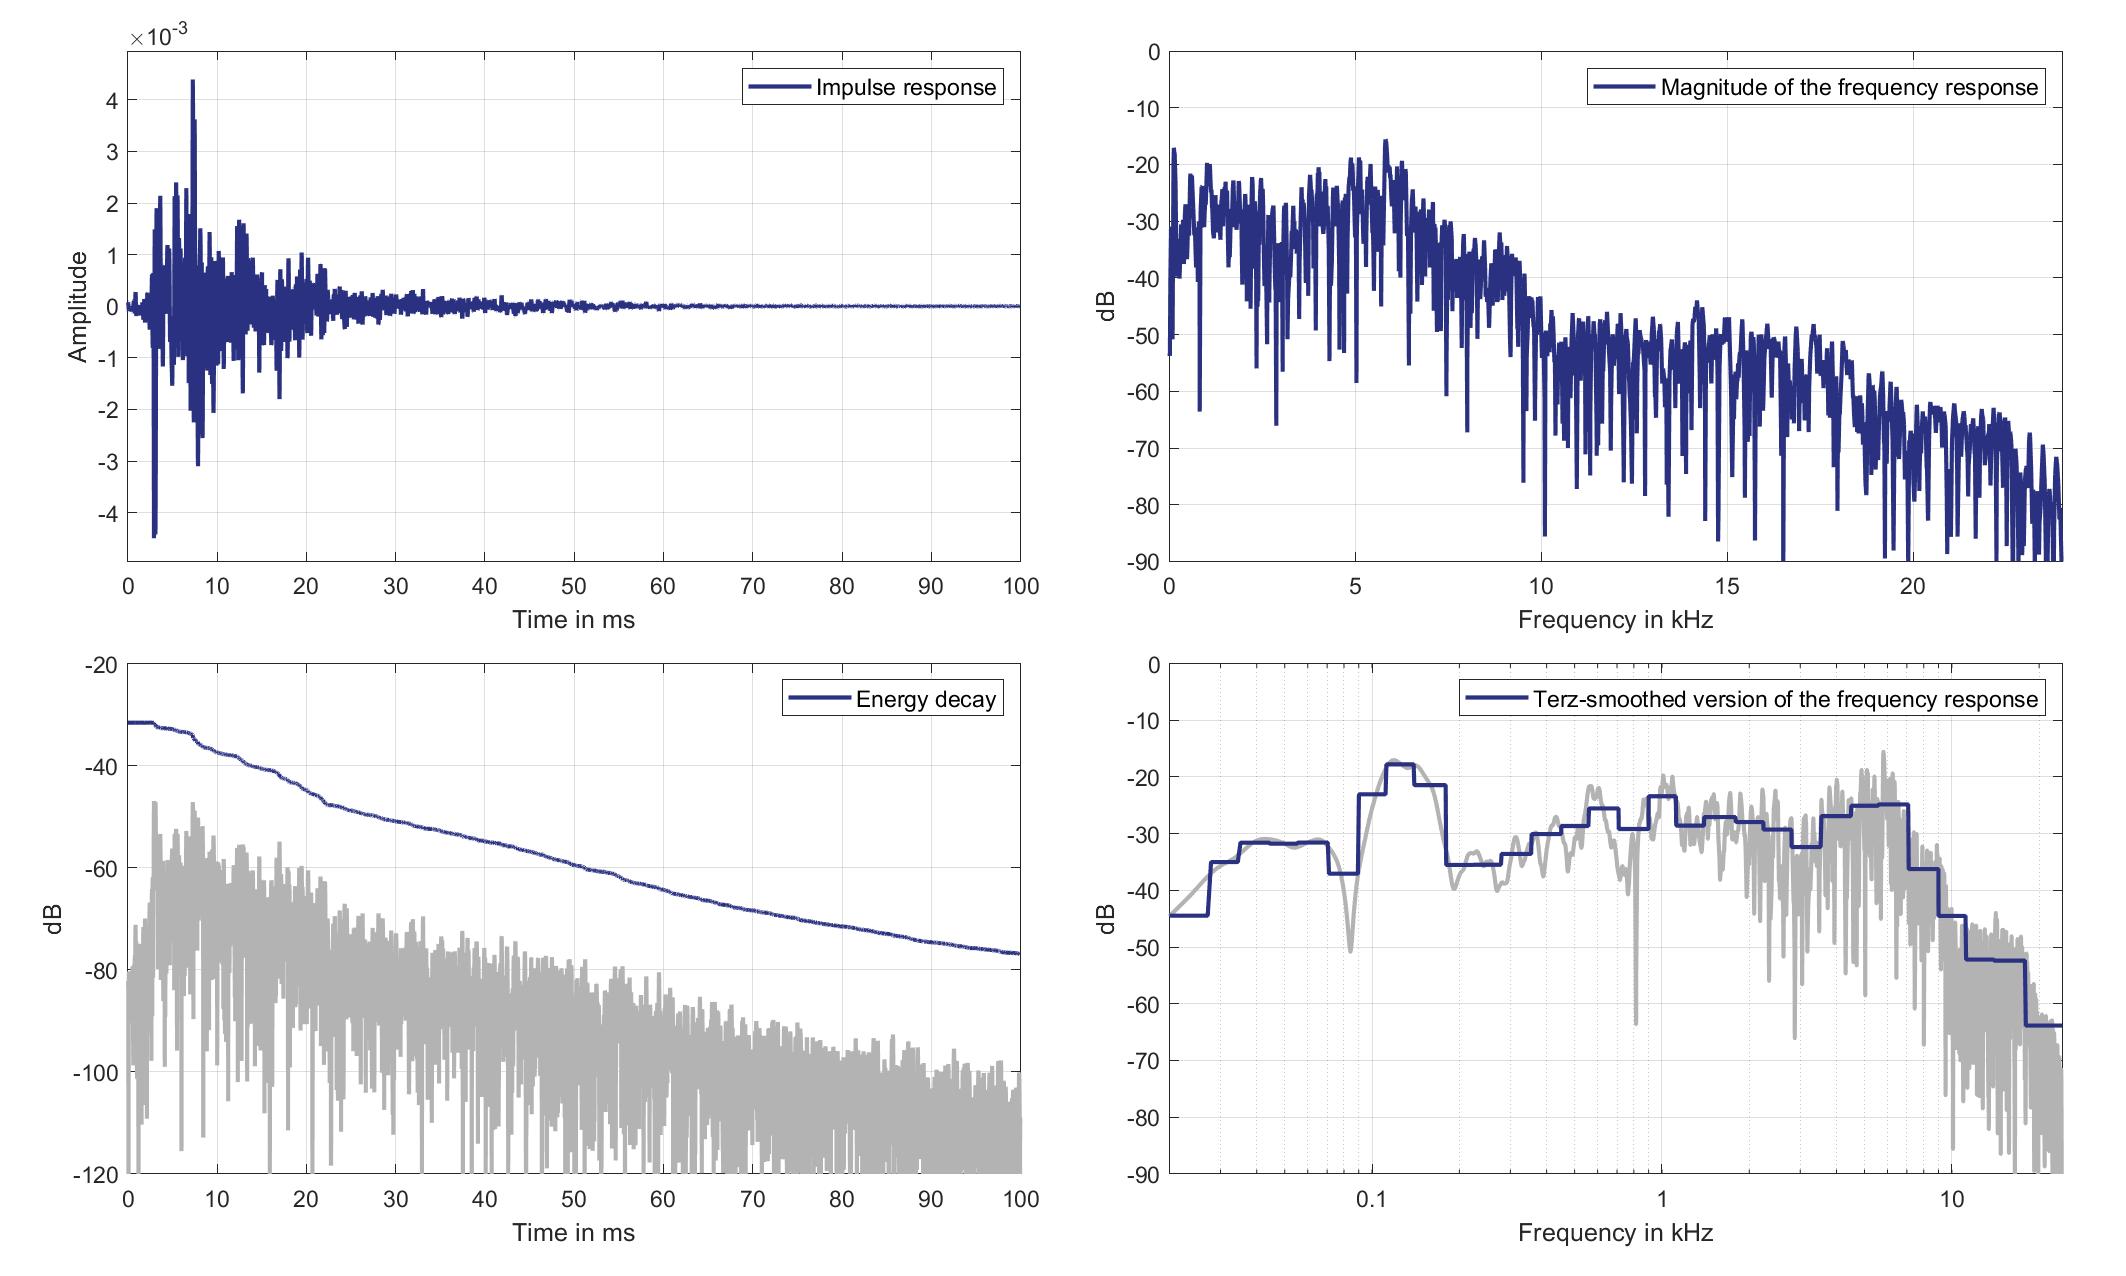
Download impulse response (in ".fir" format).
In the download section you can download all impulse response files as well as format explanation and Matlab as well as Python code examples for loading fir files.
Mic. 2
Mouth Loudspeaker of Zone 2 (Lsp. 13) to Standard Car Microphone 2 (Mic. 2)
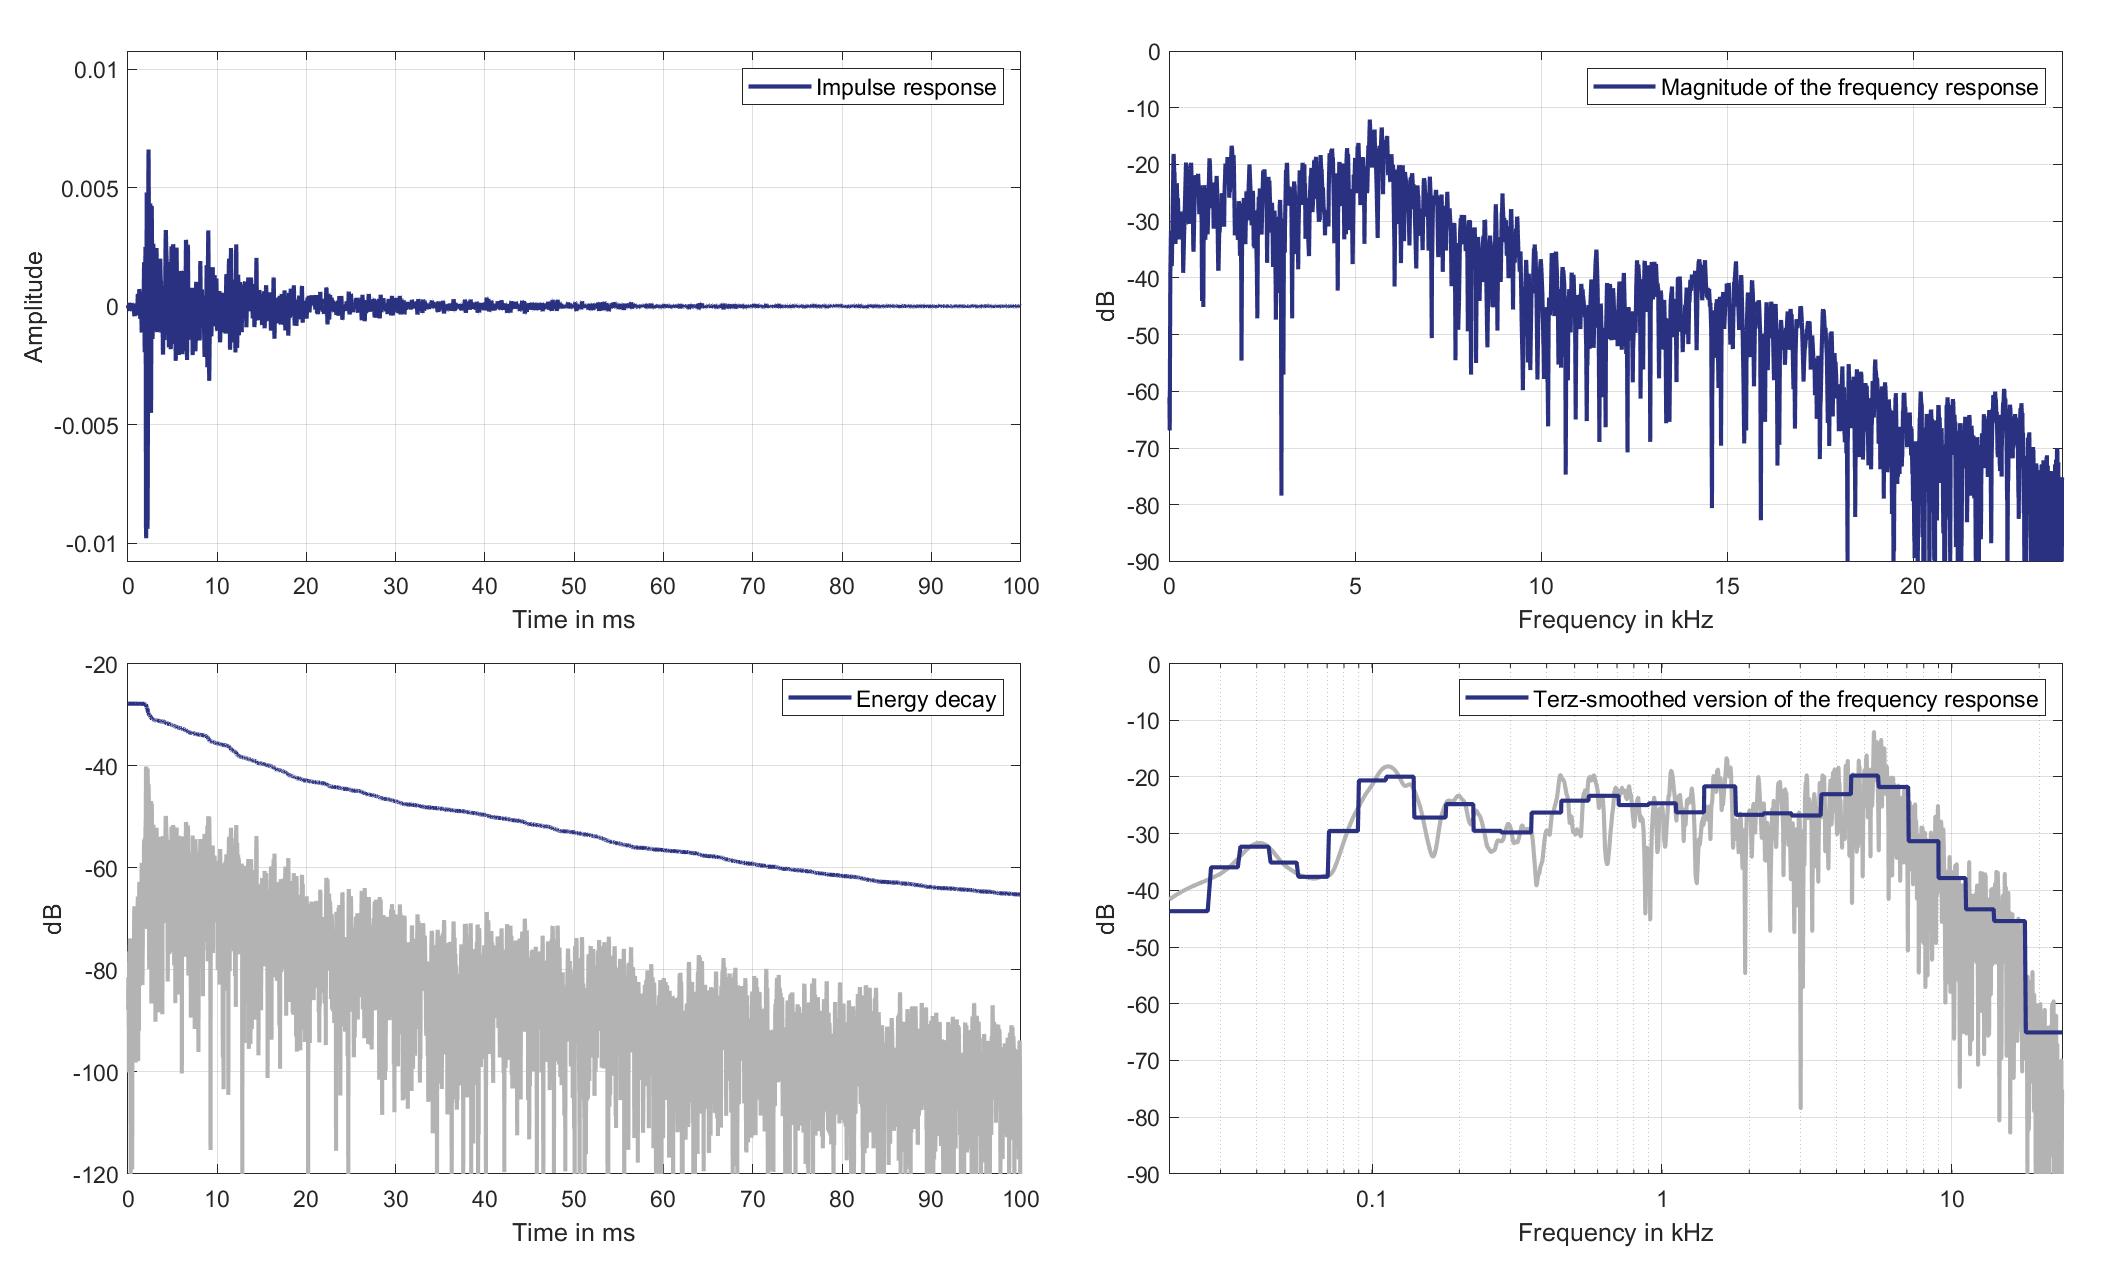
Download impulse response (in ".fir" format).
In the download section you can download all impulse response files as well as format explanation and Matlab as well as Python code examples for loading fir files.
Mic. 3
Mouth Loudspeaker of Zone 2 (Lsp. 13) to Standard Car Microphone 3 (Mic. 3)
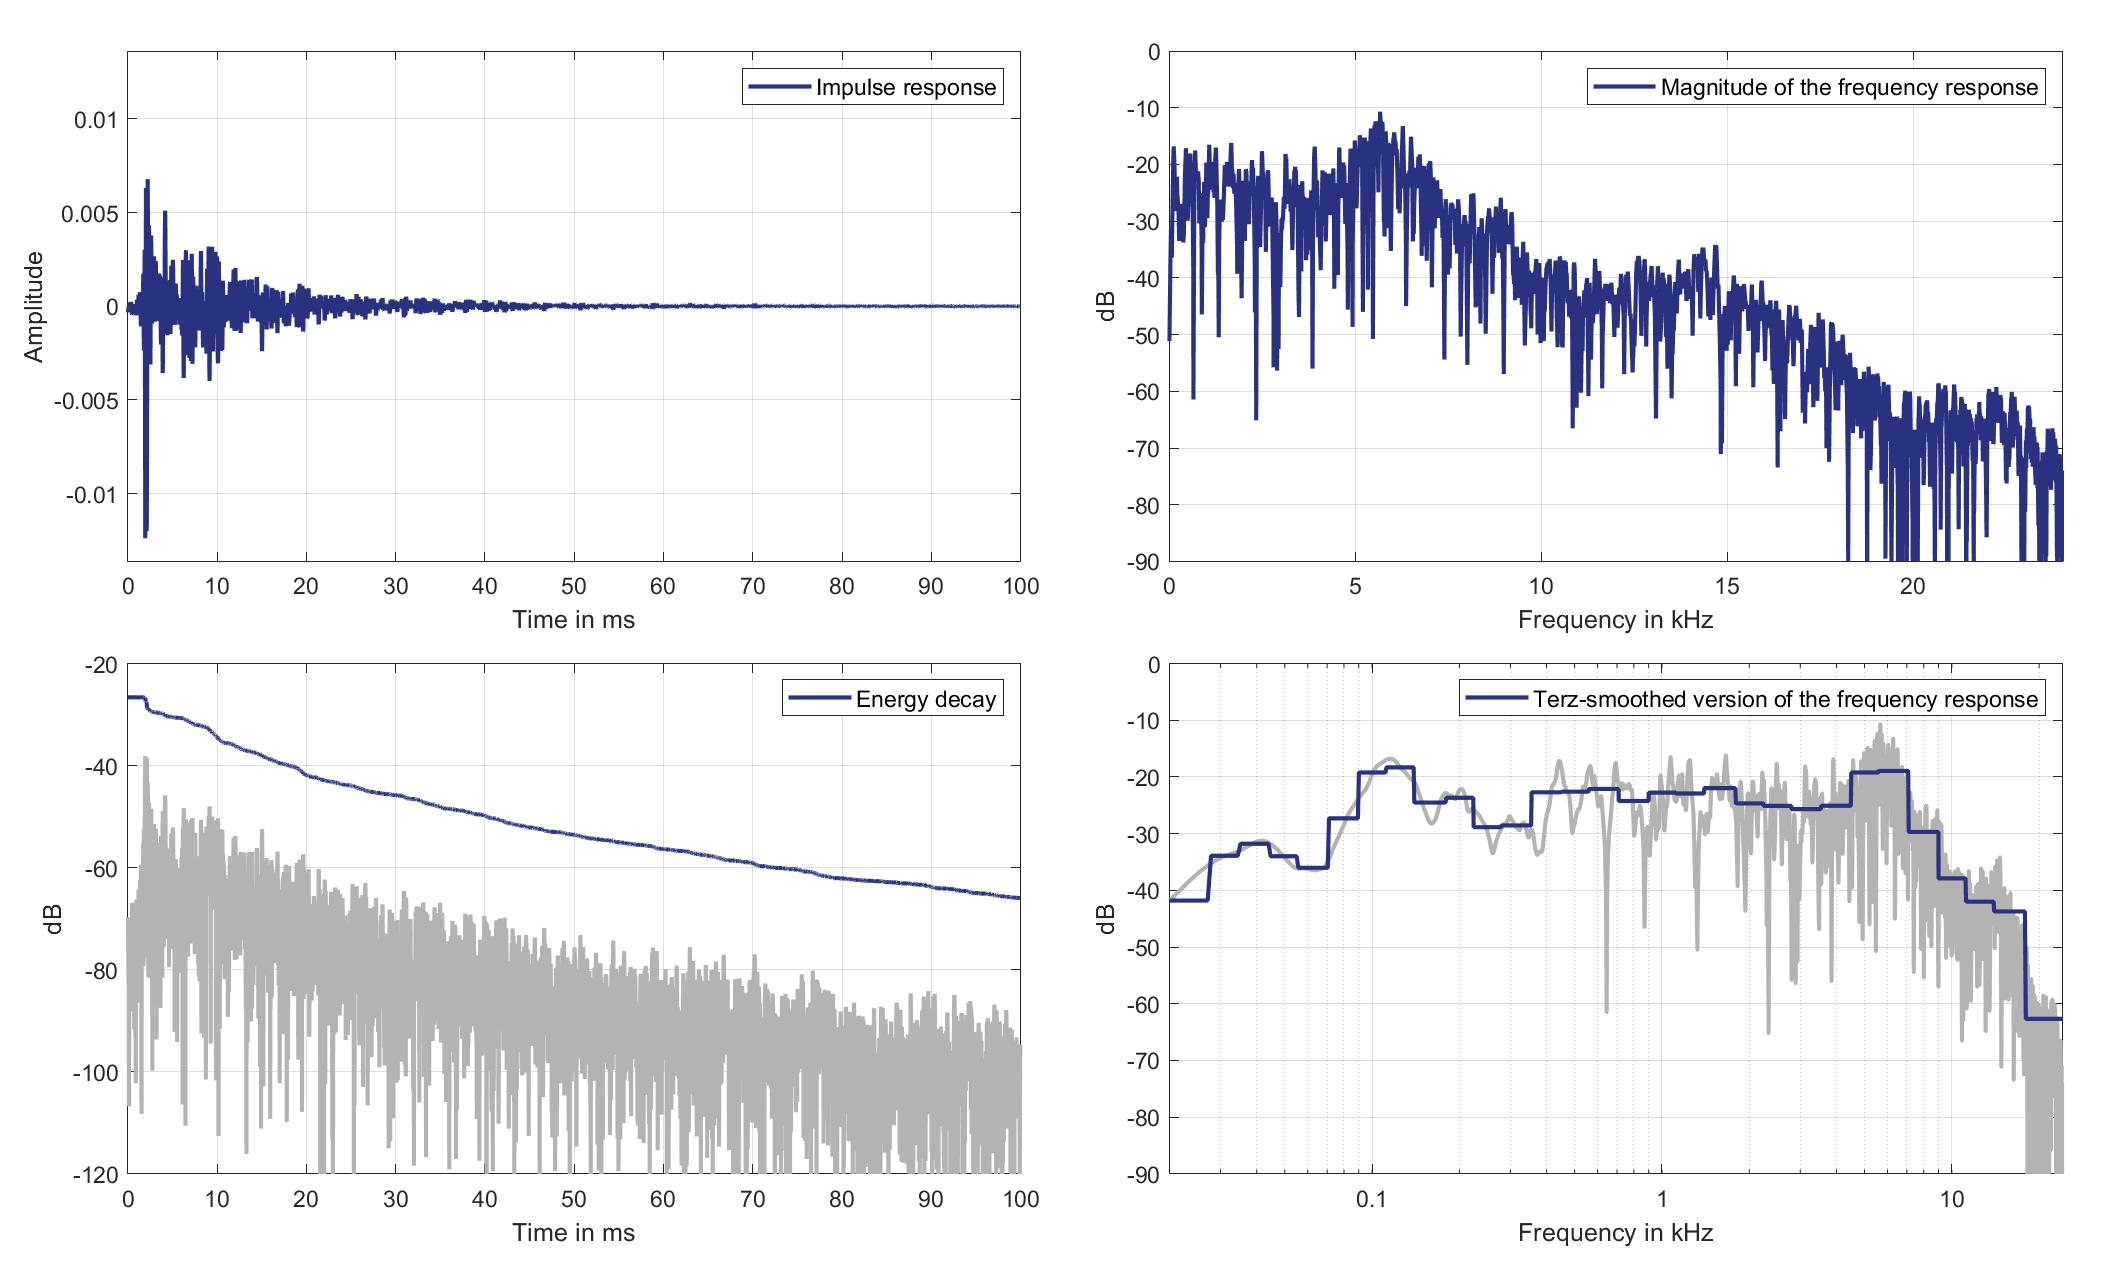
Download impulse response (in ".fir" format).
In the download section you can download all impulse response files as well as format explanation and Matlab as well as Python code examples for loading fir files.
Mic. 4
Mouth Loudspeaker of Zone 2 (Lsp. 13) to Standard Car Microphone 4 (Mic. 4)
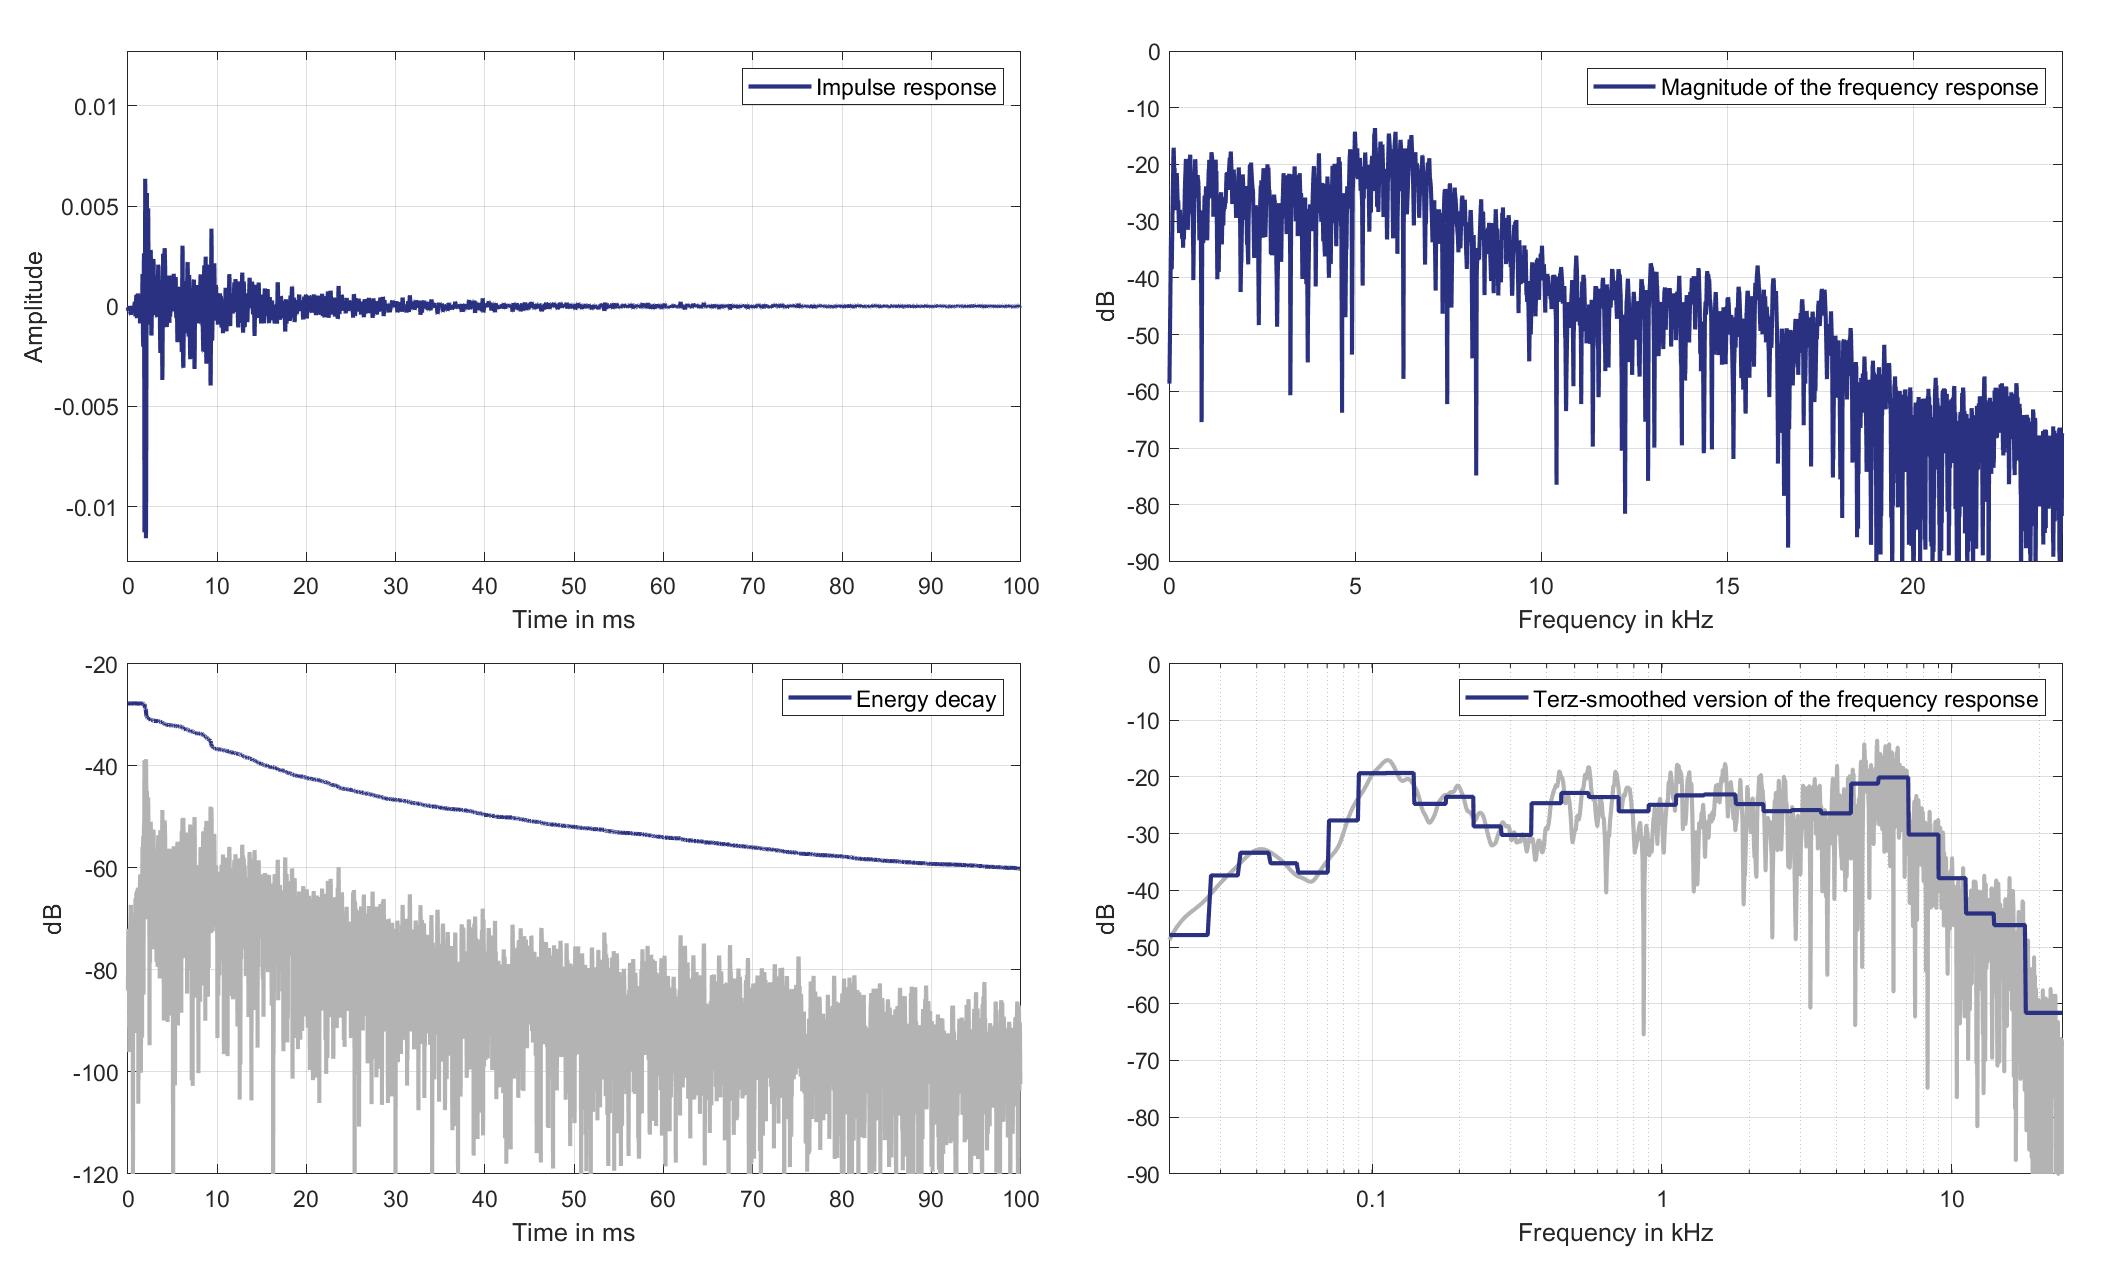
Download impulse response (in ".fir" format).
In the download section you can download all impulse response files as well as format explanation and Matlab as well as Python code examples for loading fir files.
Mic. 5
Mouth Loudspeaker of Zone 2 (Lsp. 13) to Standard Car Microphone 5 (Mic. 5)
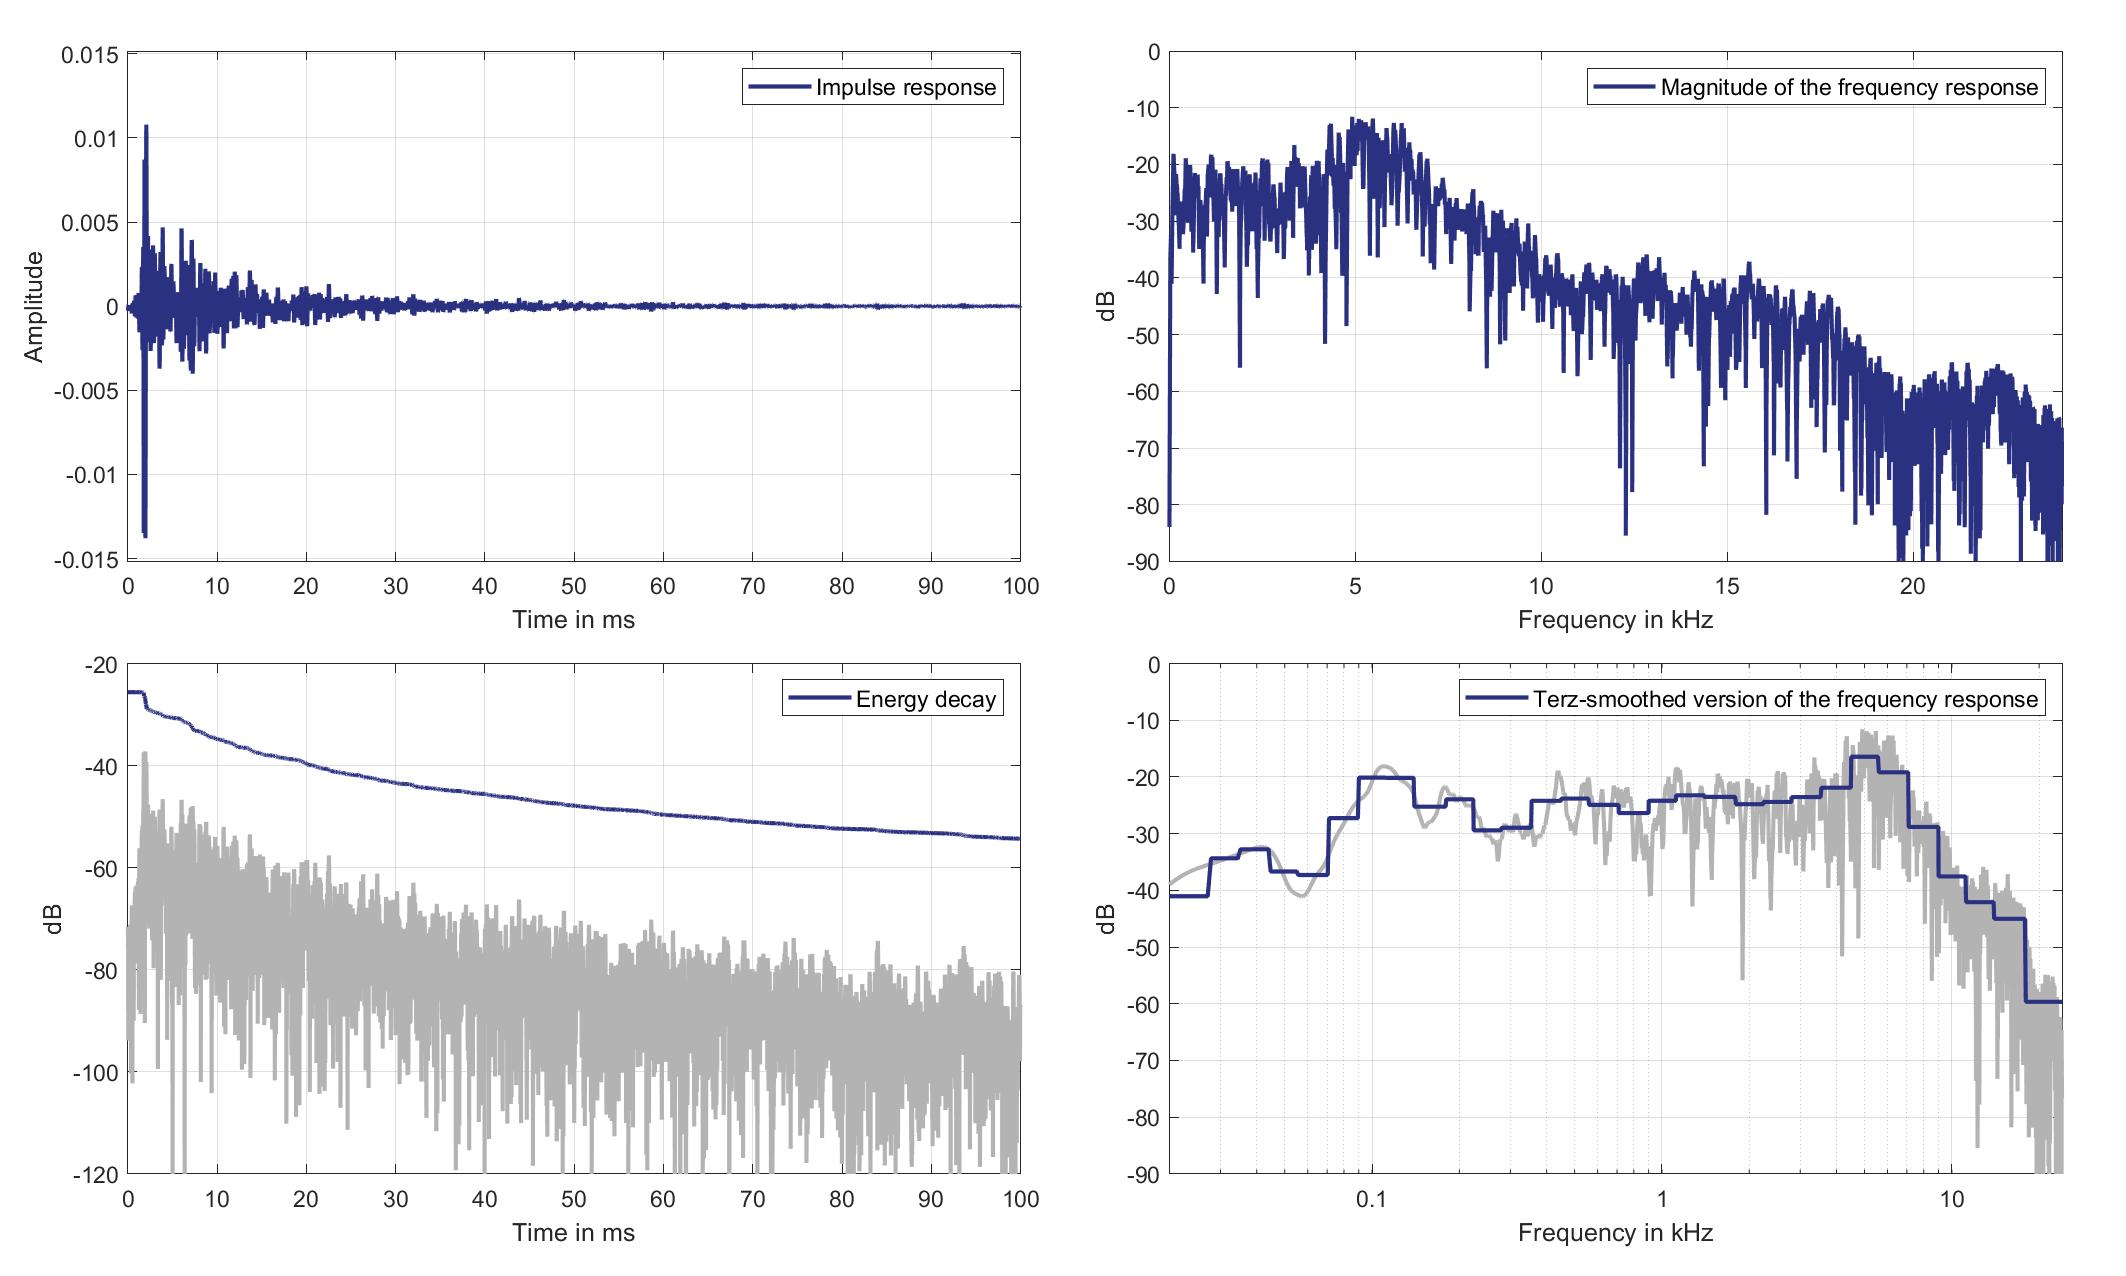
Download impulse response (in ".fir" format).
In the download section you can download all impulse response files as well as format explanation and Matlab as well as Python code examples for loading fir files.
Mic. 6
Mouth Loudspeaker of Zone 2 (Lsp. 13) to Standard Car Microphone 6 (Mic. 6)
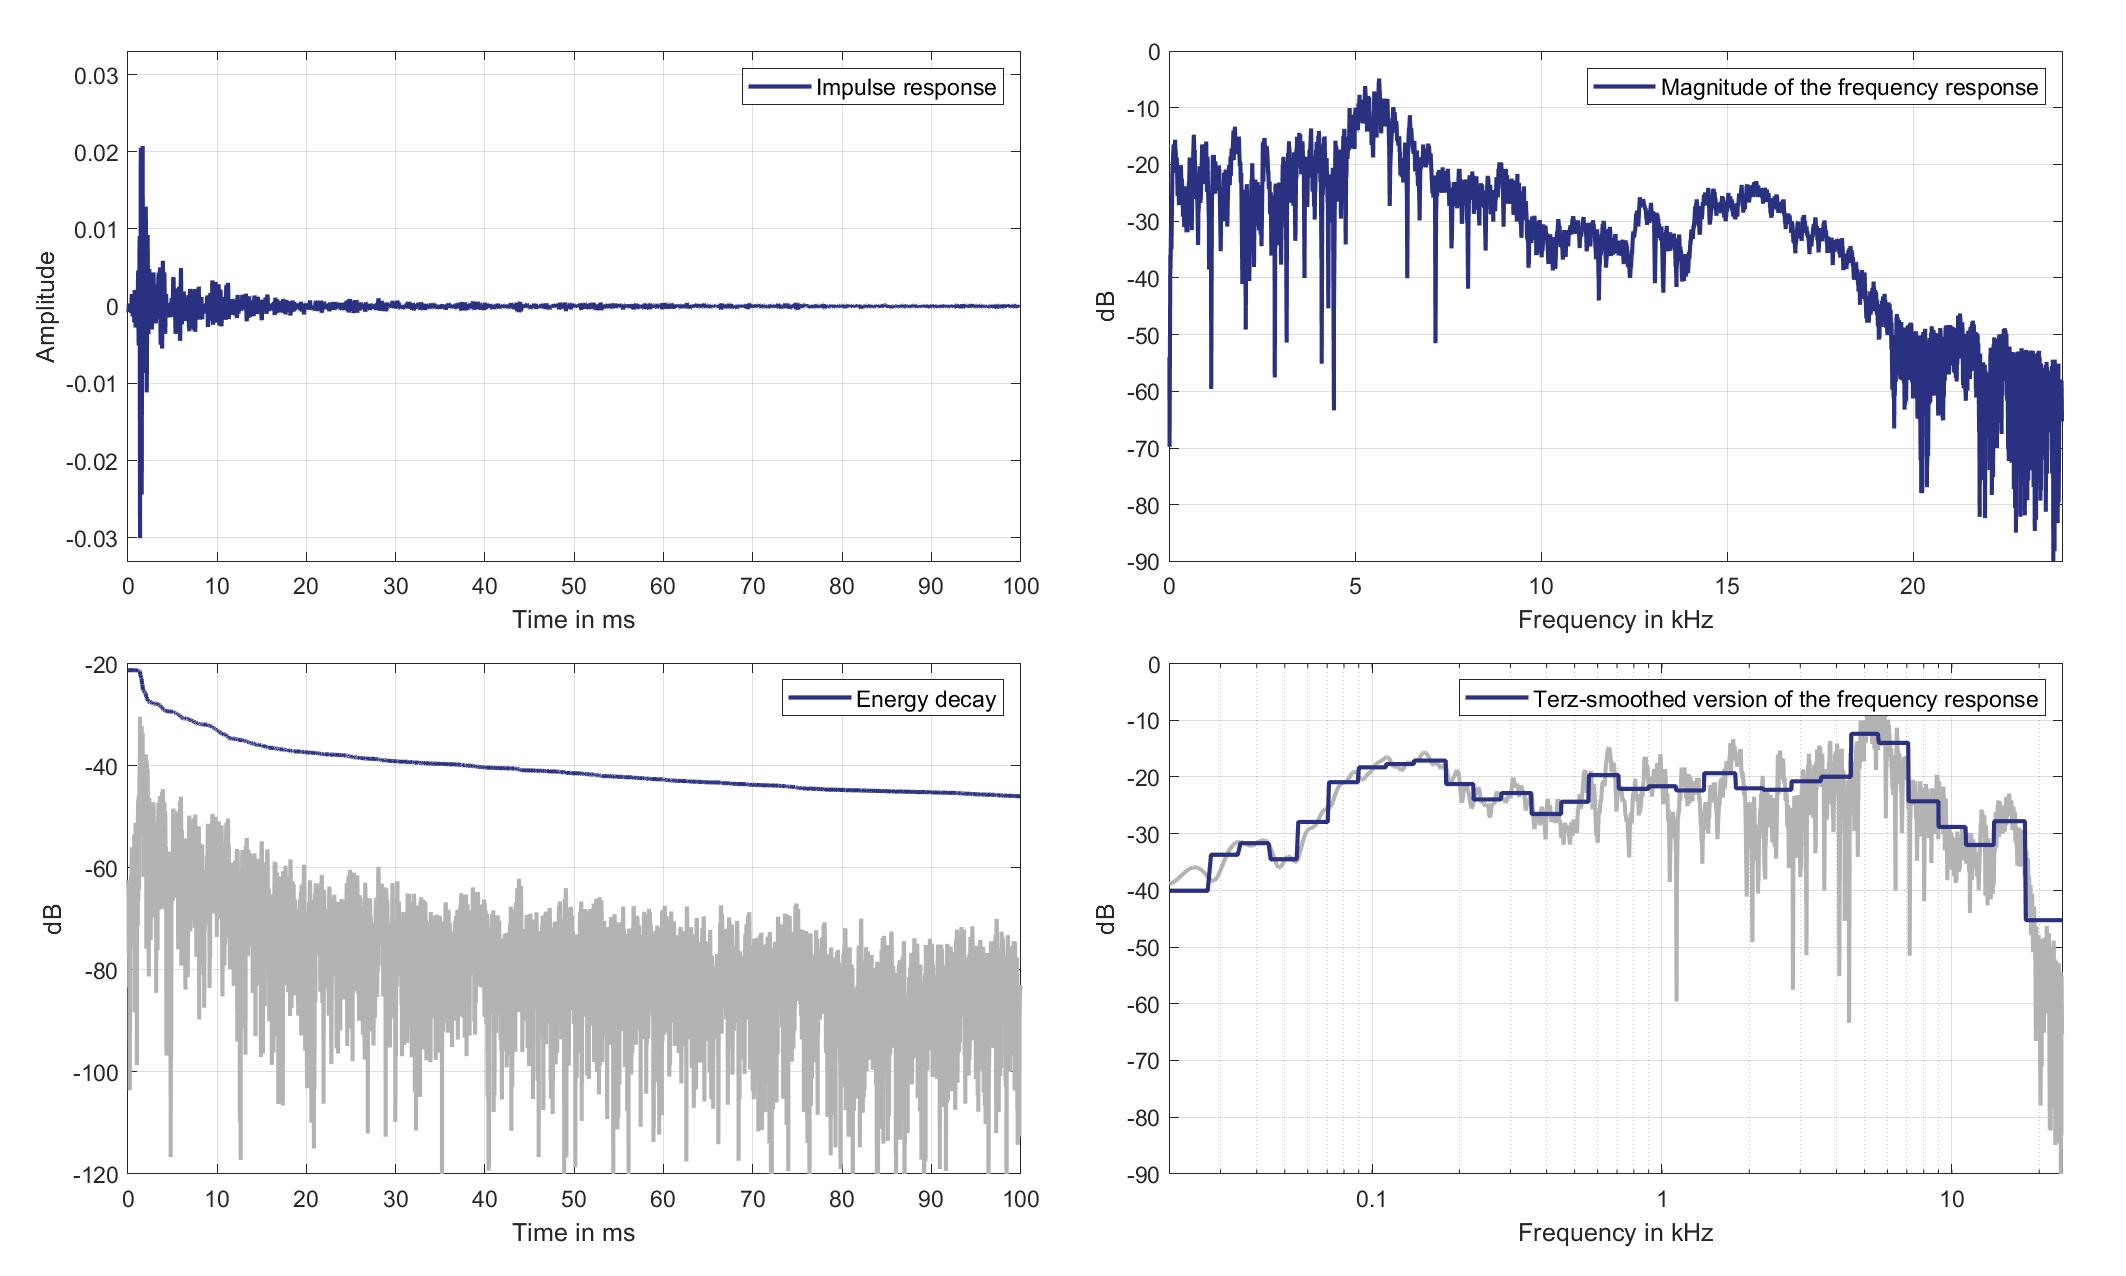
Download impulse response (in ".fir" format).
In the download section you can download all impulse response files as well as format explanation and Matlab as well as Python code examples for loading fir files.
Mic. 7
Mouth Loudspeaker of Zone 2 (Lsp. 13) to Standard Car Microphone 7 (Mic. 7)
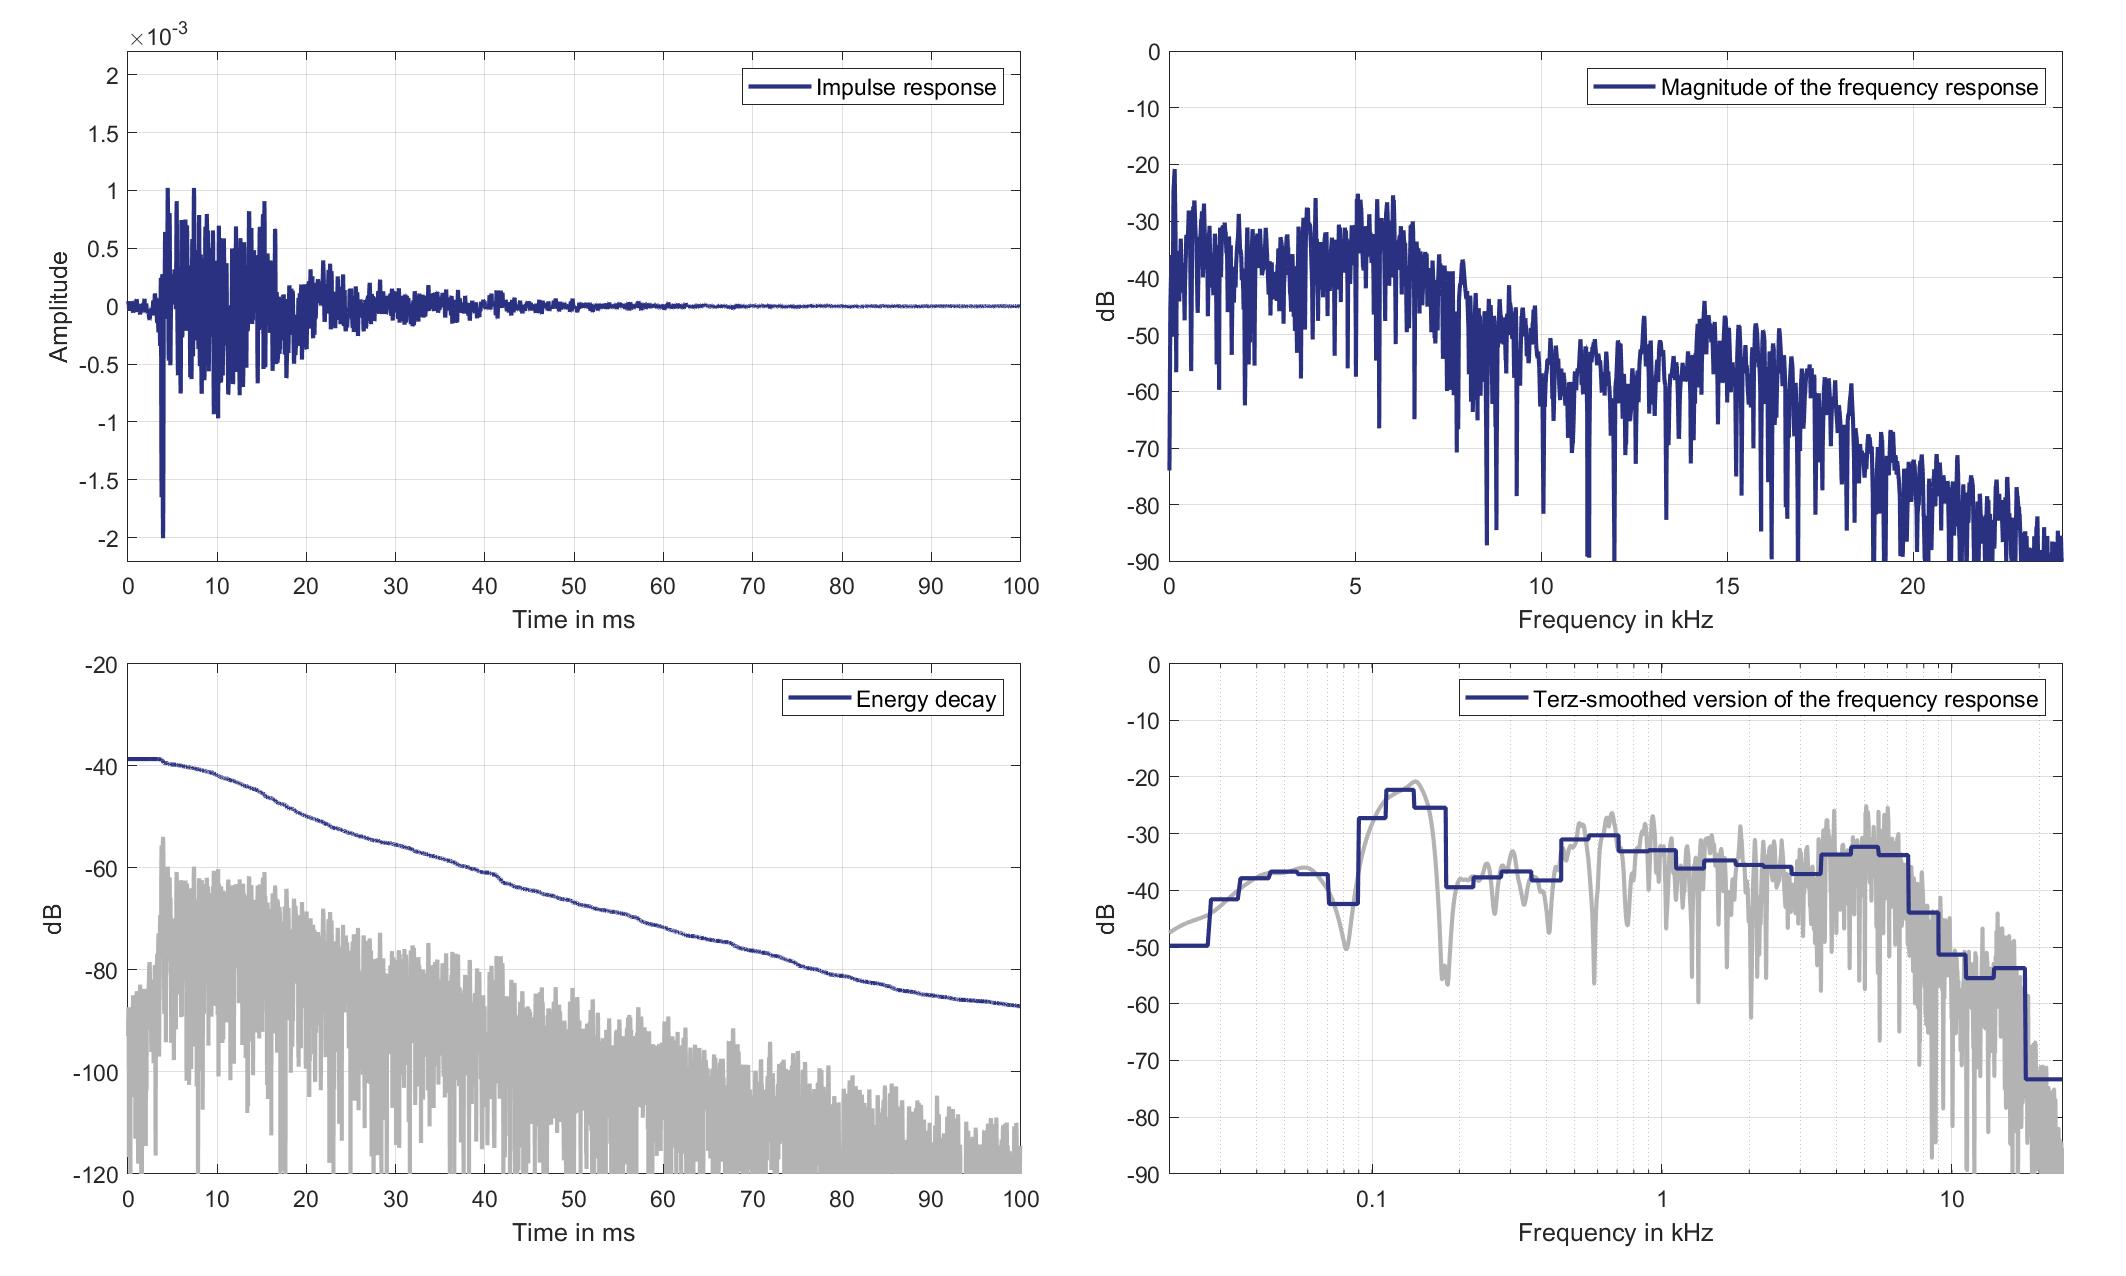
Download impulse response (in ".fir" format).
In the download section you can download all impulse response files as well as format explanation and Matlab as well as Python code examples for loading fir files.
Mic. 8
Mouth Loudspeaker of Zone 2 (Lsp. 13) to Standard Car Microphone 8 (Mic. 8)
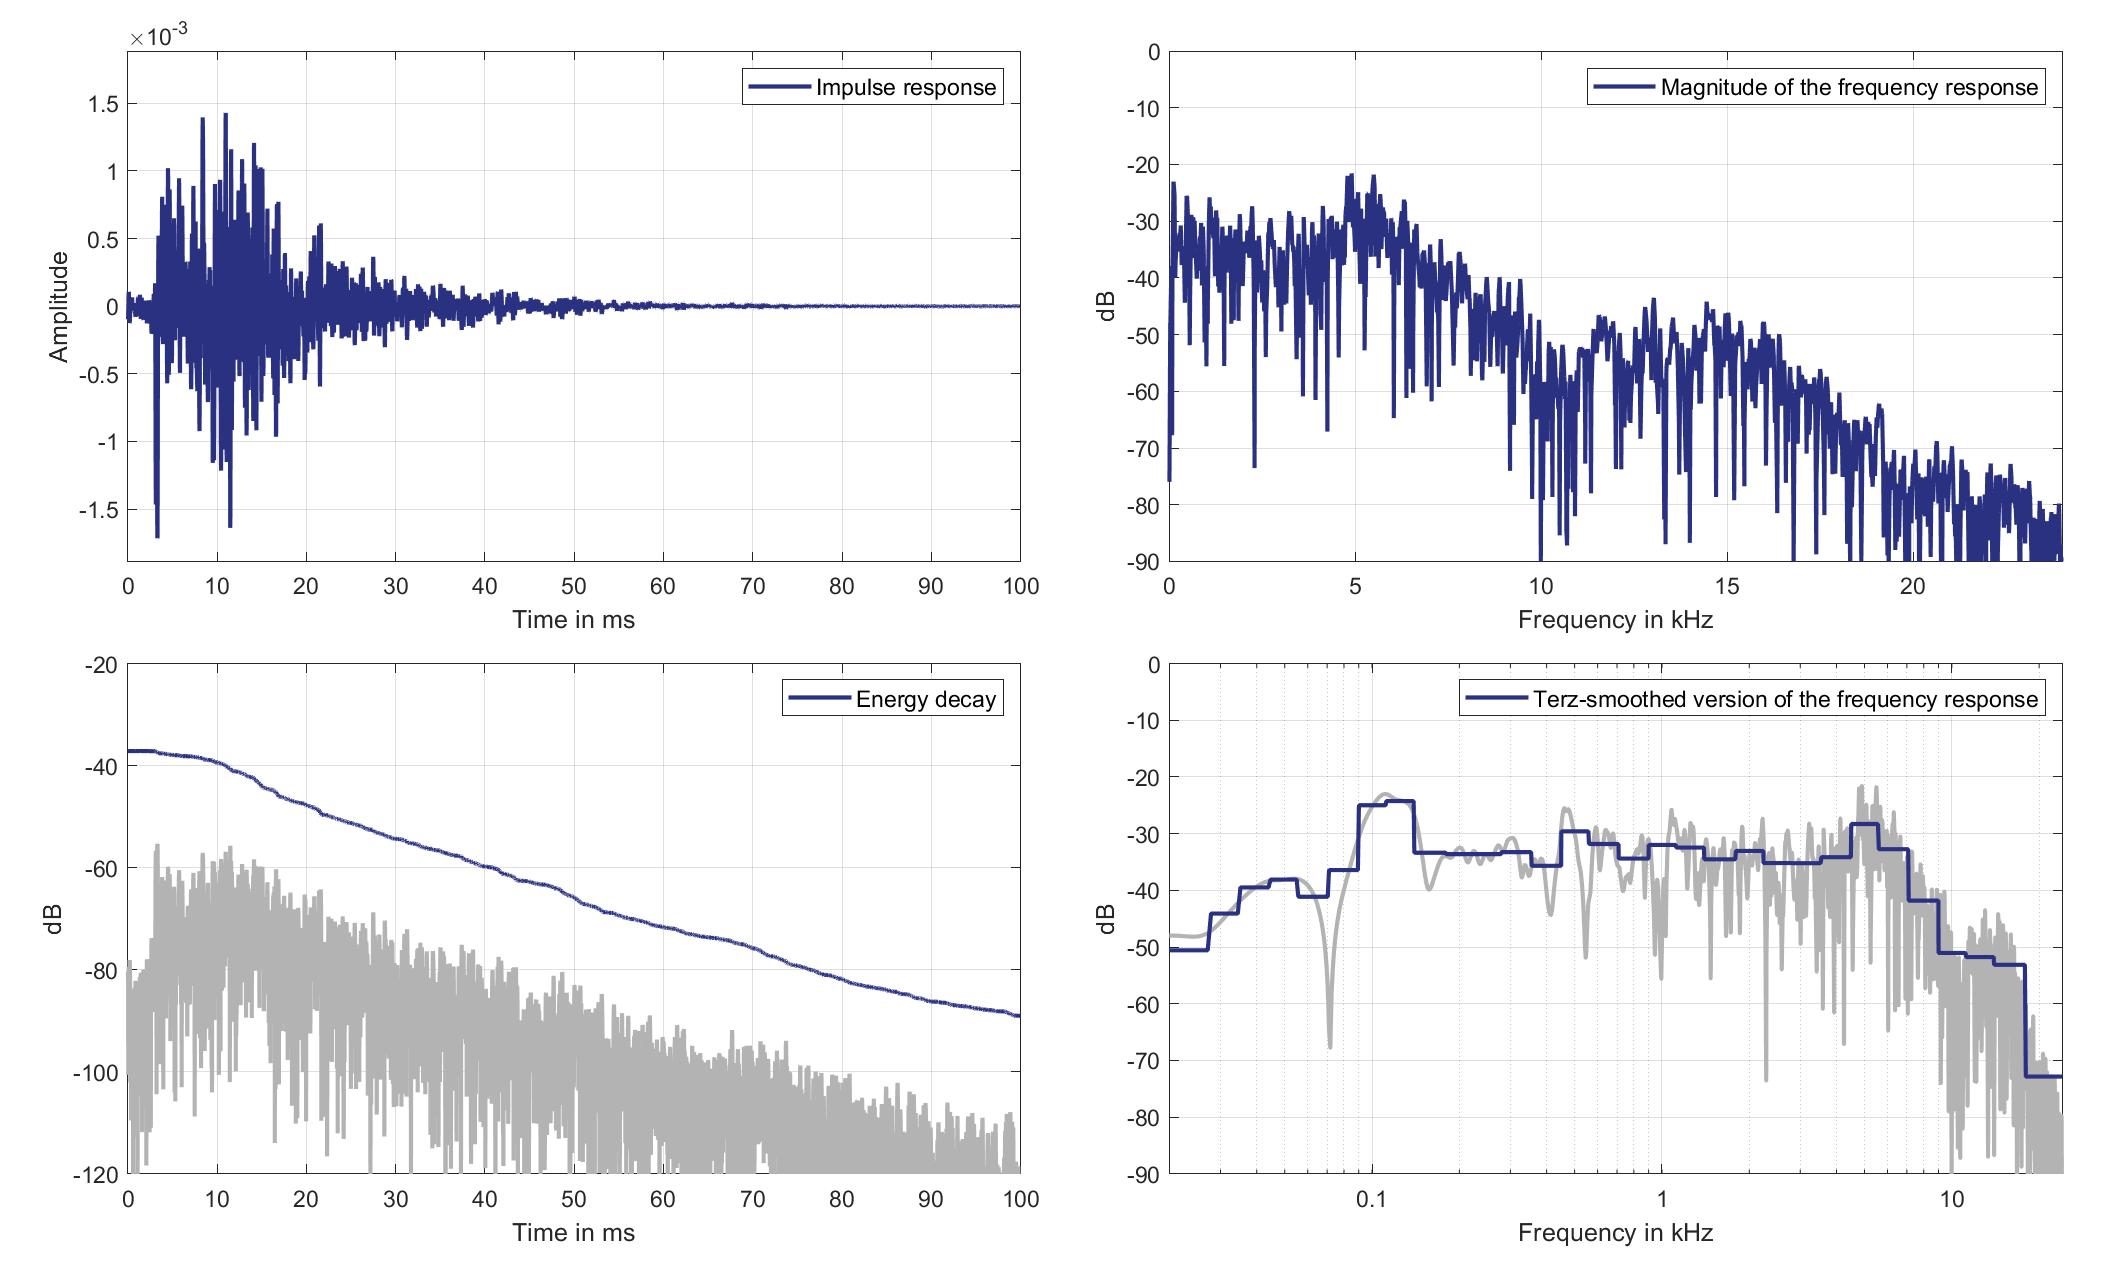
Download impulse response (in ".fir" format).
In the download section you can download all impulse response files as well as format explanation and Matlab as well as Python code examples for loading fir files.
Mic. 9
Mouth Loudspeaker of Zone 2 (Lsp. 13) to Standard Car Microphone 9 (Mic. 9)
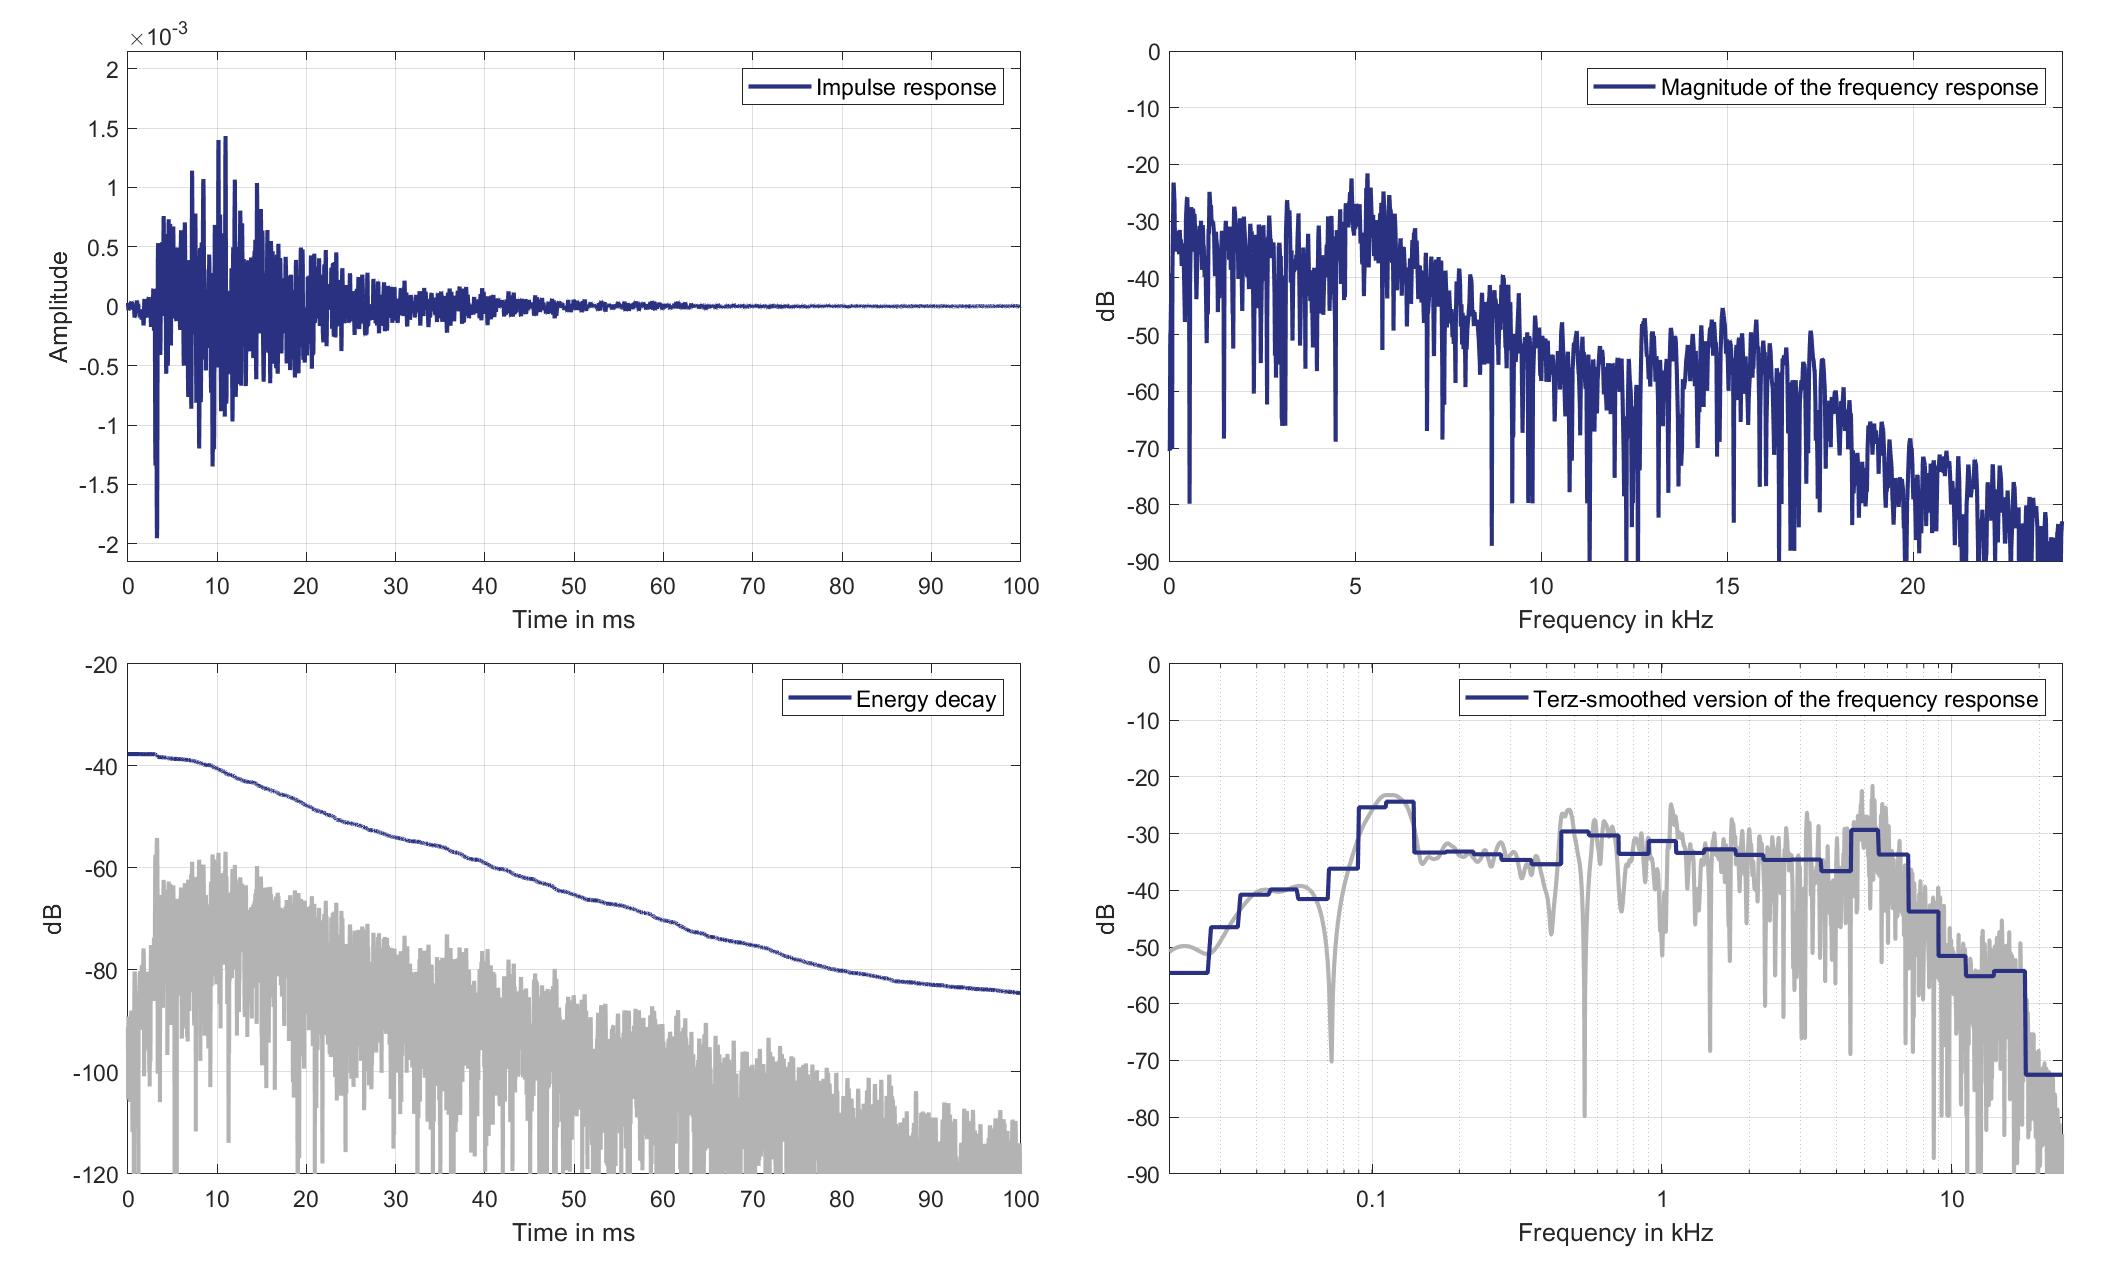
Download impulse response (in ".fir" format).
In the download section you can download all impulse response files as well as format explanation and Matlab as well as Python code examples for loading fir files.
Mic. 10
Mouth Loudspeaker of Zone 2 (Lsp. 13) to Standard Car Microphone 10 (Mic. 10)
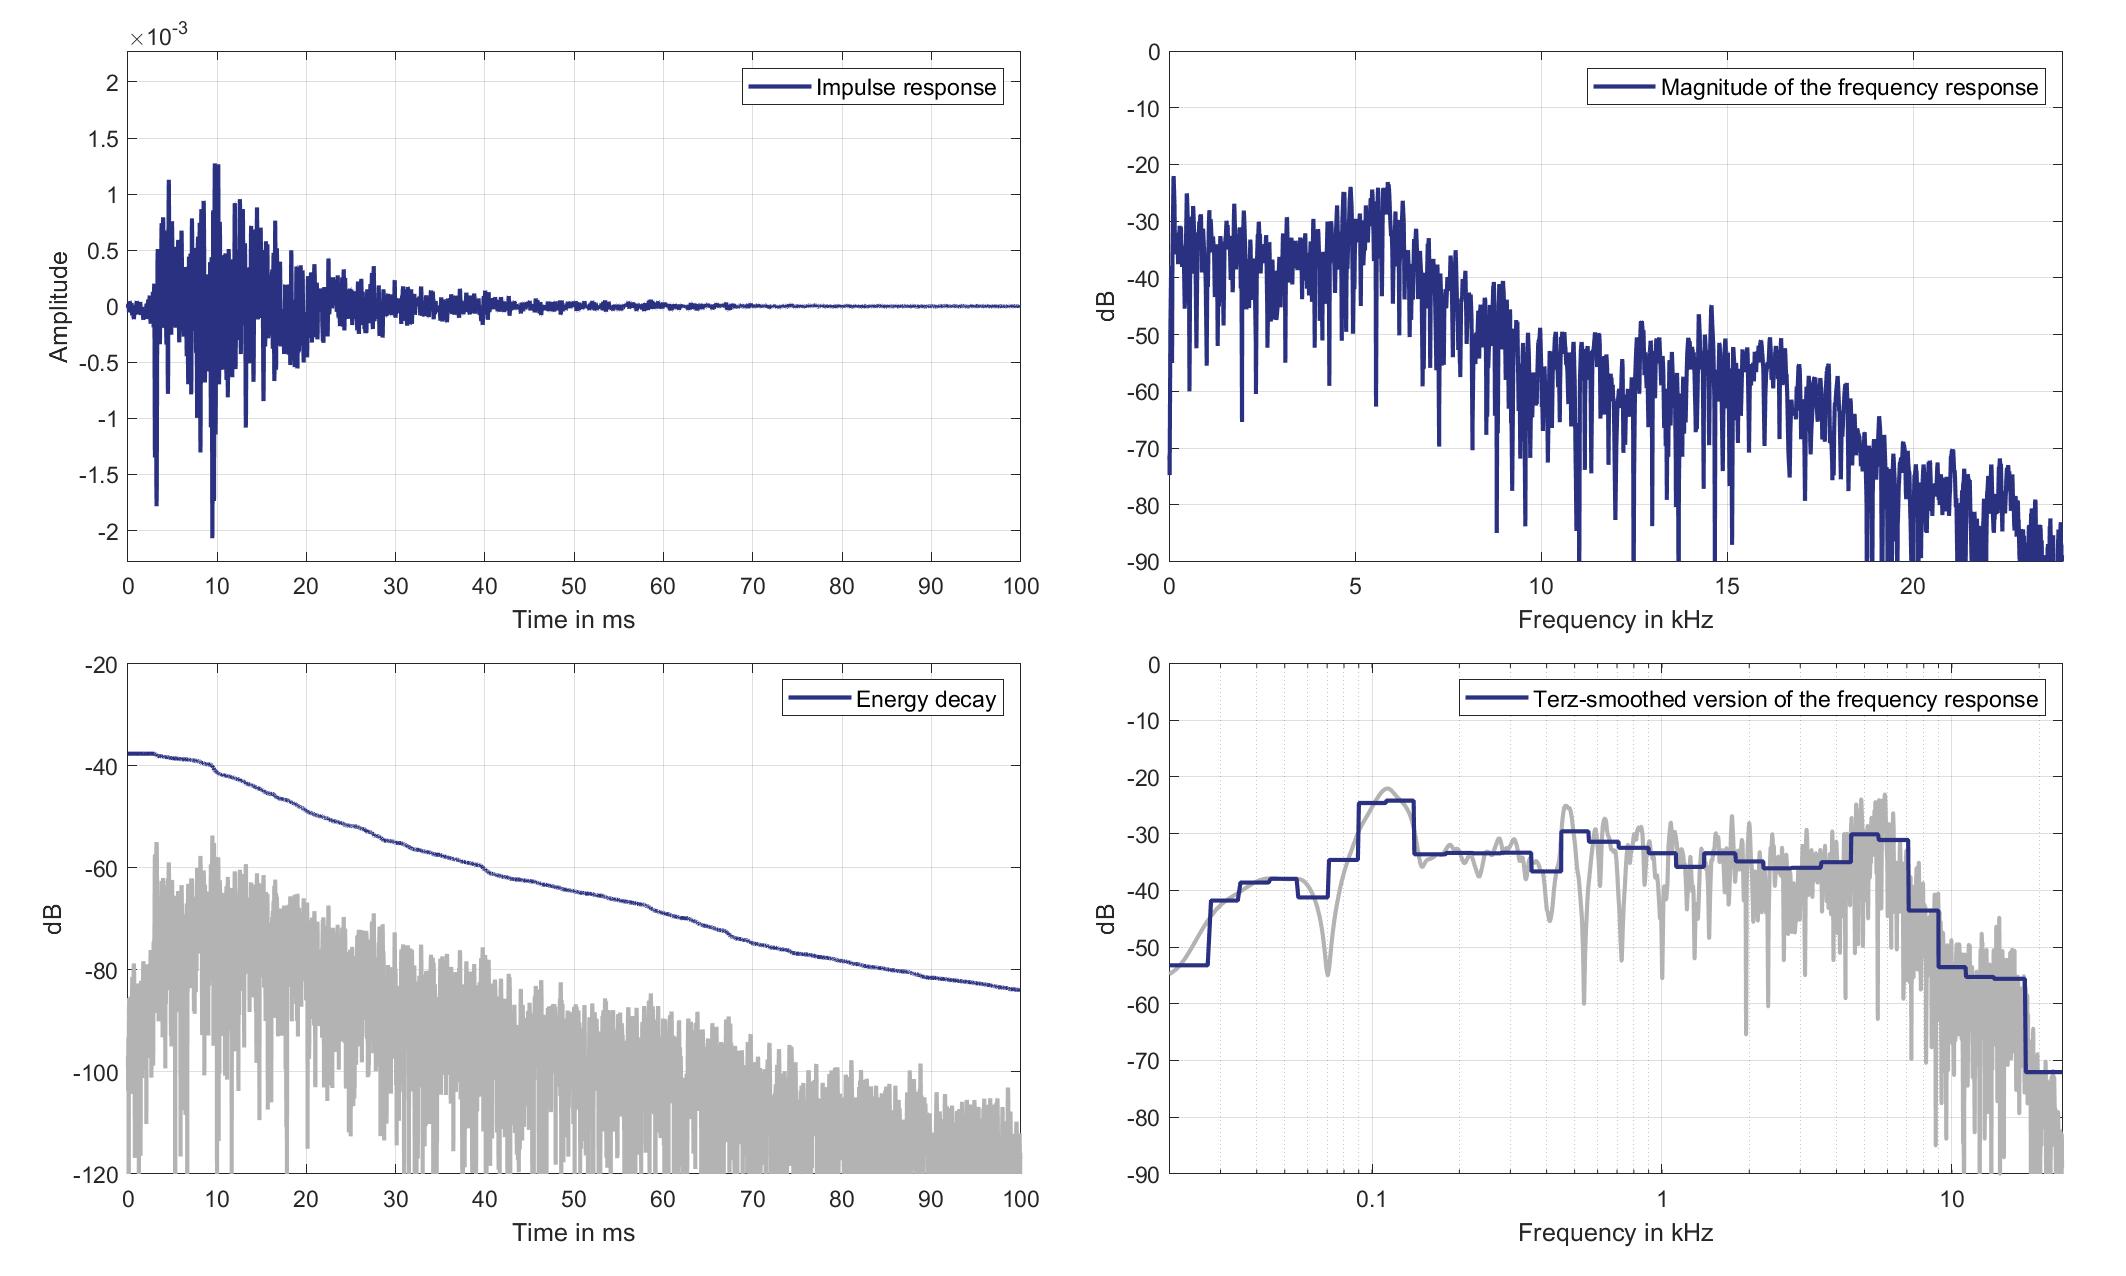
Download impulse response (in ".fir" format).
In the download section you can download all impulse response files as well as format explanation and Matlab as well as Python code examples for loading fir files.
Mic. 11
Mouth Loudspeaker of Zone 2 (Lsp. 13) to Standard Car Microphone 11 (Mic. 11)

Download impulse response (in ".fir" format).
In the download section you can download all impulse response files as well as format explanation and Matlab as well as Python code examples for loading fir files.
Mic. 12
Mouth Loudspeaker of Zone 2 (Lsp. 13) to Standard Car Microphone 12 (Mic. 12)
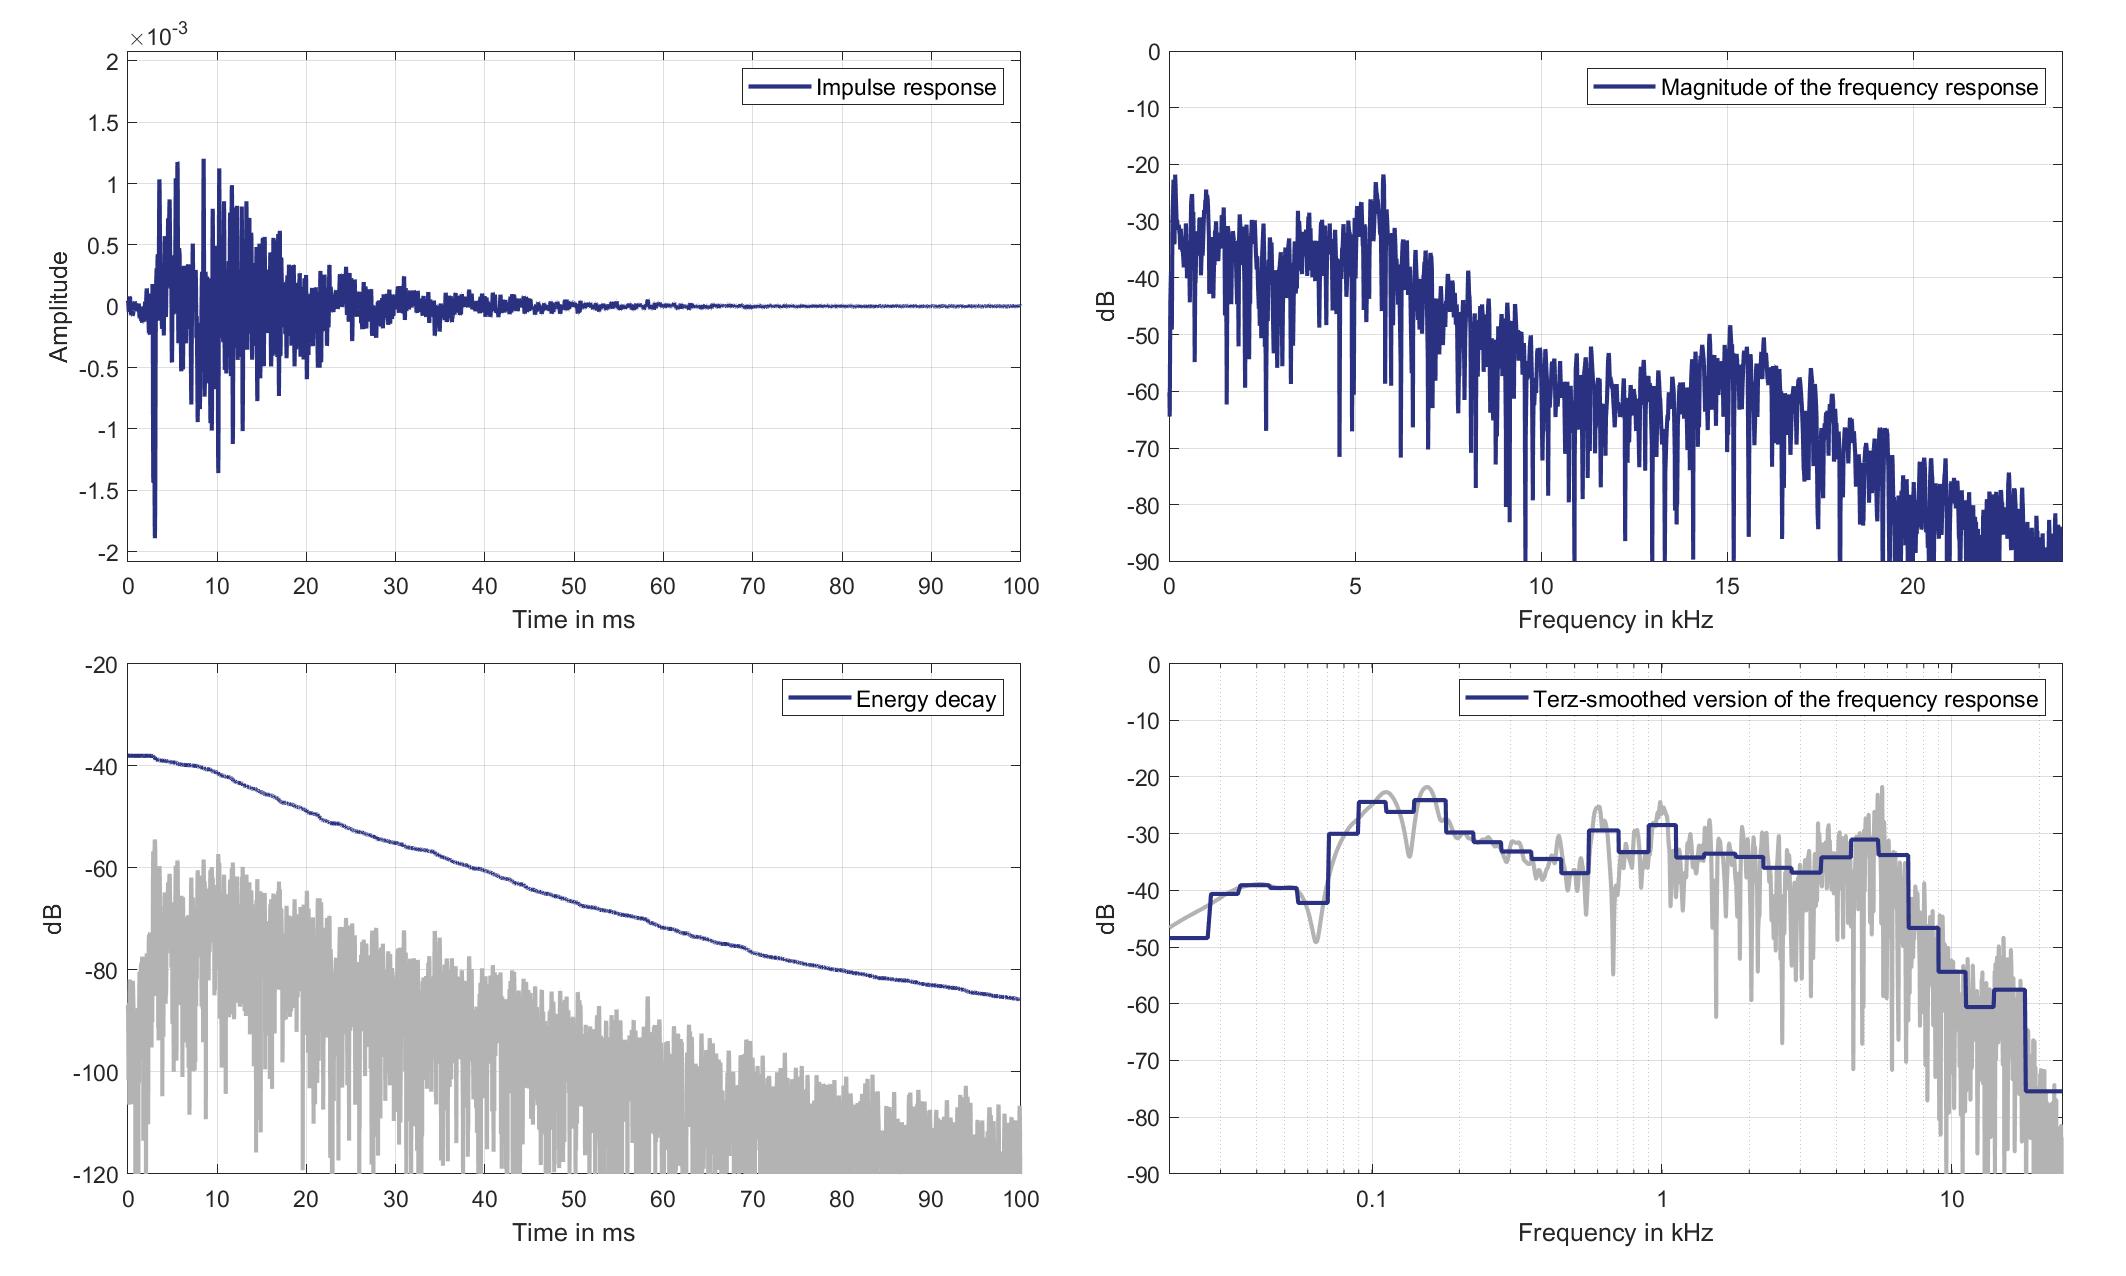
Download impulse response (in ".fir" format).
In the download section you can download all impulse response files as well as format explanation and Matlab as well as Python code examples for loading fir files.
Mic. 13
Mouth Loudspeaker of Zone 2 (Lsp. 13) to Standard Car Microphone 13 (Mic. 13)
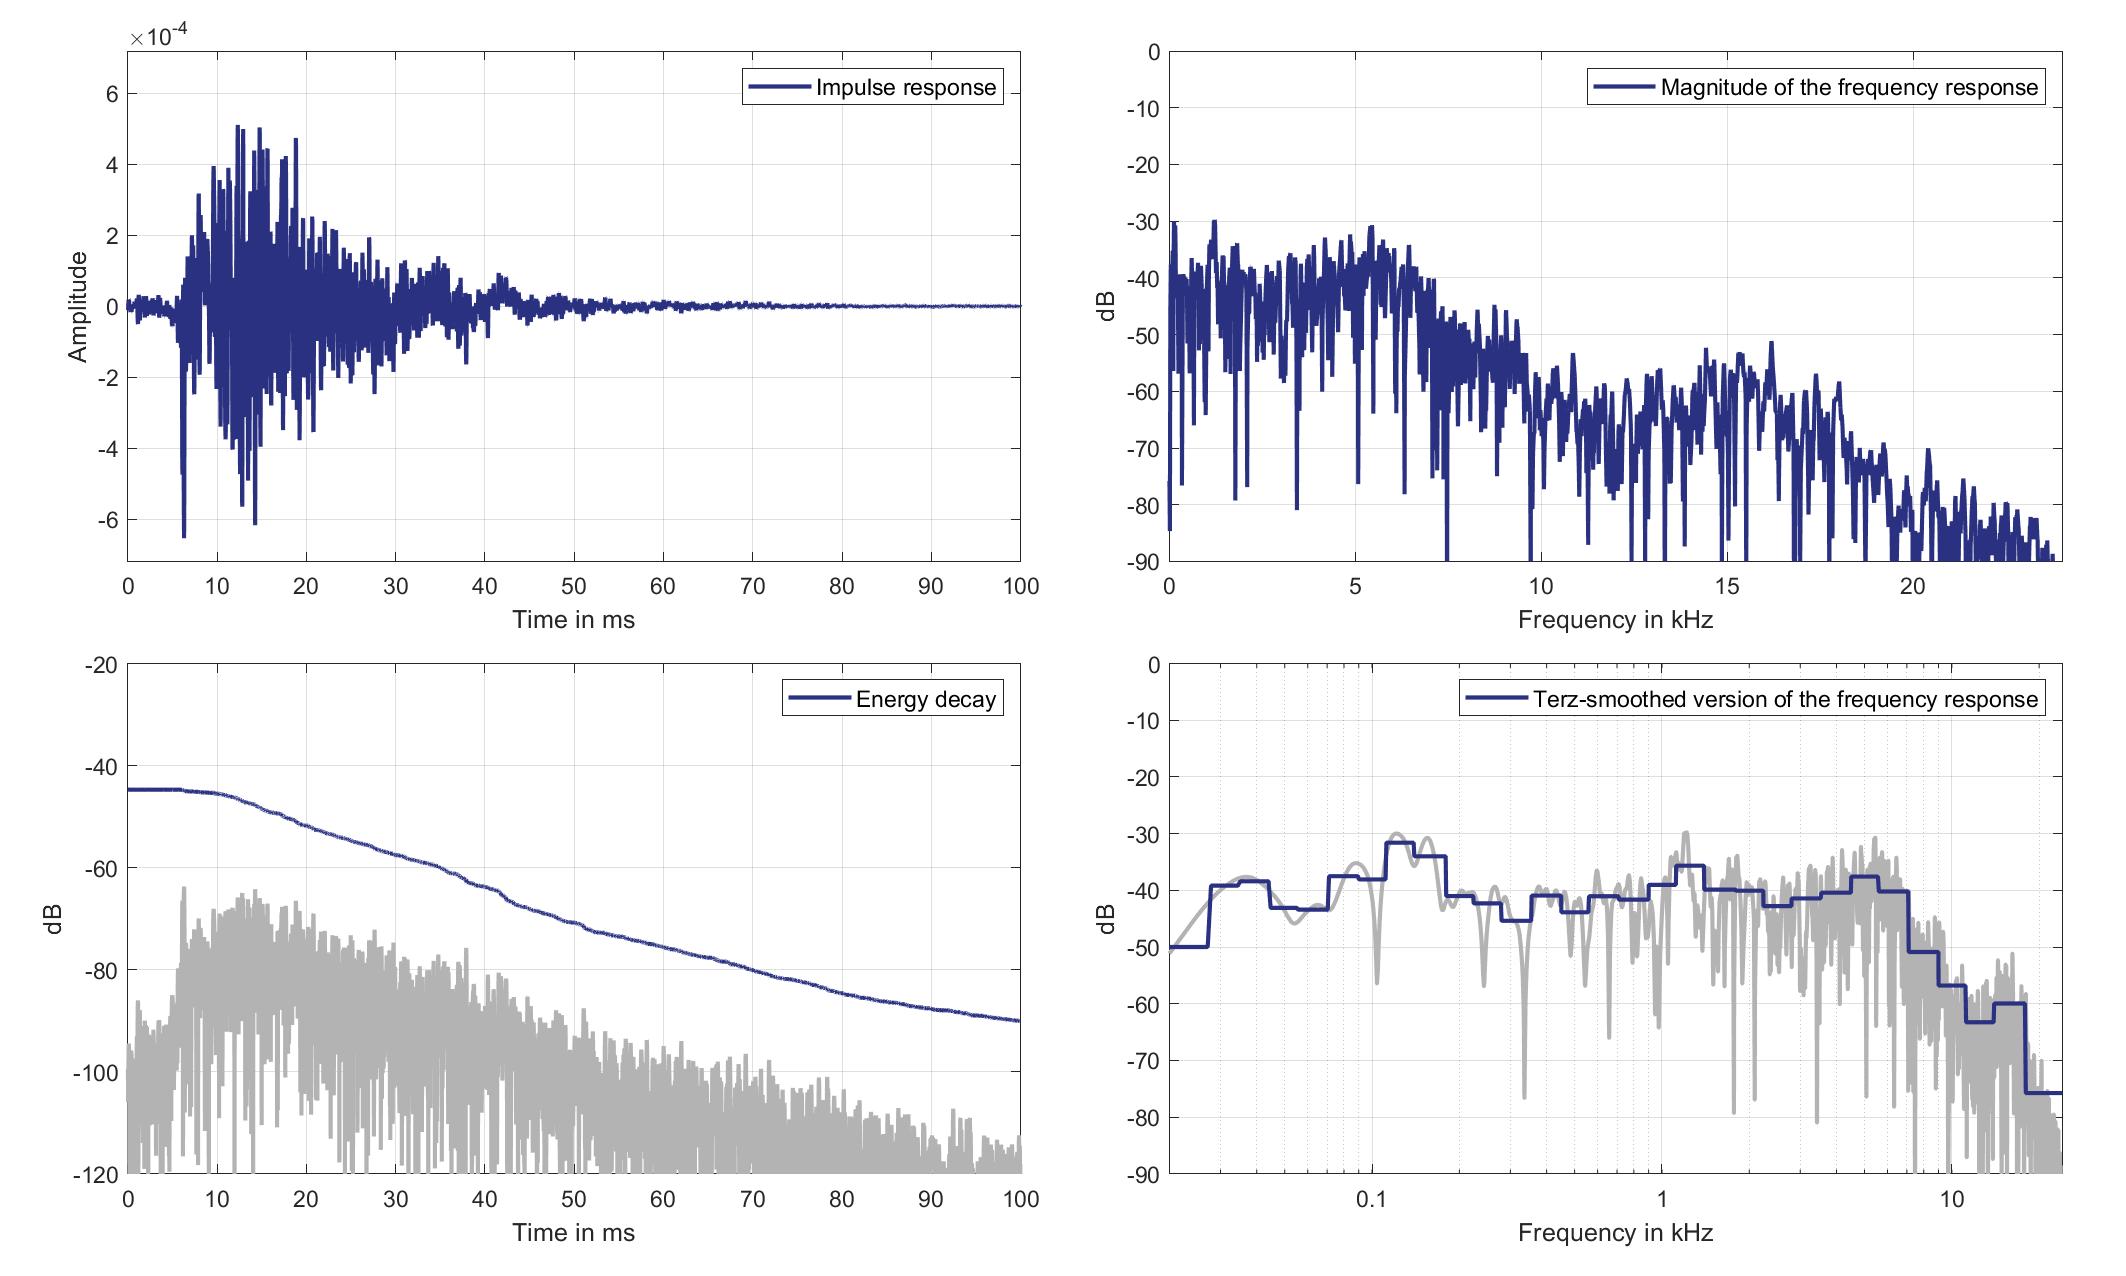
Download impulse response (in ".fir" format).
In the download section you can download all impulse response files as well as format explanation and Matlab as well as Python code examples for loading fir files.
Mic. 14
Mouth Loudspeaker of Zone 2 (Lsp. 13) to Standard Car Microphone 14 (Mic. 14)
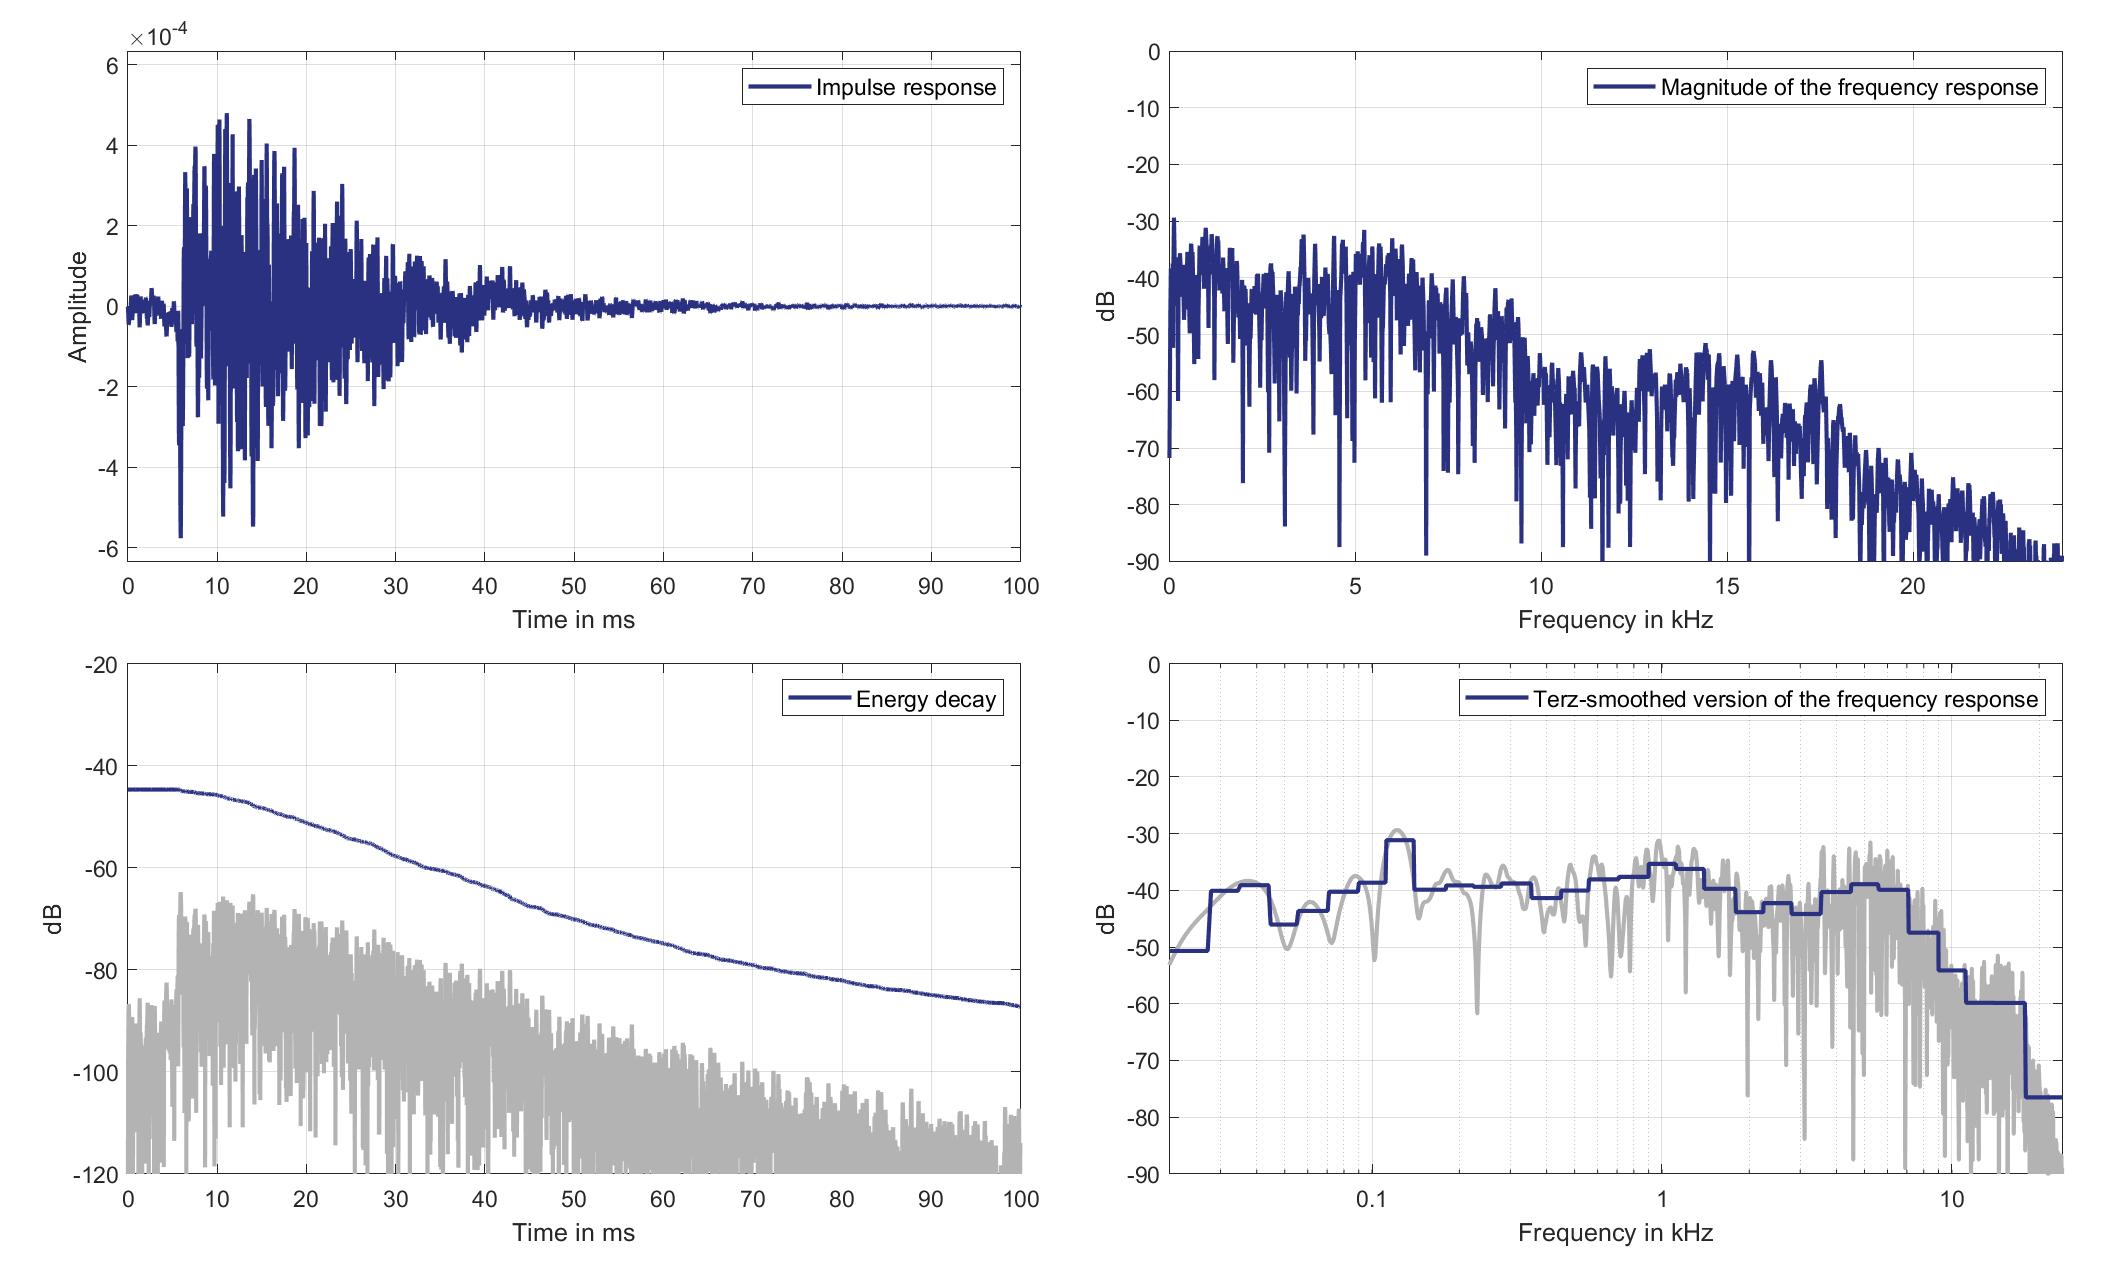
Download impulse response (in ".fir" format).
In the download section you can download all impulse response files as well as format explanation and Matlab as well as Python code examples for loading fir files.
Mic. 15
Mouth Loudspeaker of Zone 2 (Lsp. 13) to Standard Car Microphone 15 (Mic. 15)
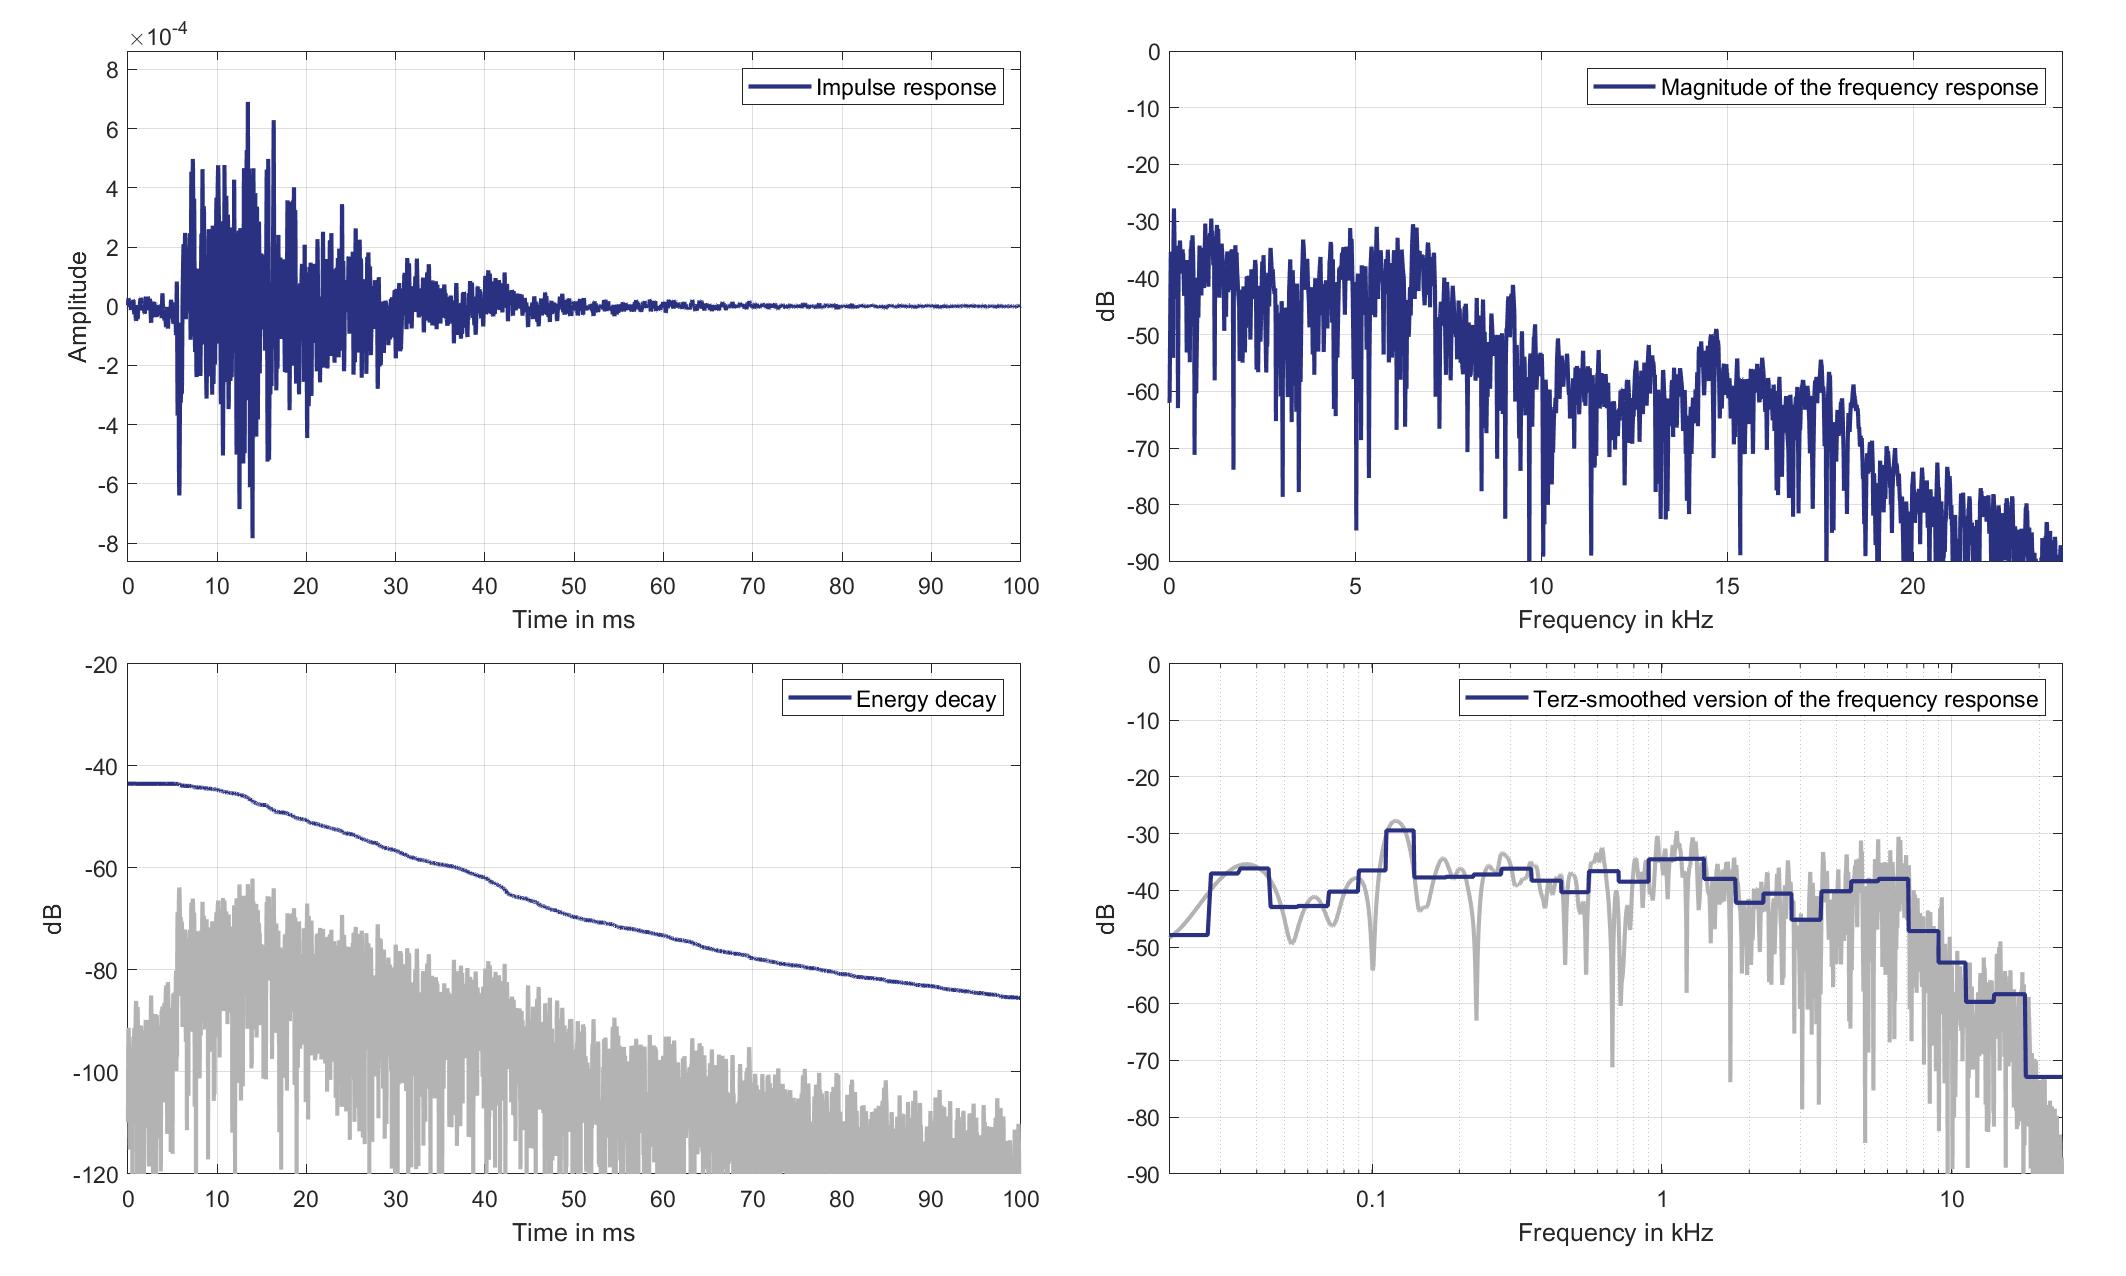
Download impulse response (in ".fir" format).
In the download section you can download all impulse response files as well as format explanation and Matlab as well as Python code examples for loading fir files.
Mic. 16
Mouth Loudspeaker of Zone 2 (Lsp. 13) to Standard Car Microphone 16 (Mic. 16)
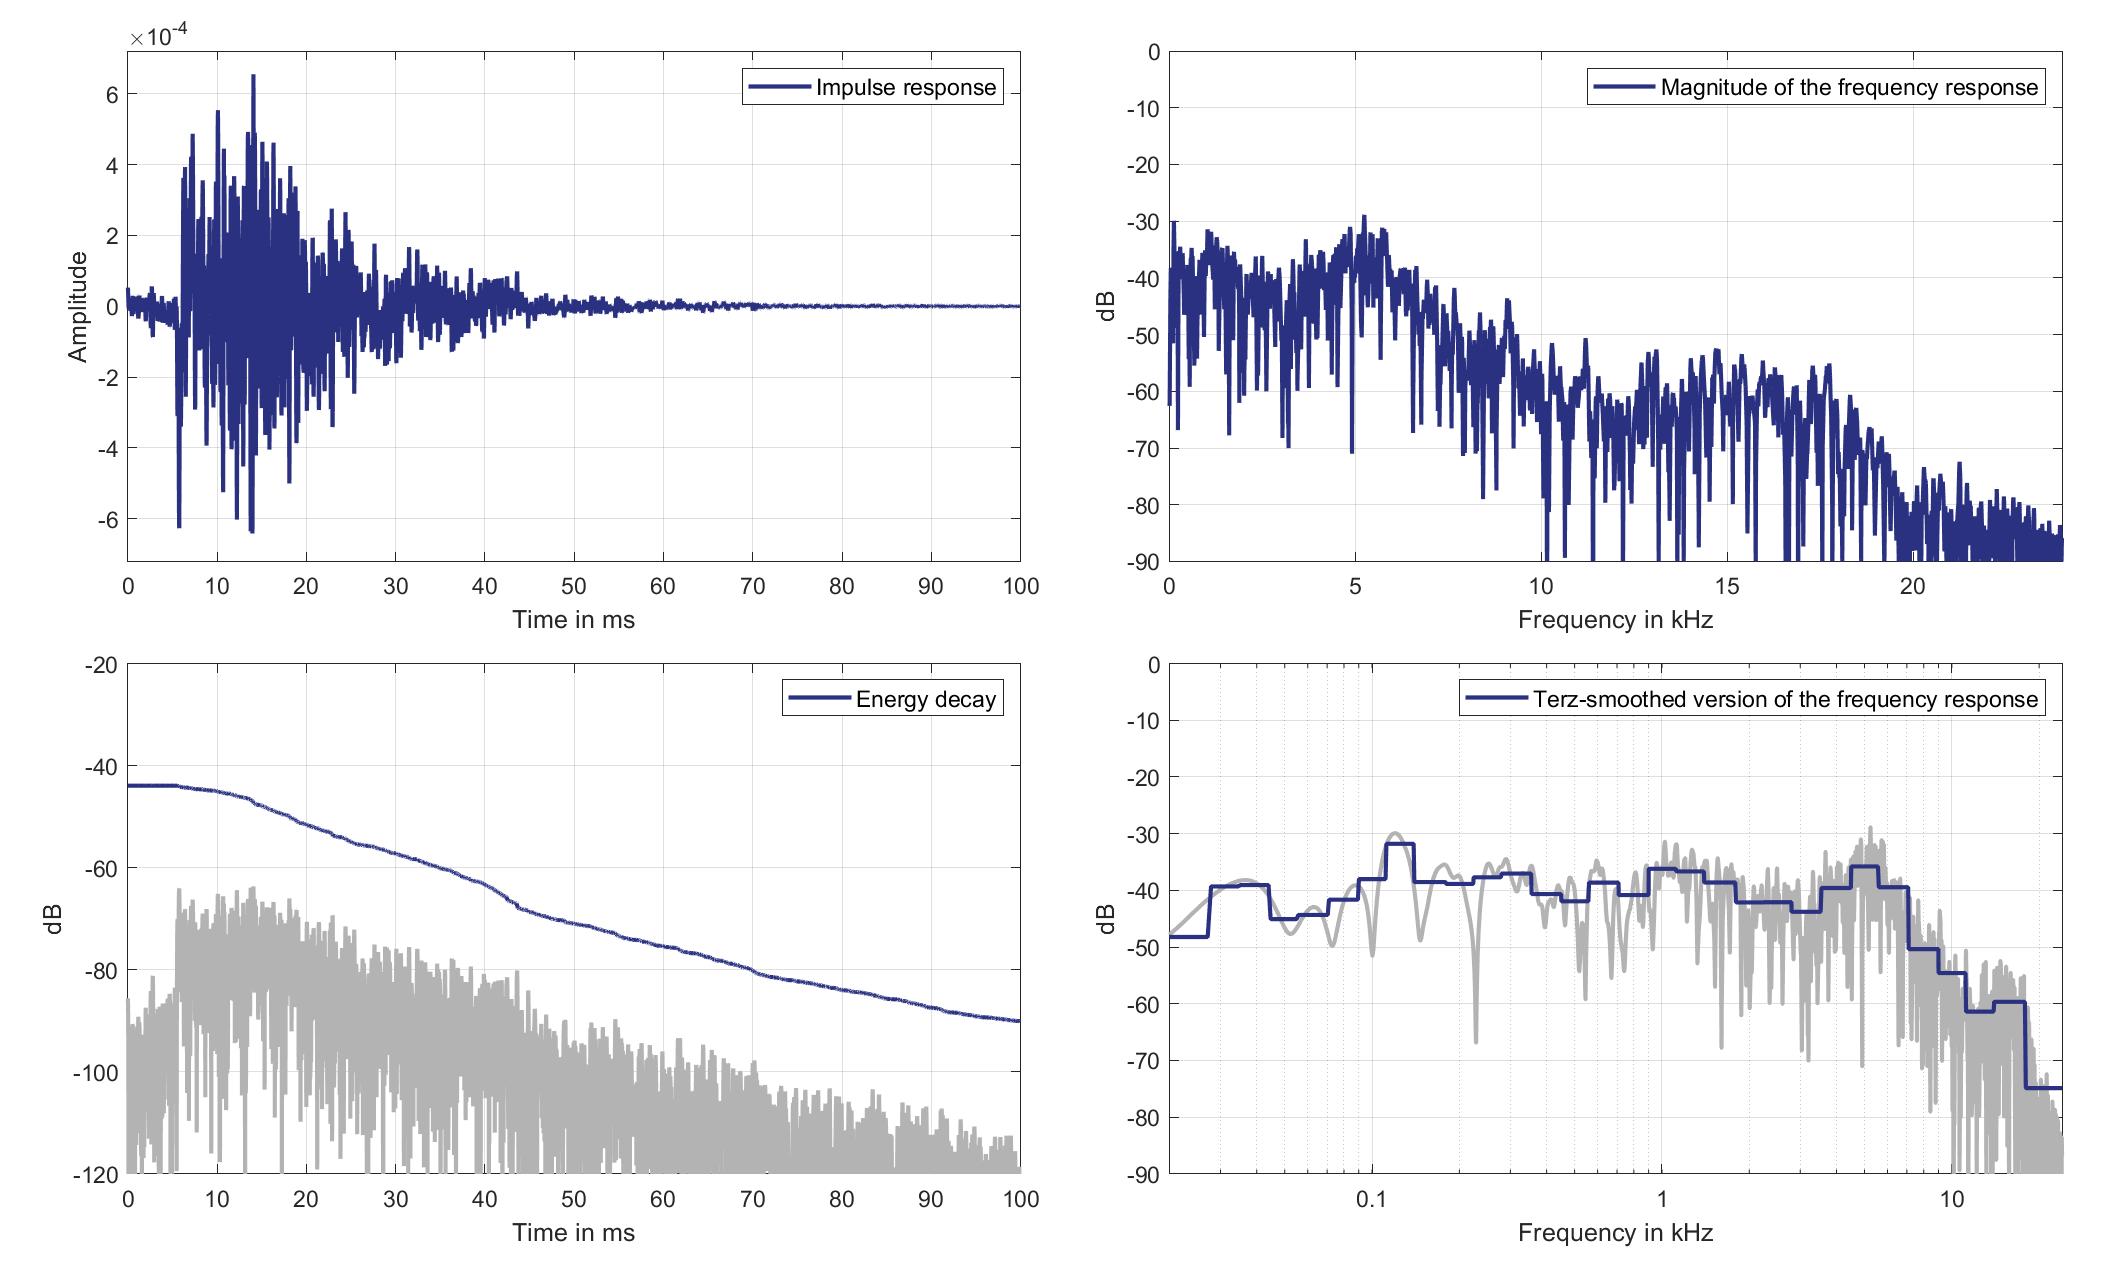
Download impulse response (in ".fir" format).
In the download section you can download all impulse response files as well as format explanation and Matlab as well as Python code examples for loading fir files.
Mic. 17
Mouth Loudspeaker of Zone 2 (Lsp. 13) to Standard Car Microphone 17 (Mic. 17)
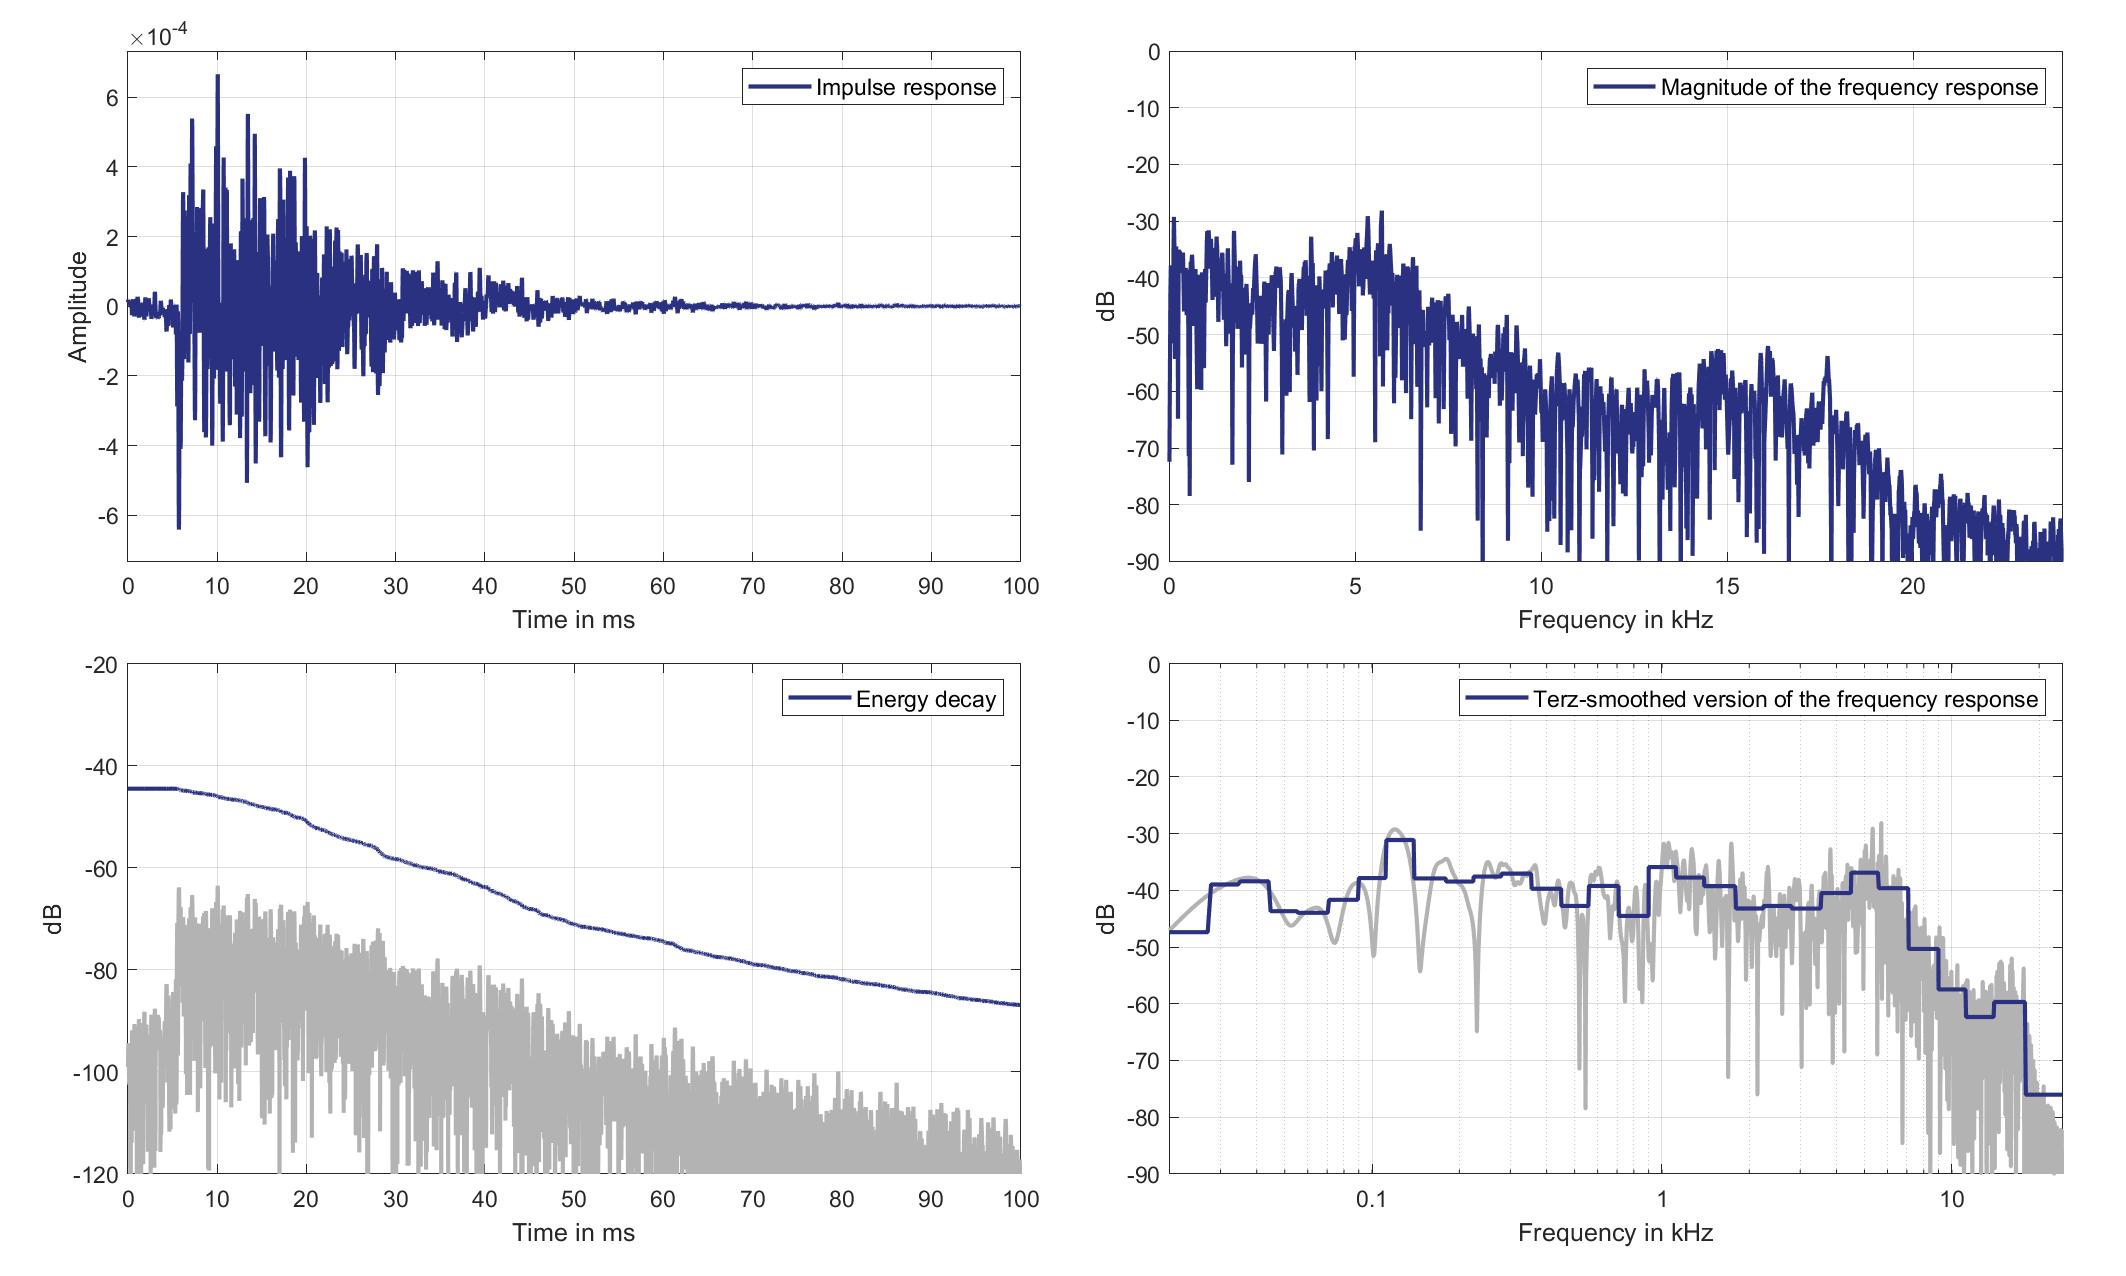
Download impulse response (in ".fir" format).
In the download section you can download all impulse response files as well as format explanation and Matlab as well as Python code examples for loading fir files.
Mic. 18
Mouth Loudspeaker of Zone 2 (Lsp. 13) to Standard Car Microphone 18 (Mic. 18)
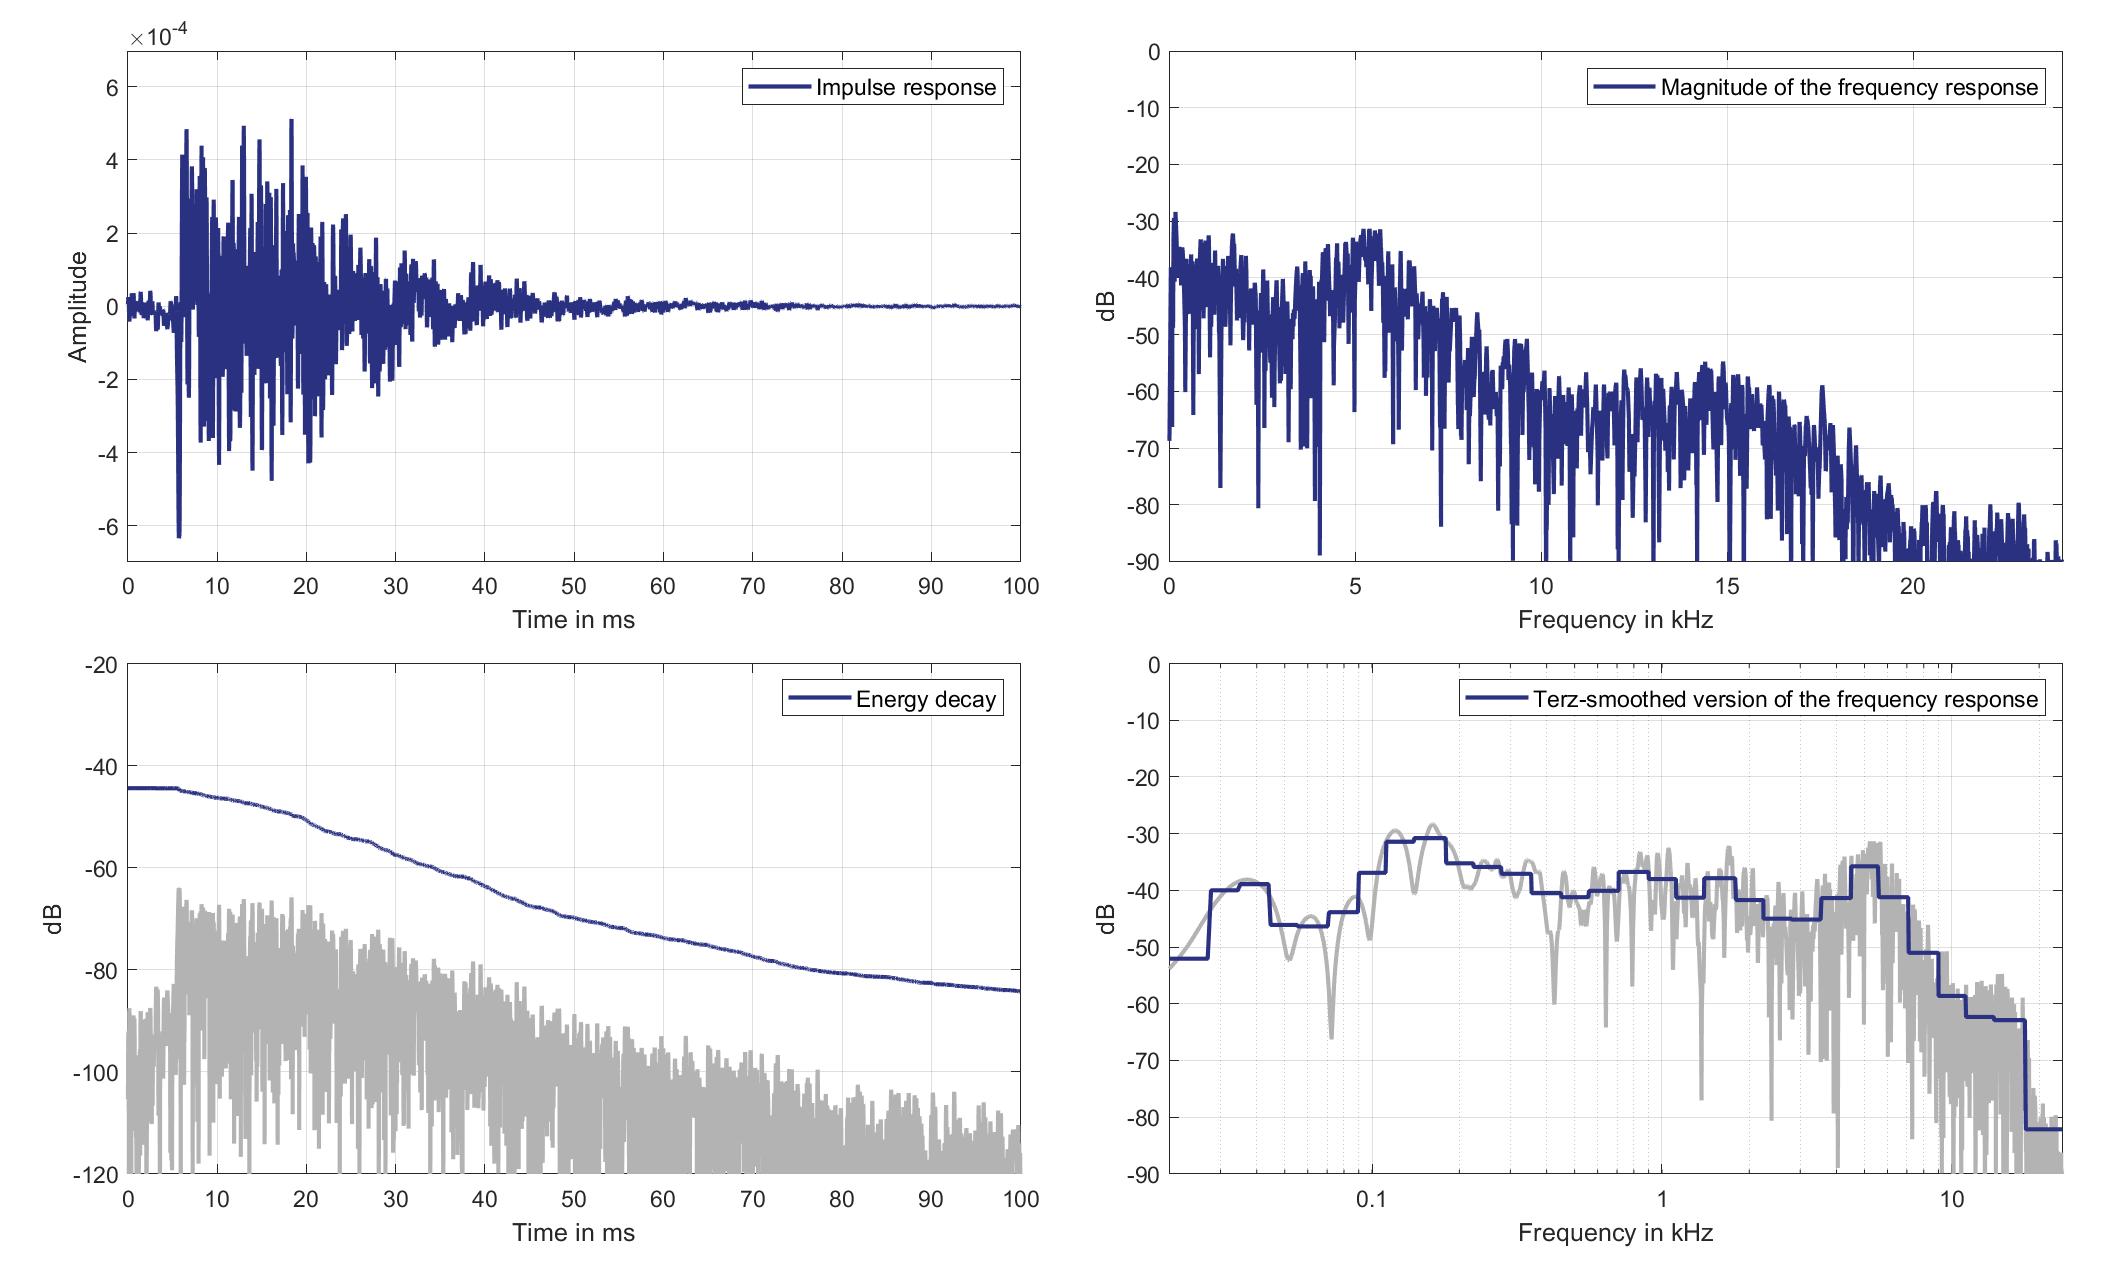
Download impulse response (in ".fir" format).
In the download section you can download all impulse response files as well as format explanation and Matlab as well as Python code examples for loading fir files.
Lsp. 14
Mic. 0
Mouth Loudspeaker of Zone 3 (Lsp. 14) to Standard Car Microphone 0 (Mic. 0)
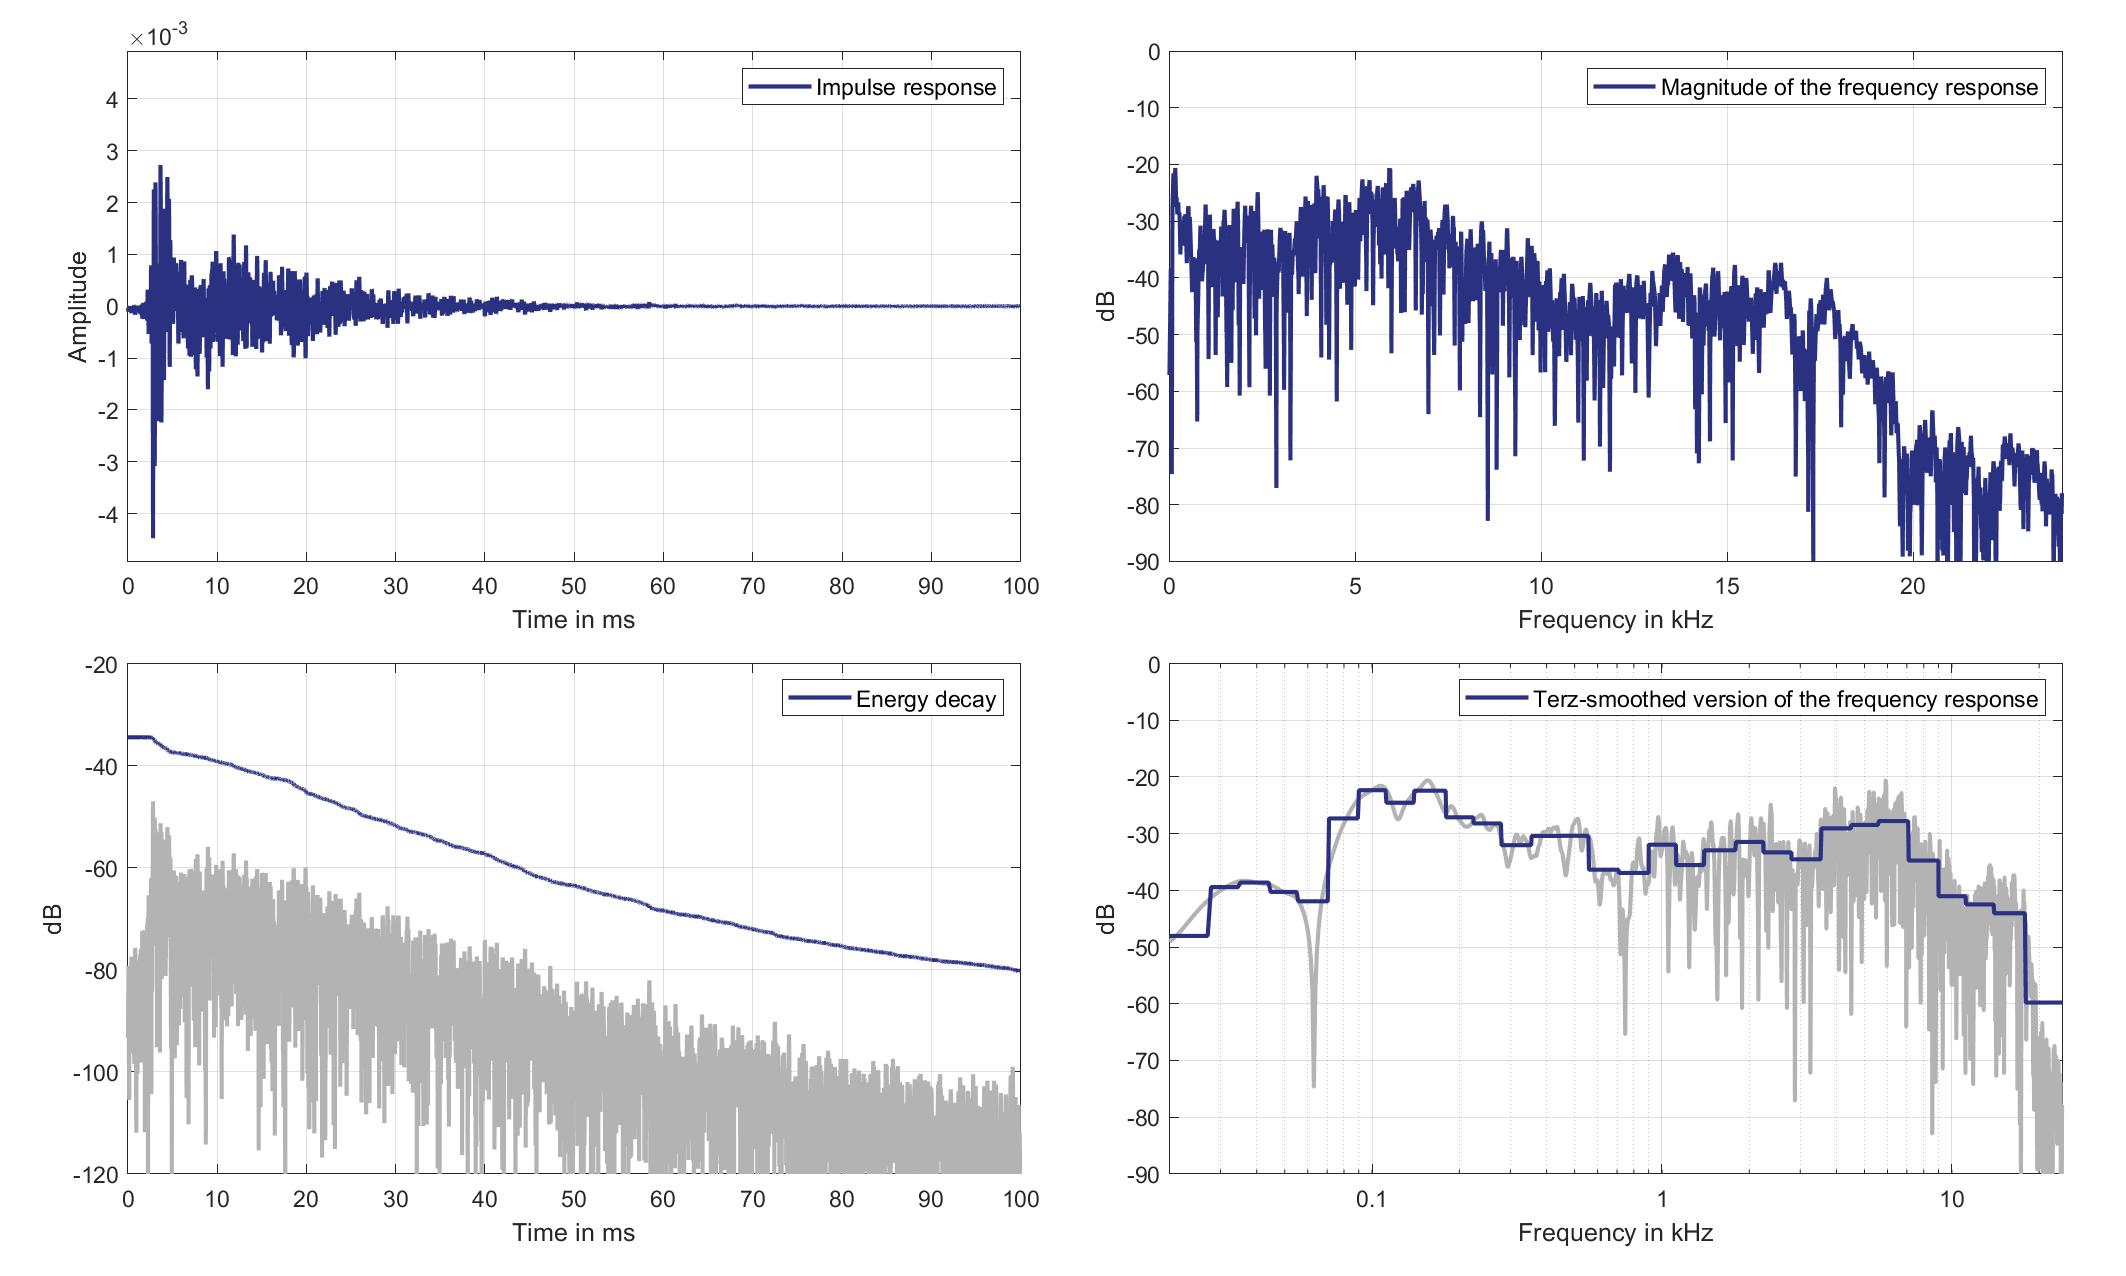
Download impulse response (in ".fir" format).
In the download section you can download all impulse response files as well as format explanation and Matlab as well as Python code examples for loading fir files.
Mic. 1
Mouth Loudspeaker of Zone 3 (Lsp. 14) to Standard Car Microphone 1 (Mic. 1)
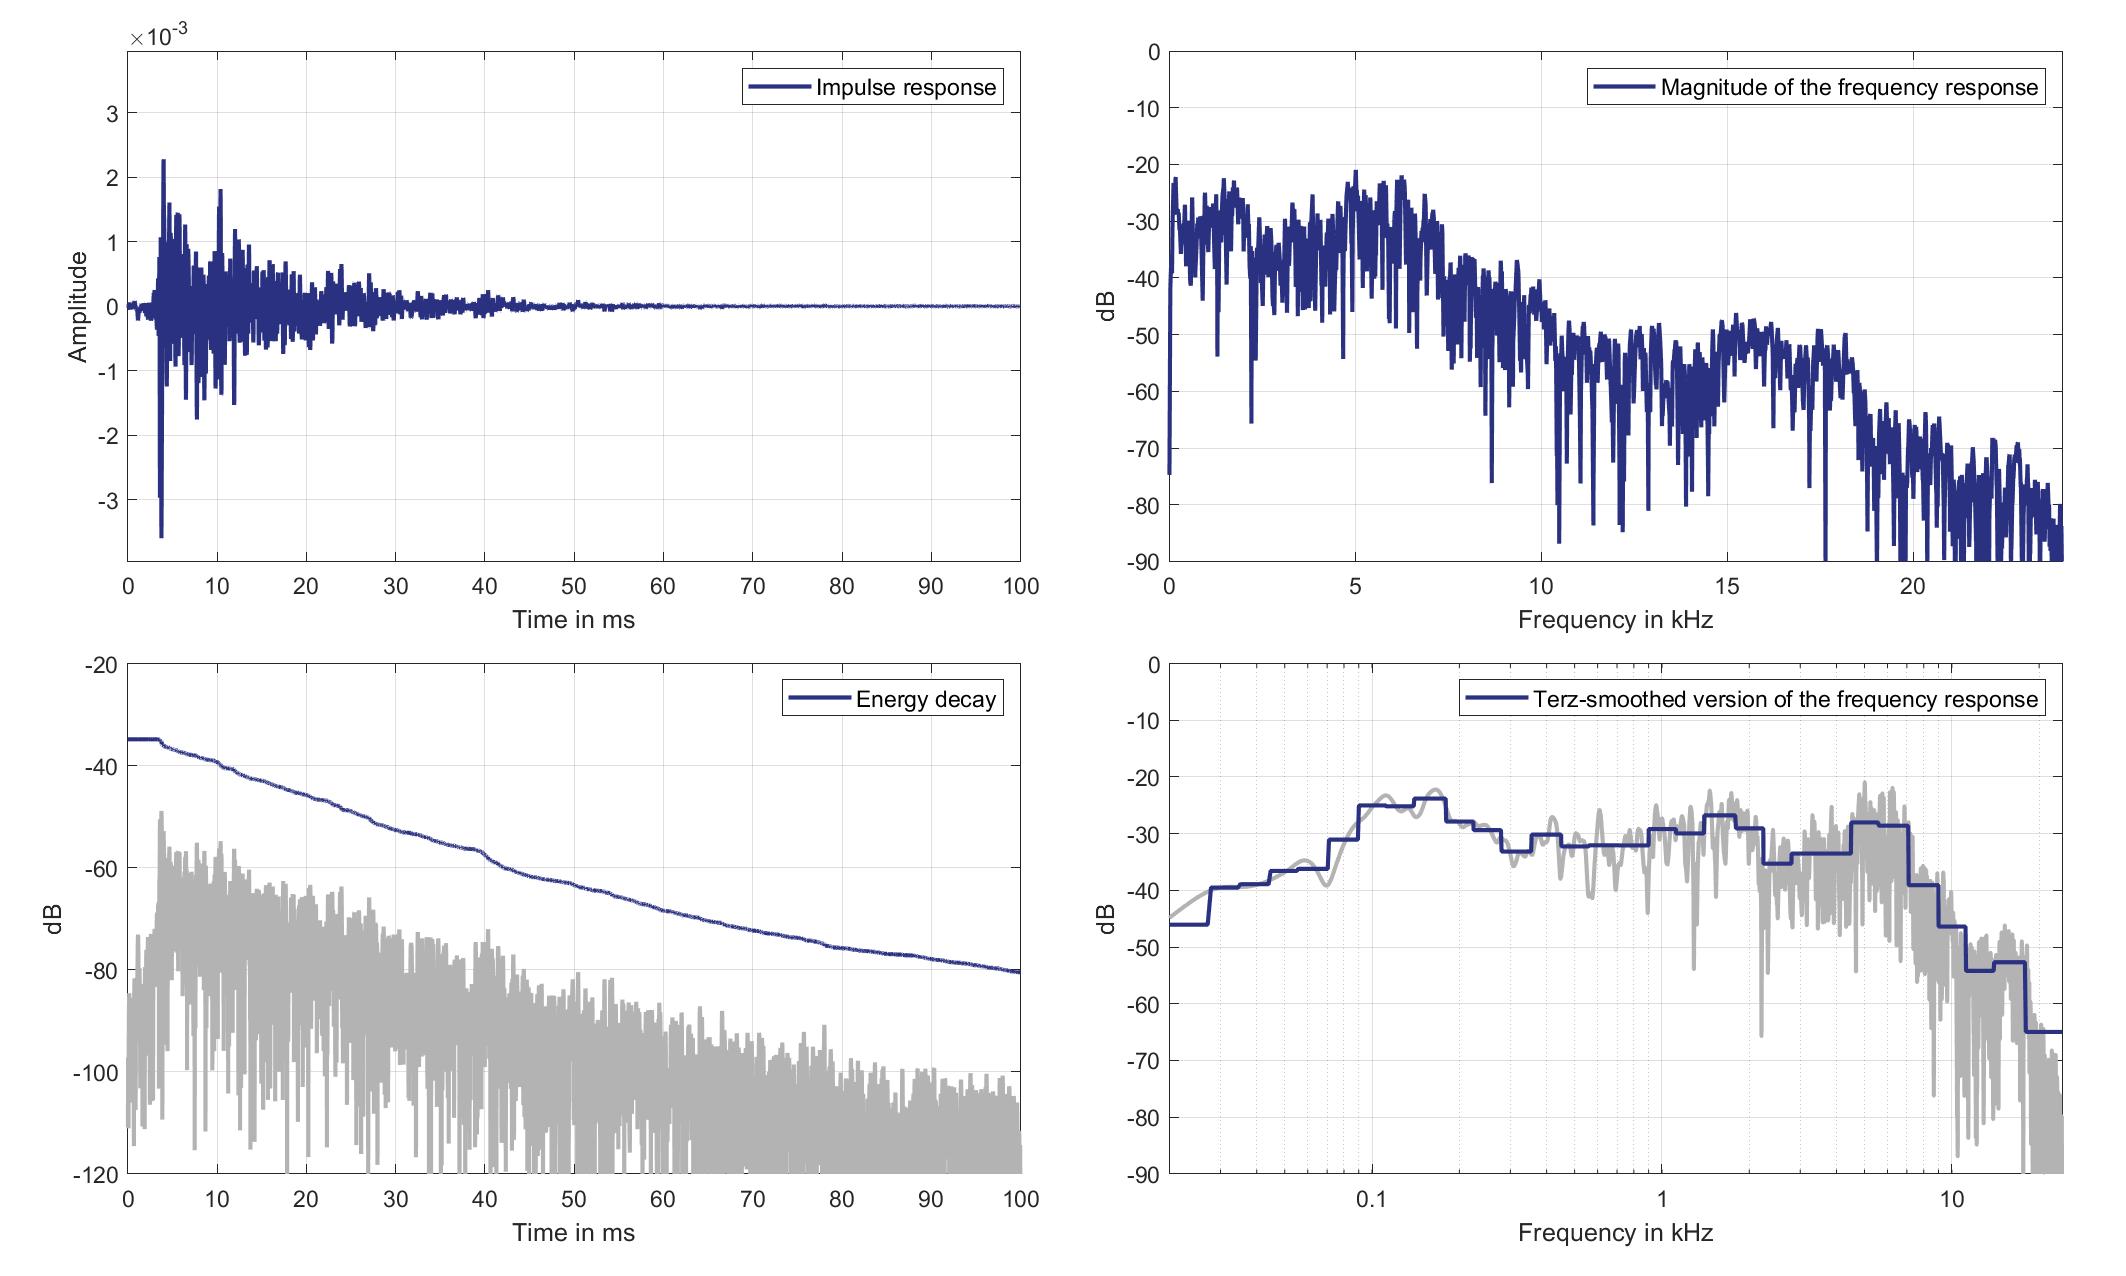
Download impulse response (in ".fir" format).
In the download section you can download all impulse response files as well as format explanation and Matlab as well as Python code examples for loading fir files.
Mic. 2
Mouth Loudspeaker of Zone 3 (Lsp. 14) to Standard Car Microphone 2 (Mic. 2)
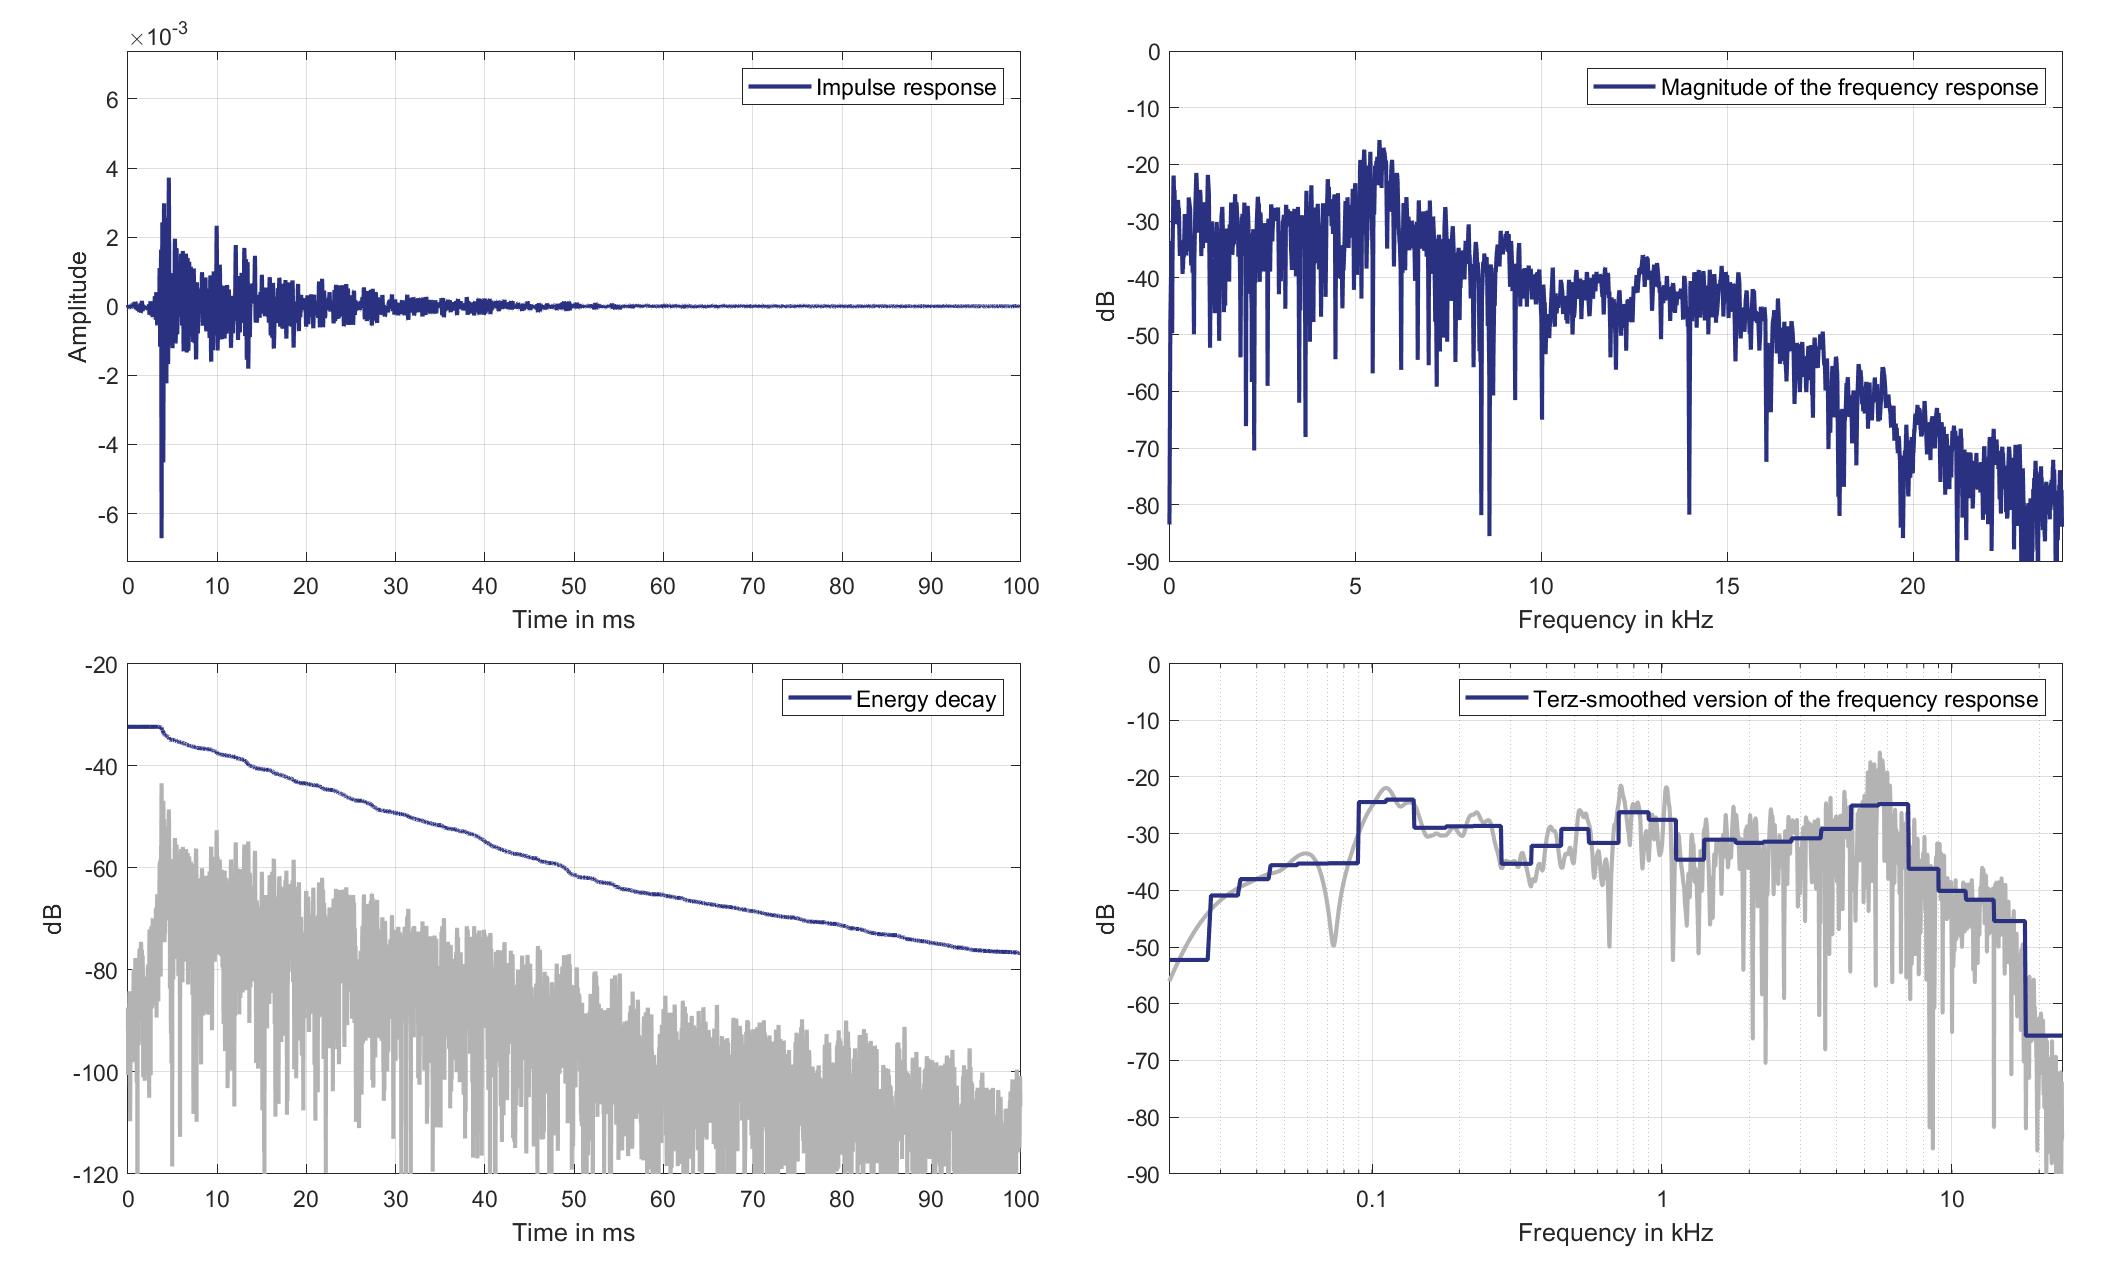
Download impulse response (in ".fir" format).
In the download section you can download all impulse response files as well as format explanation and Matlab as well as Python code examples for loading fir files.
Mic. 3
Mouth Loudspeaker of Zone 3 (Lsp. 14) to Standard Car Microphone 3 (Mic. 3)
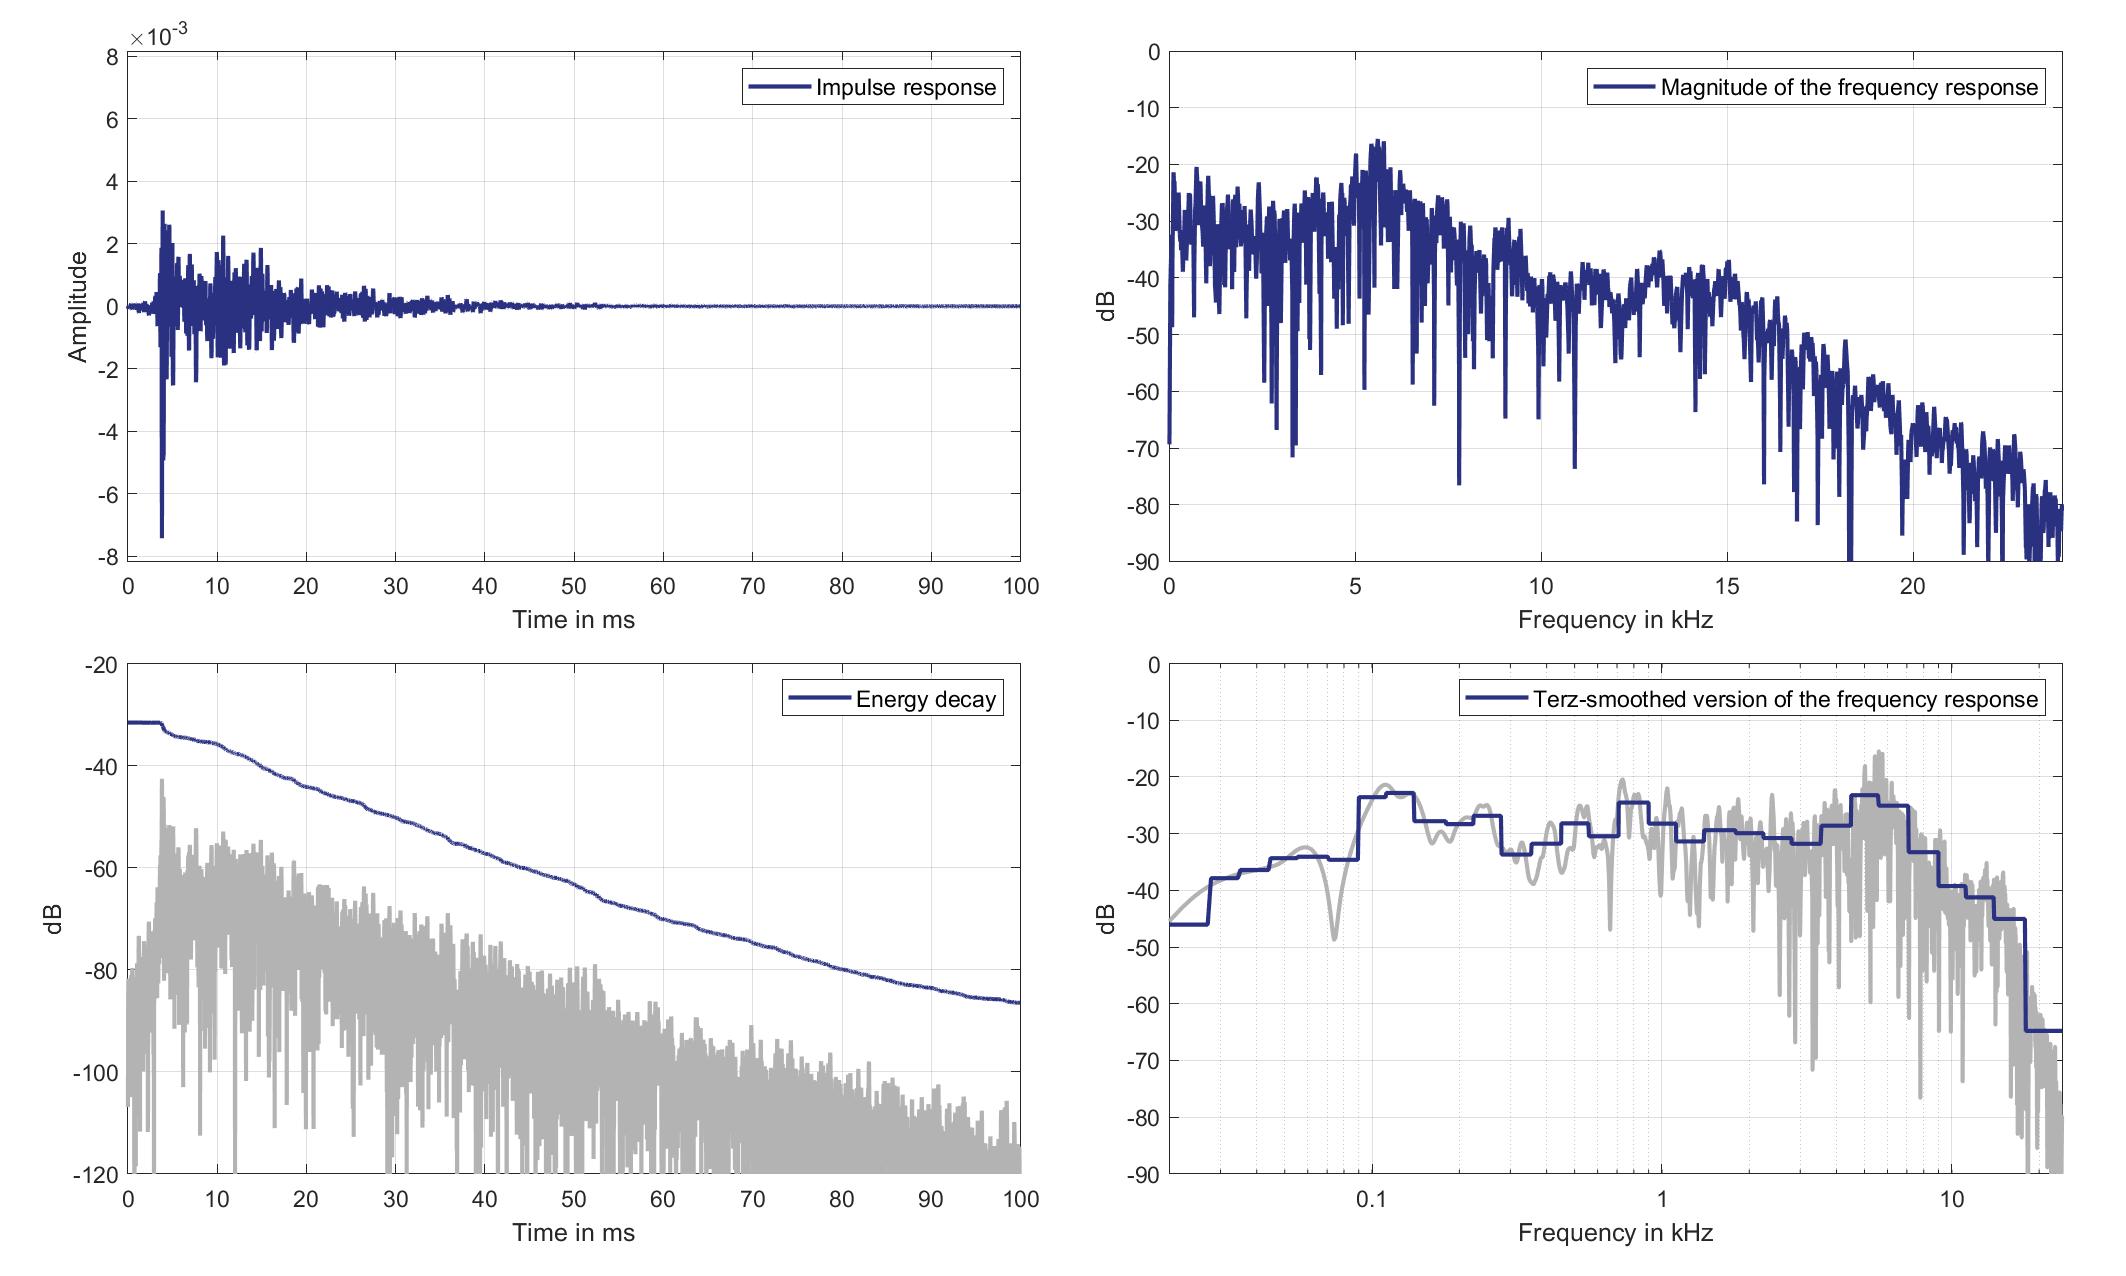
Download impulse response (in ".fir" format).
In the download section you can download all impulse response files as well as format explanation and Matlab as well as Python code examples for loading fir files.
Mic. 4
Mouth Loudspeaker of Zone 3 (Lsp. 14) to Standard Car Microphone 4 (Mic. 4)
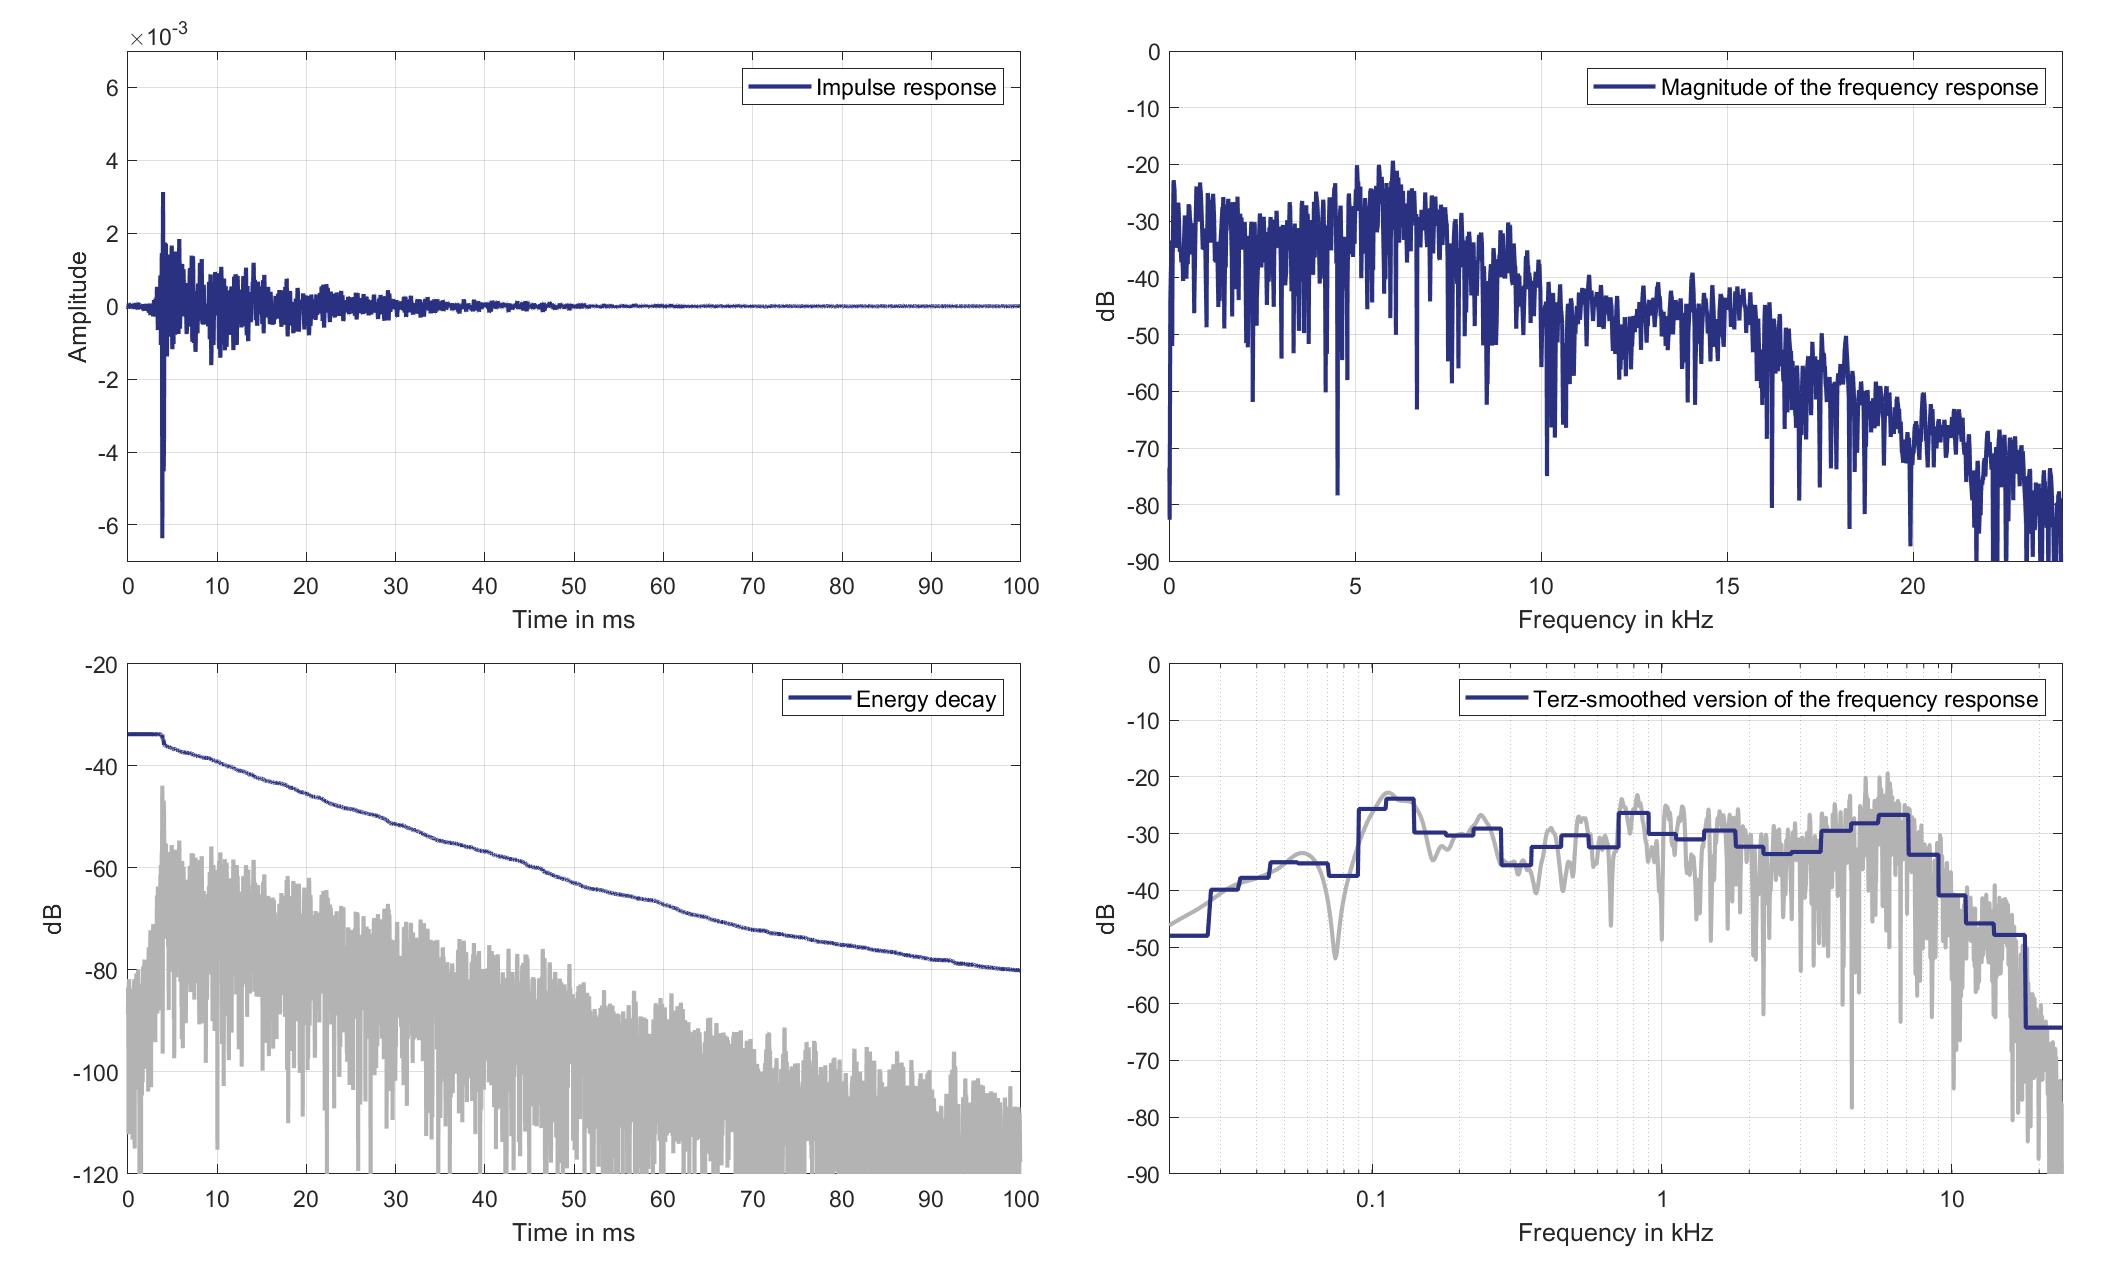
Download impulse response (in ".fir" format).
In the download section you can download all impulse response files as well as format explanation and Matlab as well as Python code examples for loading fir files.
Mic. 5
Mouth Loudspeaker of Zone 3 (Lsp. 14) to Standard Car Microphone 5 (Mic. 5)
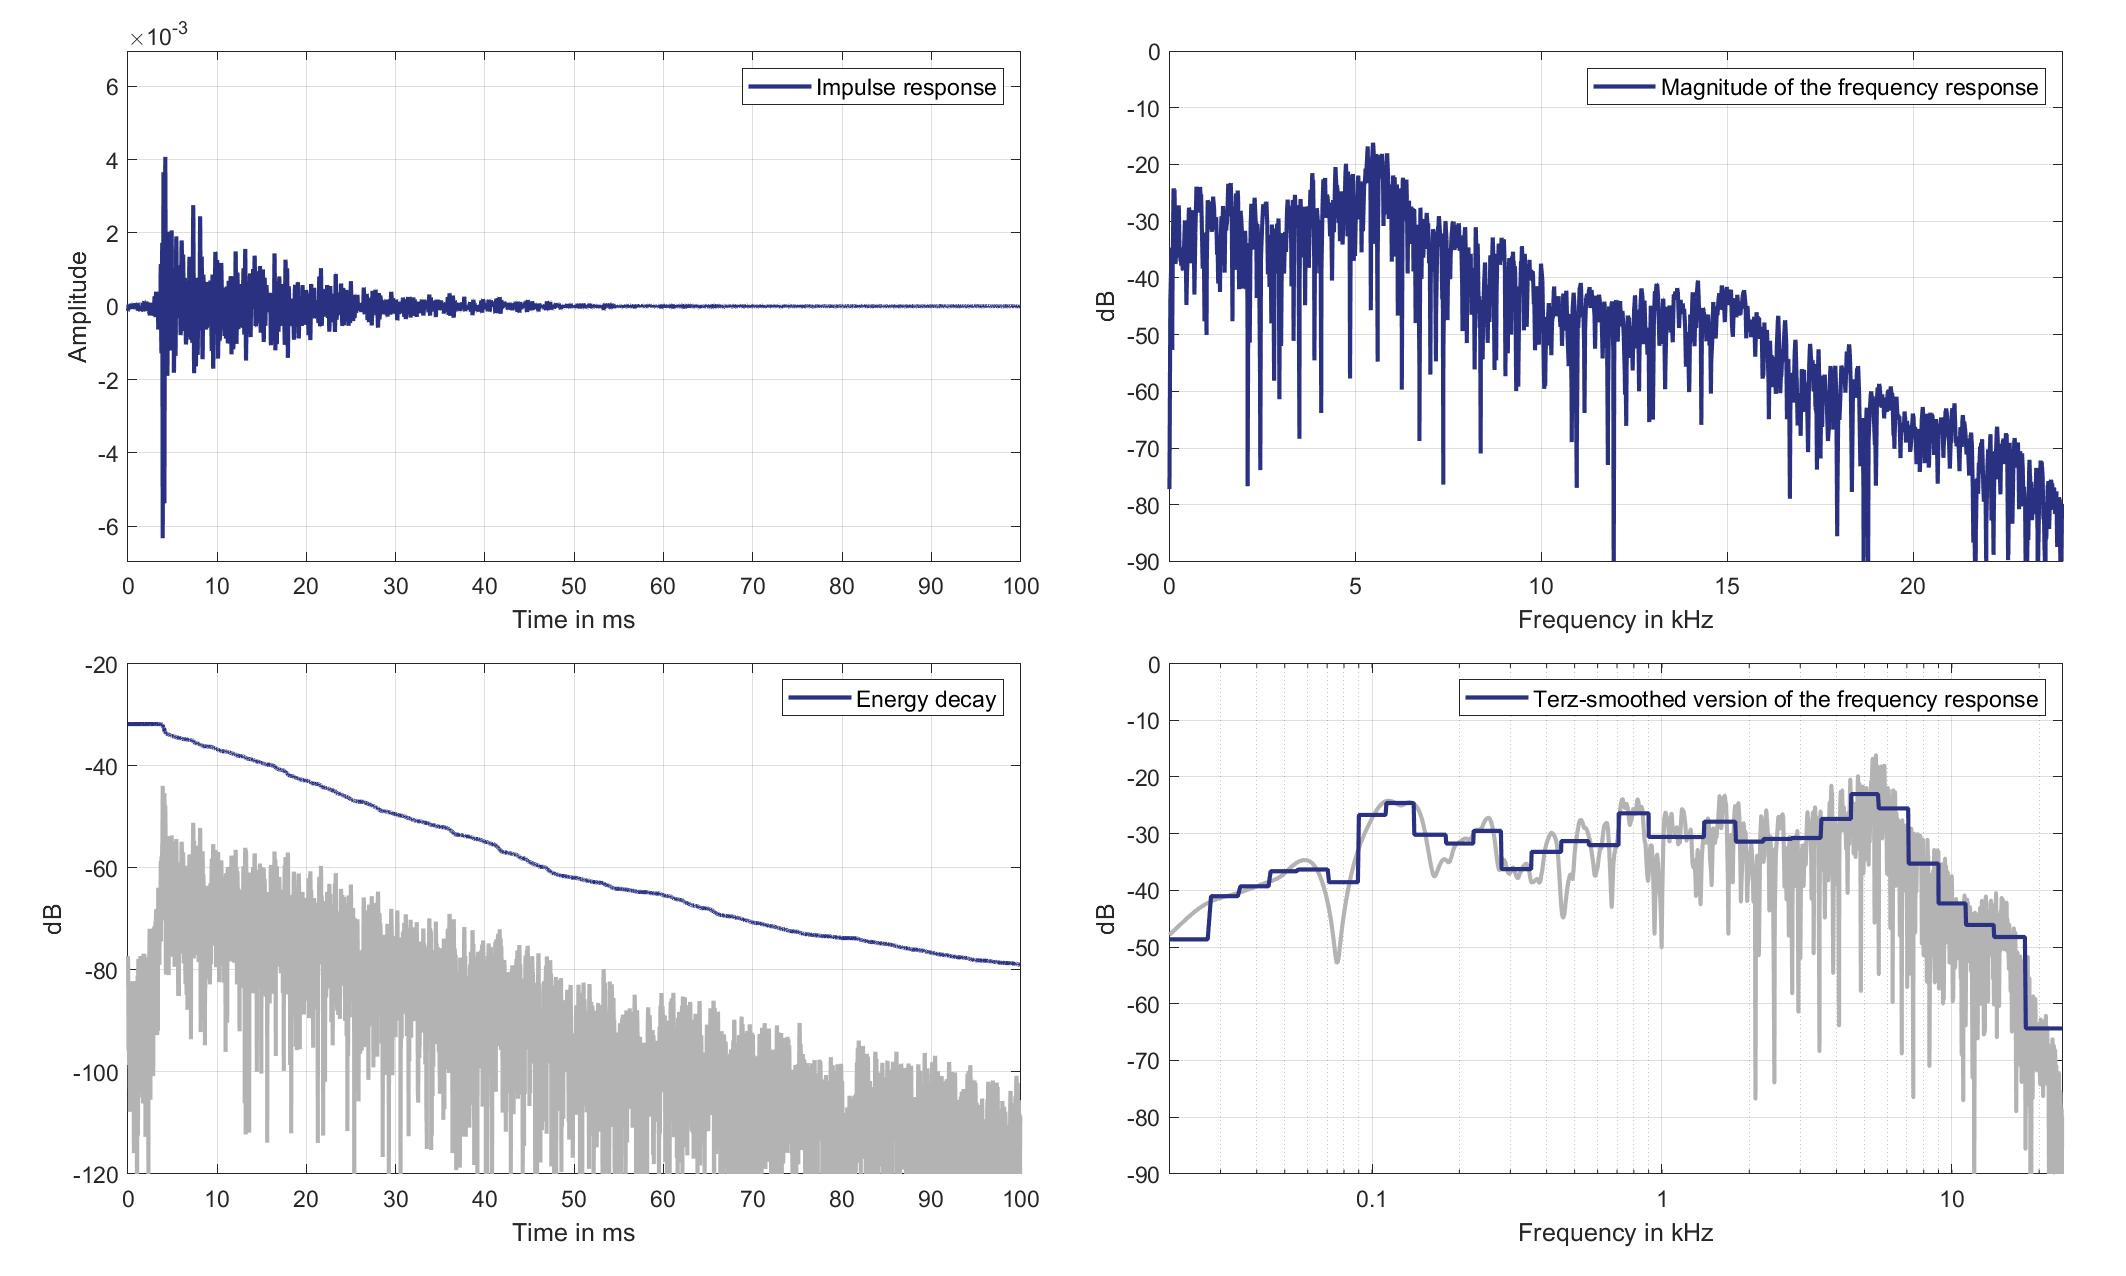
Download impulse response (in ".fir" format).
In the download section you can download all impulse response files as well as format explanation and Matlab as well as Python code examples for loading fir files.
Mic. 6
Mouth Loudspeaker of Zone 3 (Lsp. 14) to Standard Car Microphone 6 (Mic. 6)
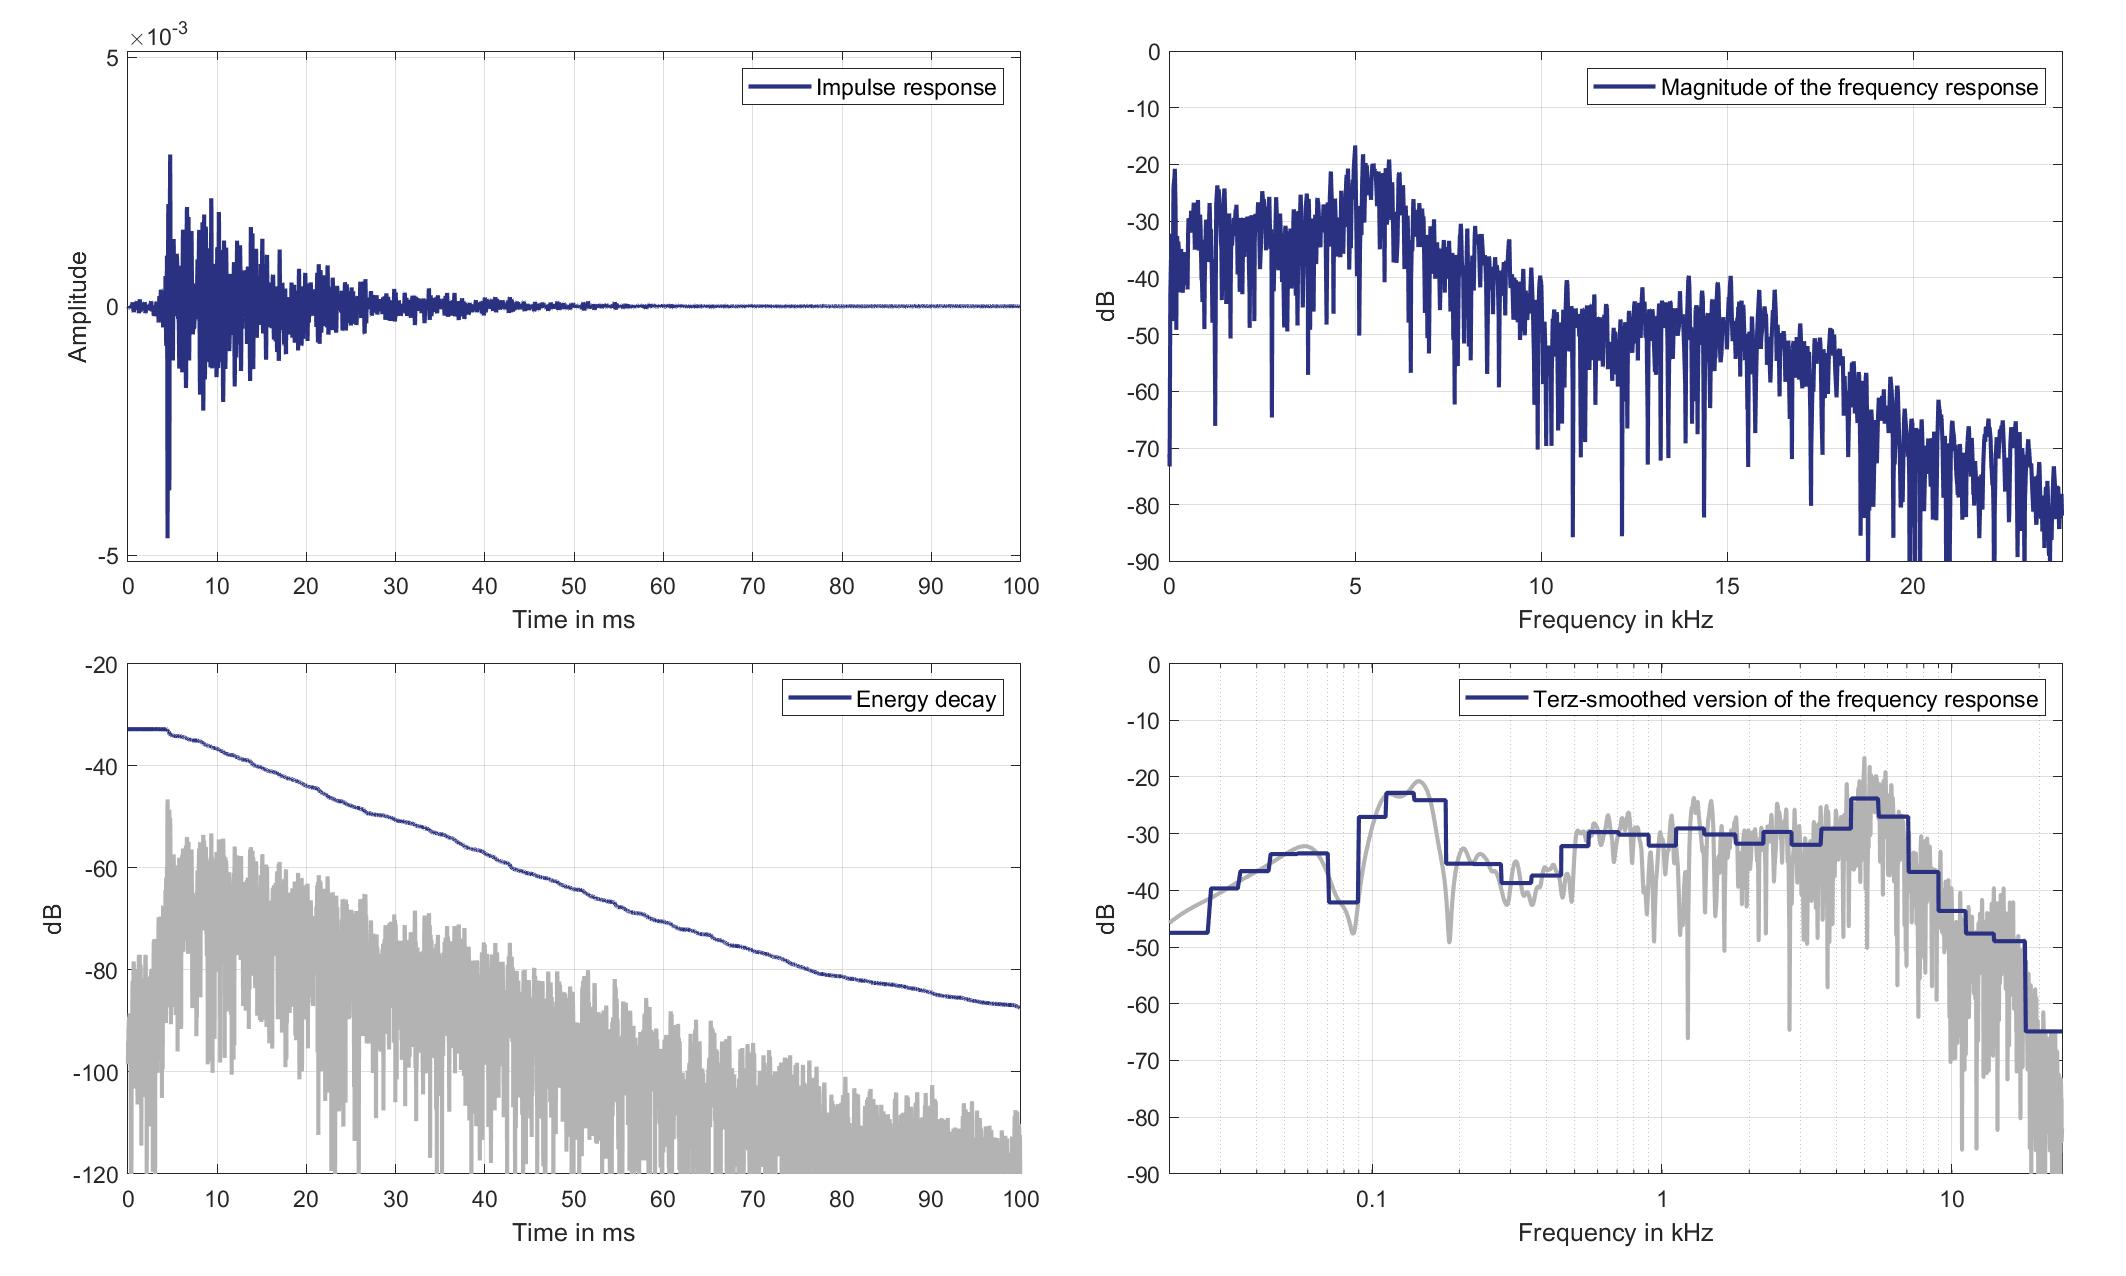
Download impulse response (in ".fir" format).
In the download section you can download all impulse response files as well as format explanation and Matlab as well as Python code examples for loading fir files.
Mic. 7
Mouth Loudspeaker of Zone 3 (Lsp. 14) to Standard Car Microphone 7 (Mic. 7)
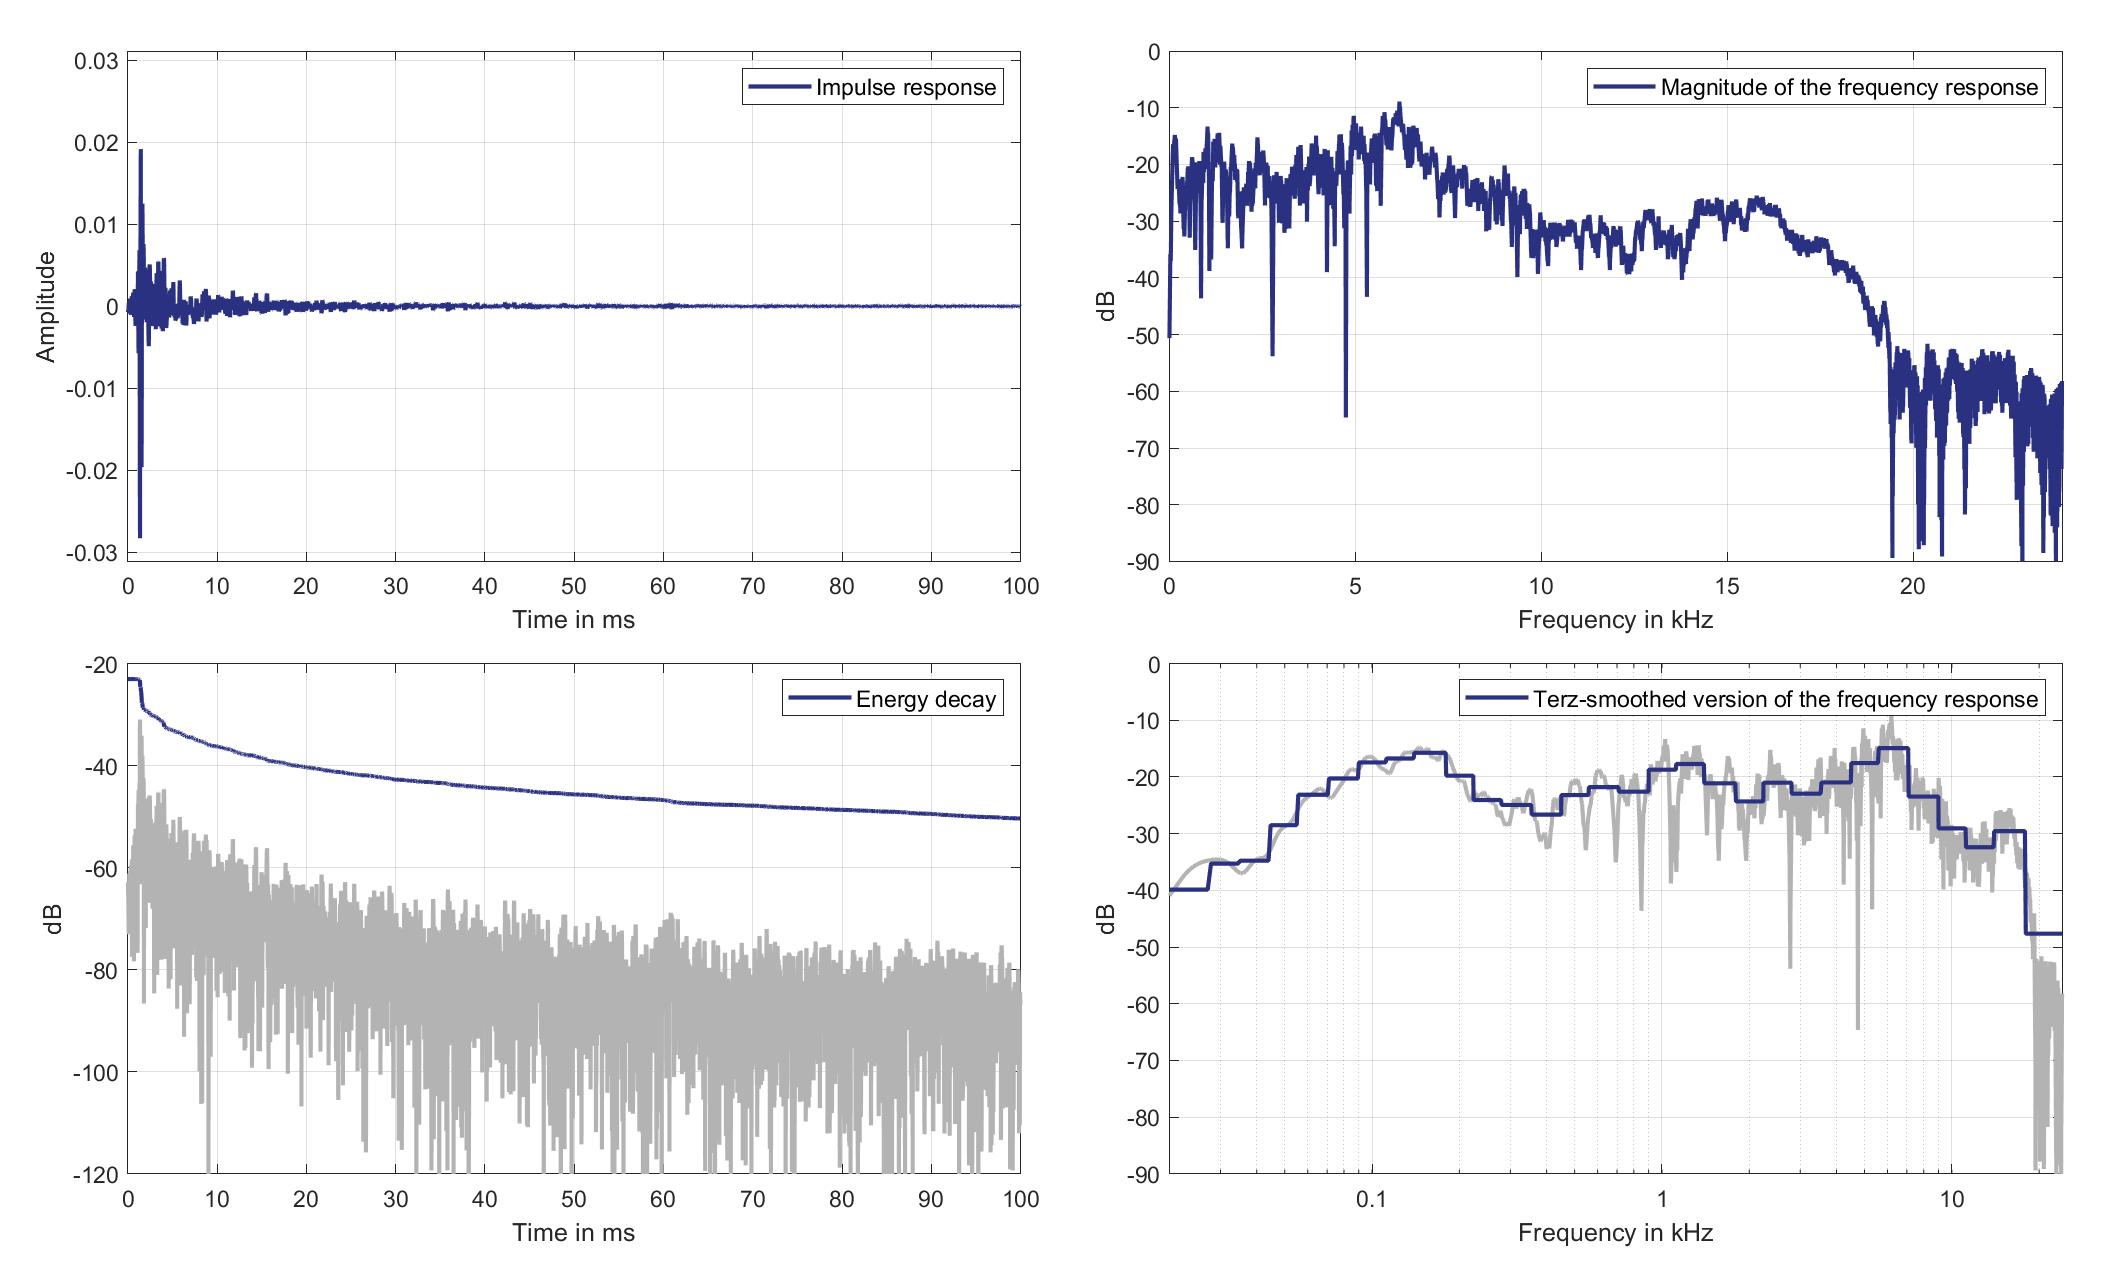
Download impulse response (in ".fir" format).
In the download section you can download all impulse response files as well as format explanation and Matlab as well as Python code examples for loading fir files.
Mic. 8
Mouth Loudspeaker of Zone 3 (Lsp. 14) to Standard Car Microphone 8 (Mic. 8)
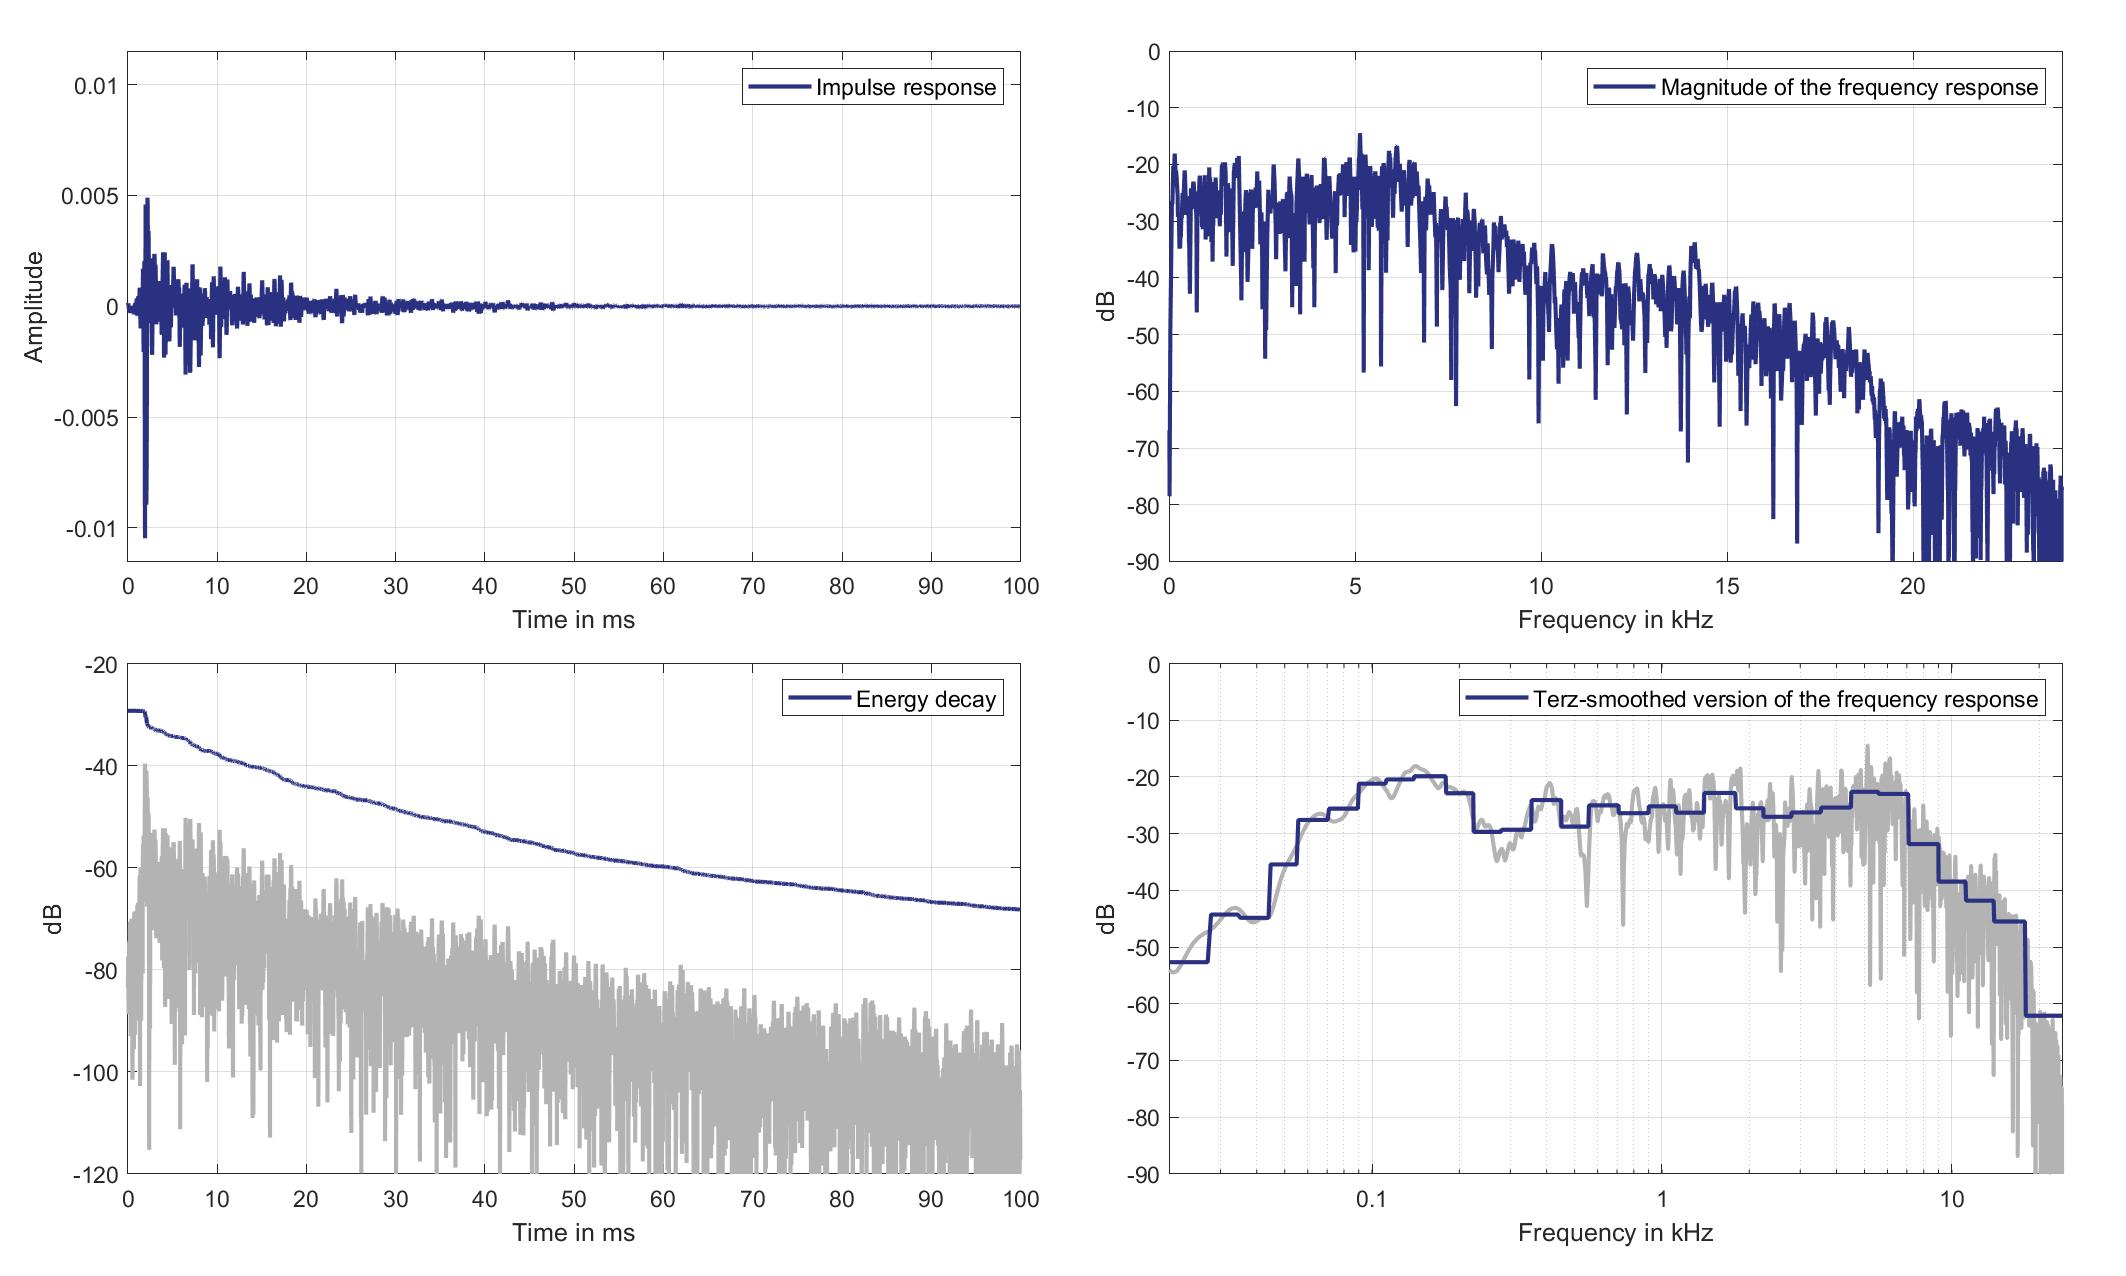
Download impulse response (in ".fir" format).
In the download section you can download all impulse response files as well as format explanation and Matlab as well as Python code examples for loading fir files.
Mic. 9
Mouth Loudspeaker of Zone 3 (Lsp. 14) to Standard Car Microphone 9 (Mic. 9)
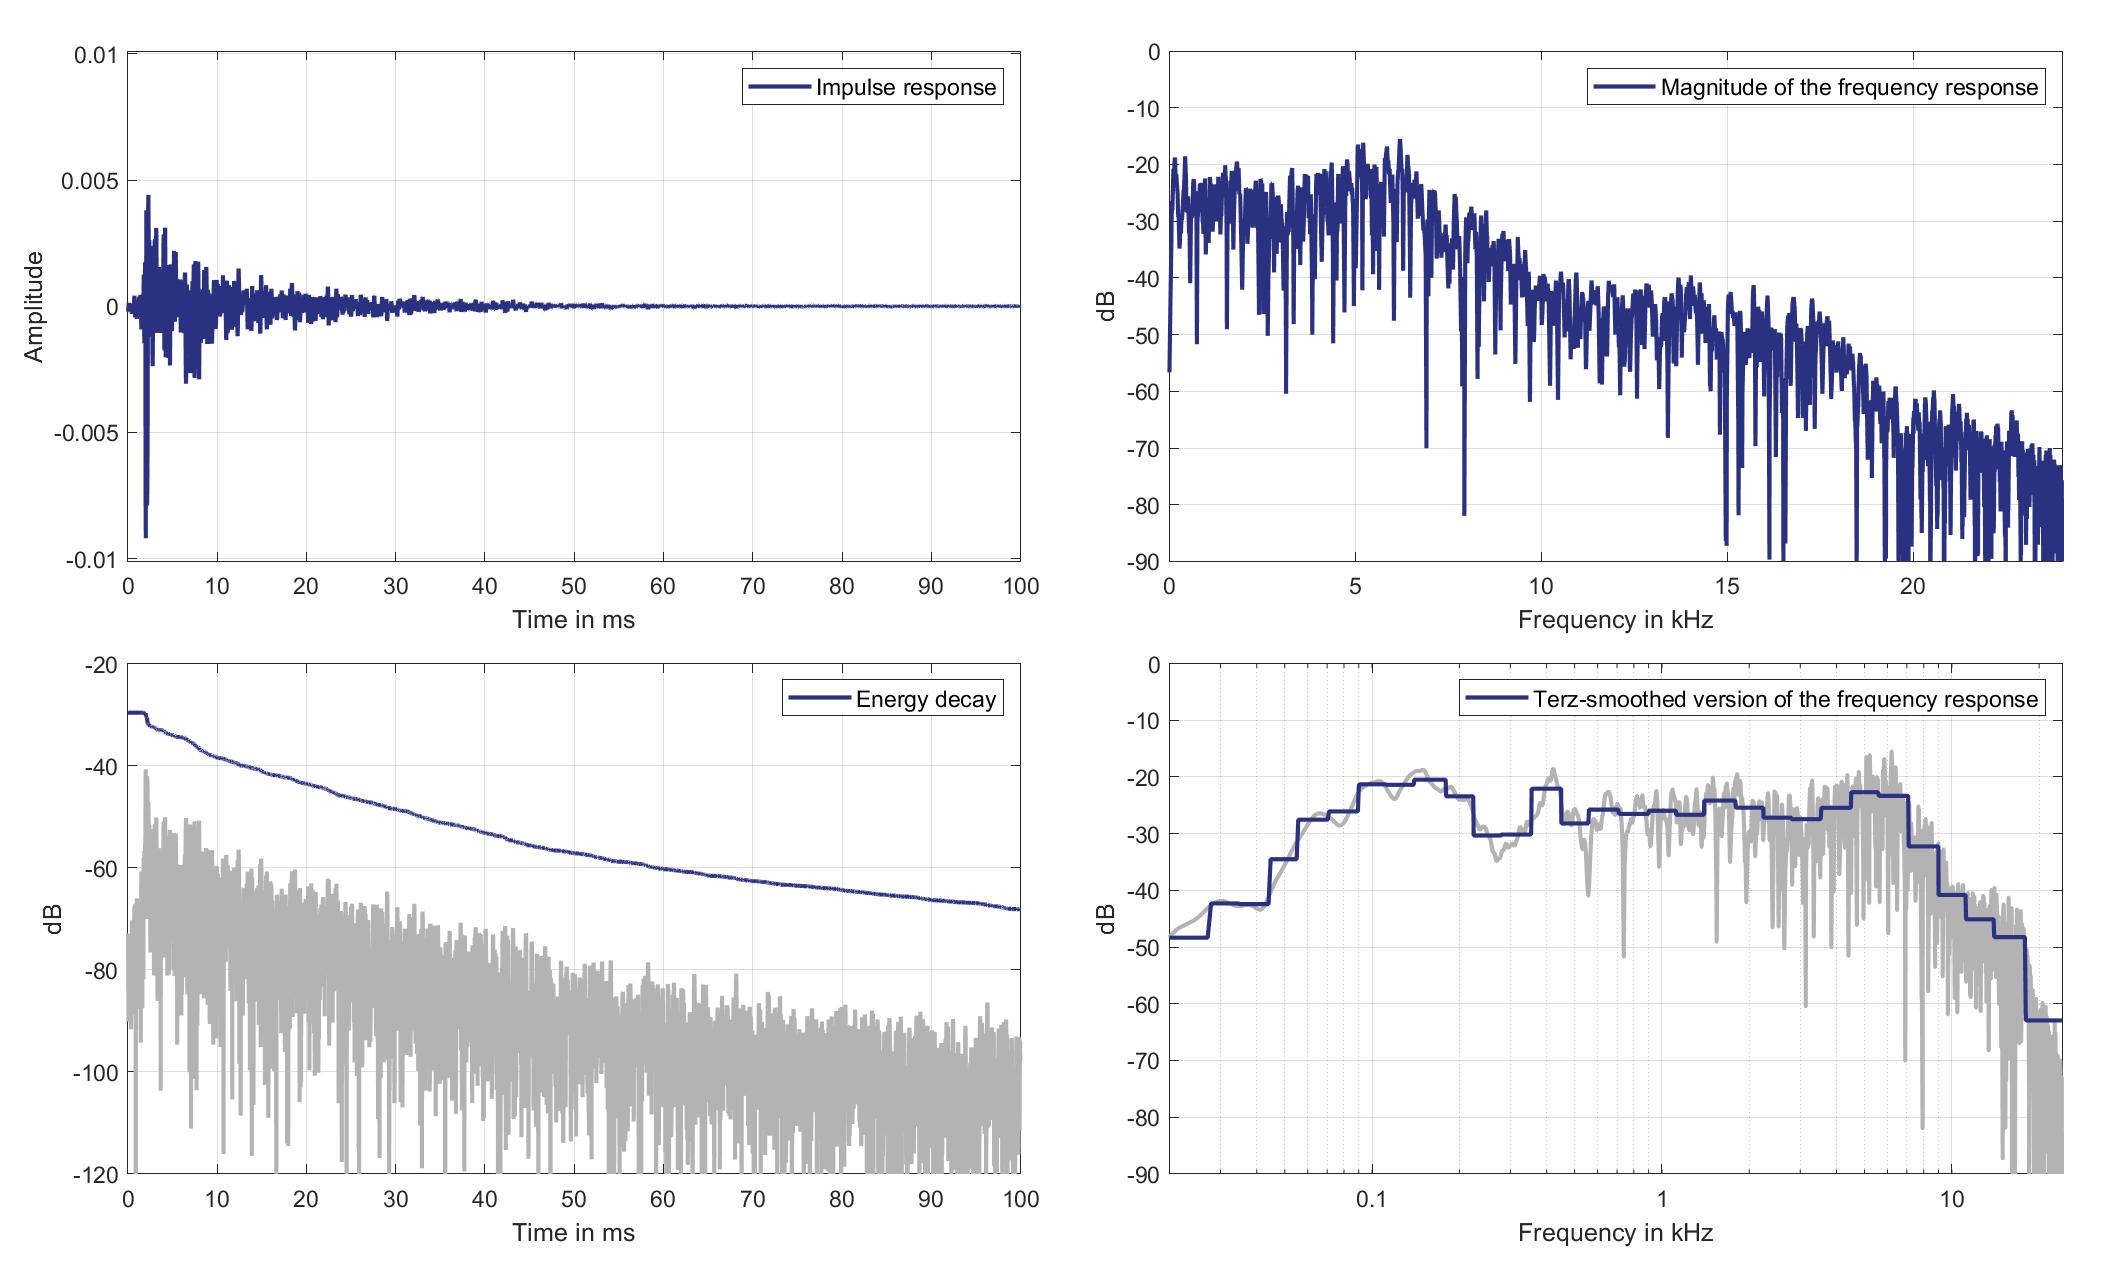
Download impulse response (in ".fir" format).
In the download section you can download all impulse response files as well as format explanation and Matlab as well as Python code examples for loading fir files.
Mic. 10
Mouth Loudspeaker of Zone 3 (Lsp. 14) to Standard Car Microphone 10 (Mic. 10)
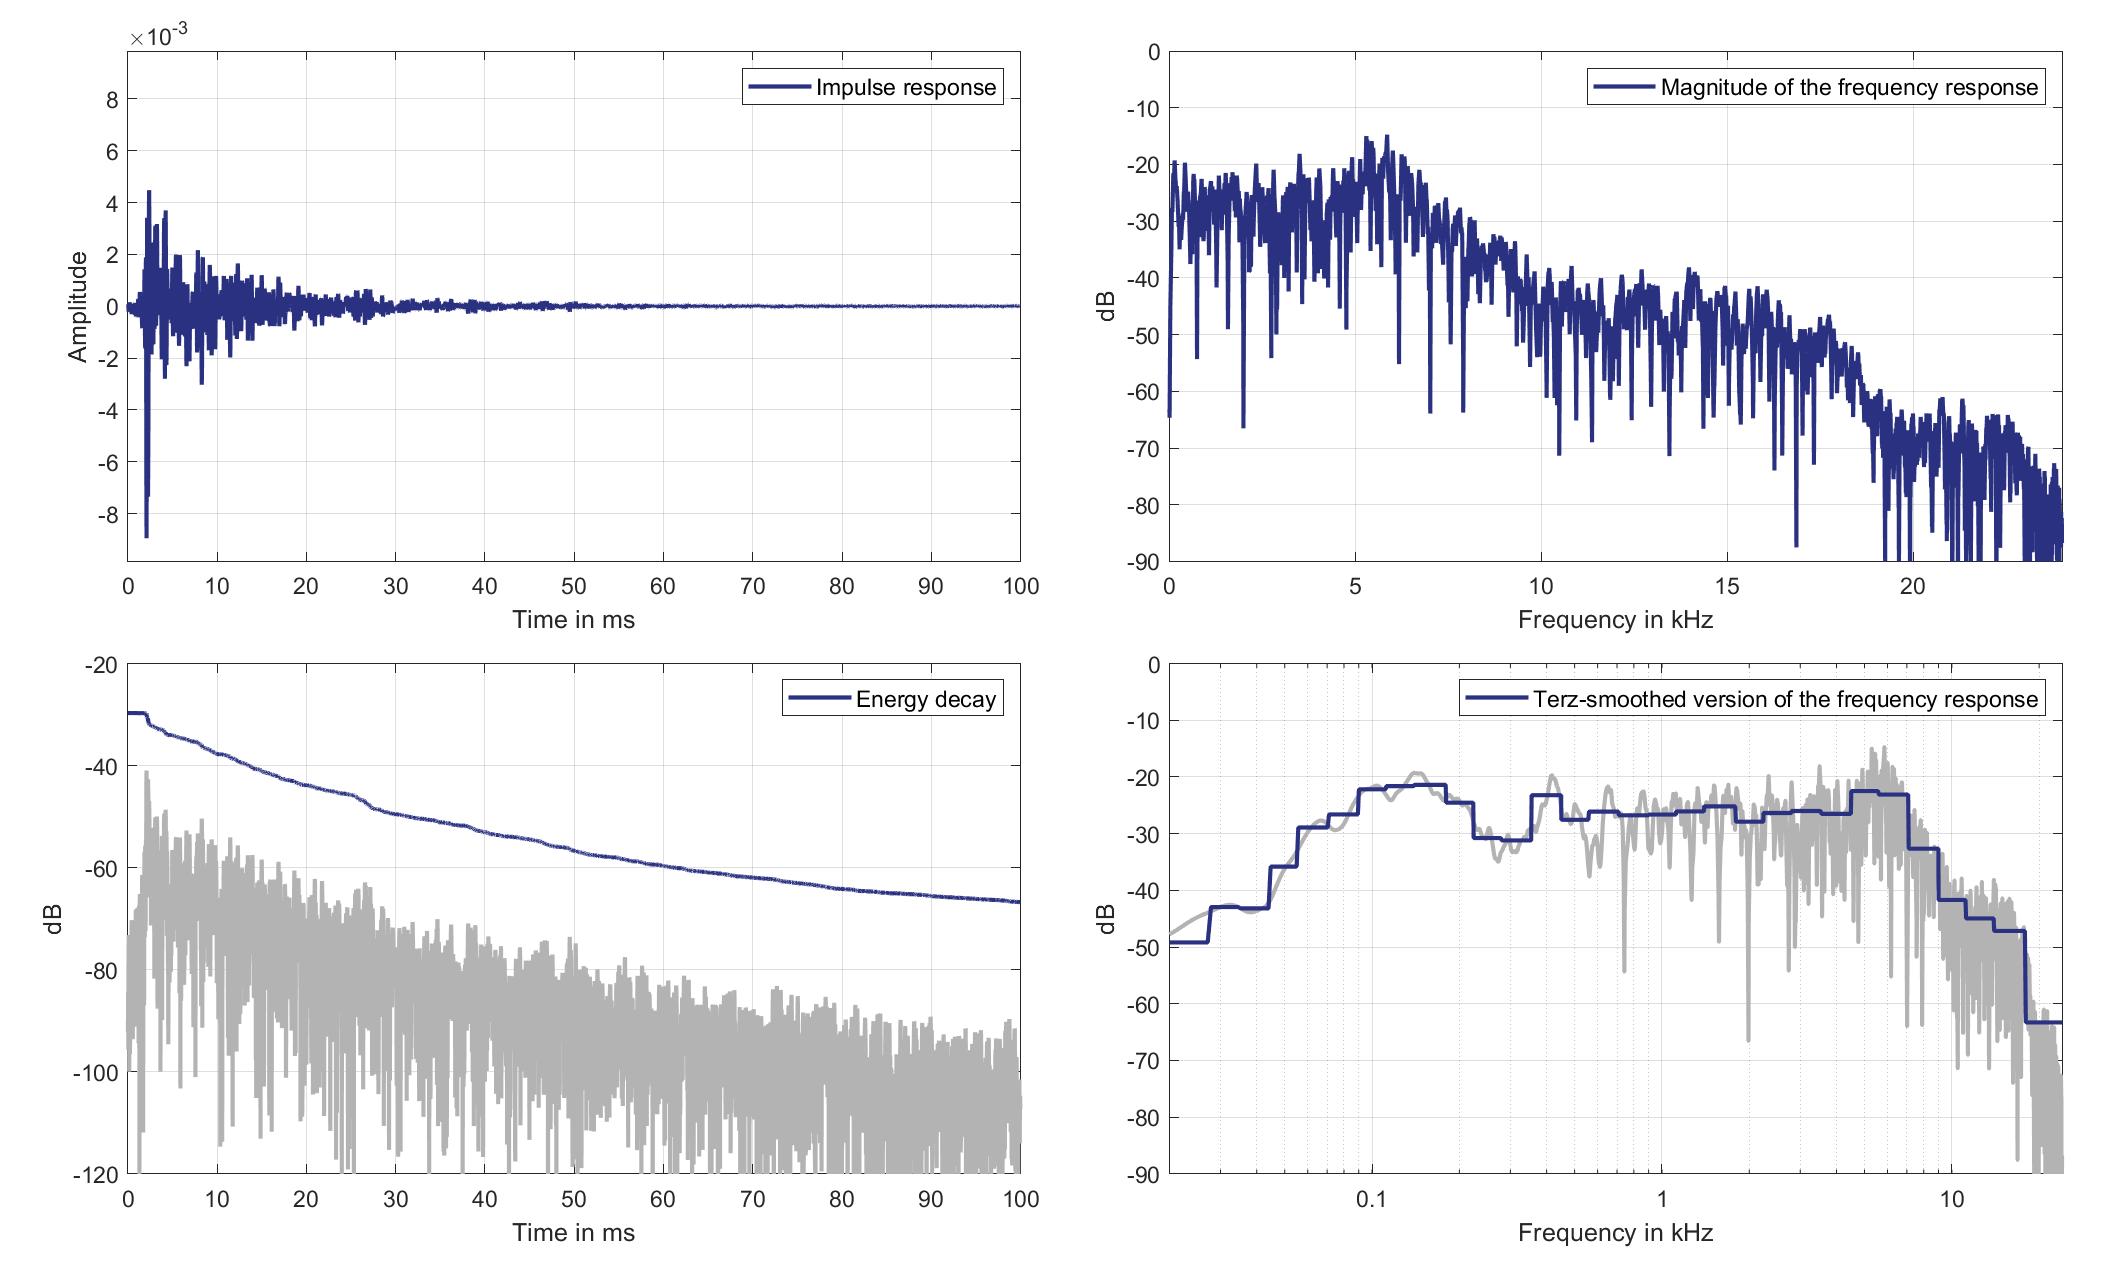
Download impulse response (in ".fir" format).
In the download section you can download all impulse response files as well as format explanation and Matlab as well as Python code examples for loading fir files.
Mic. 11
Mouth Loudspeaker of Zone 3 (Lsp. 14) to Standard Car Microphone 11 (Mic. 11)
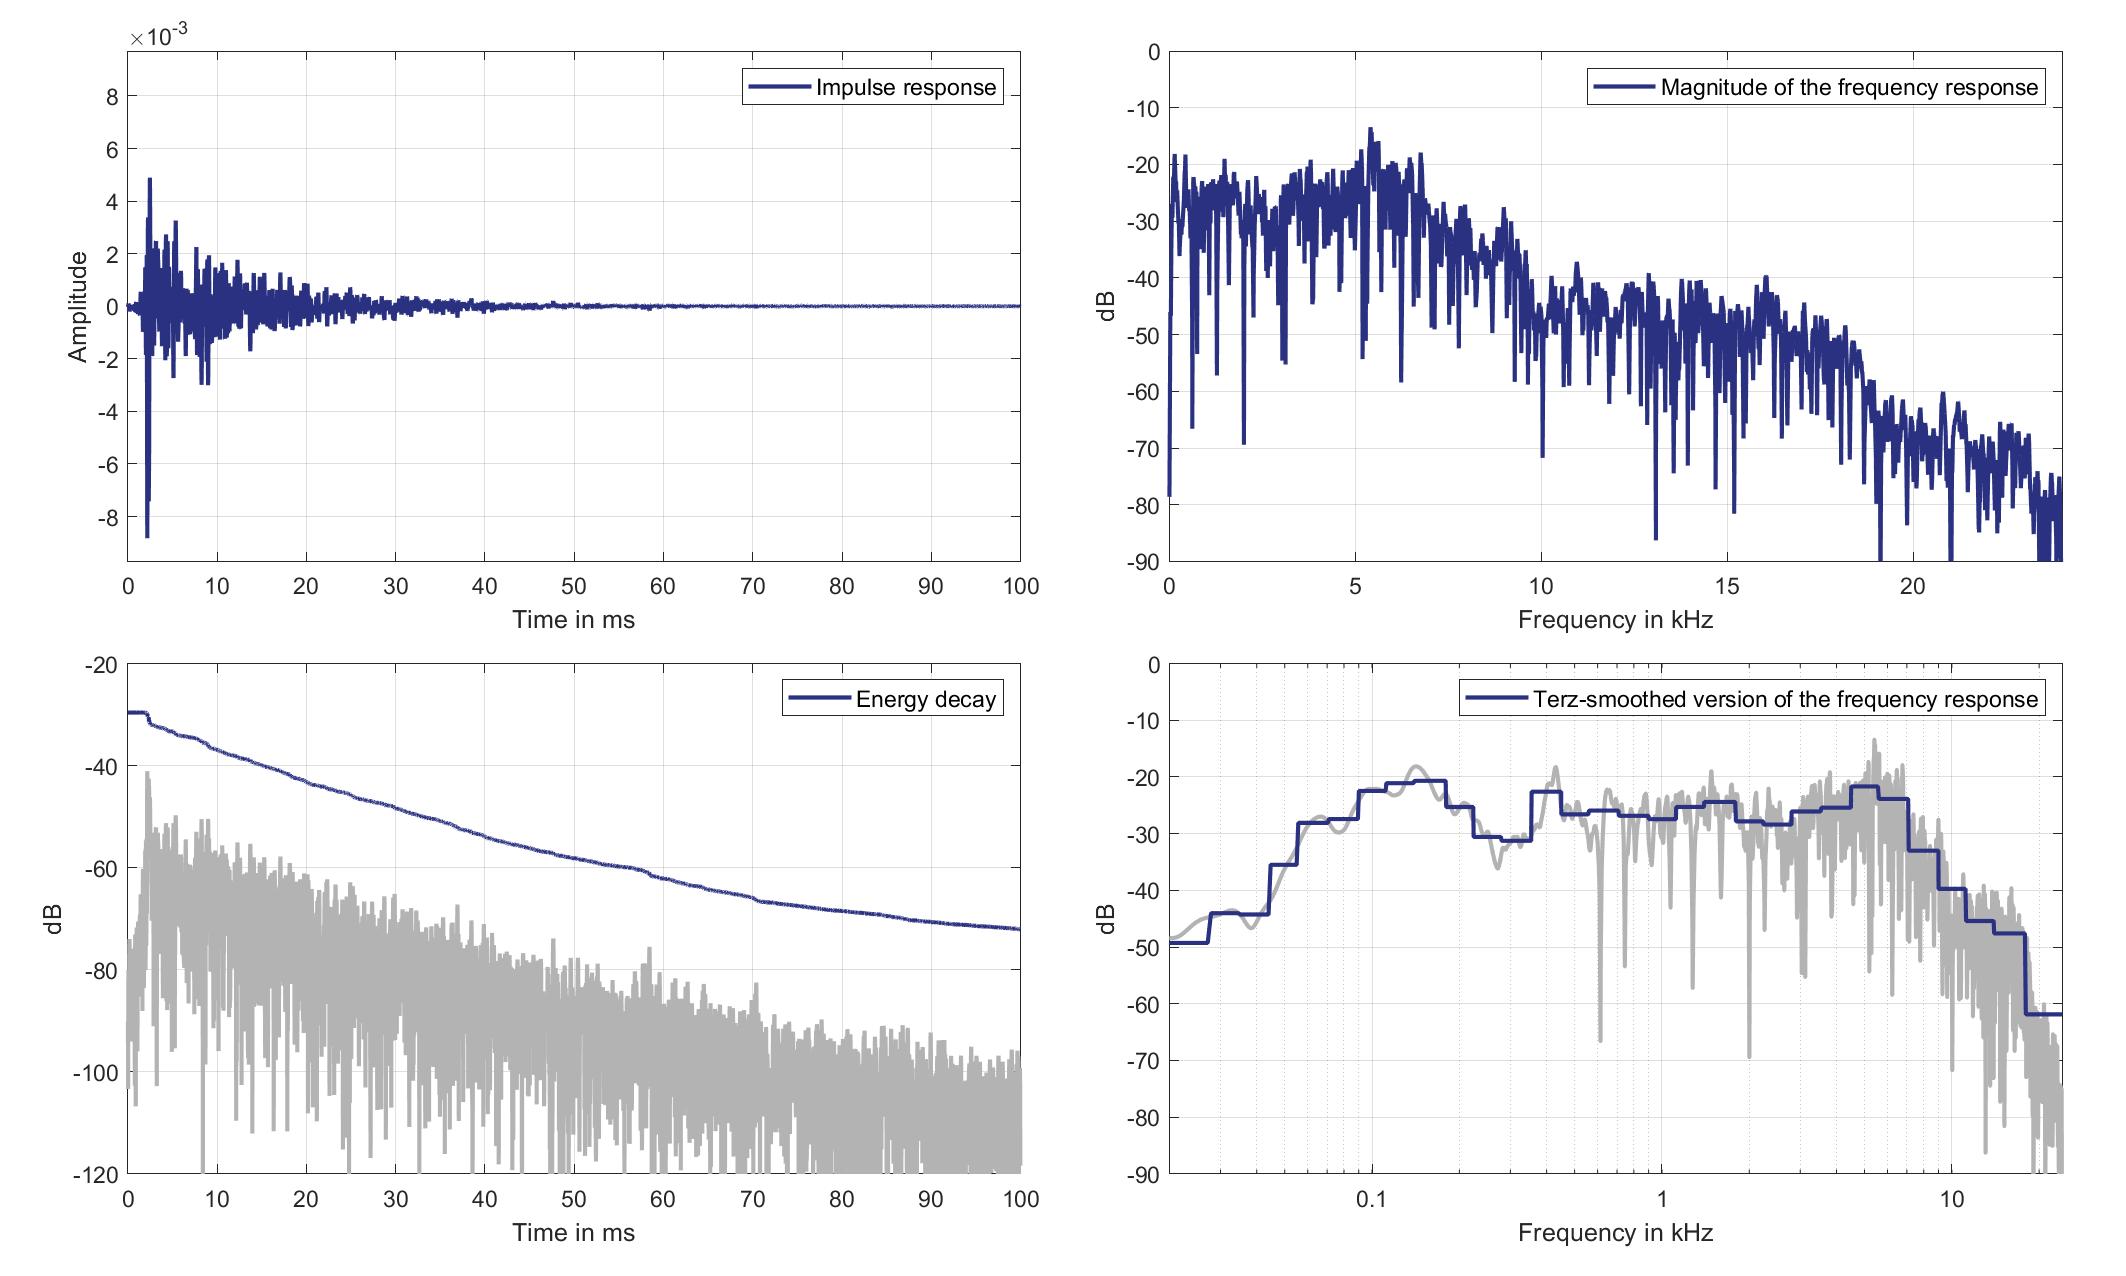
Download impulse response (in ".fir" format).
In the download section you can download all impulse response files as well as format explanation and Matlab as well as Python code examples for loading fir files.
Mic. 12
Mouth Loudspeaker of Zone 3 (Lsp. 14) to Standard Car Microphone 12 (Mic. 12)
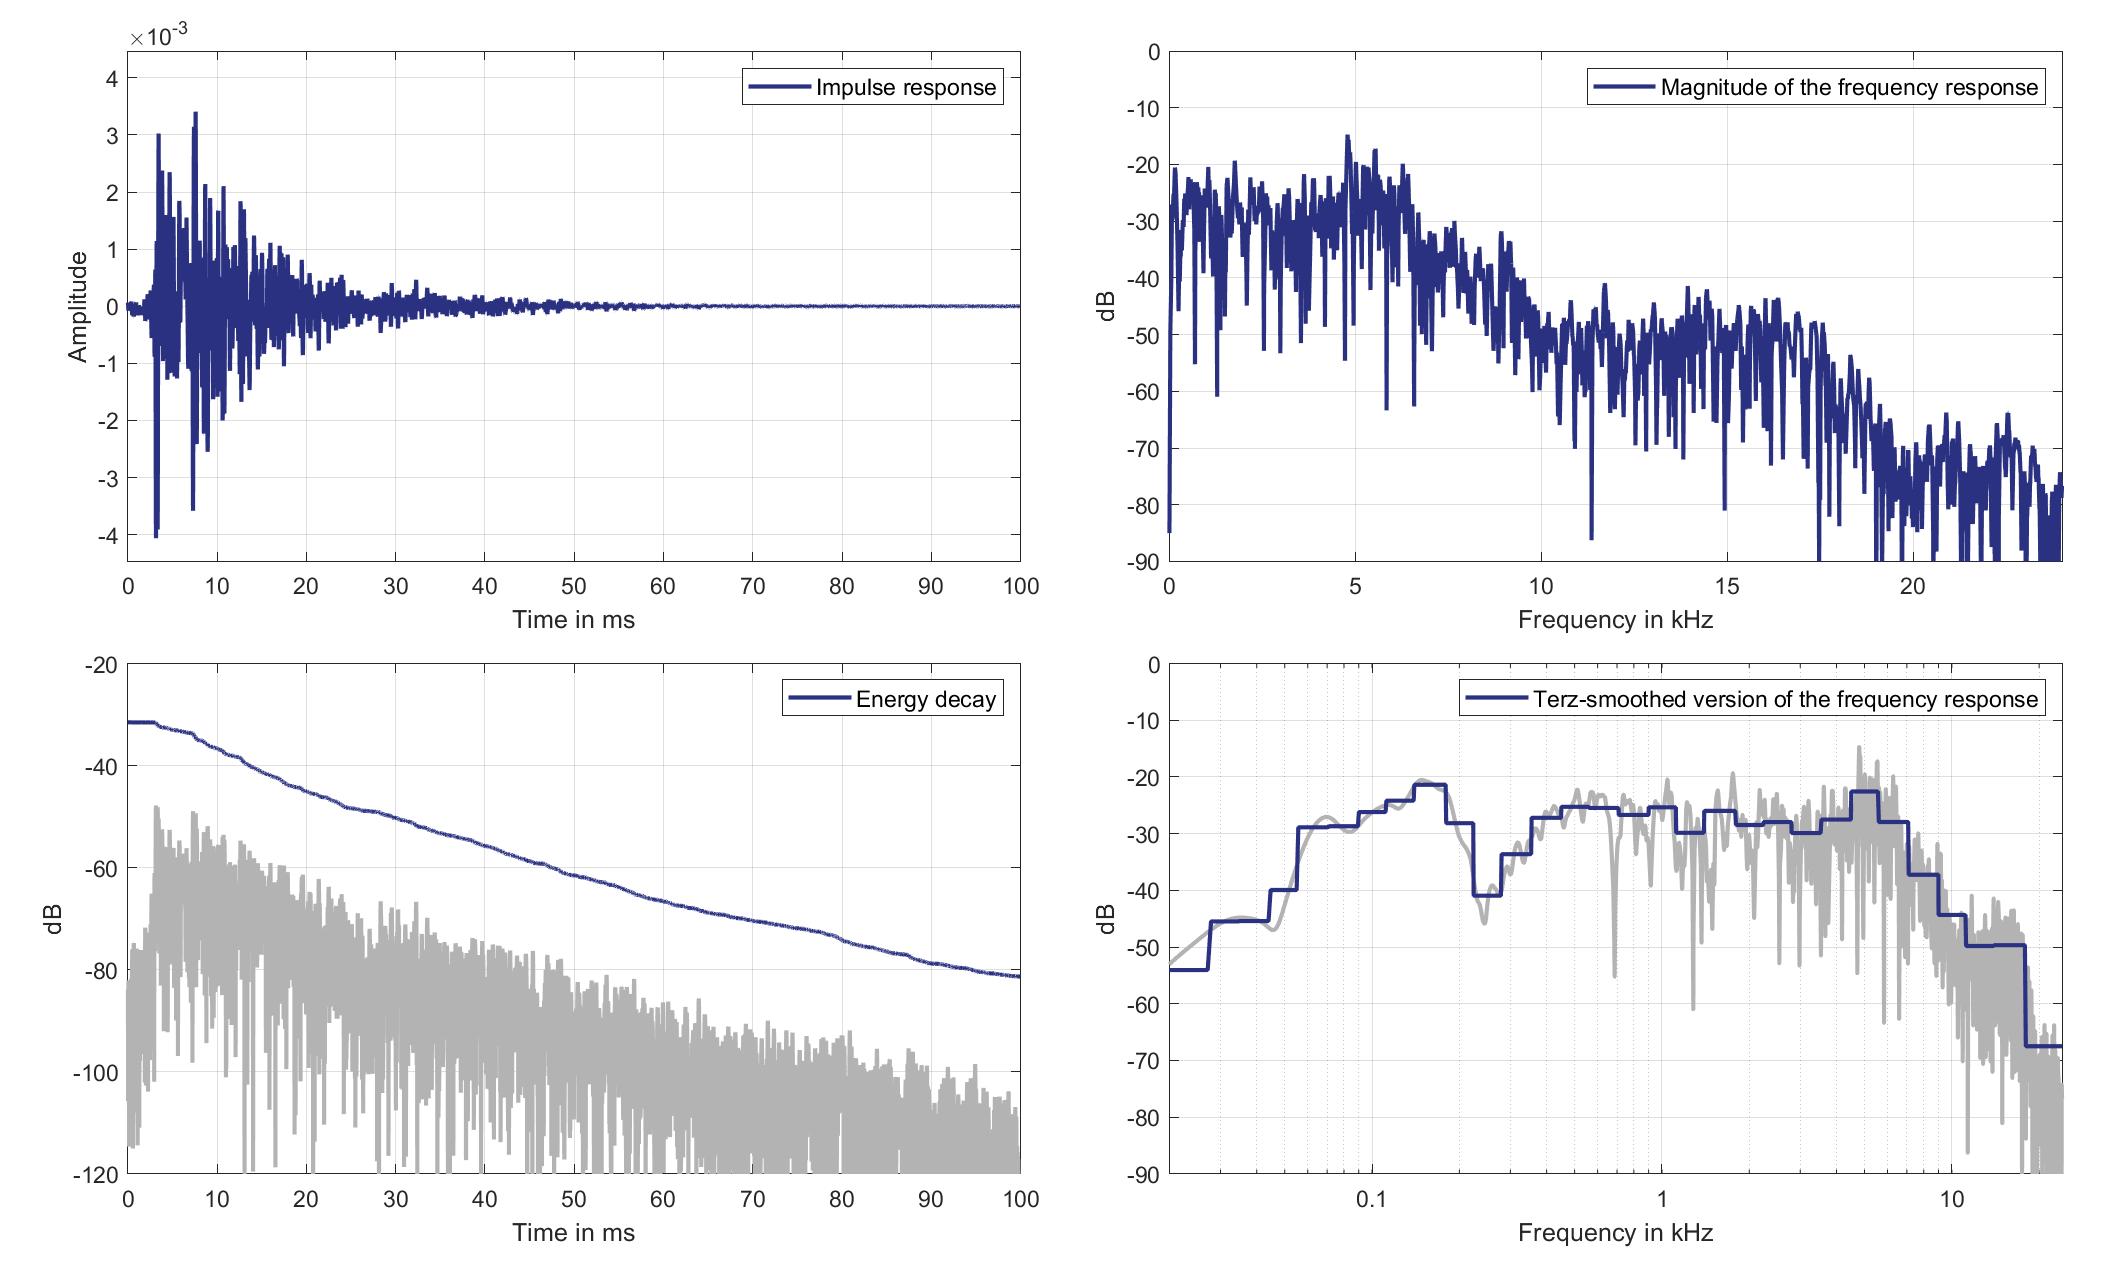
Download impulse response (in ".fir" format).
In the download section you can download all impulse response files as well as format explanation and Matlab as well as Python code examples for loading fir files.
Mic. 13
Mouth Loudspeaker of Zone 3 (Lsp. 14) to Standard Car Microphone 13 (Mic. 13)
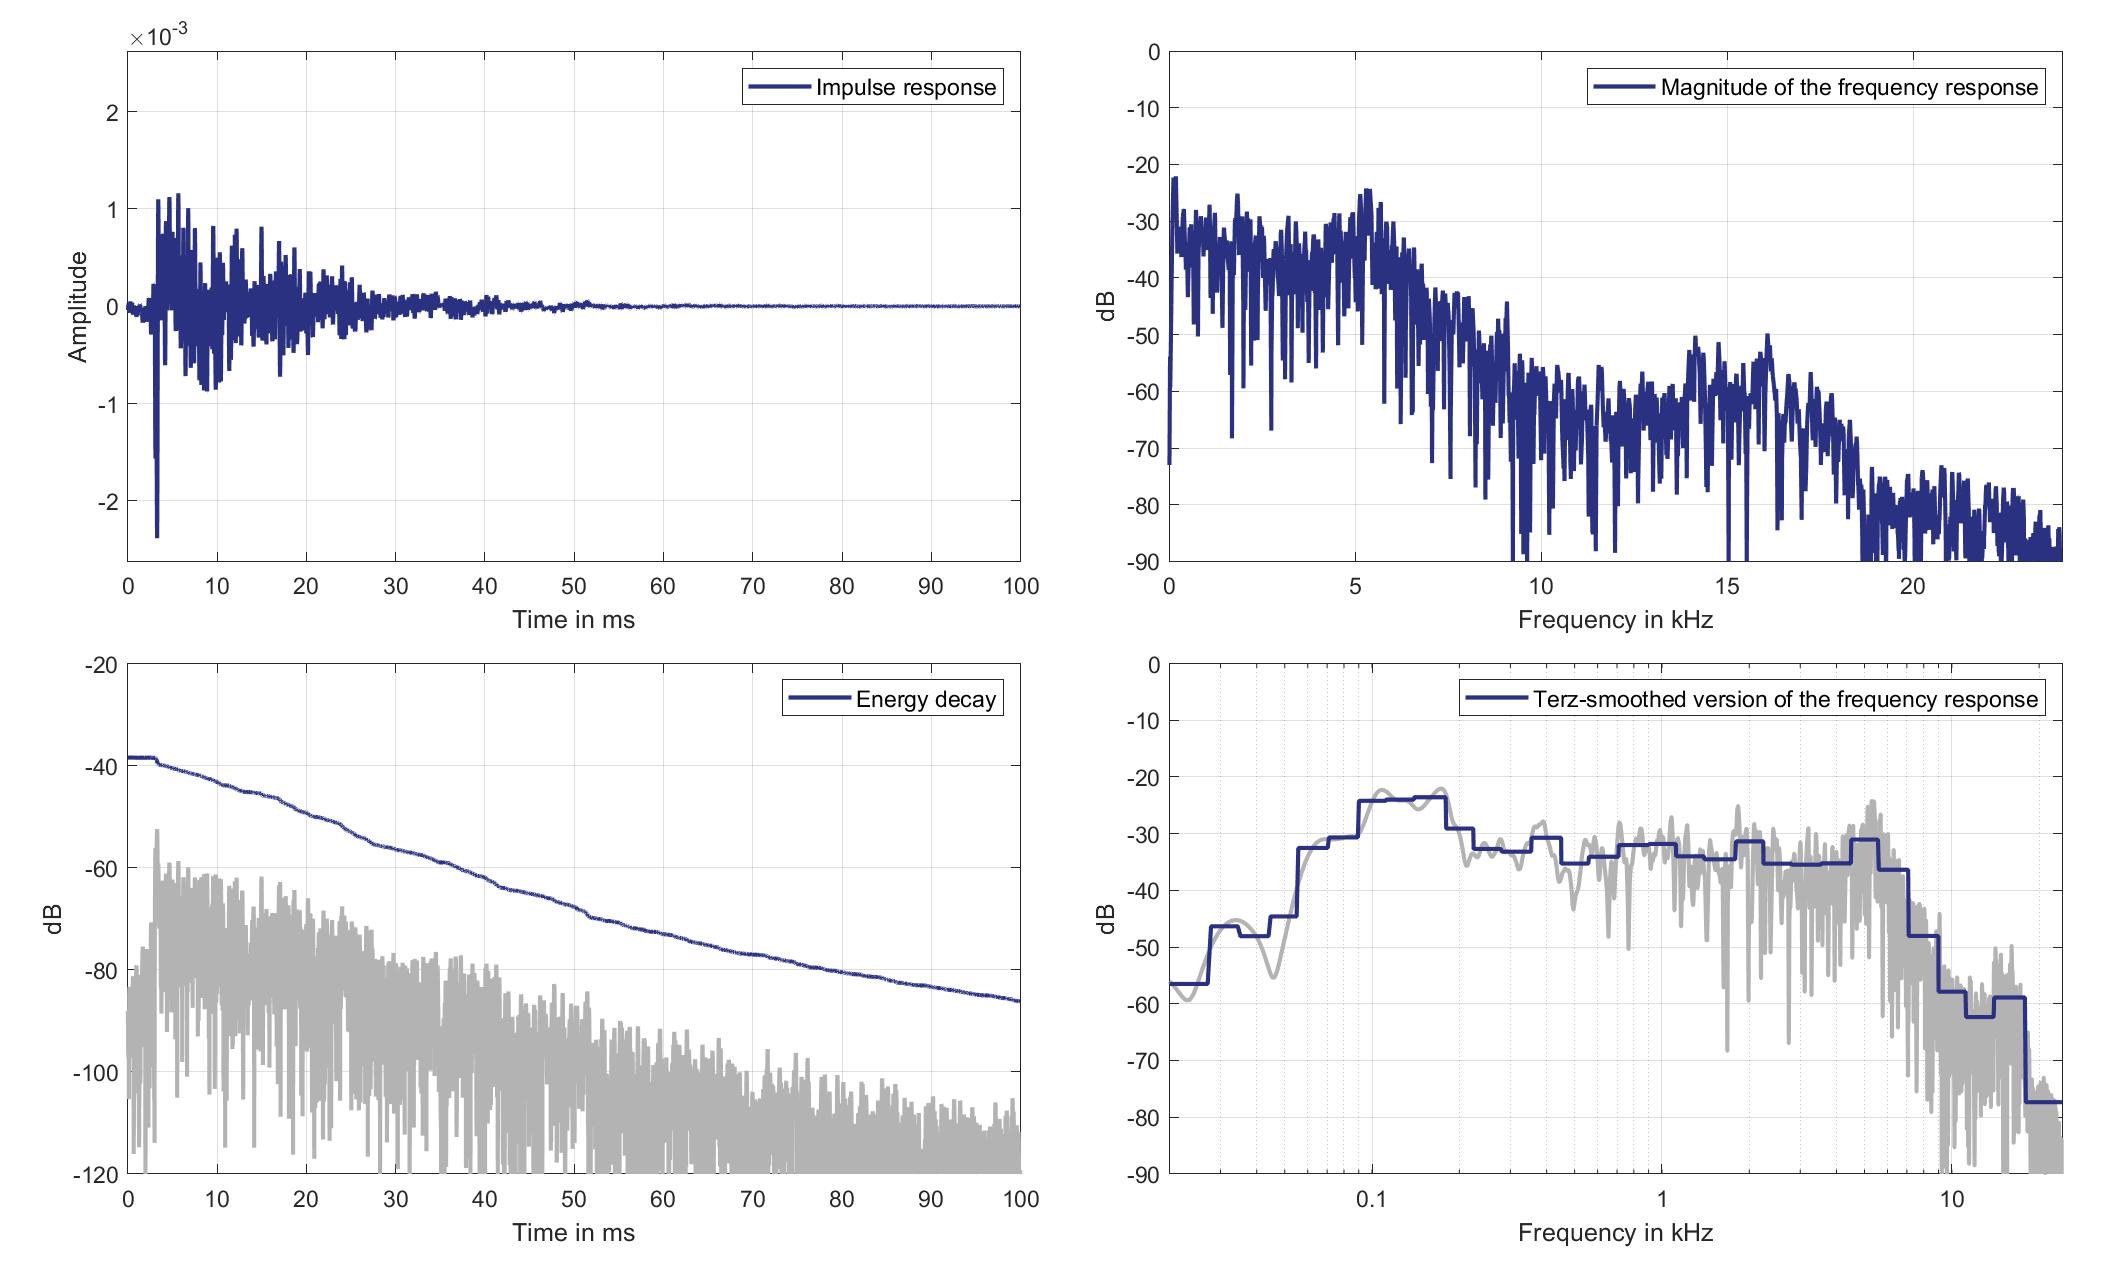
Download impulse response (in ".fir" format).
In the download section you can download all impulse response files as well as format explanation and Matlab as well as Python code examples for loading fir files.
Mic. 14
Mouth Loudspeaker of Zone 3 (Lsp. 14) to Standard Car Microphone 14 (Mic. 14)

Download impulse response (in ".fir" format).
In the download section you can download all impulse response files as well as format explanation and Matlab as well as Python code examples for loading fir files.
Mic. 15
Mouth Loudspeaker of Zone 3 (Lsp. 14) to Standard Car Microphone 15 (Mic. 15)
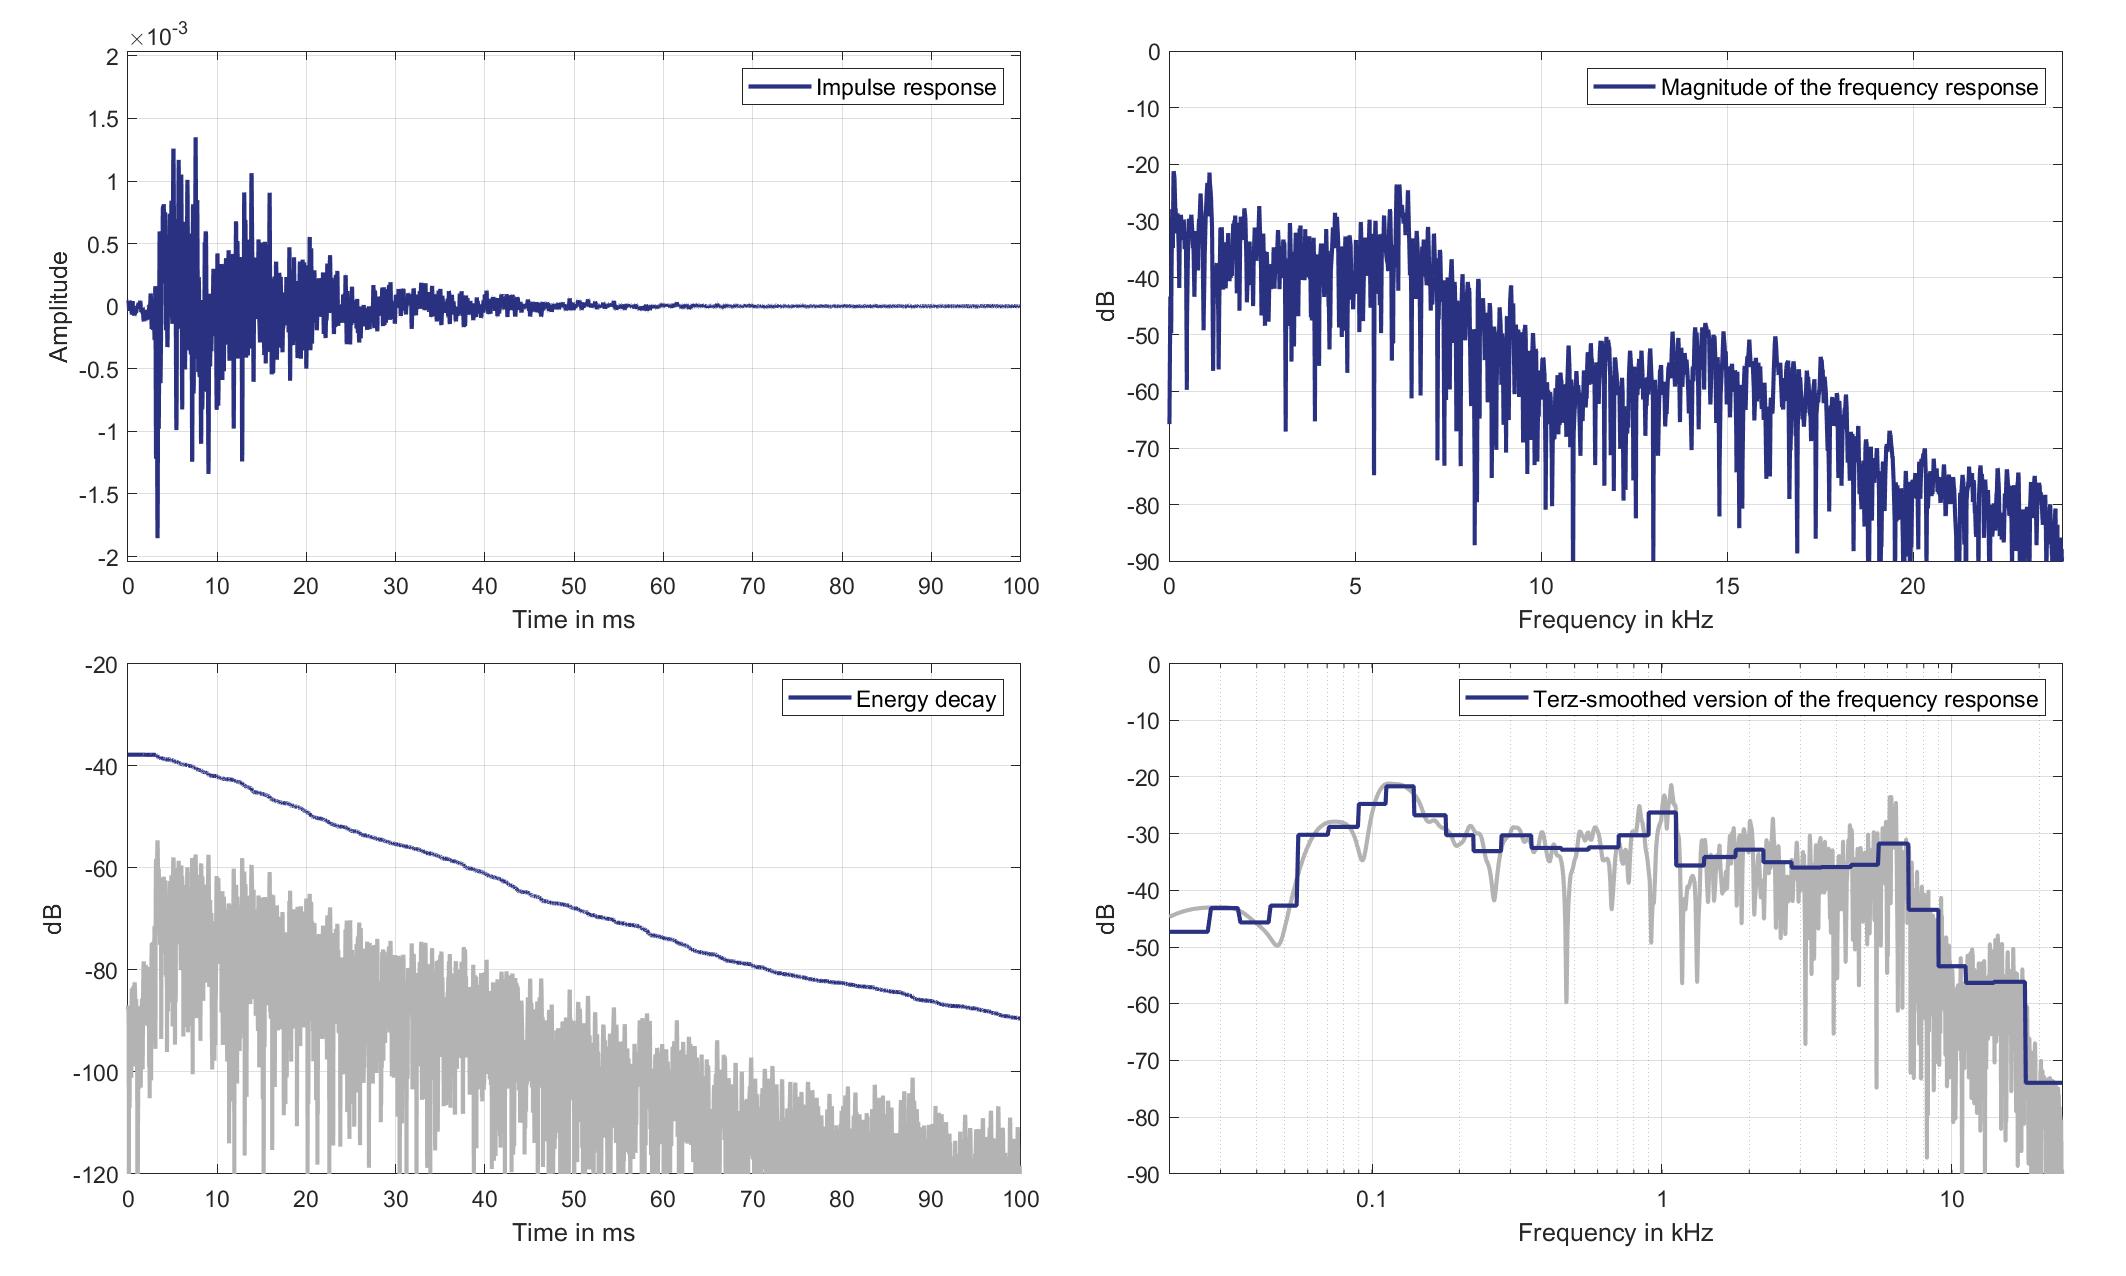
Download impulse response (in ".fir" format).
In the download section you can download all impulse response files as well as format explanation and Matlab as well as Python code examples for loading fir files.
Mic. 16
Mouth Loudspeaker of Zone 3 (Lsp. 14) to Standard Car Microphone 16 (Mic. 16)
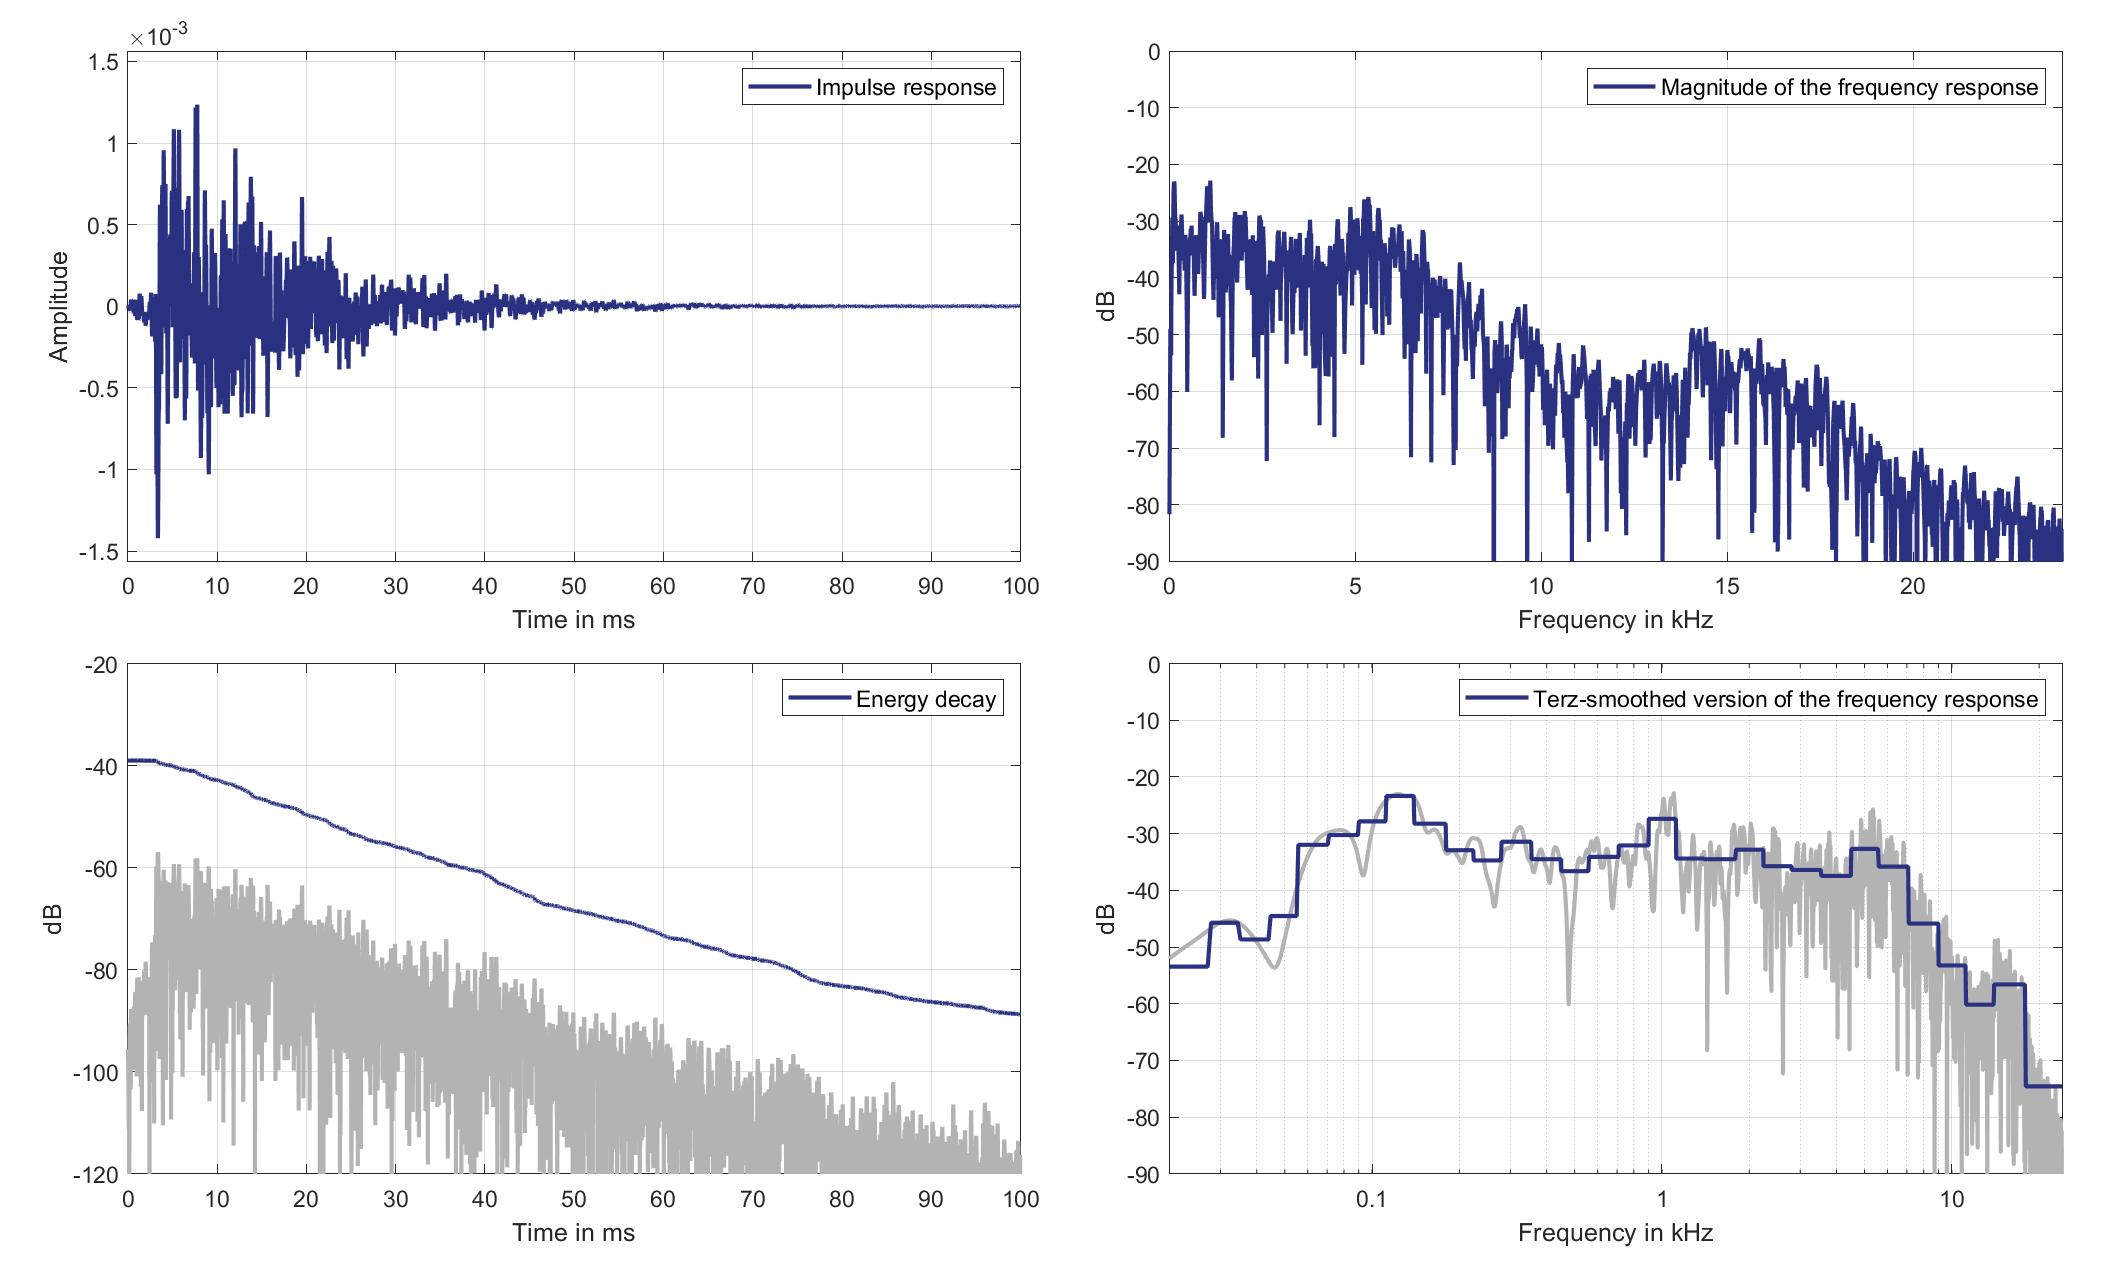
Download impulse response (in ".fir" format).
In the download section you can download all impulse response files as well as format explanation and Matlab as well as Python code examples for loading fir files.
Mic. 17
Mouth Loudspeaker of Zone 3 (Lsp. 14) to Standard Car Microphone 17 (Mic. 17)
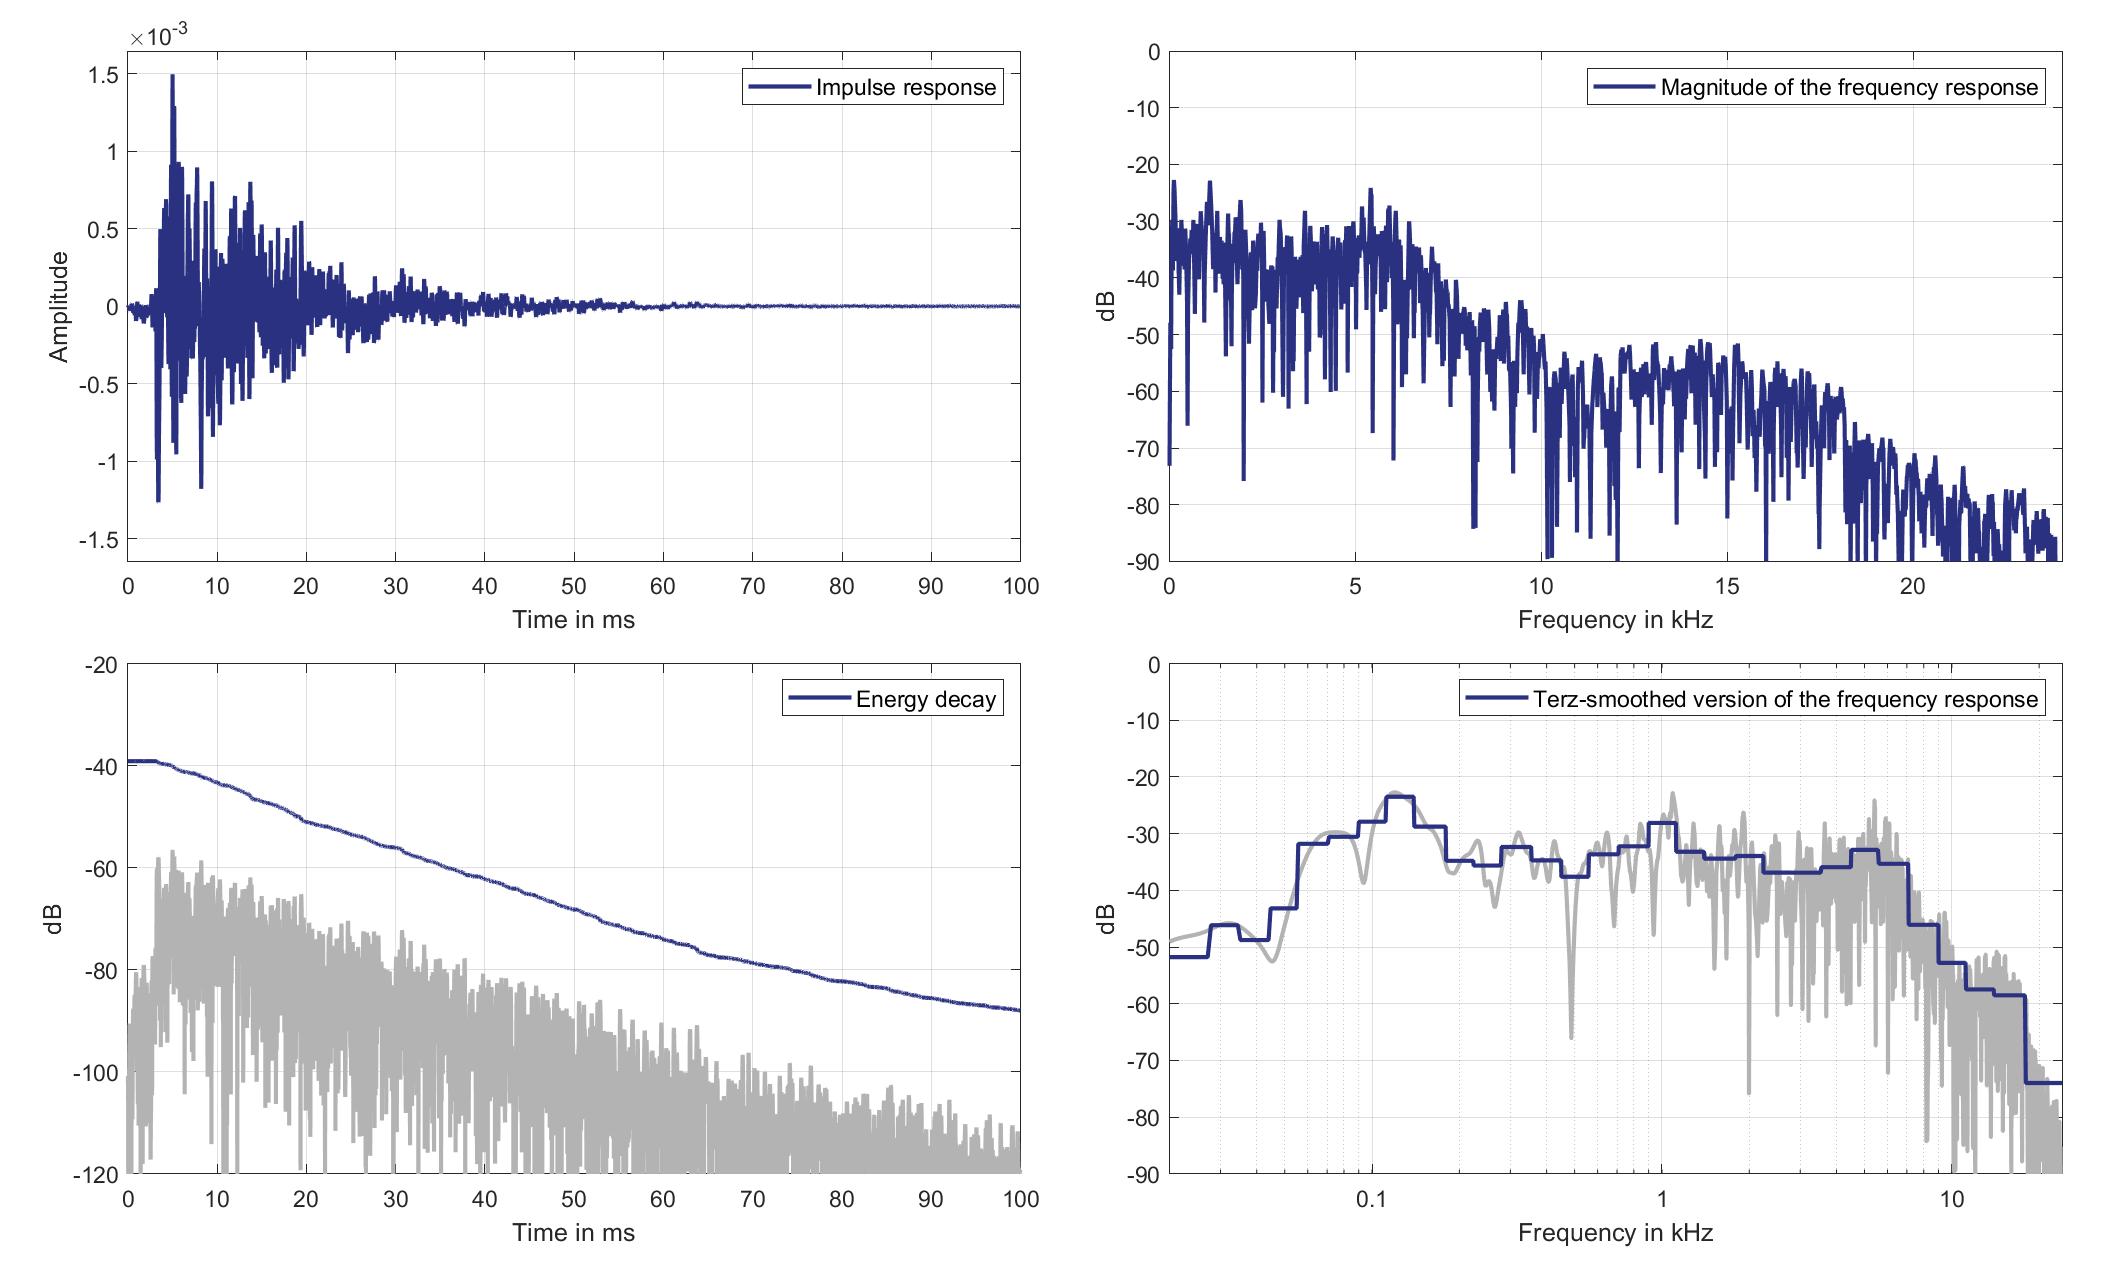
Download impulse response (in ".fir" format).
In the download section you can download all impulse response files as well as format explanation and Matlab as well as Python code examples for loading fir files.
Mic. 18
Mouth Loudspeaker of Zone 3 (Lsp. 14) to Standard Car Microphone 18 (Mic. 18)
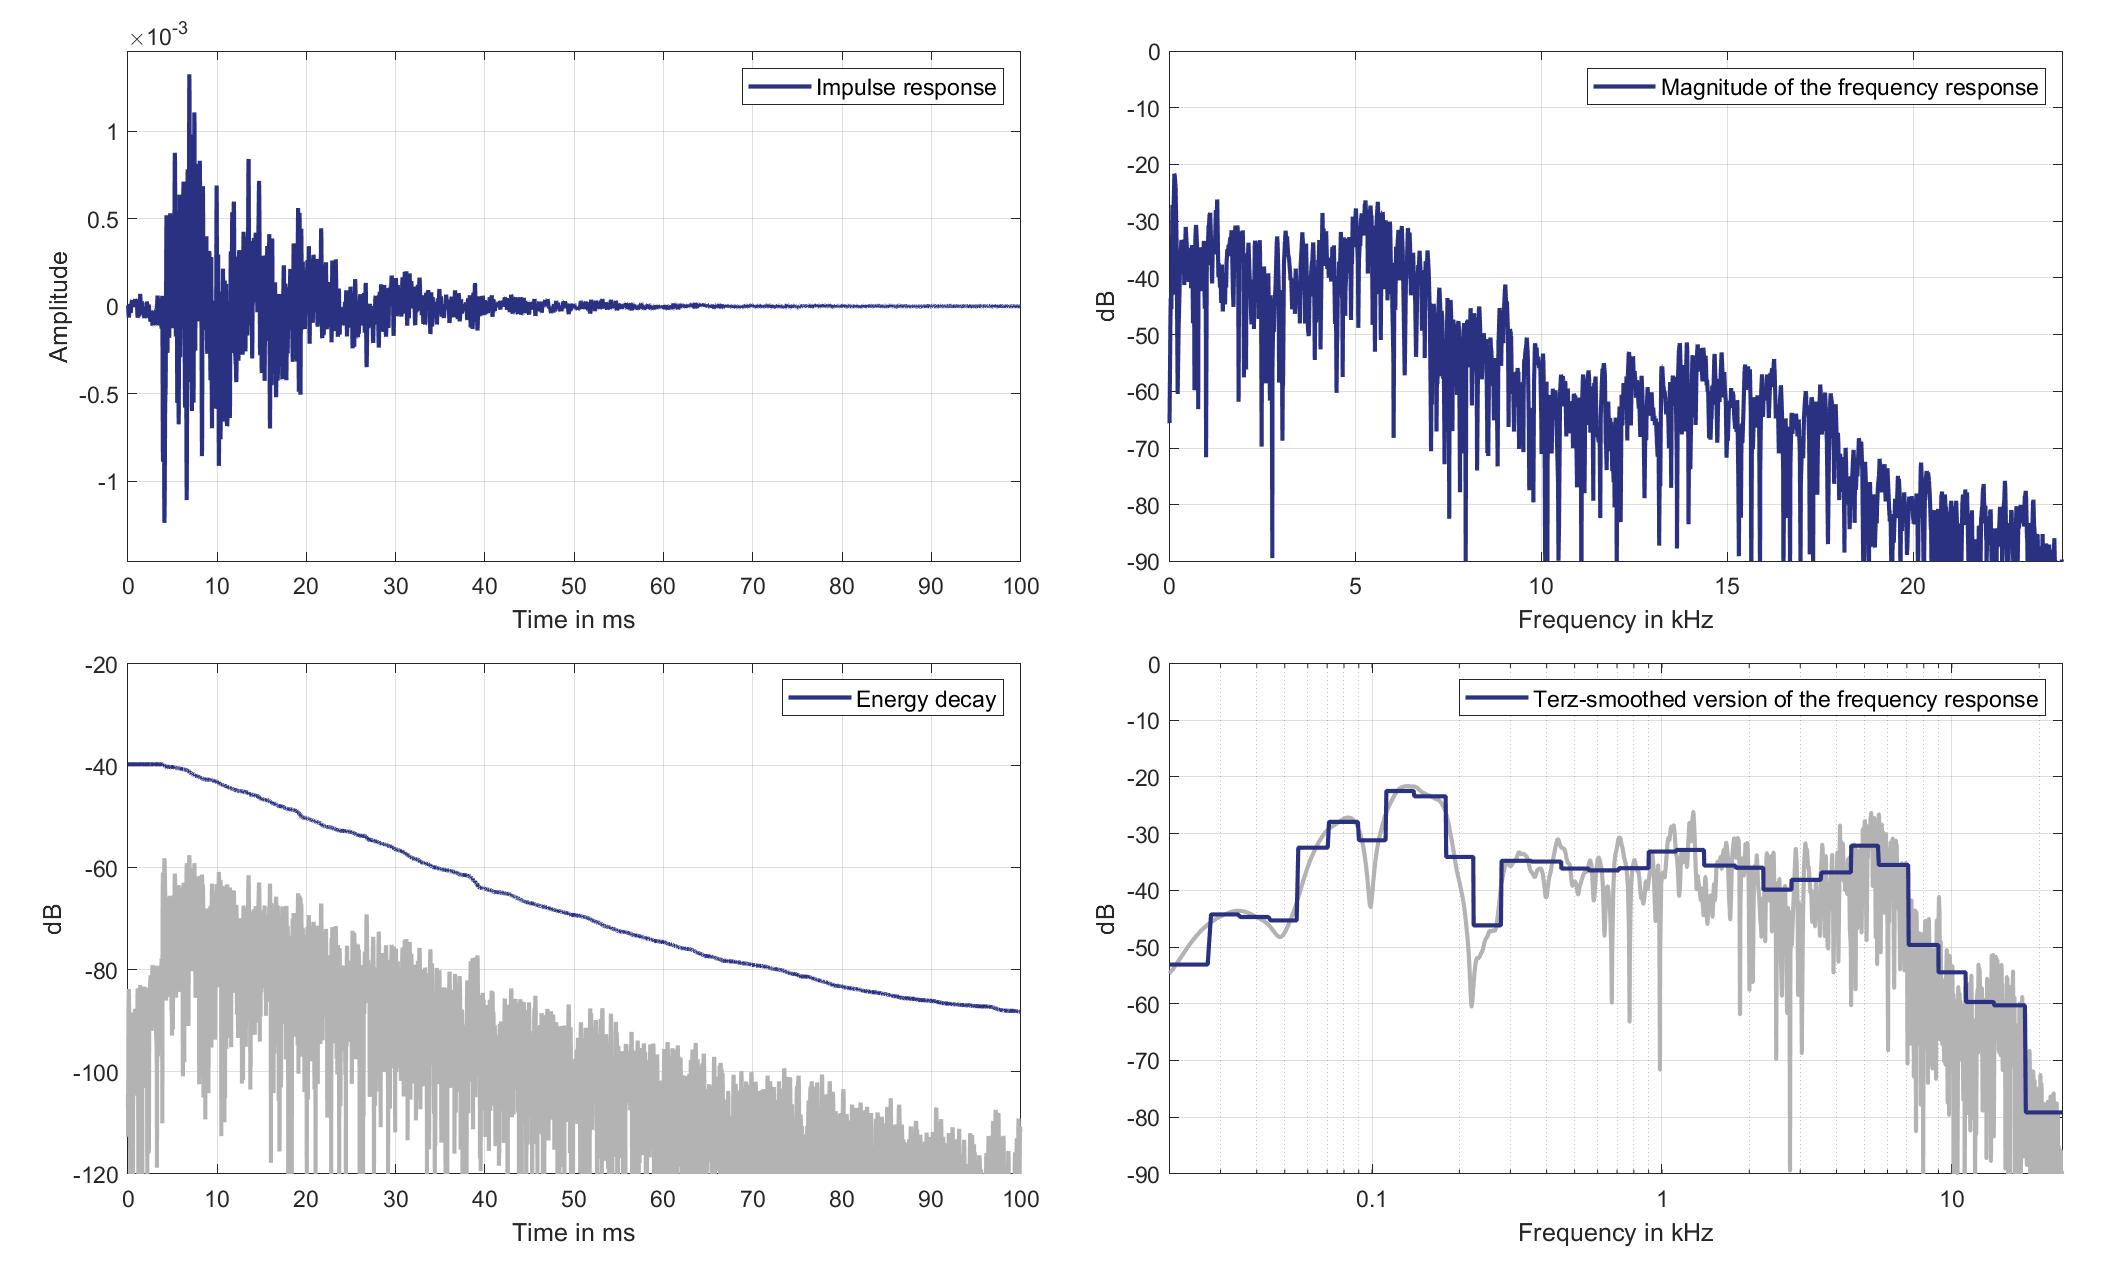
Download impulse response (in ".fir" format).
In the download section you can download all impulse response files as well as format explanation and Matlab as well as Python code examples for loading fir files.
Lsp. 15
Mic. 0
Mouth Loudspeaker of Zone 5 (Lsp. 15) to Standard Car Microphone 0 (Mic. 0)
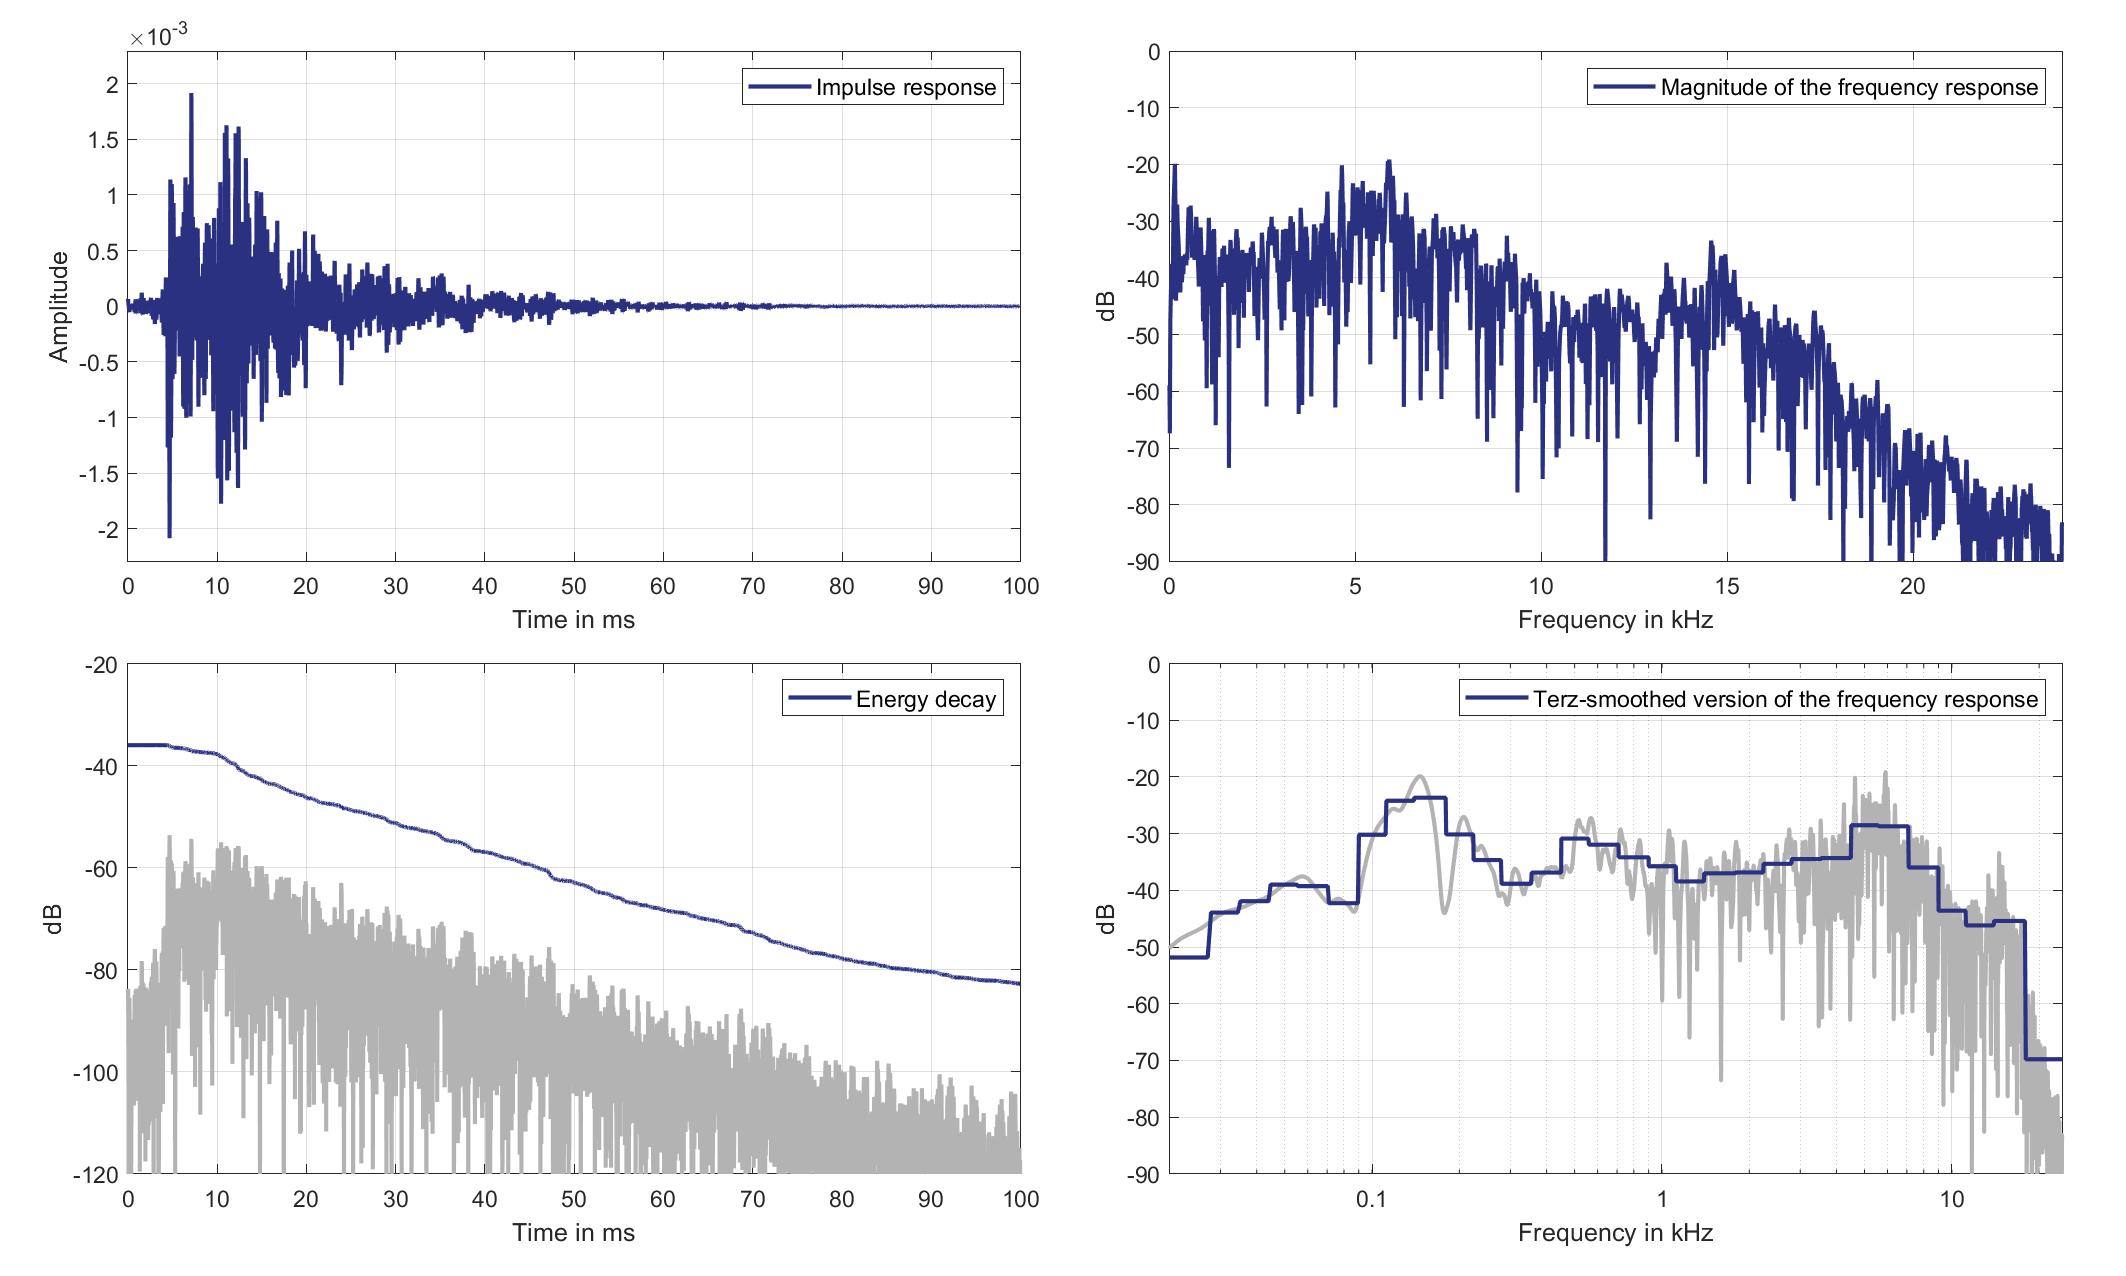
Download impulse response (in ".fir" format).
In the download section you can download all impulse response files as well as format explanation and Matlab as well as Python code examples for loading fir files.
Mic. 1
Mouth Loudspeaker of Zone 5 (Lsp. 15) to Standard Car Microphone 1 (Mic. 1)
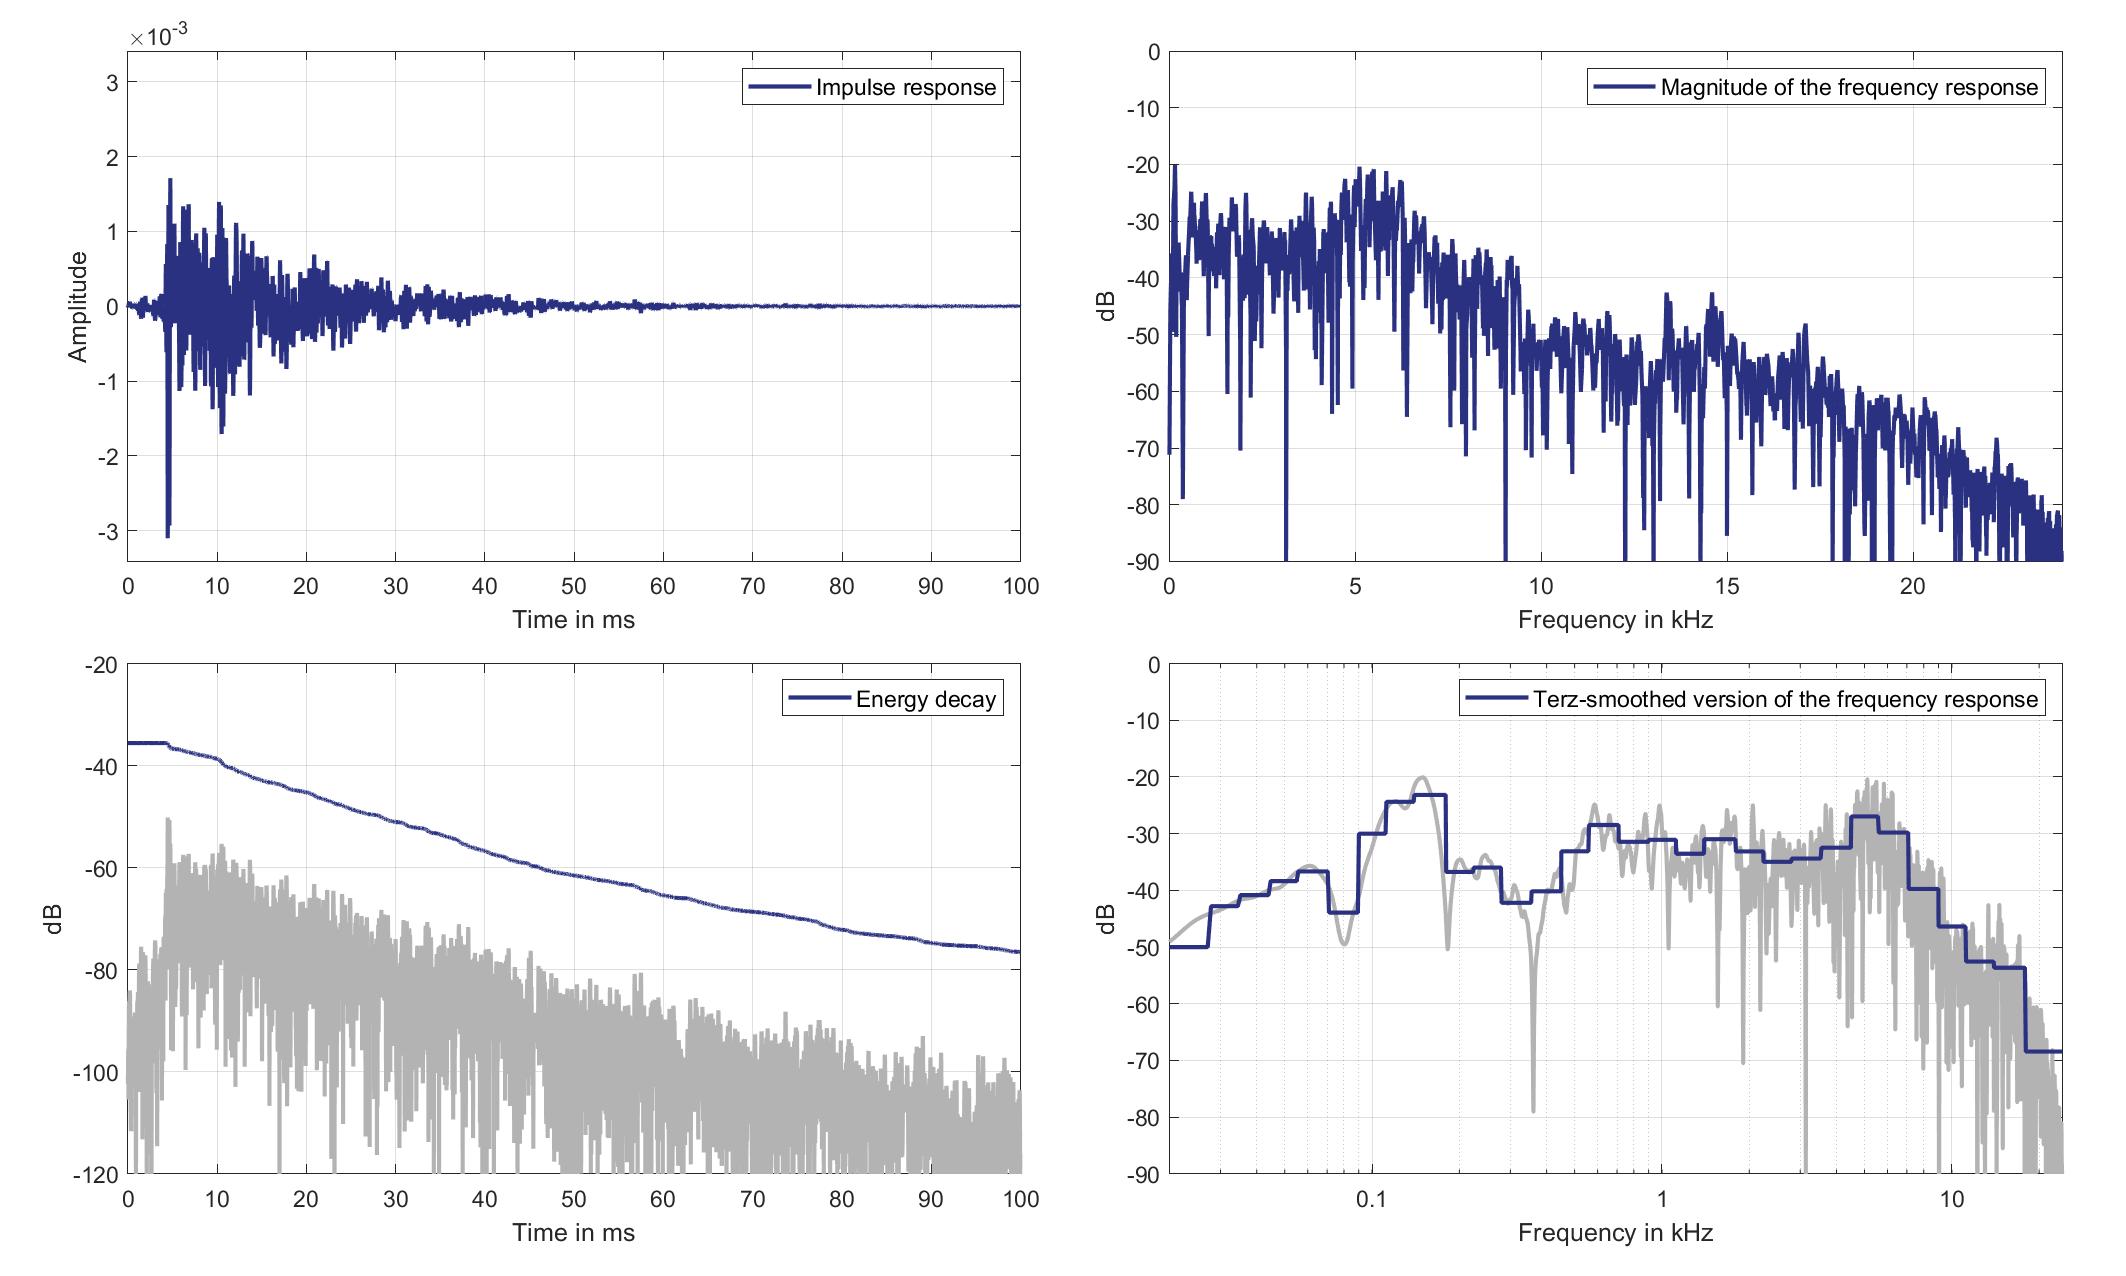
Download impulse response (in ".fir" format).
In the download section you can download all impulse response files as well as format explanation and Matlab as well as Python code examples for loading fir files.
Mic. 2
Mouth Loudspeaker of Zone 5 (Lsp. 15) to Standard Car Microphone 2 (Mic. 2)
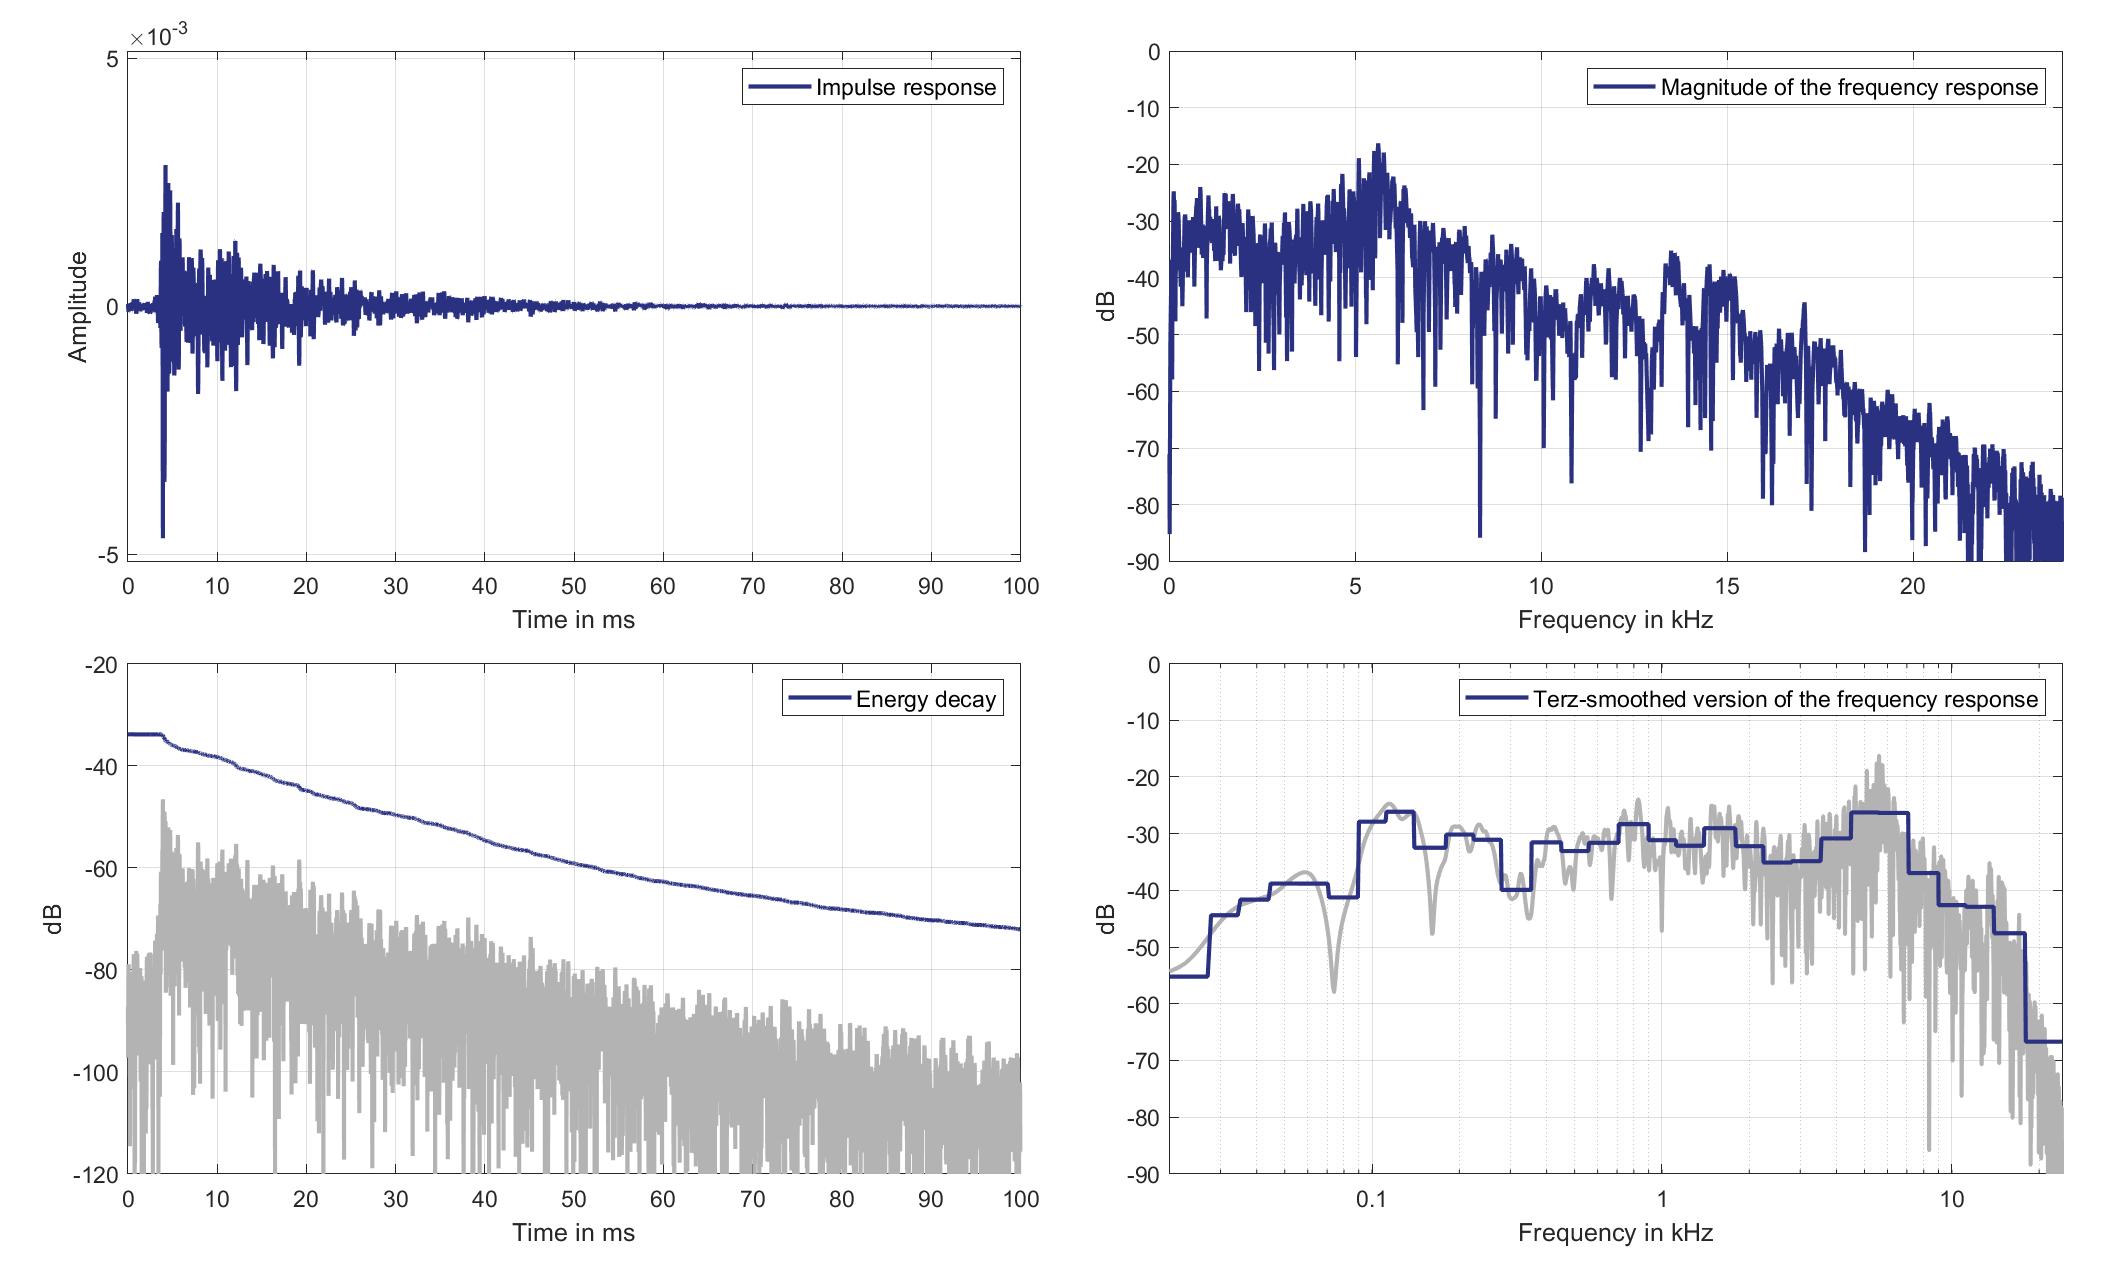
Download impulse response (in ".fir" format).
In the download section you can download all impulse response files as well as format explanation and Matlab as well as Python code examples for loading fir files.
Mic. 3
Mouth Loudspeaker of Zone 5 (Lsp. 15) to Standard Car Microphone 3 (Mic. 3)
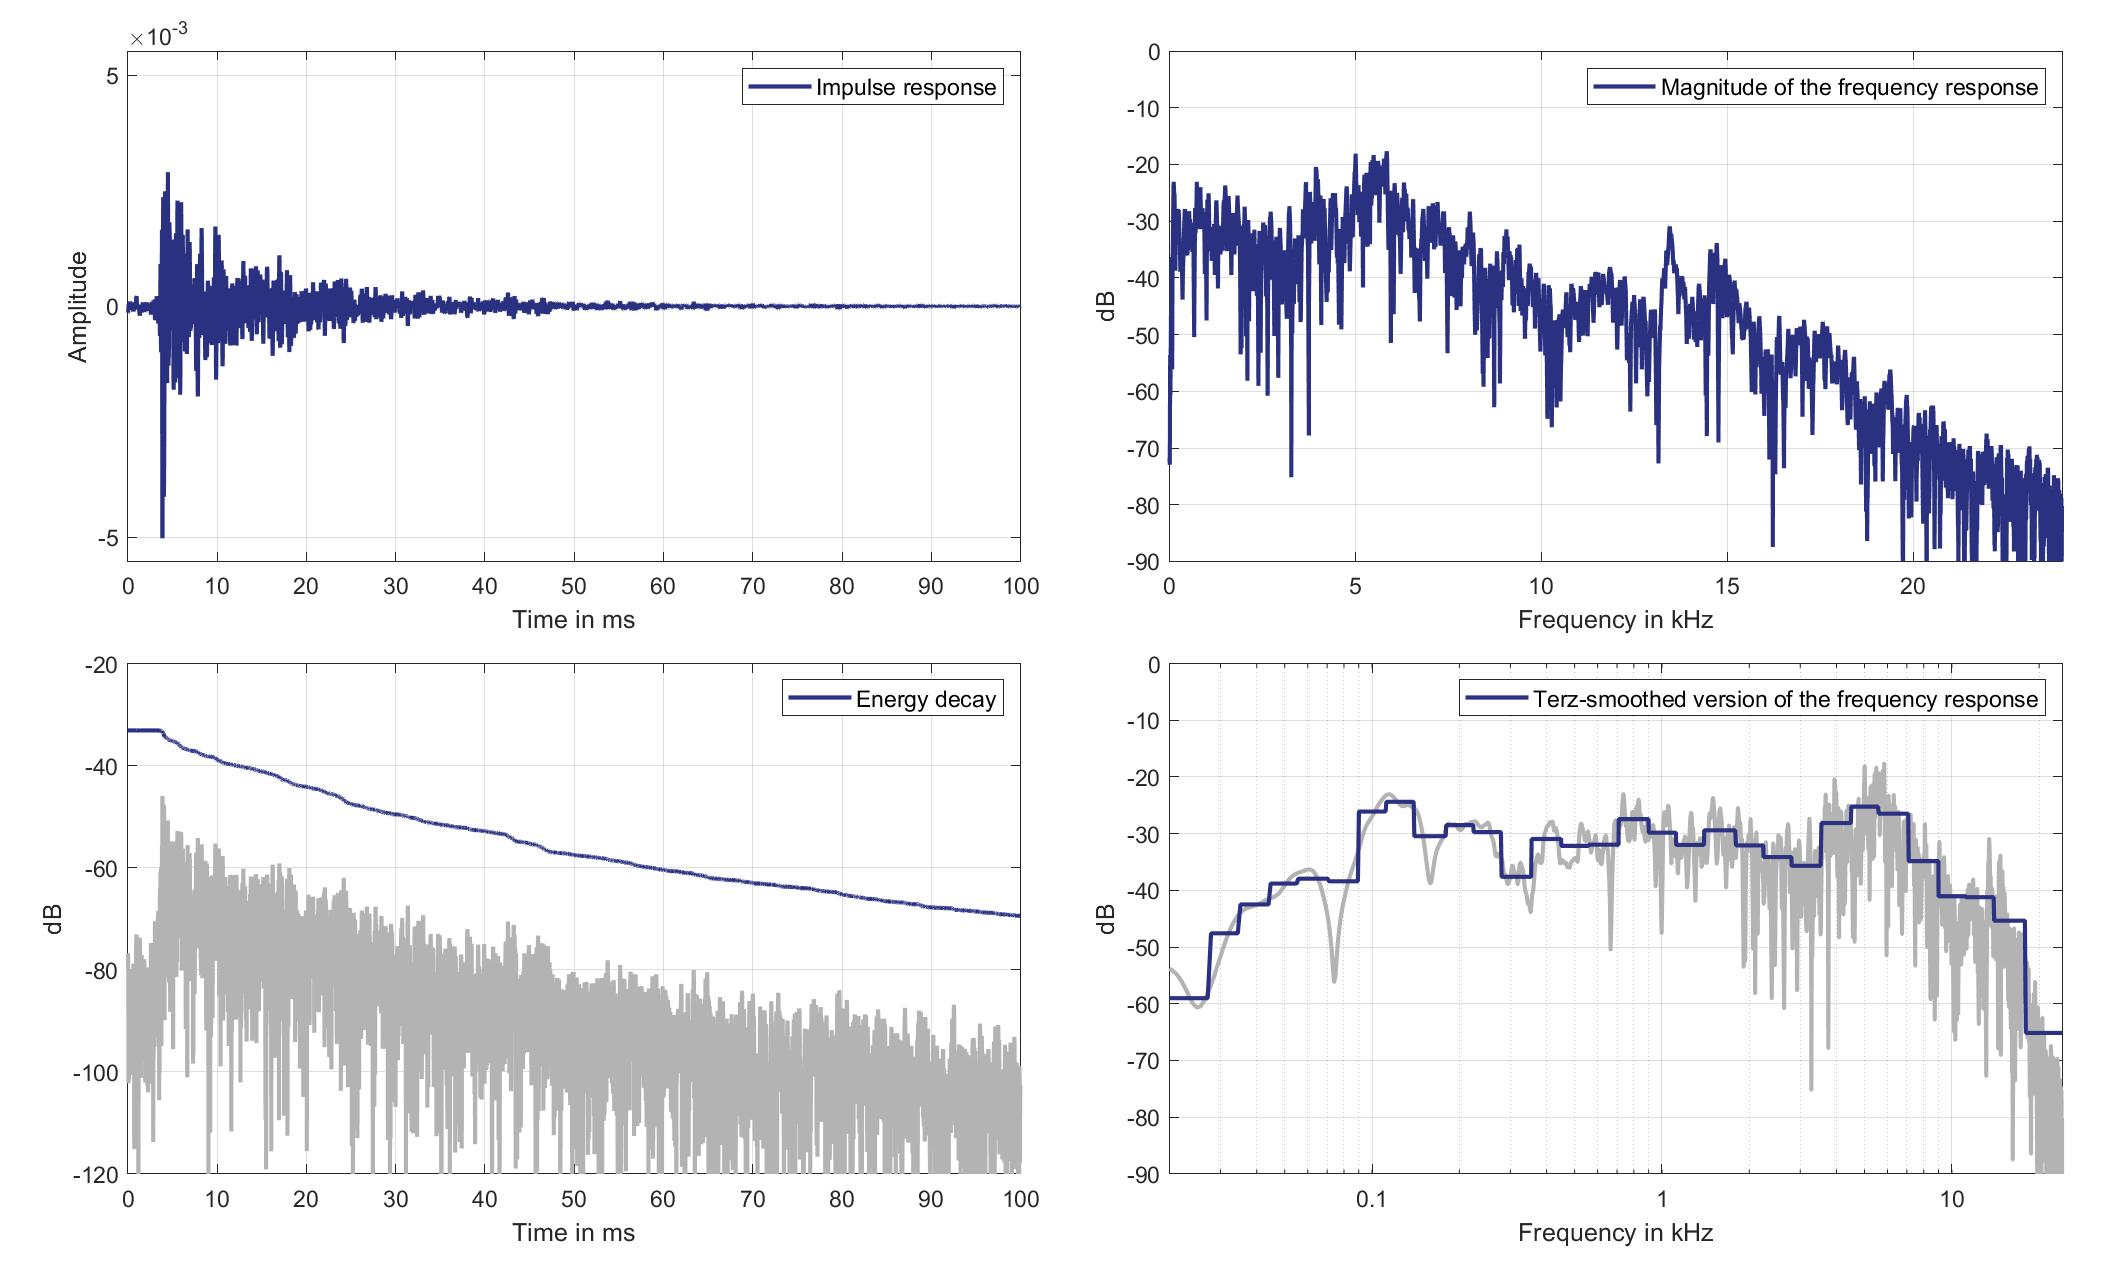
Download impulse response (in ".fir" format).
In the download section you can download all impulse response files as well as format explanation and Matlab as well as Python code examples for loading fir files.
Mic. 4
Mouth Loudspeaker of Zone 5 (Lsp. 15) to Standard Car Microphone 4 (Mic. 4)
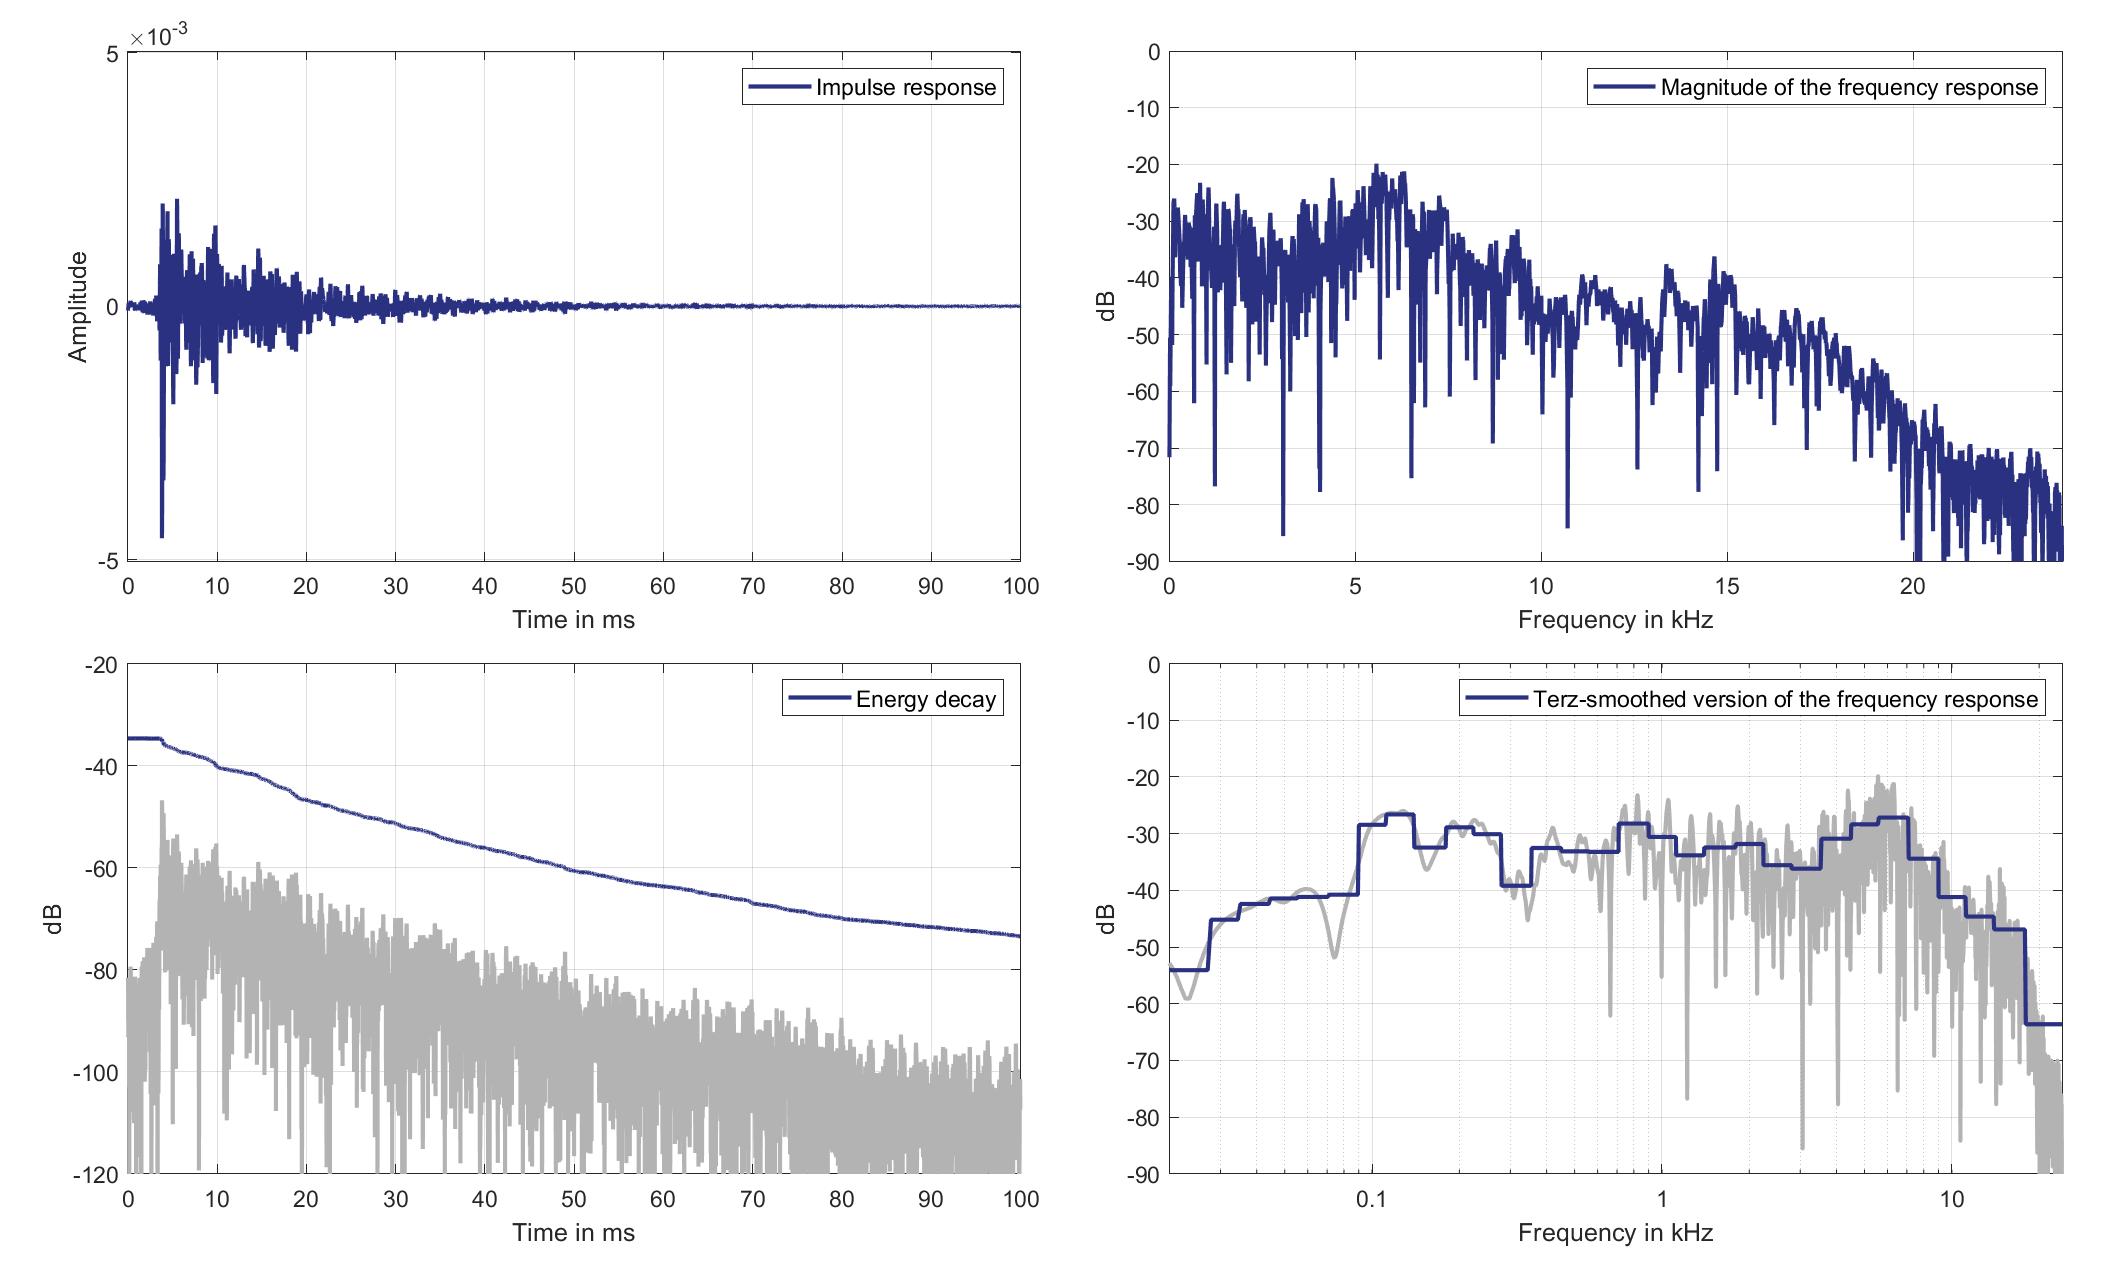
Download impulse response (in ".fir" format).
In the download section you can download all impulse response files as well as format explanation and Matlab as well as Python code examples for loading fir files.
Mic. 5
Mouth Loudspeaker of Zone 5 (Lsp. 15) to Standard Car Microphone 5 (Mic. 5)
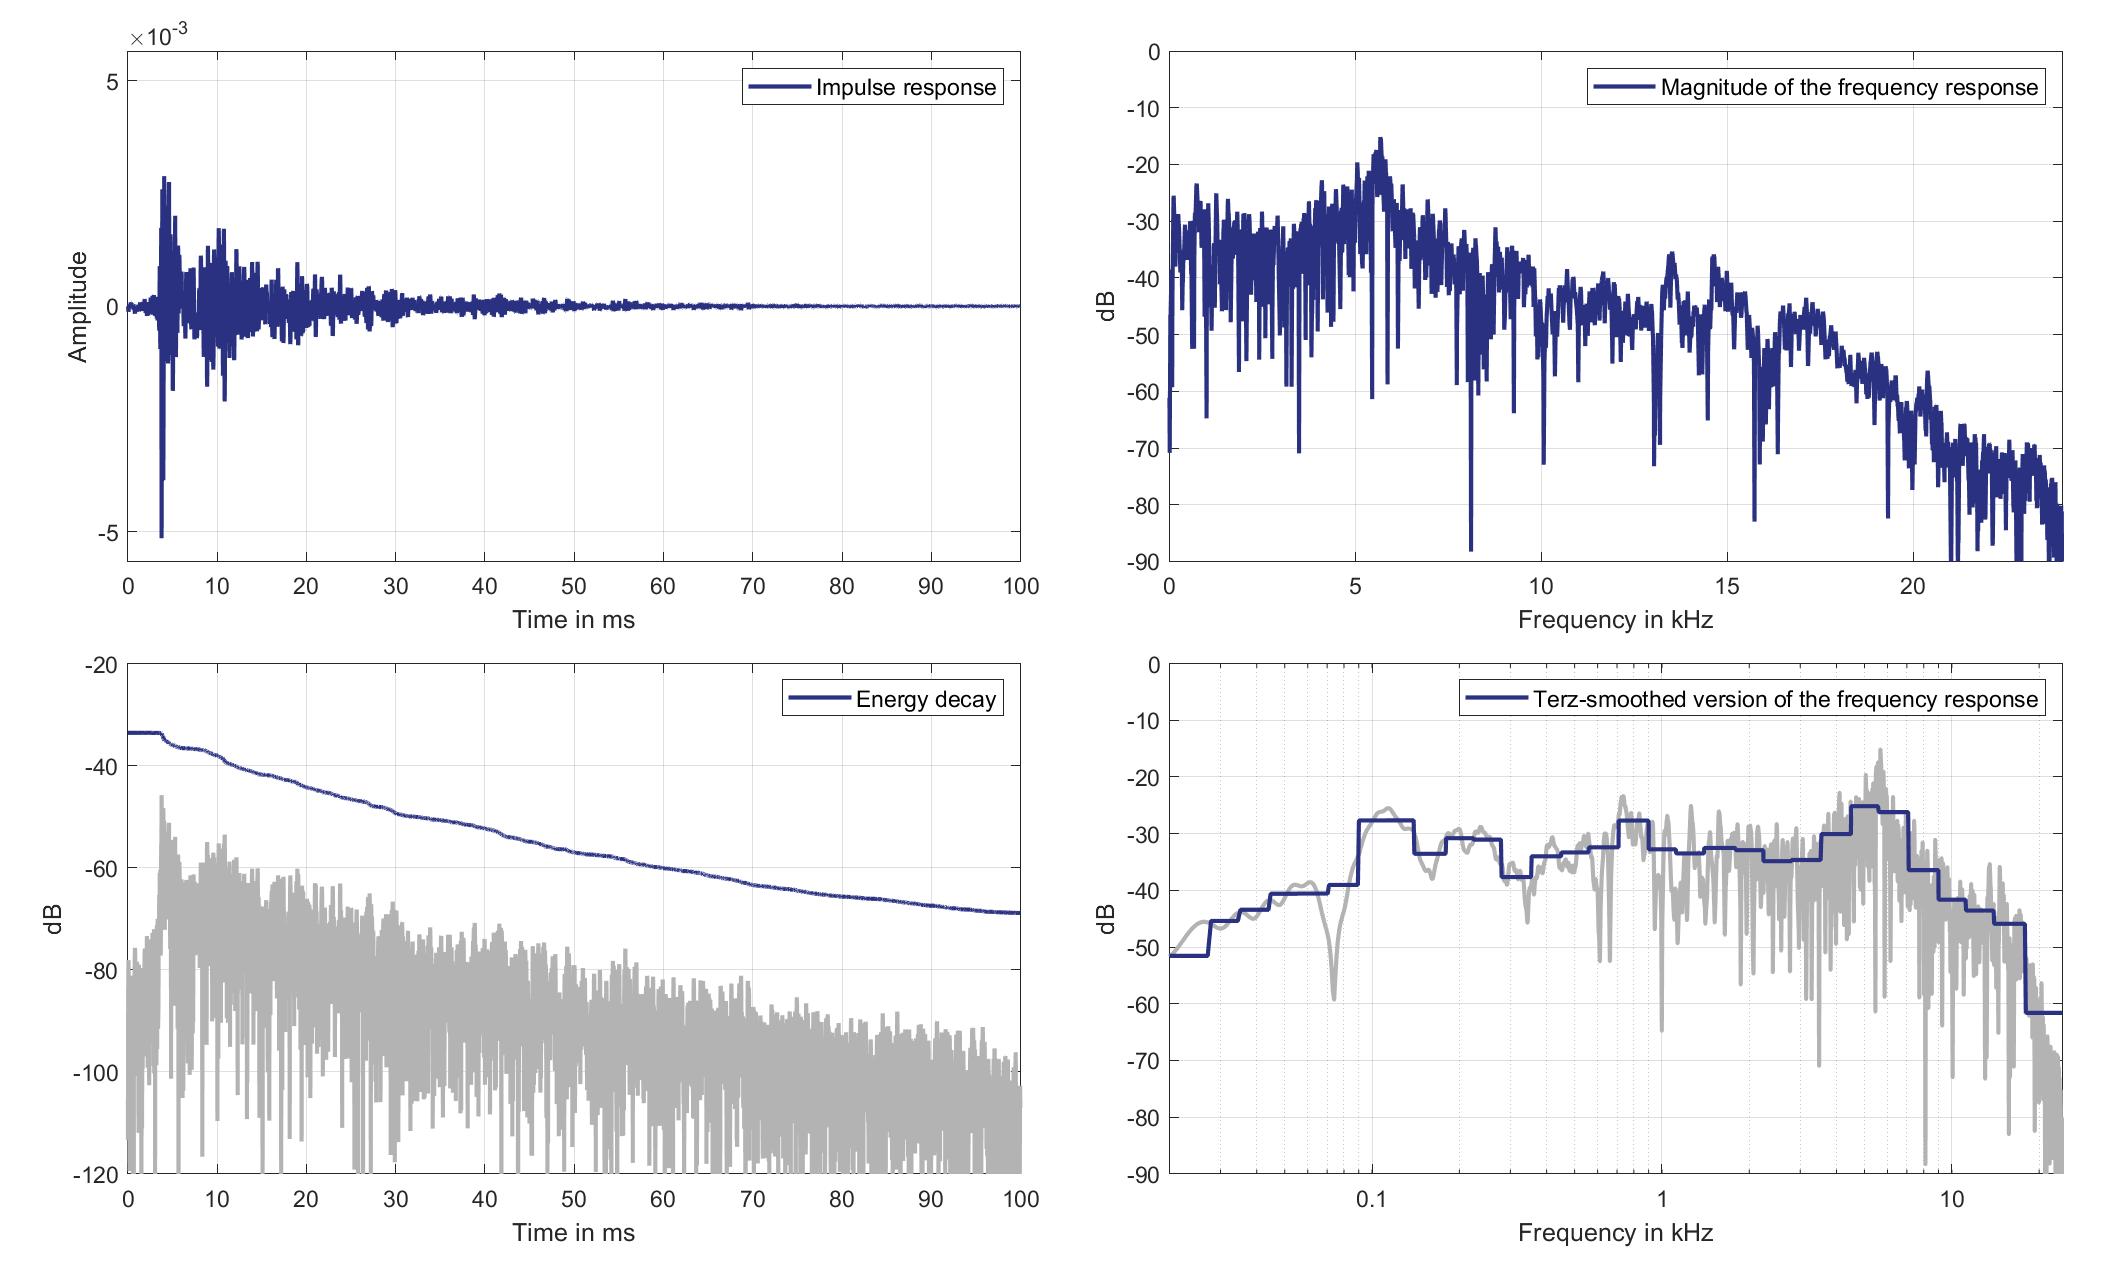
Download impulse response (in ".fir" format).
In the download section you can download all impulse response files as well as format explanation and Matlab as well as Python code examples for loading fir files.
Mic. 6
Mouth Loudspeaker of Zone 5 (Lsp. 15) to Standard Car Microphone 6 (Mic. 6)
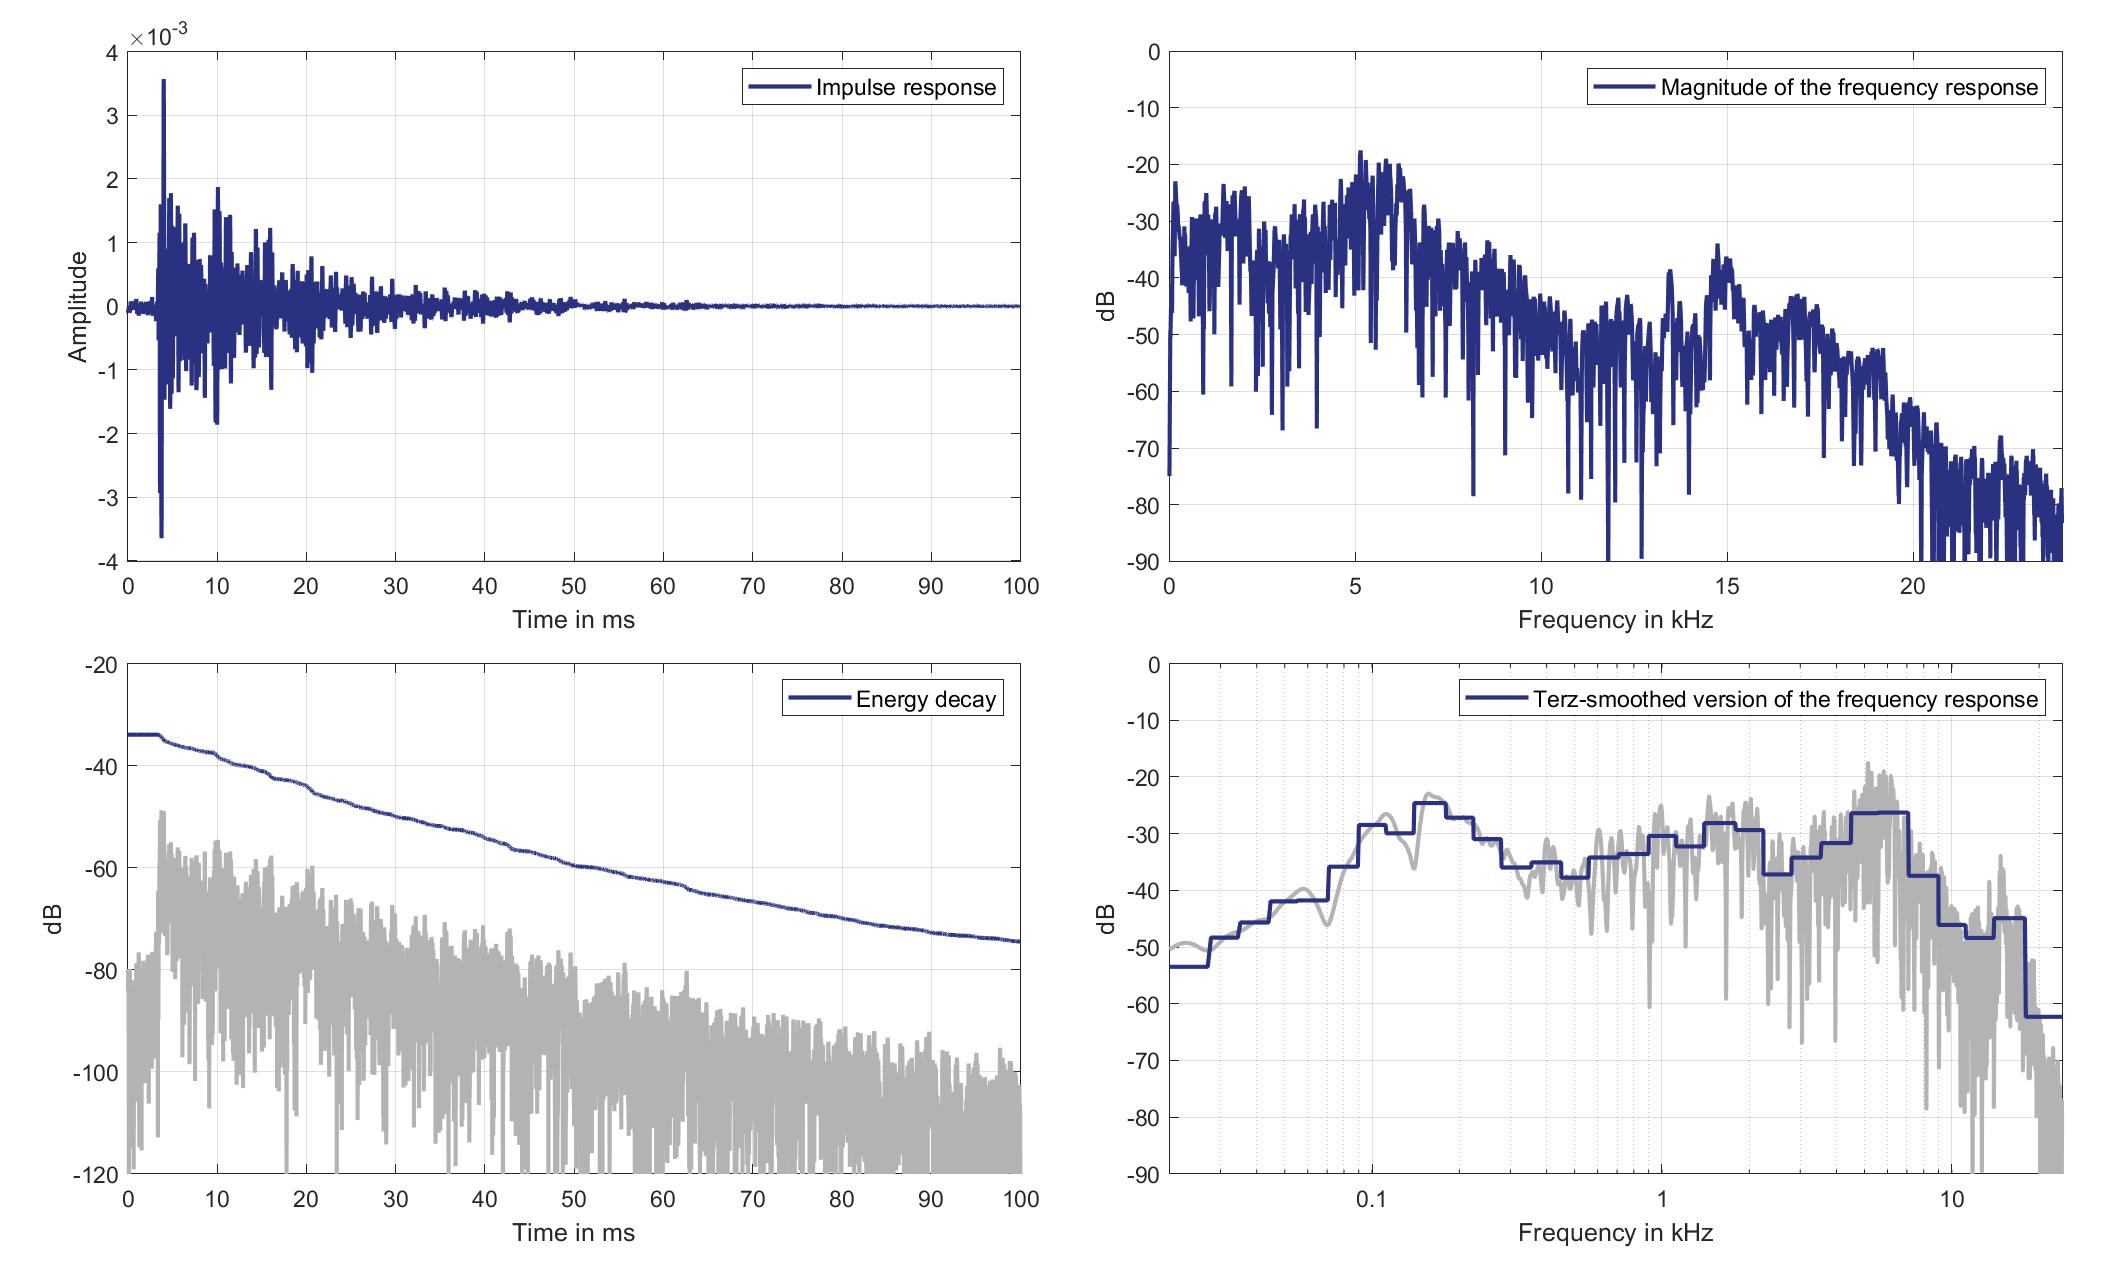
Download impulse response (in ".fir" format).
In the download section you can download all impulse response files as well as format explanation and Matlab as well as Python code examples for loading fir files.
Mic. 7
Mouth Loudspeaker of Zone 5 (Lsp. 15) to Standard Car Microphone 7 (Mic. 7)
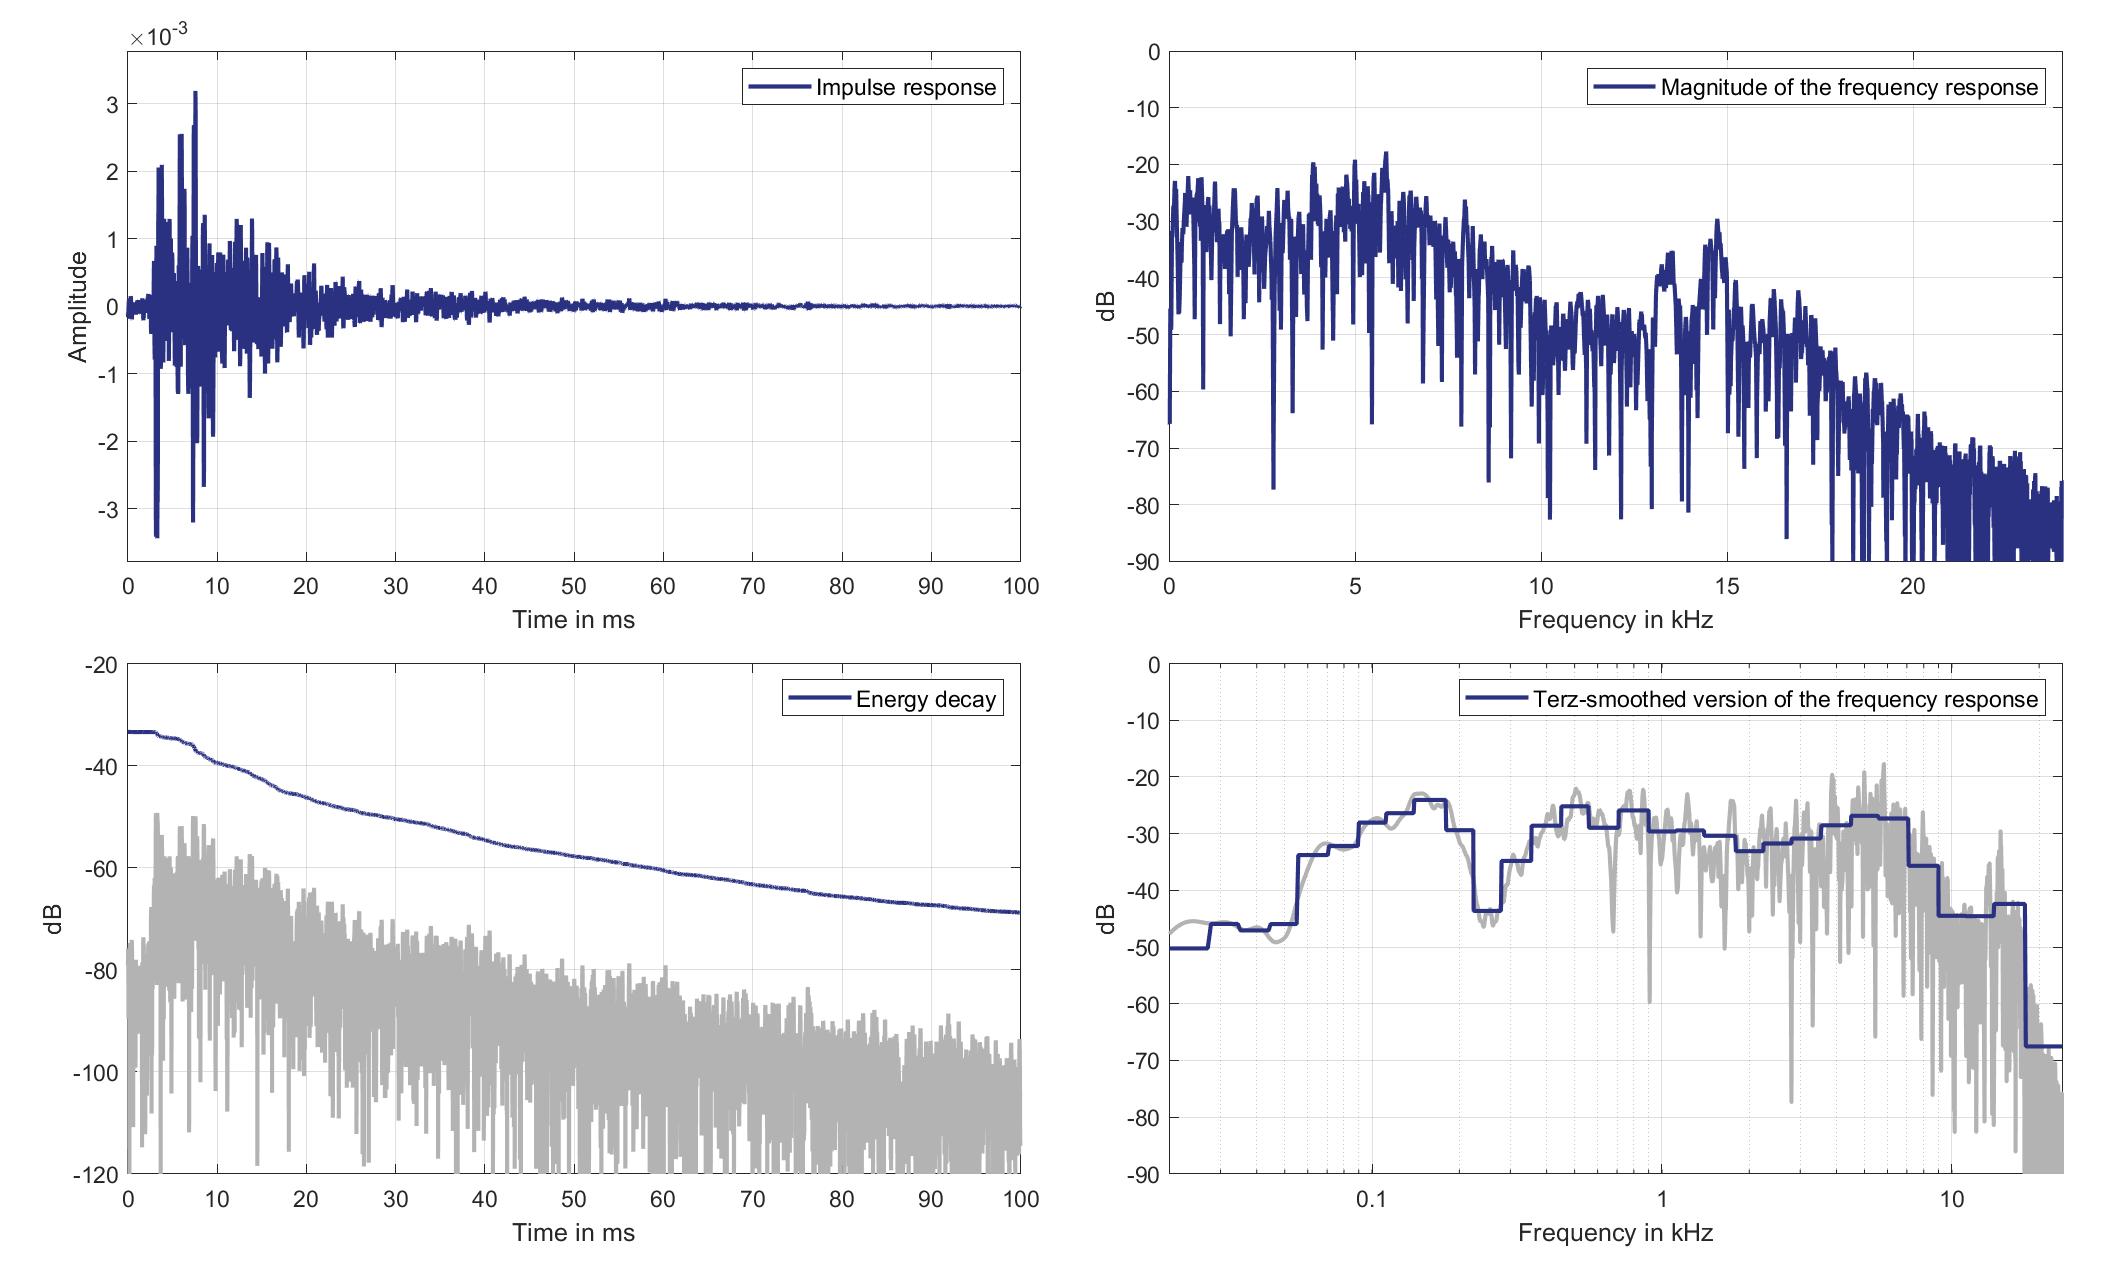
Download impulse response (in ".fir" format).
In the download section you can download all impulse response files as well as format explanation and Matlab as well as Python code examples for loading fir files.
Mic. 8
Mouth Loudspeaker of Zone 5 (Lsp. 15) to Standard Car Microphone 8 (Mic. 8)
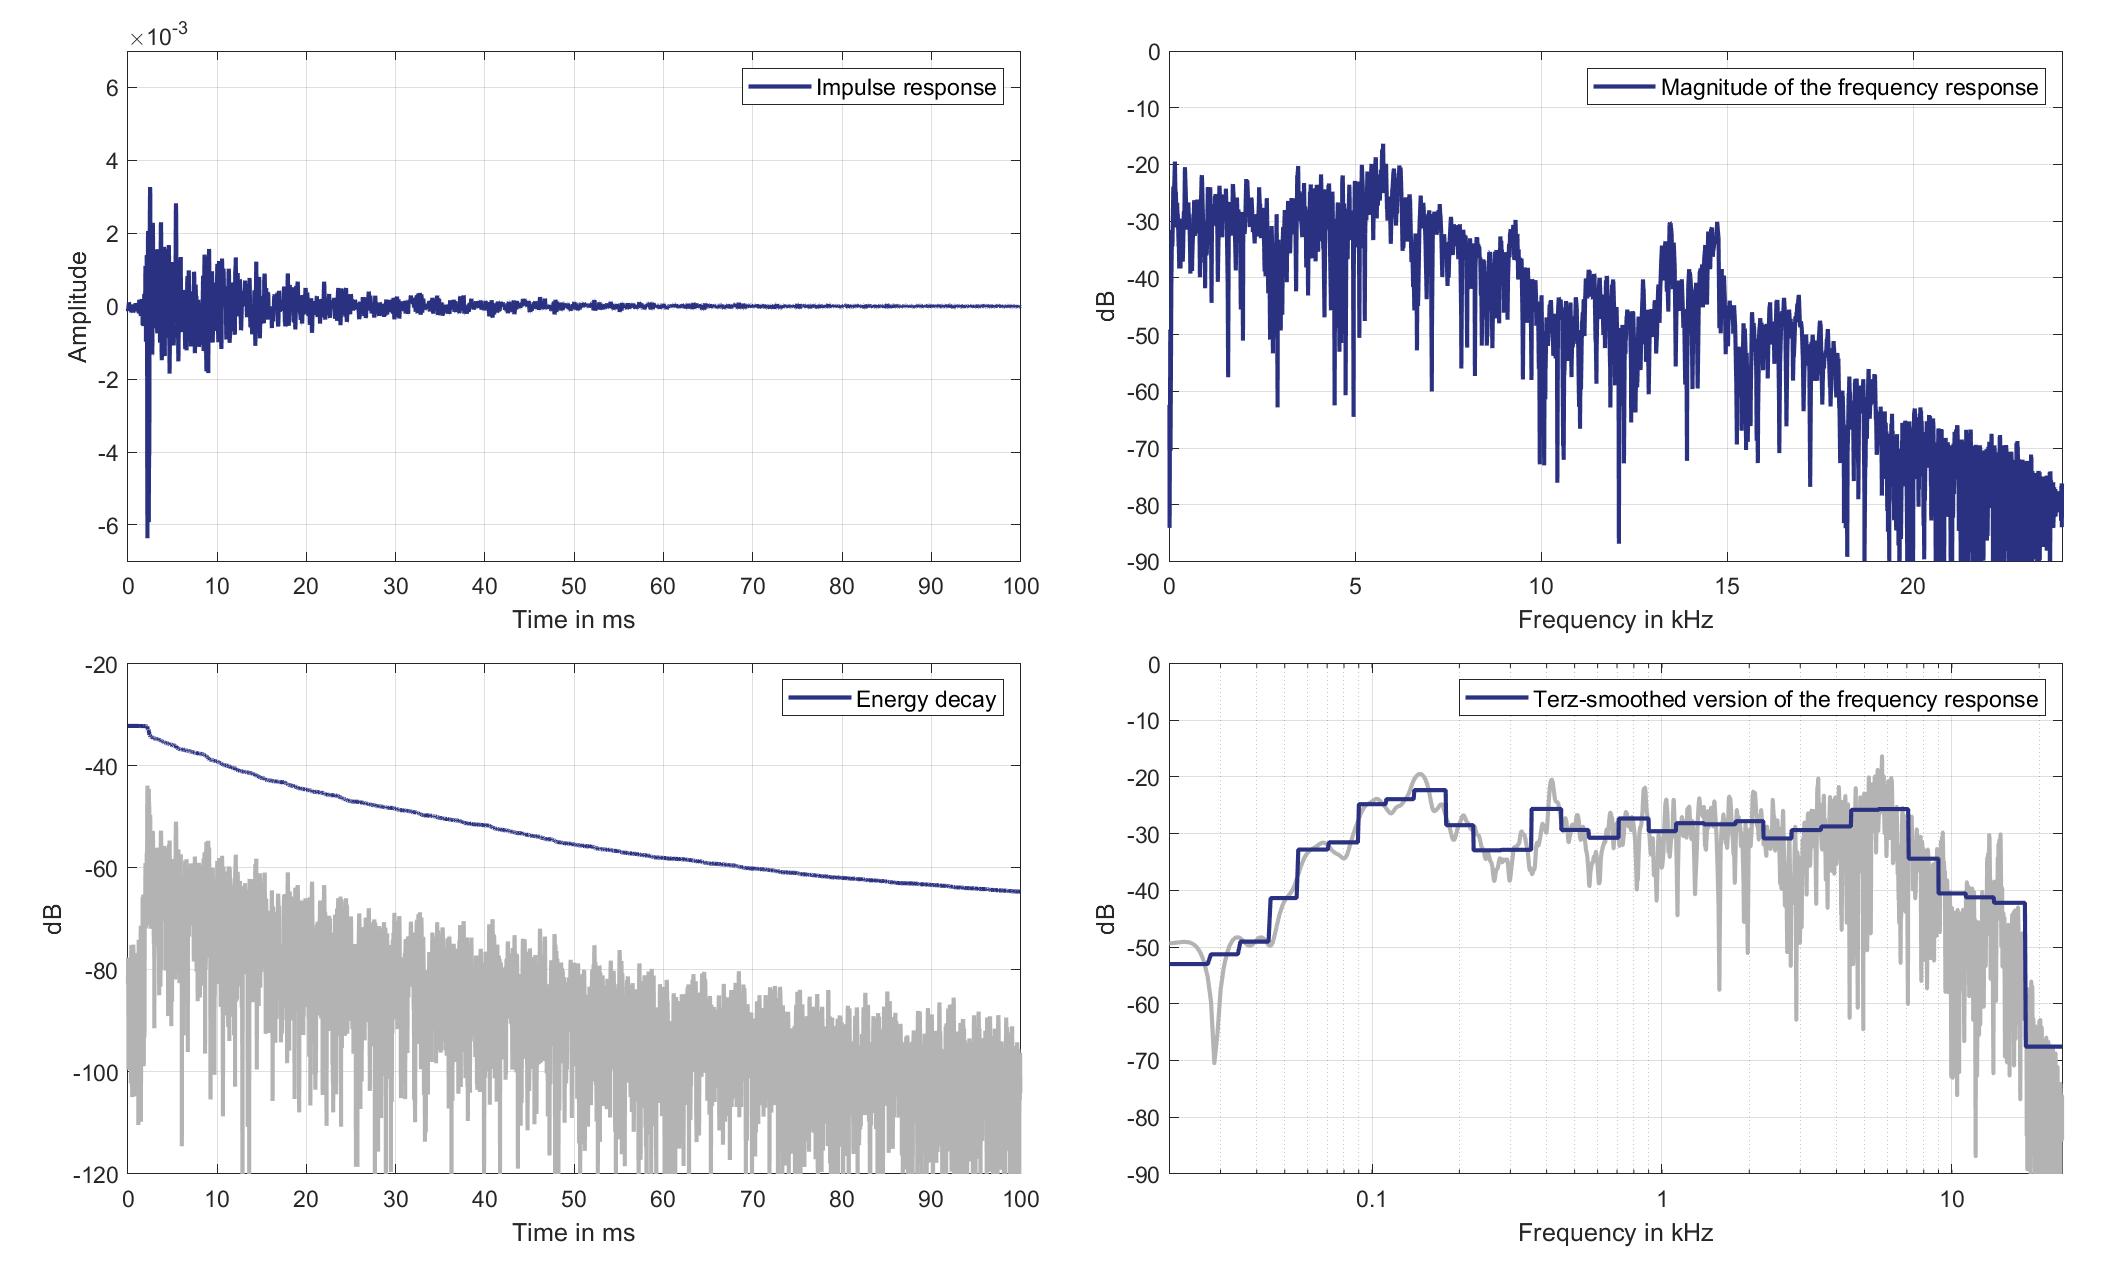
Download impulse response (in ".fir" format).
In the download section you can download all impulse response files as well as format explanation and Matlab as well as Python code examples for loading fir files.
Mic. 9
Mouth Loudspeaker of Zone 5 (Lsp. 15) to Standard Car Microphone 9 (Mic. 9)
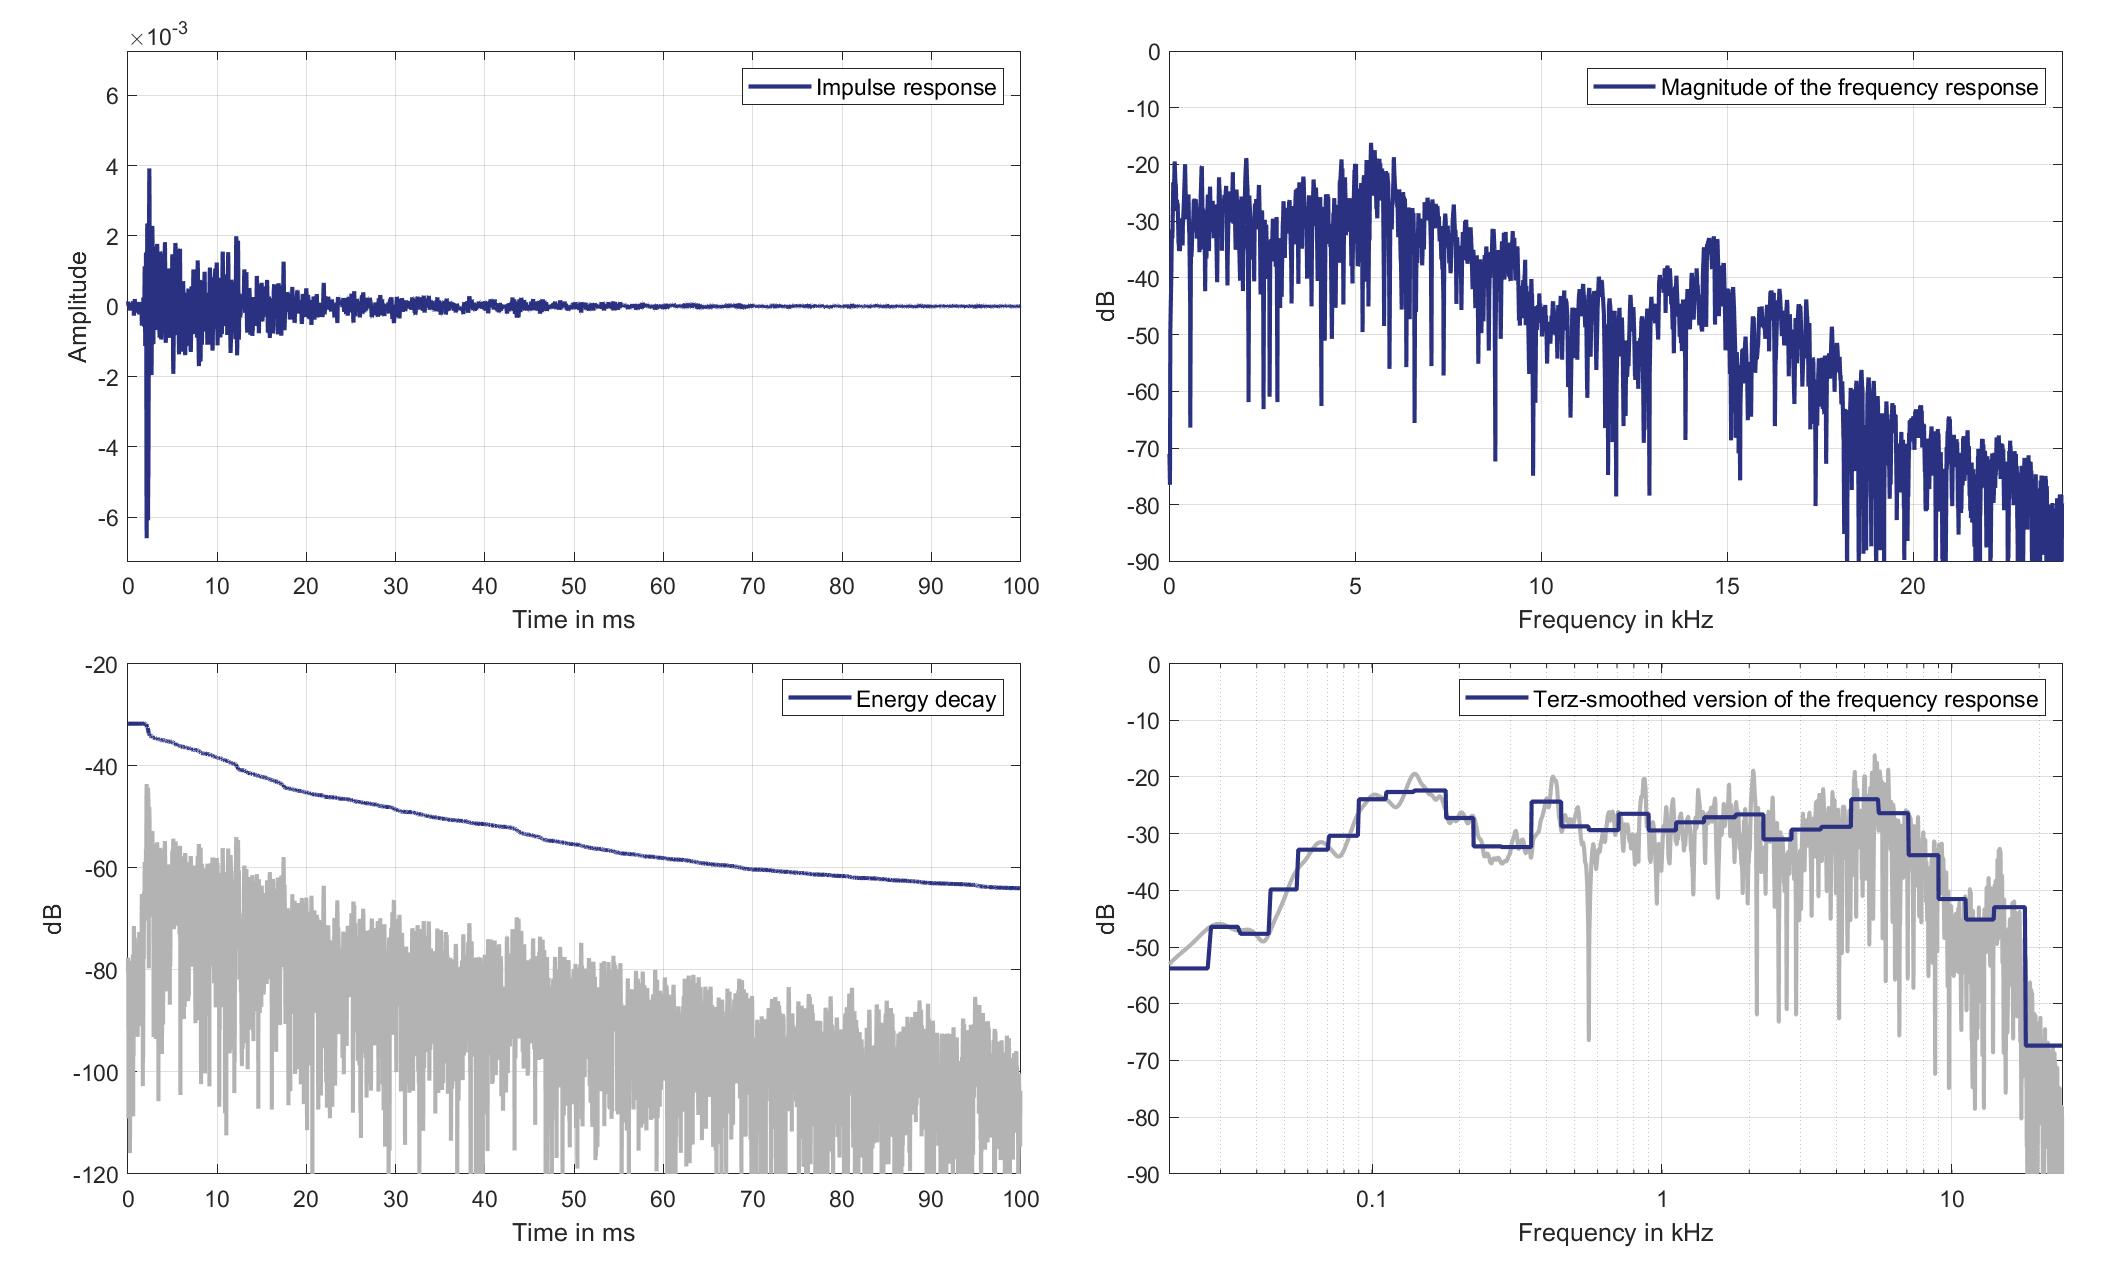
Download impulse response (in ".fir" format).
In the download section you can download all impulse response files as well as format explanation and Matlab as well as Python code examples for loading fir files.
Mic. 10
Mouth Loudspeaker of Zone 5 (Lsp. 15) to Standard Car Microphone 10 (Mic. 10)
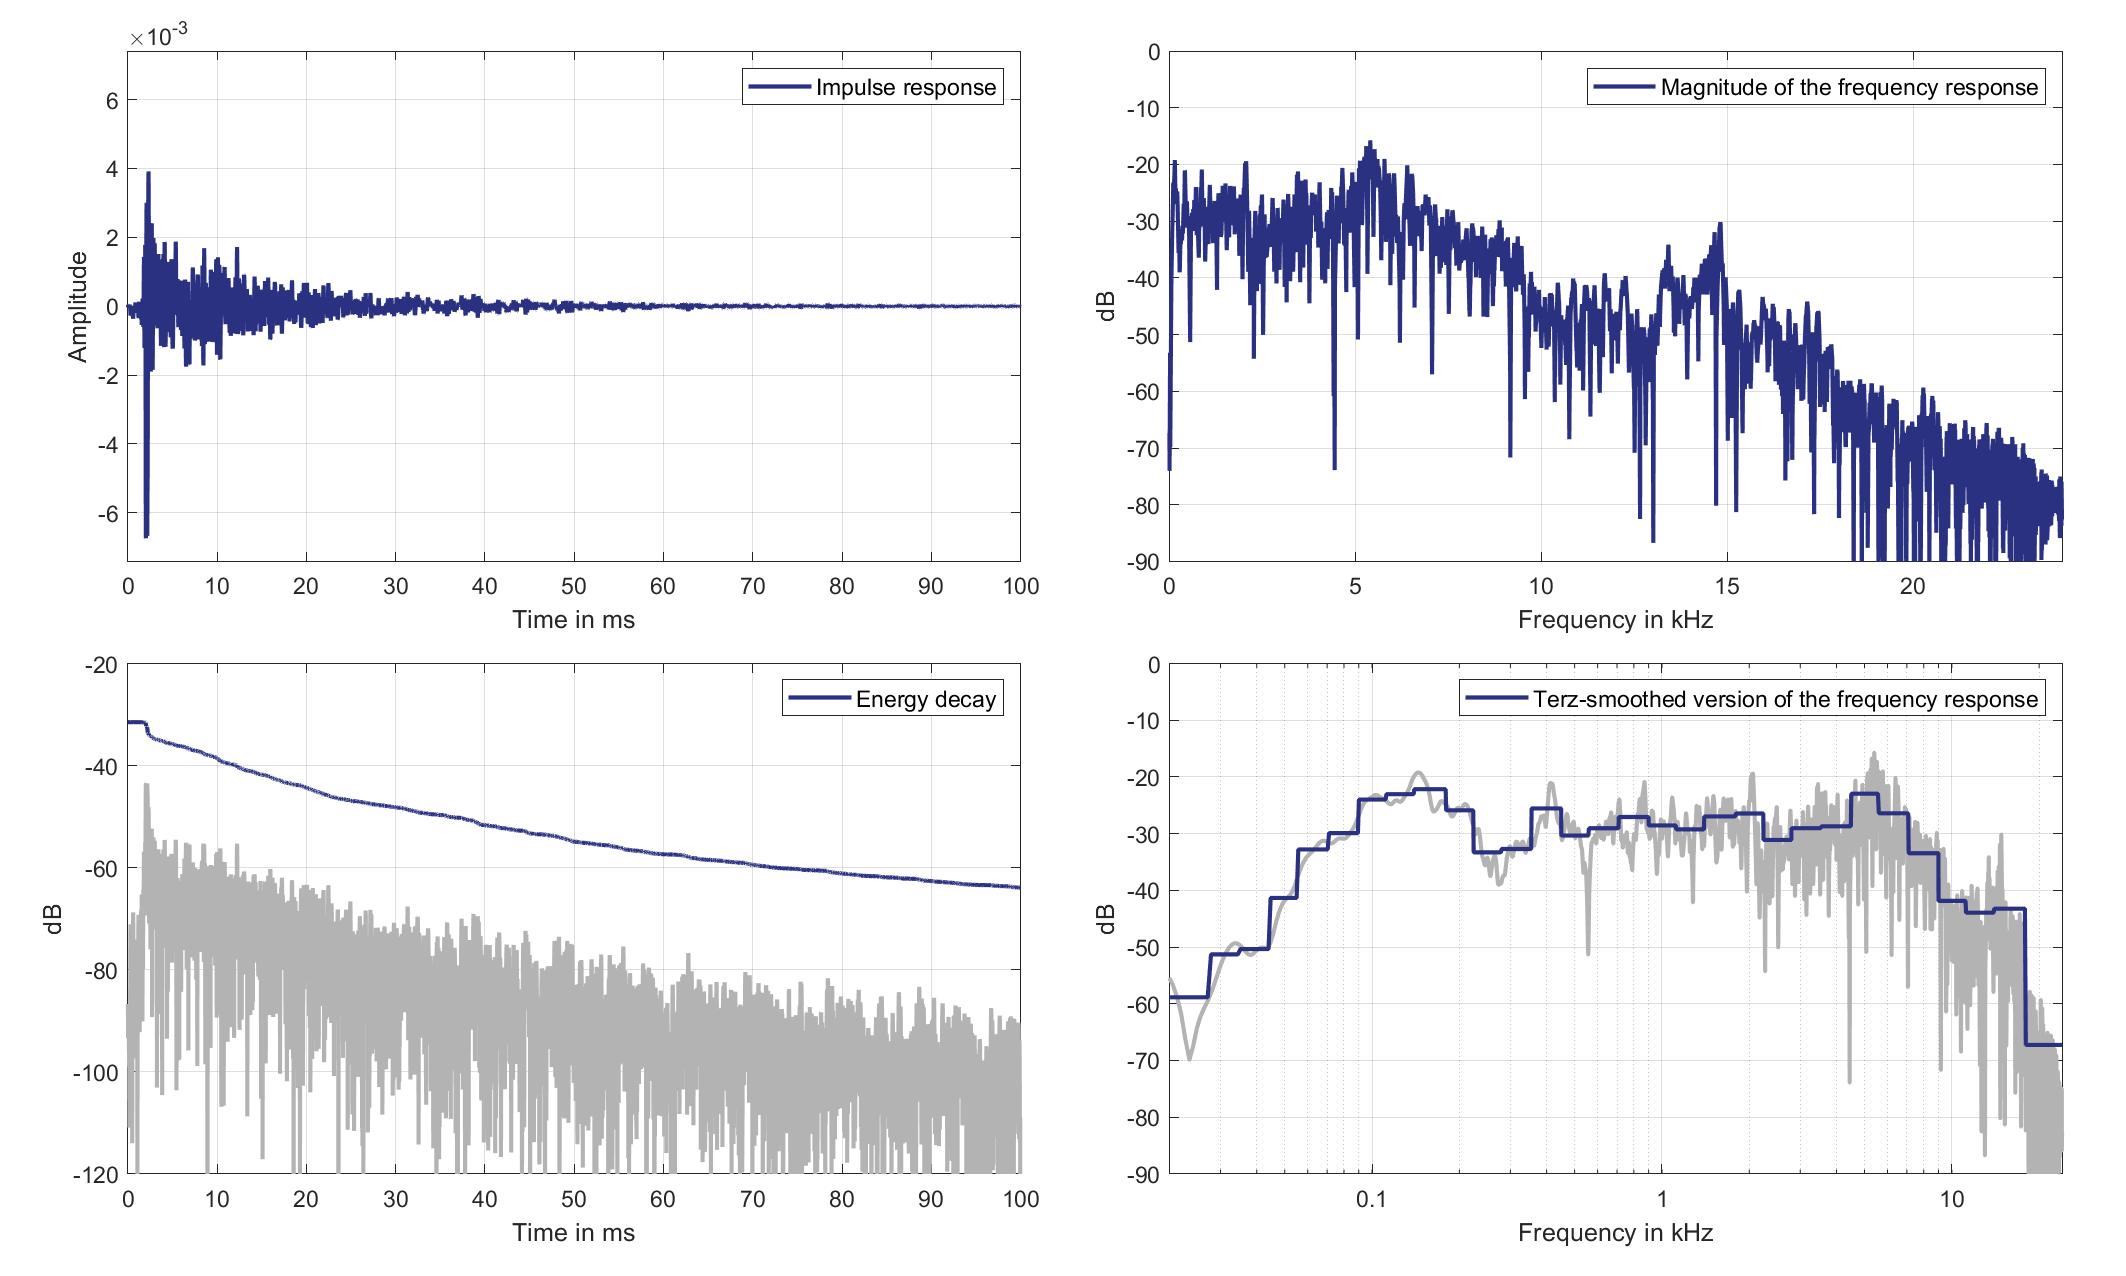
Download impulse response (in ".fir" format).
In the download section you can download all impulse response files as well as format explanation and Matlab as well as Python code examples for loading fir files.
Mic. 11
Mouth Loudspeaker of Zone 5 (Lsp. 15) to Standard Car Microphone 11 (Mic. 11)
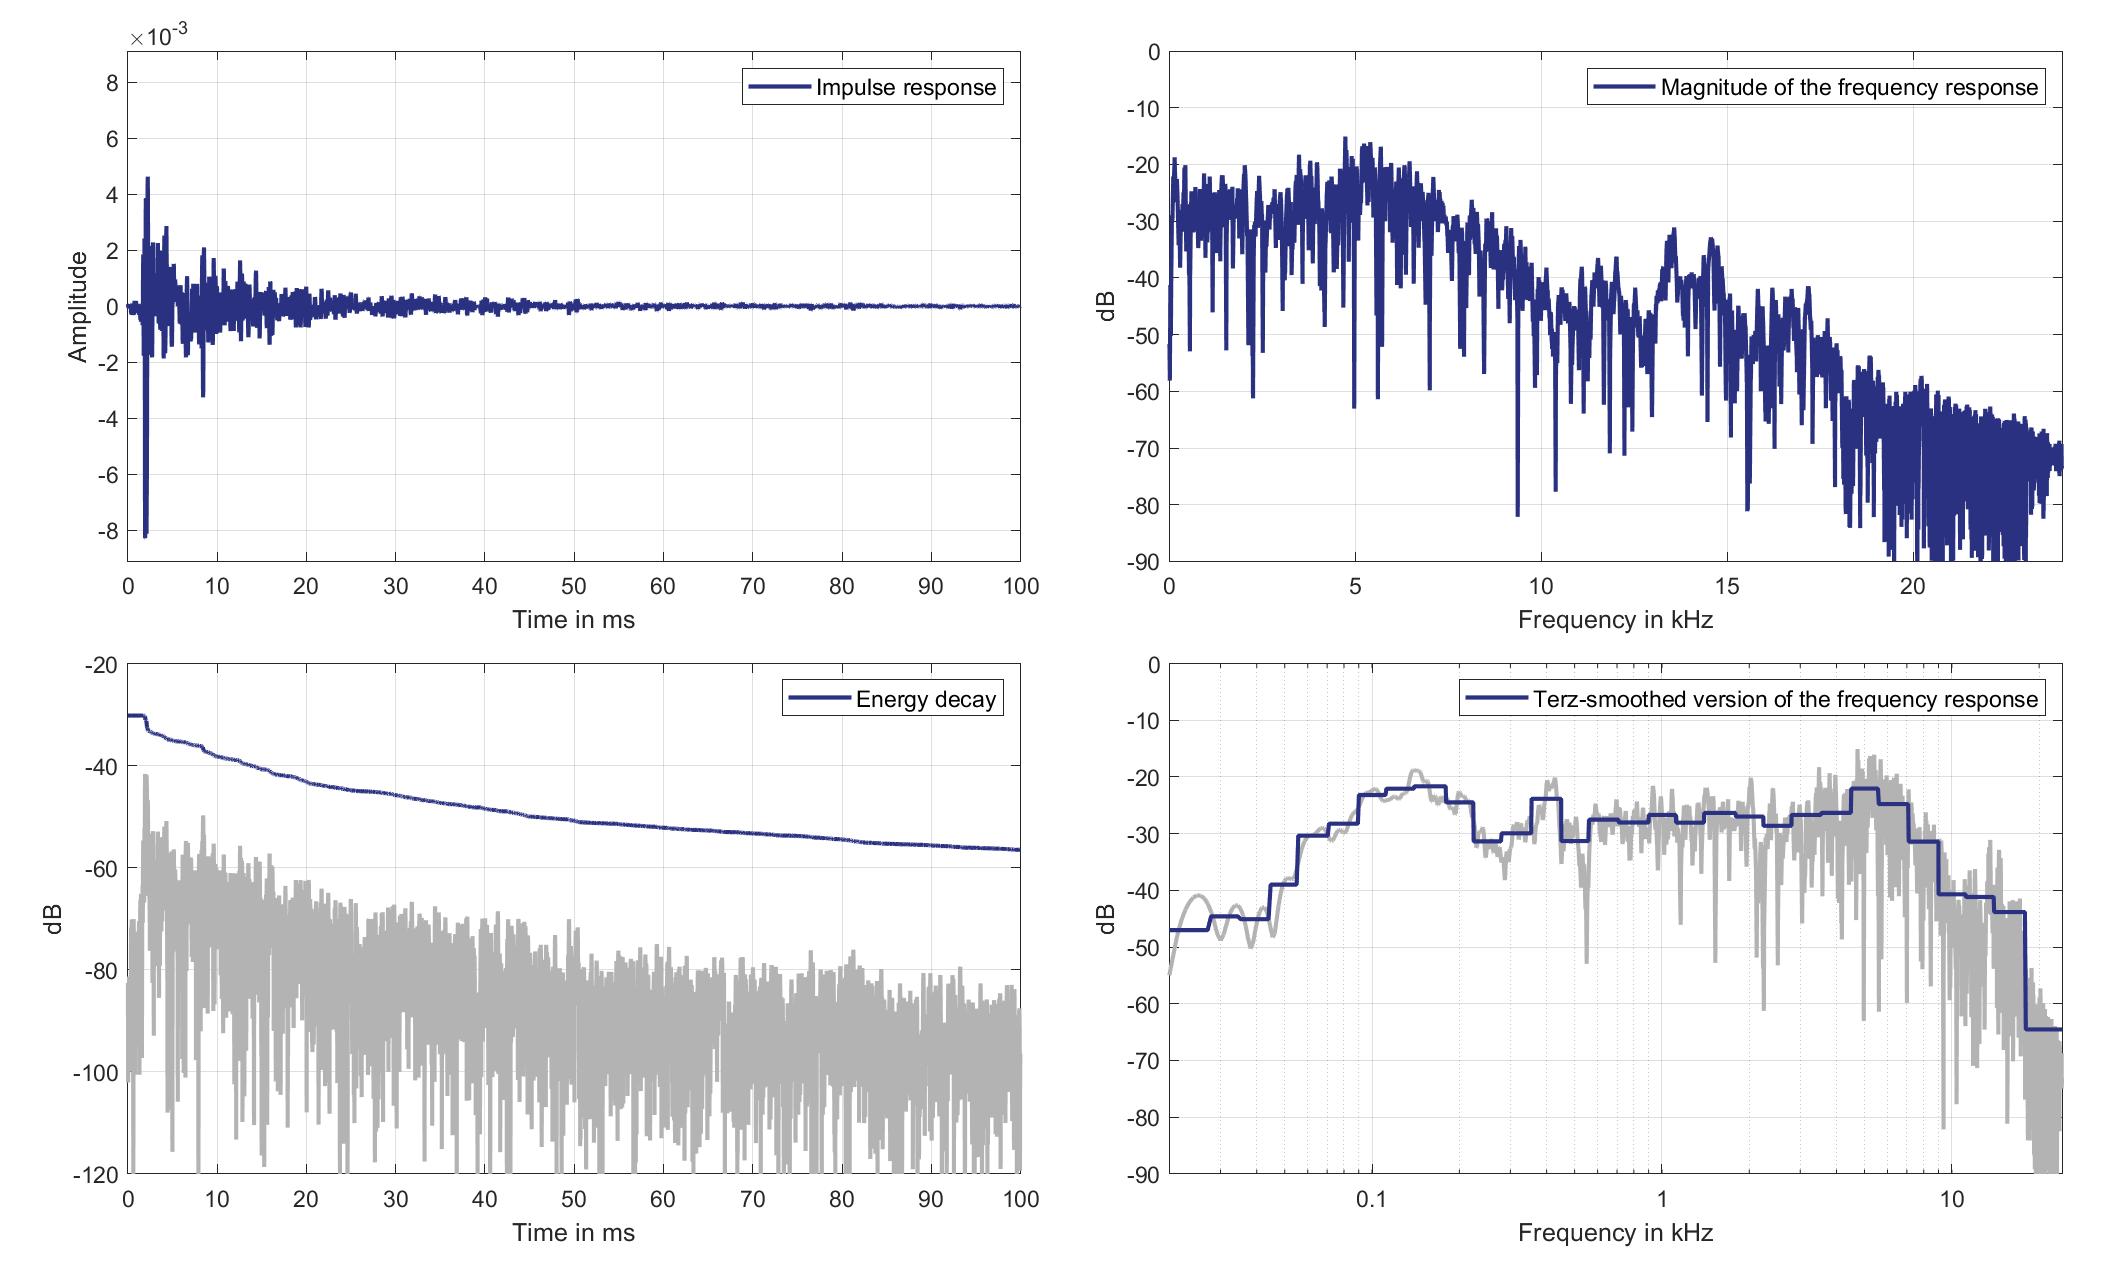
Download impulse response (in ".fir" format).
In the download section you can download all impulse response files as well as format explanation and Matlab as well as Python code examples for loading fir files.
Mic. 12
Mouth Loudspeaker of Zone 5 (Lsp. 15) to Standard Car Microphone 12 (Mic. 12)
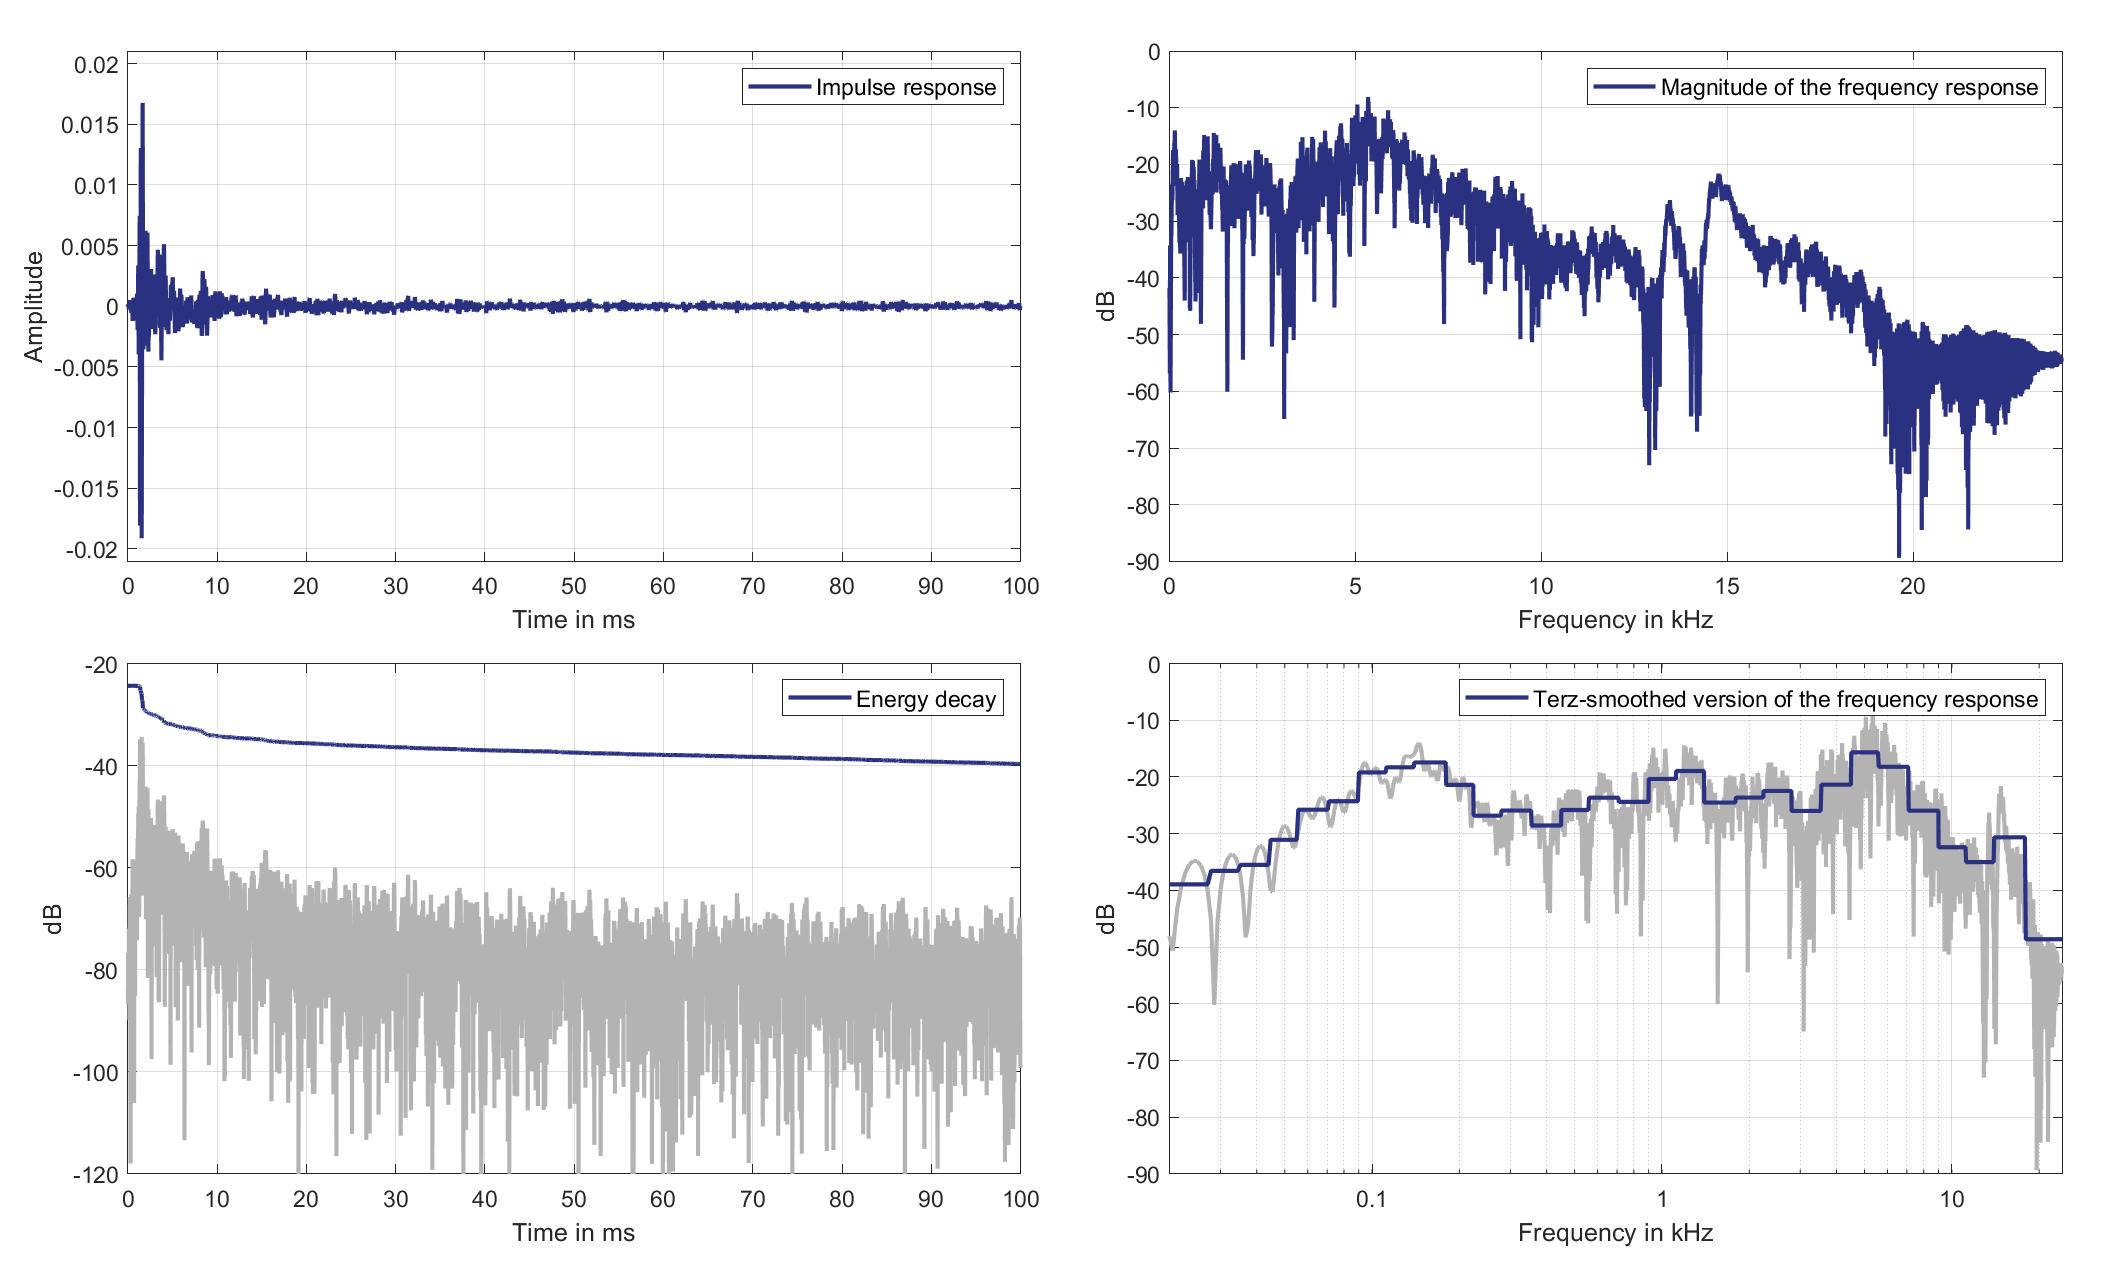
Download impulse response (in ".fir" format).
In the download section you can download all impulse response files as well as format explanation and Matlab as well as Python code examples for loading fir files.
Mic. 13
Mouth Loudspeaker of Zone 5 (Lsp. 15) to Standard Car Microphone 13 (Mic. 13)
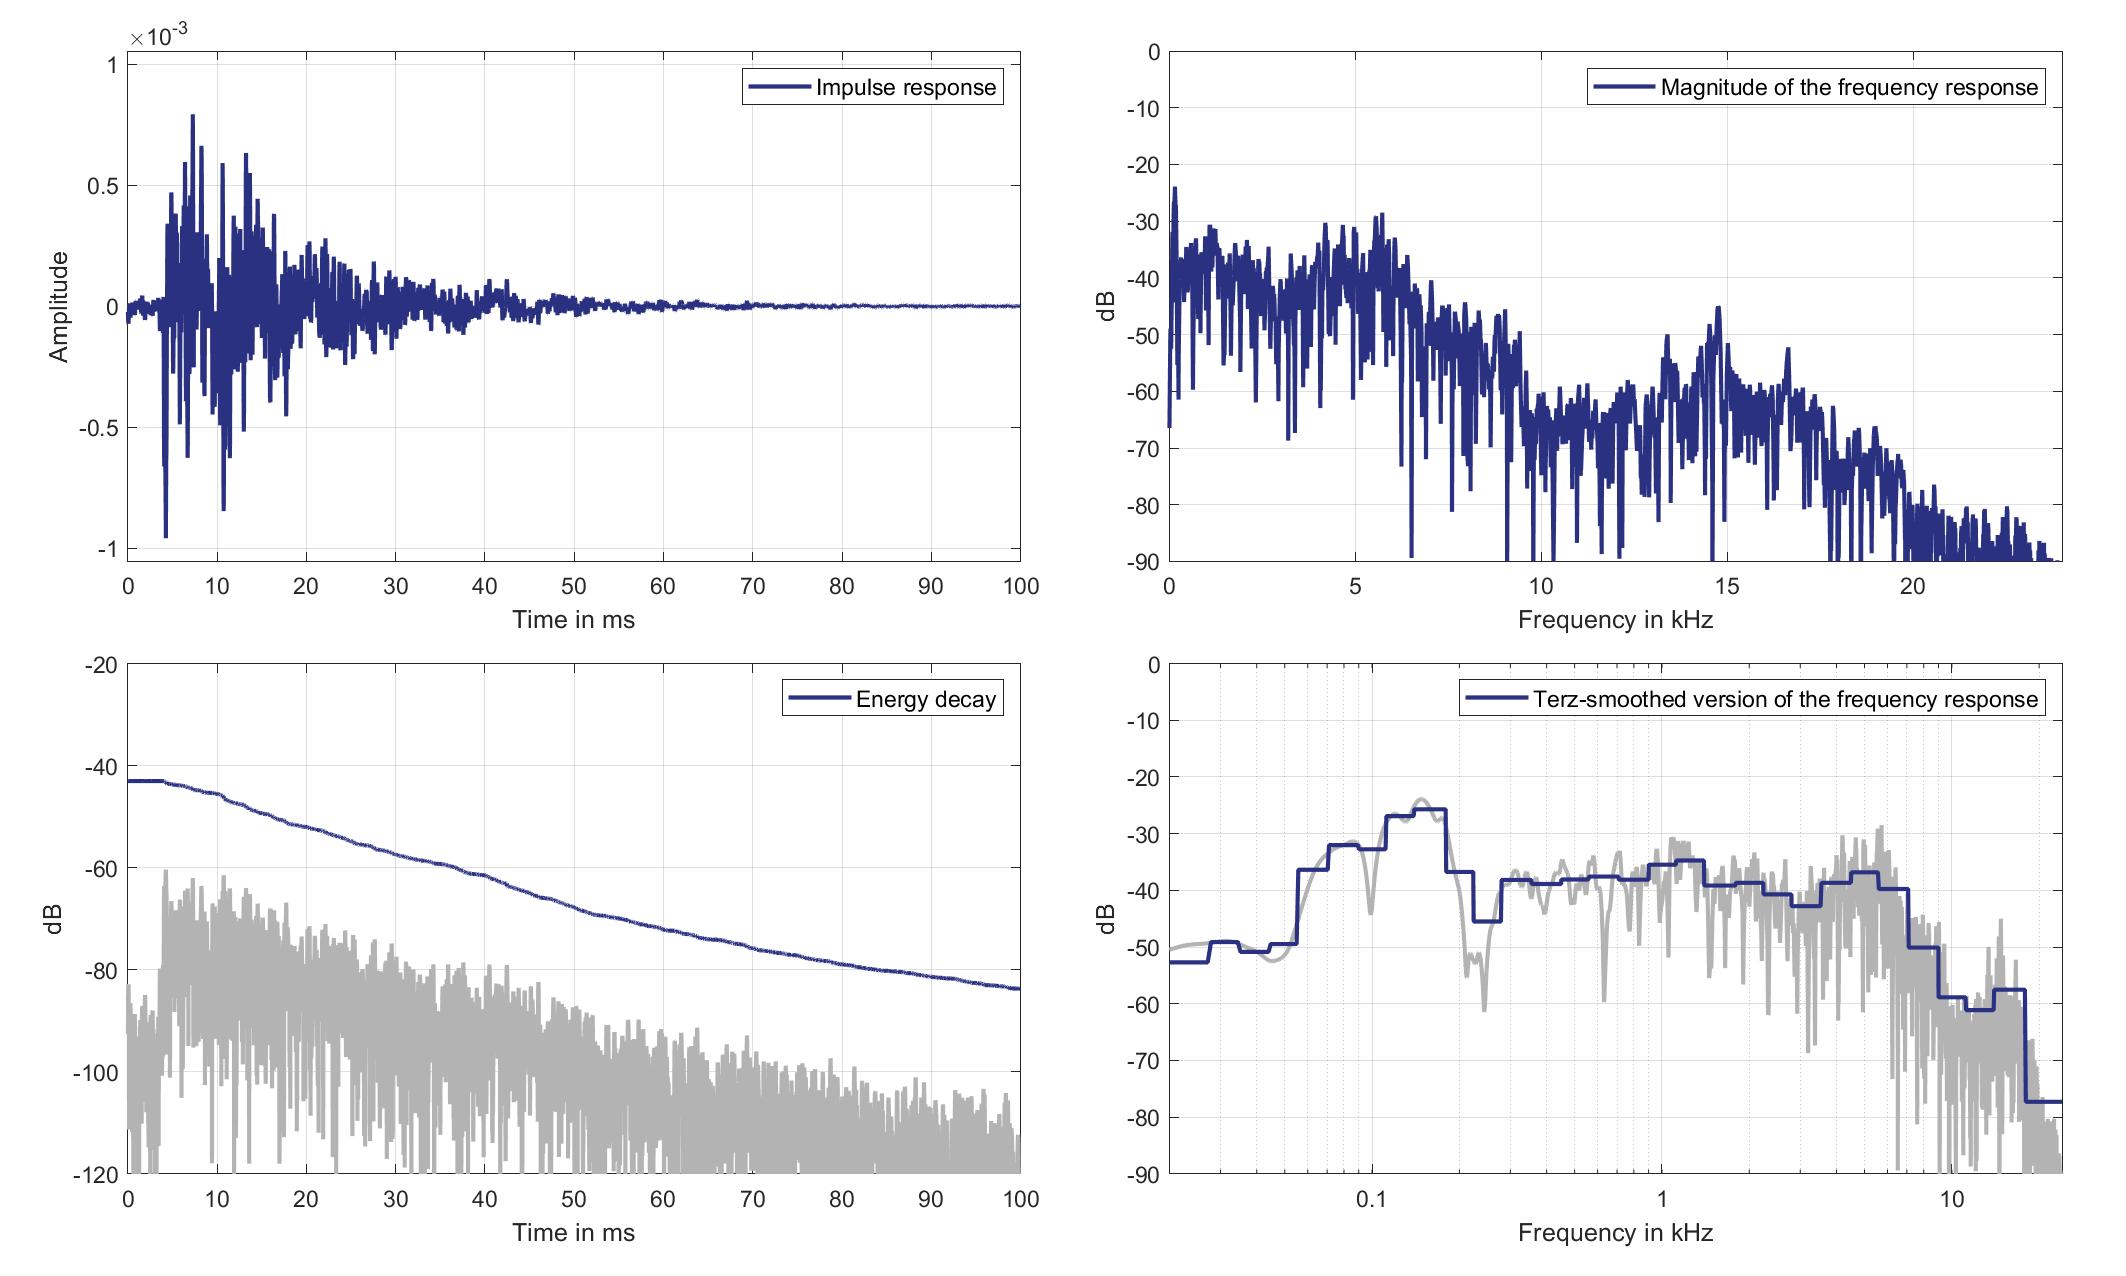
Download impulse response (in ".fir" format).
In the download section you can download all impulse response files as well as format explanation and Matlab as well as Python code examples for loading fir files.
Mic. 14
Mouth Loudspeaker of Zone 5 (Lsp. 15) to Standard Car Microphone 14 (Mic. 14)
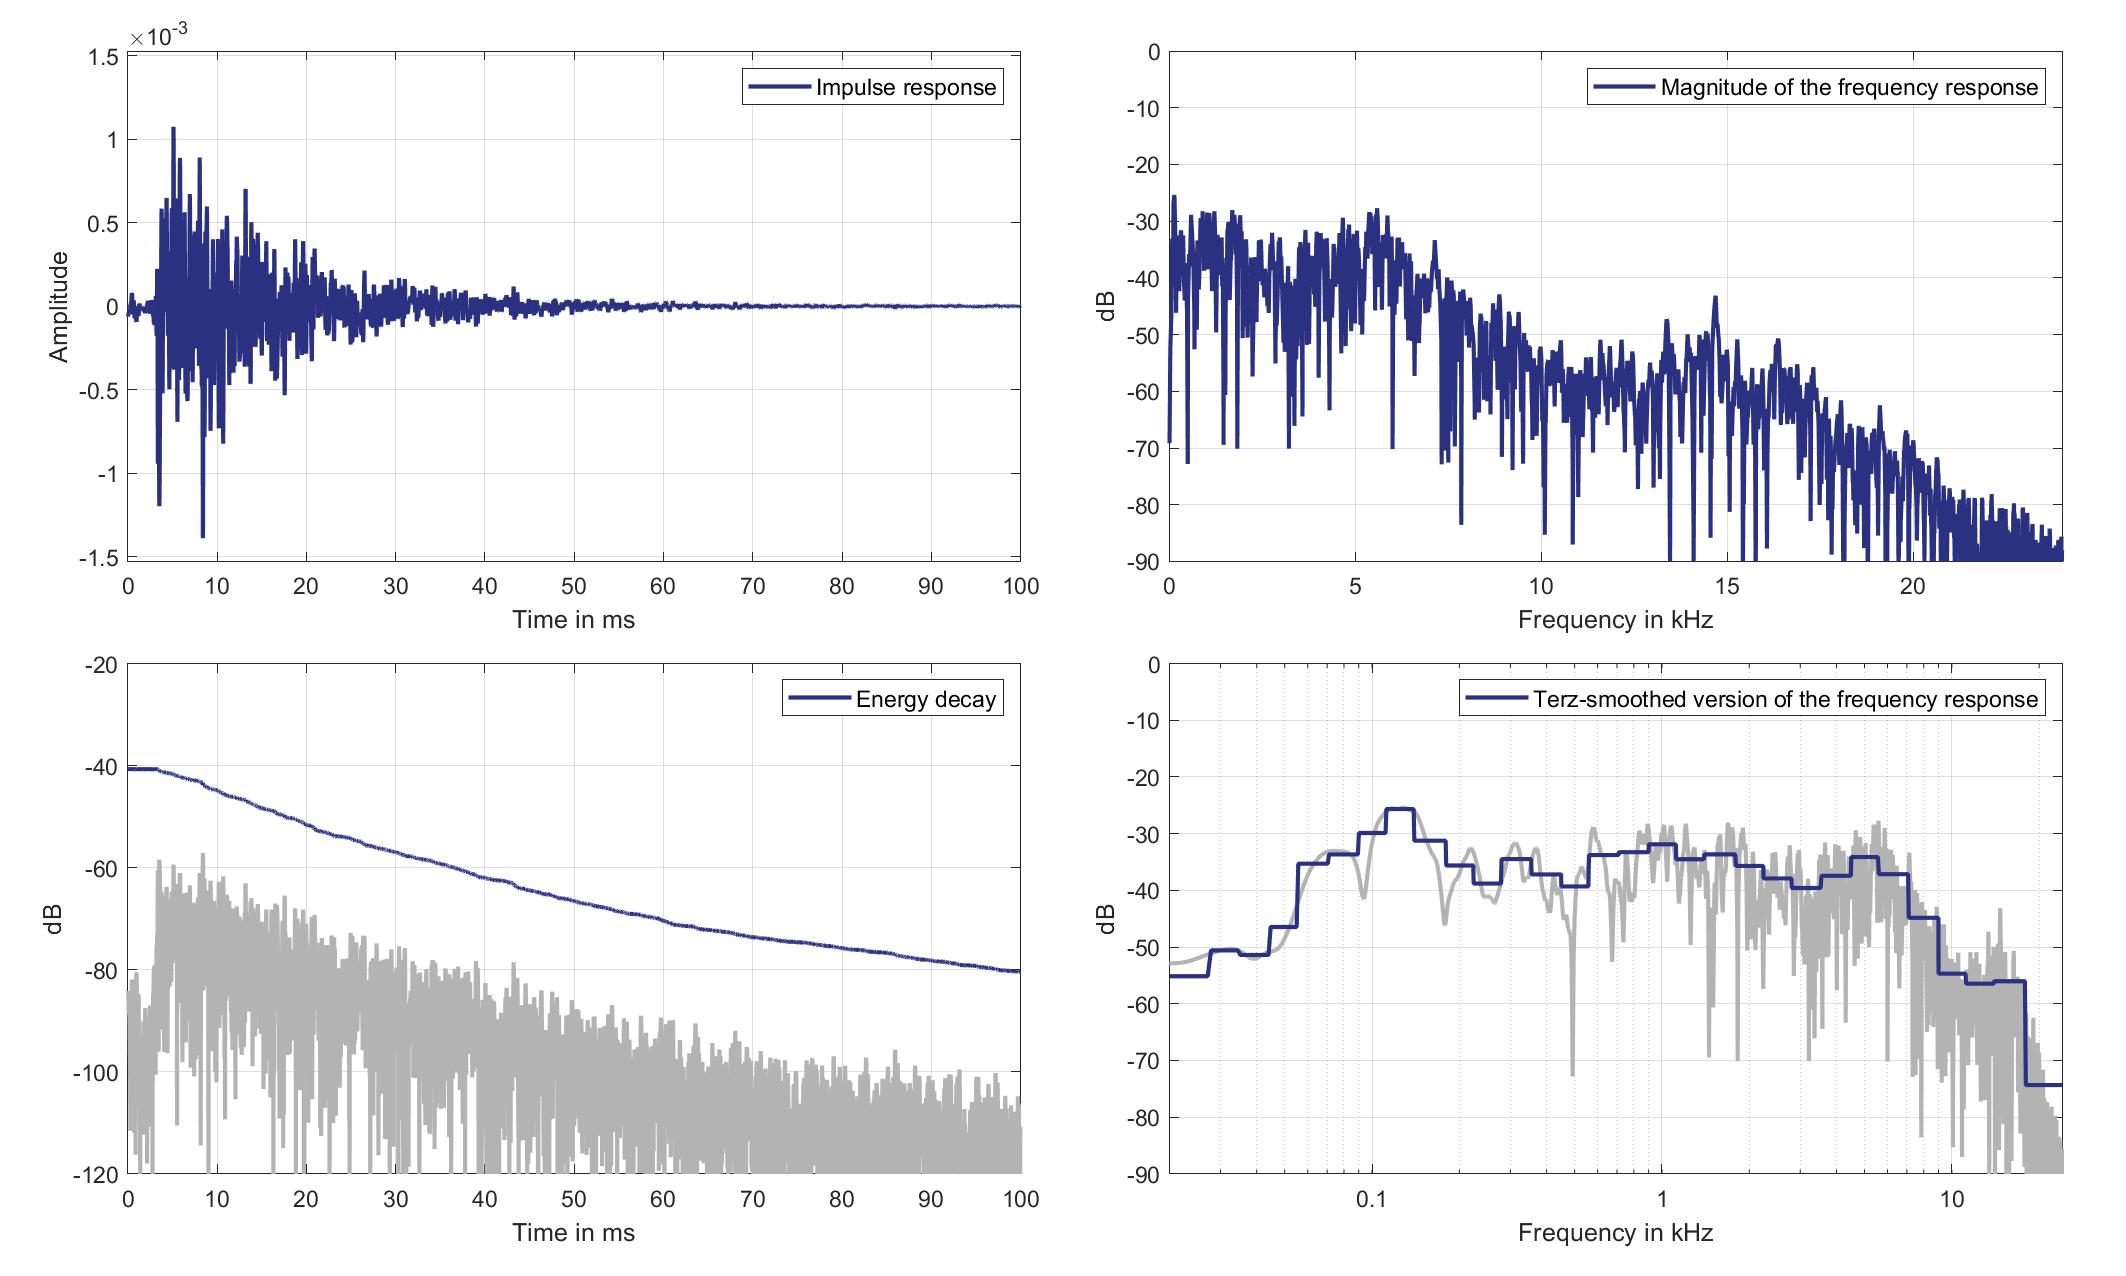
Download impulse response (in ".fir" format).
In the download section you can download all impulse response files as well as format explanation and Matlab as well as Python code examples for loading fir files.
Mic. 15
Mouth Loudspeaker of Zone 5 (Lsp. 15) to Standard Car Microphone 15 (Mic. 15)
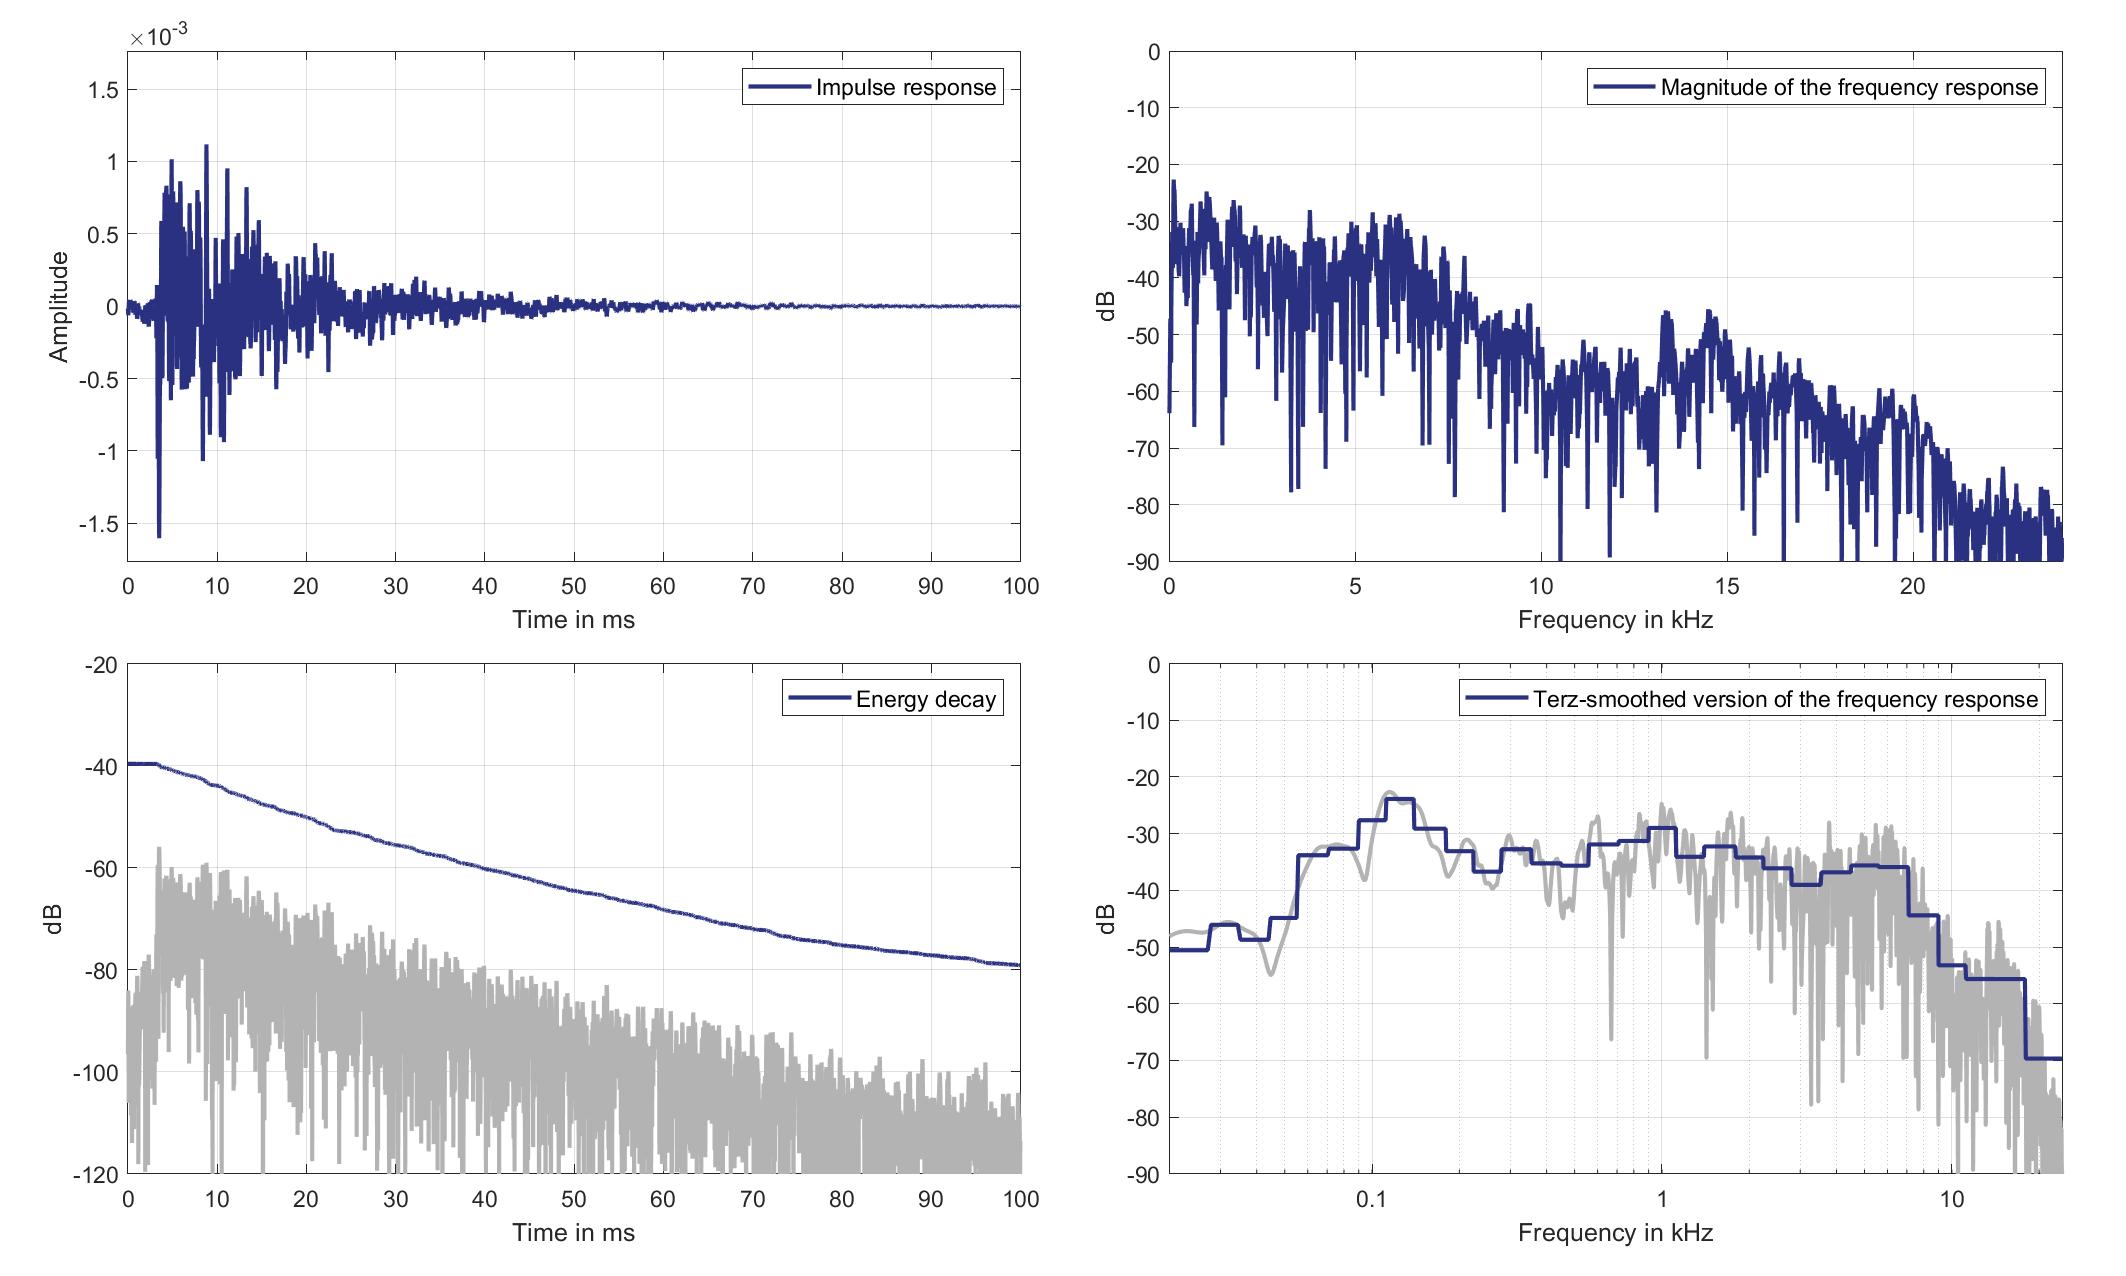
Download impulse response (in ".fir" format).
In the download section you can download all impulse response files as well as format explanation and Matlab as well as Python code examples for loading fir files.
Mic. 16
Mouth Loudspeaker of Zone 5 (Lsp. 15) to Standard Car Microphone 16 (Mic. 16)
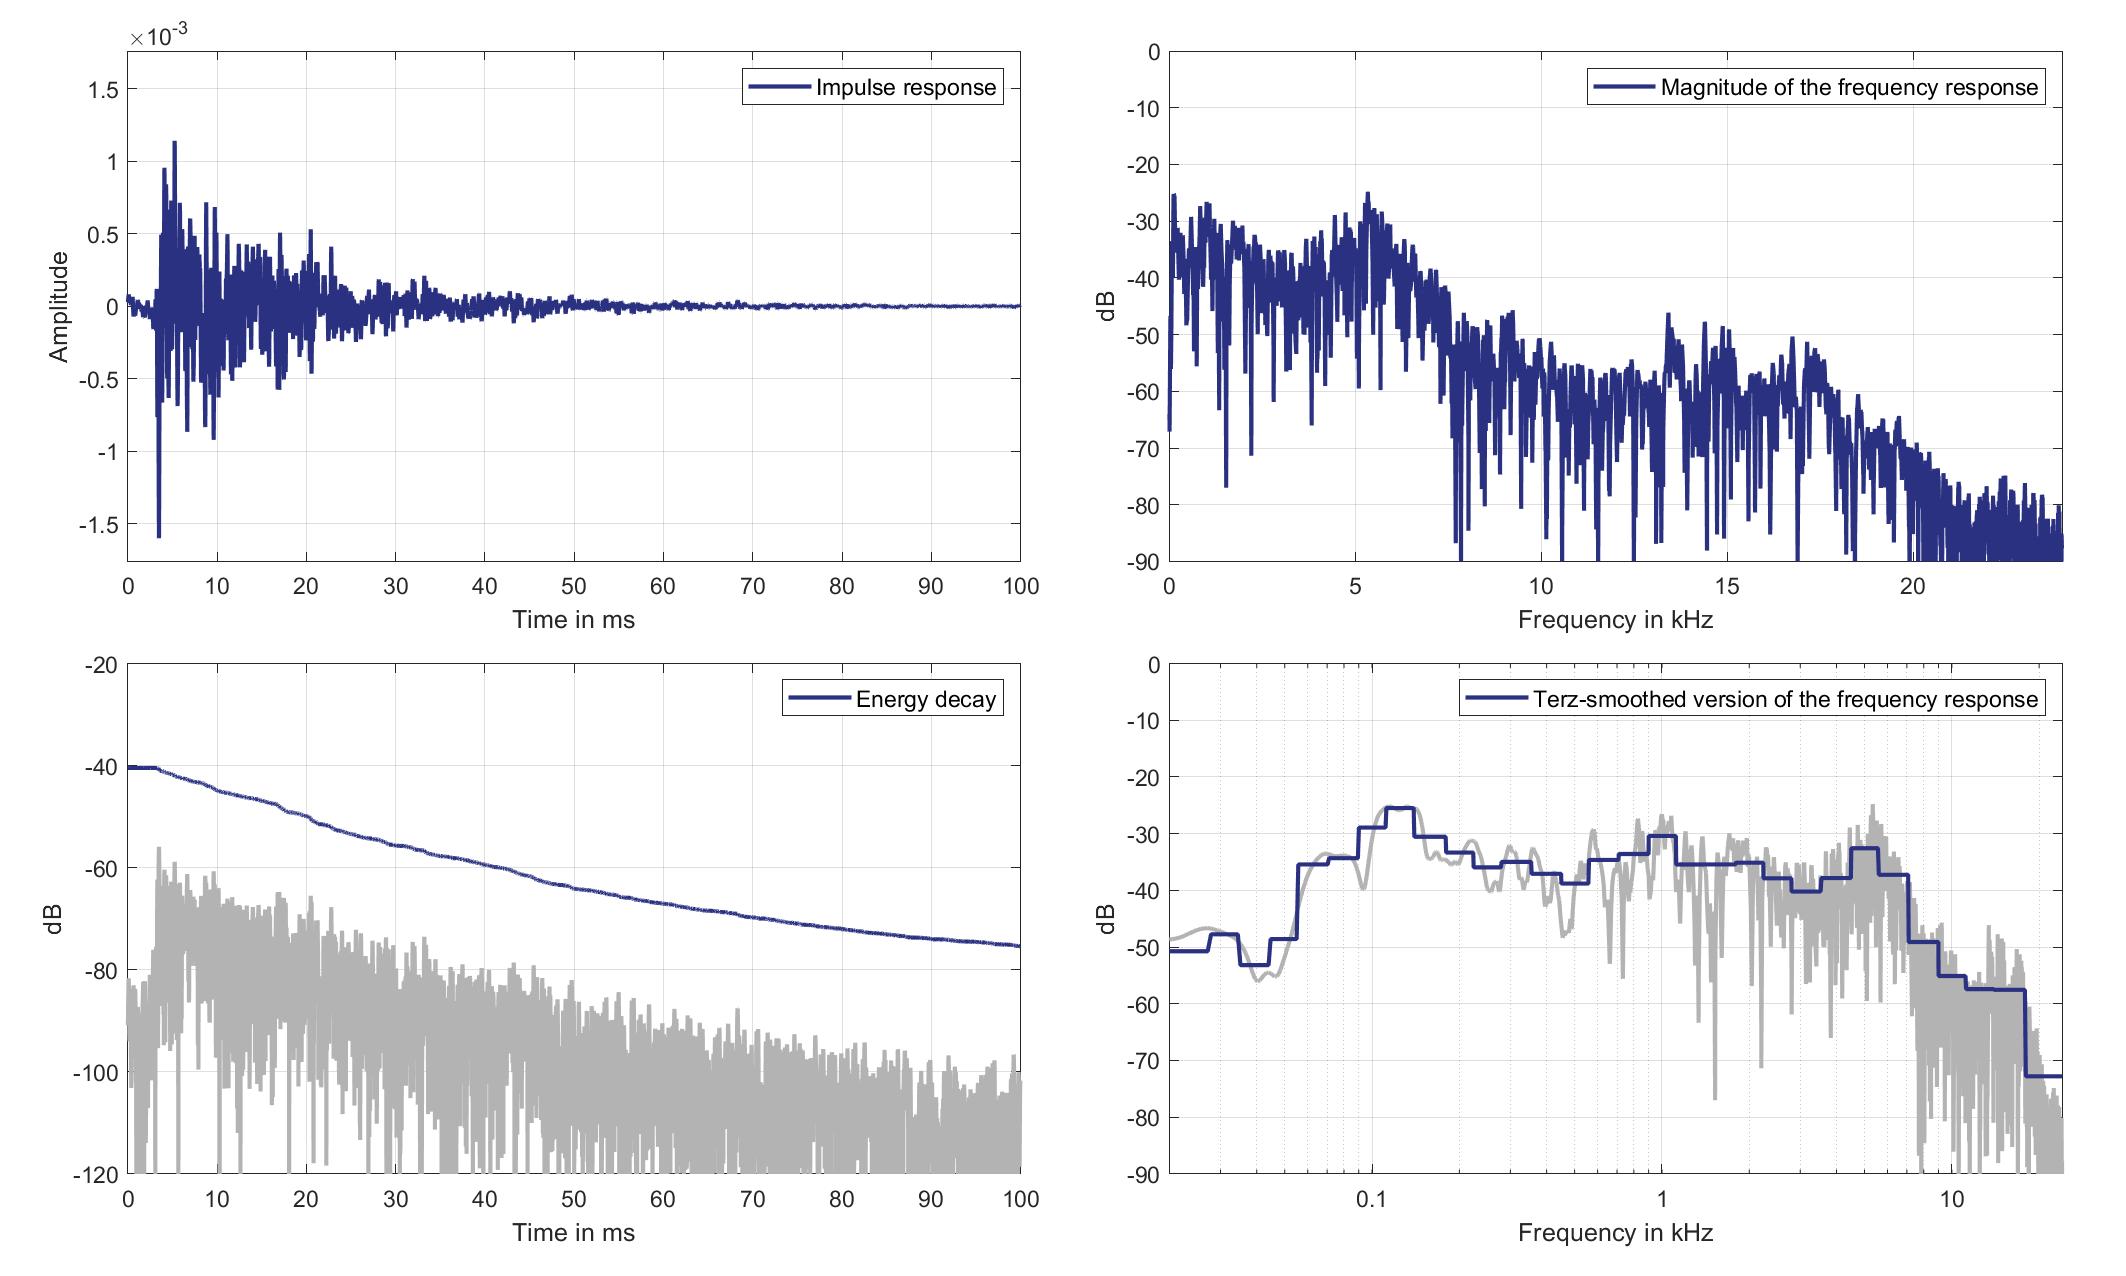
Download impulse response (in ".fir" format).
In the download section you can download all impulse response files as well as format explanation and Matlab as well as Python code examples for loading fir files.
Mic. 17
Mouth Loudspeaker of Zone 5 (Lsp. 15) to Standard Car Microphone 17 (Mic. 17)
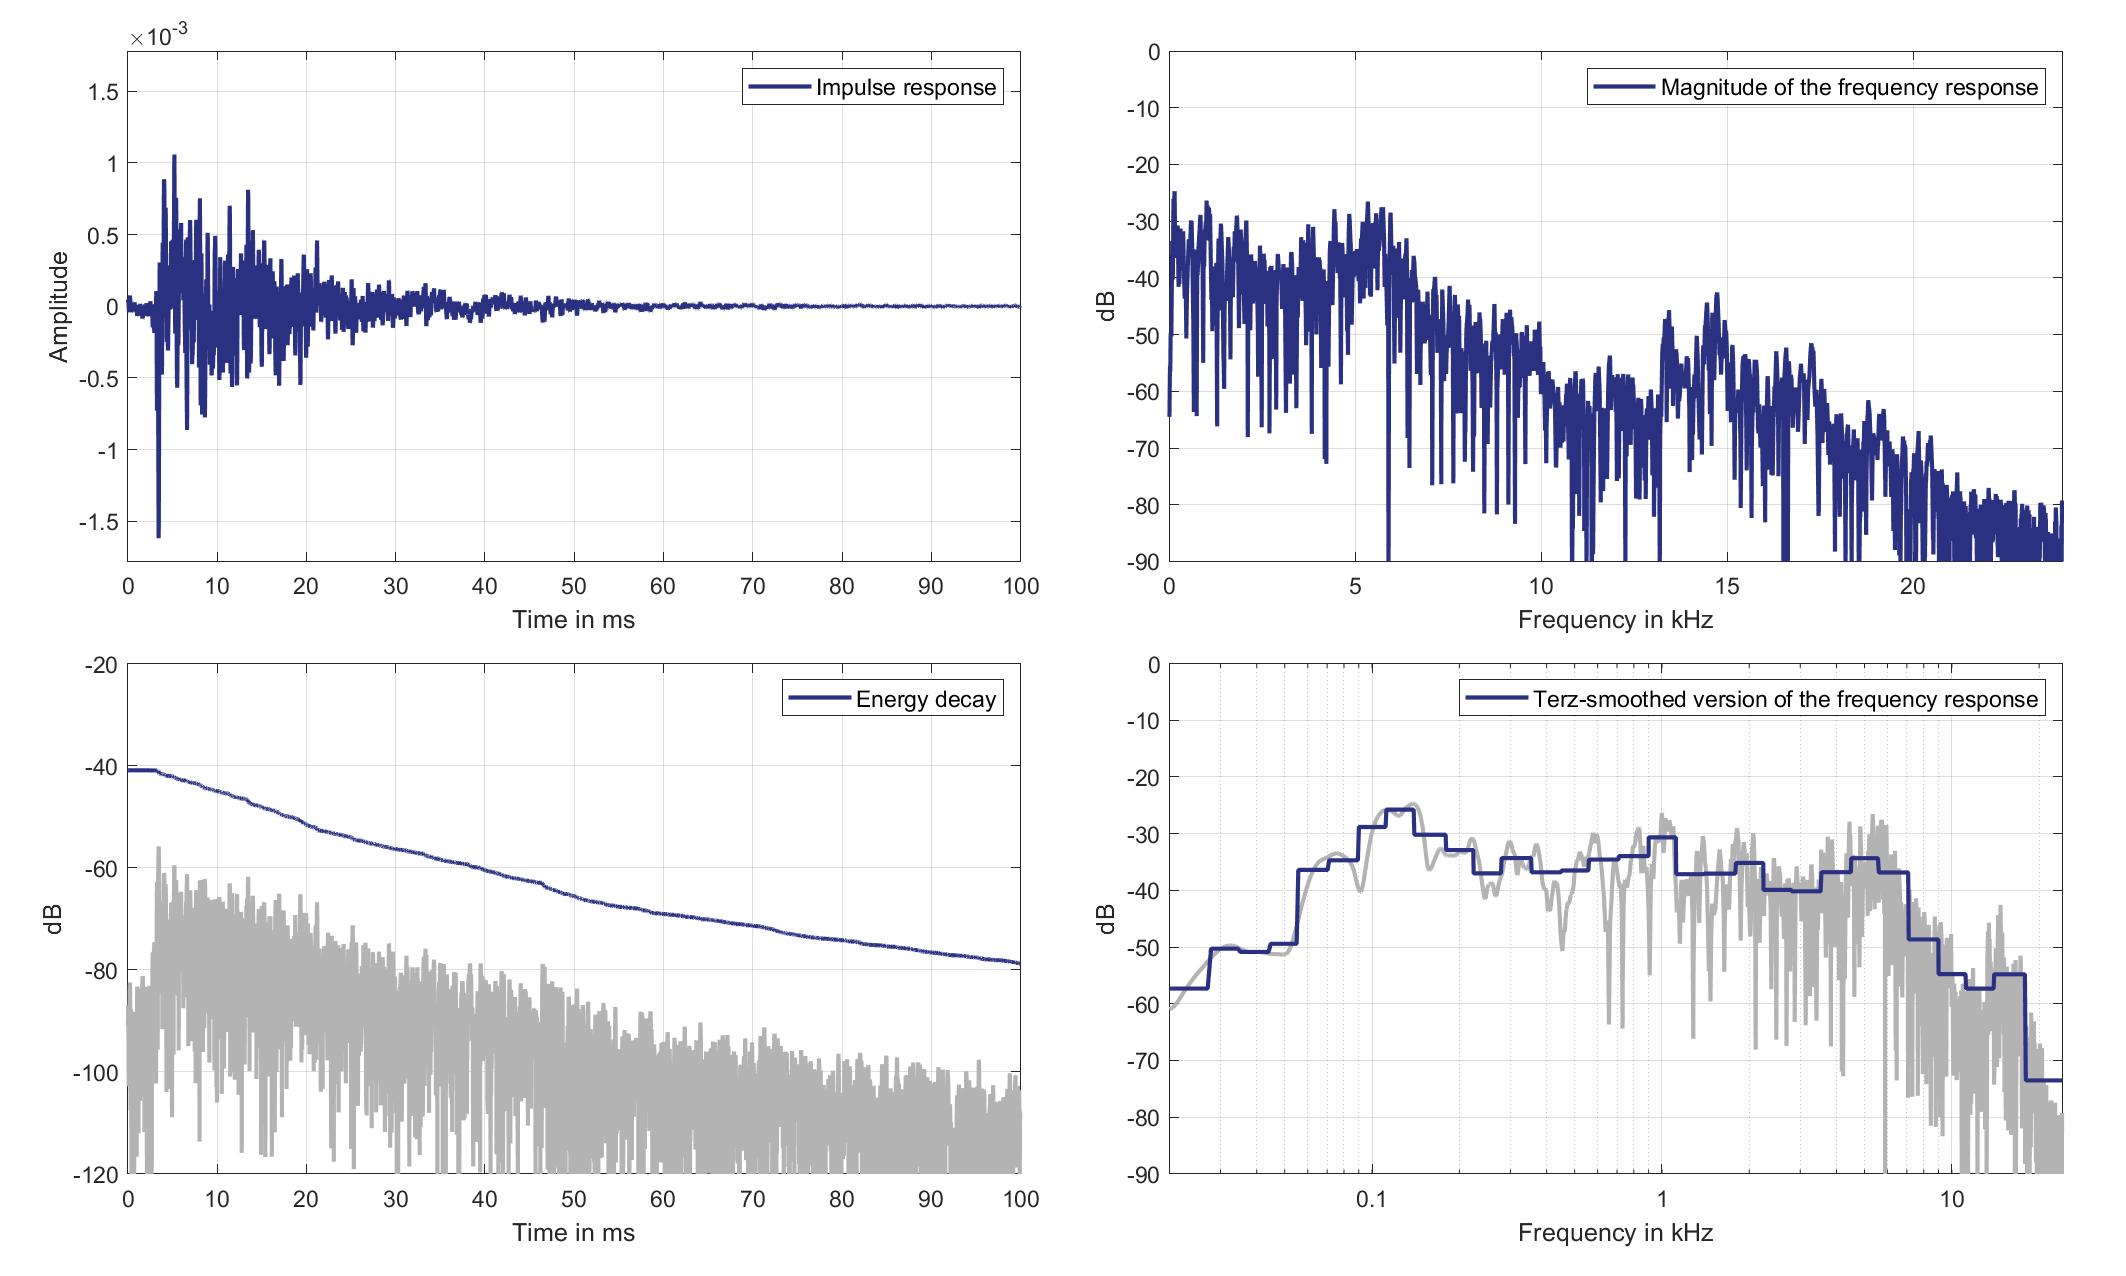
Download impulse response (in ".fir" format).
In the download section you can download all impulse response files as well as format explanation and Matlab as well as Python code examples for loading fir files.
Mic. 18
Mouth Loudspeaker of Zone 5 (Lsp. 15) to Standard Car Microphone 18 (Mic. 18)
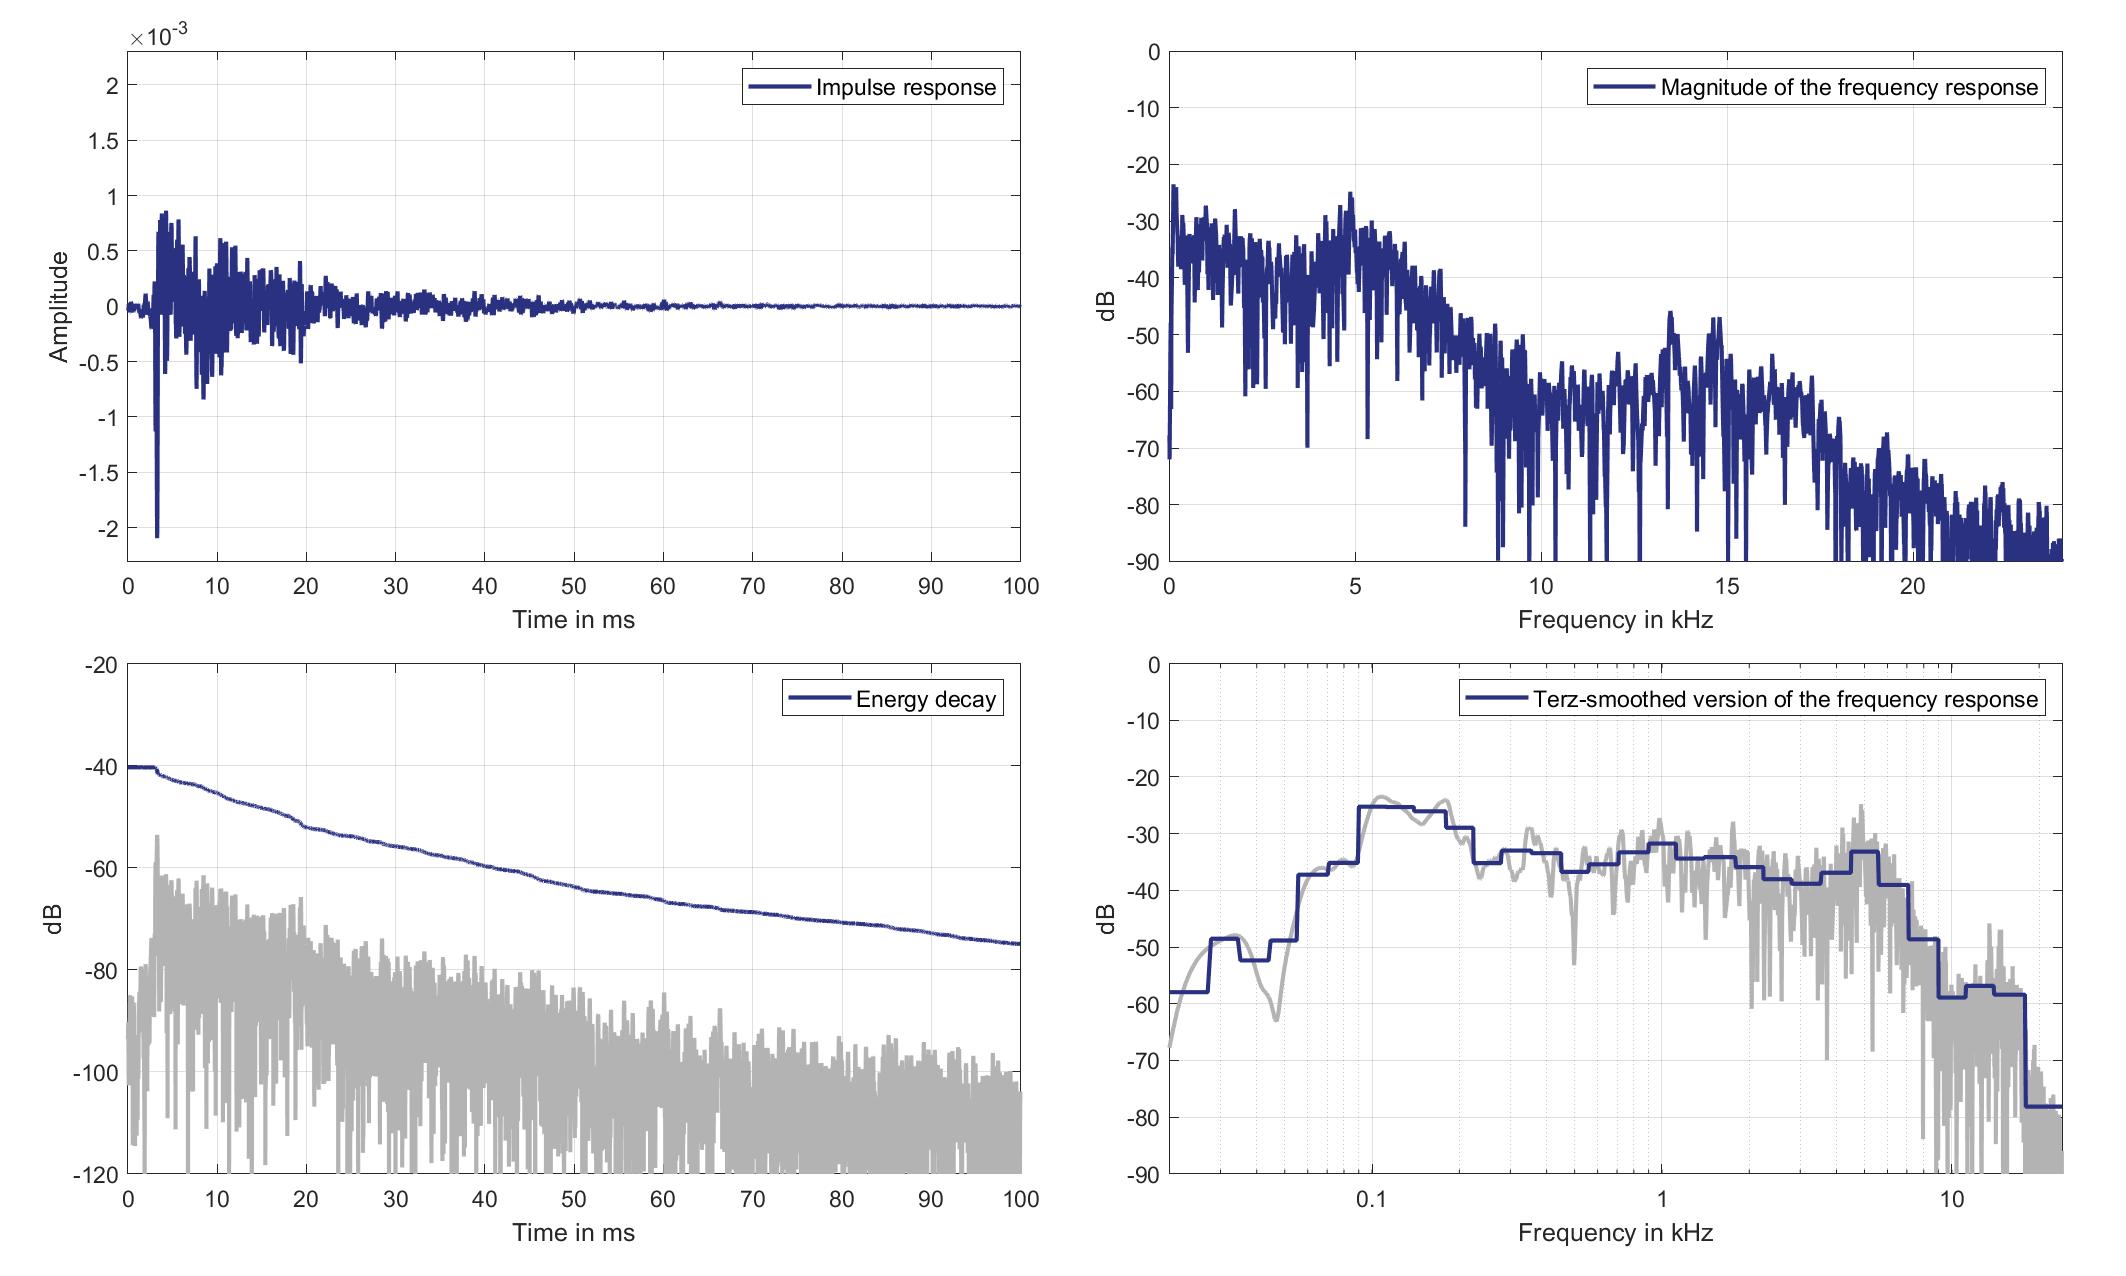
Download impulse response (in ".fir" format).
In the download section you can download all impulse response files as well as format explanation and Matlab as well as Python code examples for loading fir files.
Lsp. 16
Mic. 0
Mouth Loudspeaker of Zone 6 (Lsp. 16) to Standard Car Microphone 0 (Mic. 0)
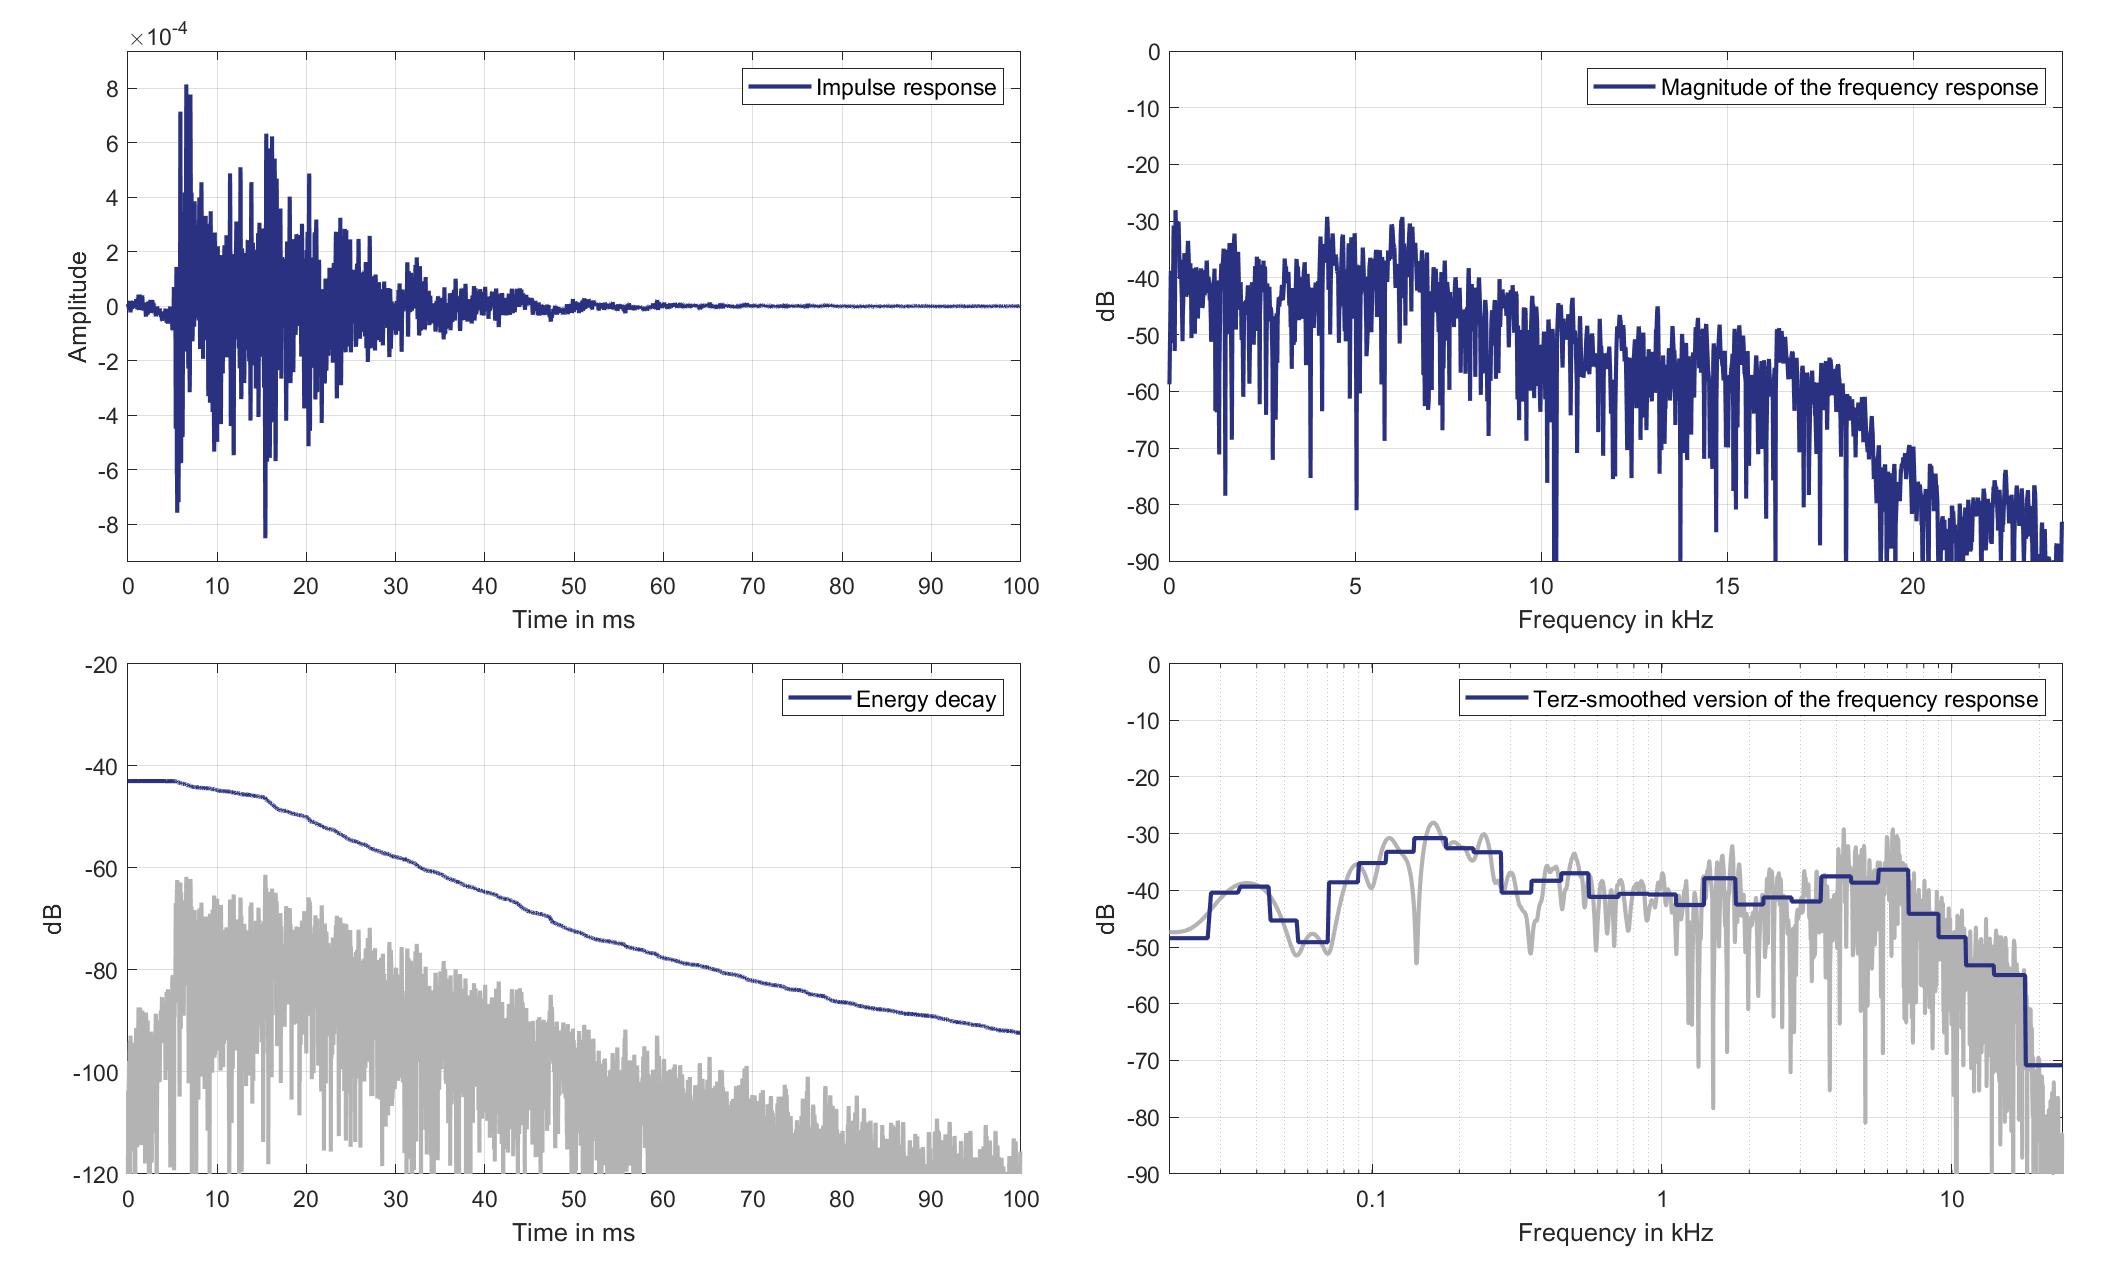
Download impulse response (in ".fir" format).
In the download section you can download all impulse response files as well as format explanation and Matlab as well as Python code examples for loading fir files.
Mic. 1
Mouth Loudspeaker of Zone 6 (Lsp. 16) to Standard Car Microphone 1 (Mic. 1)
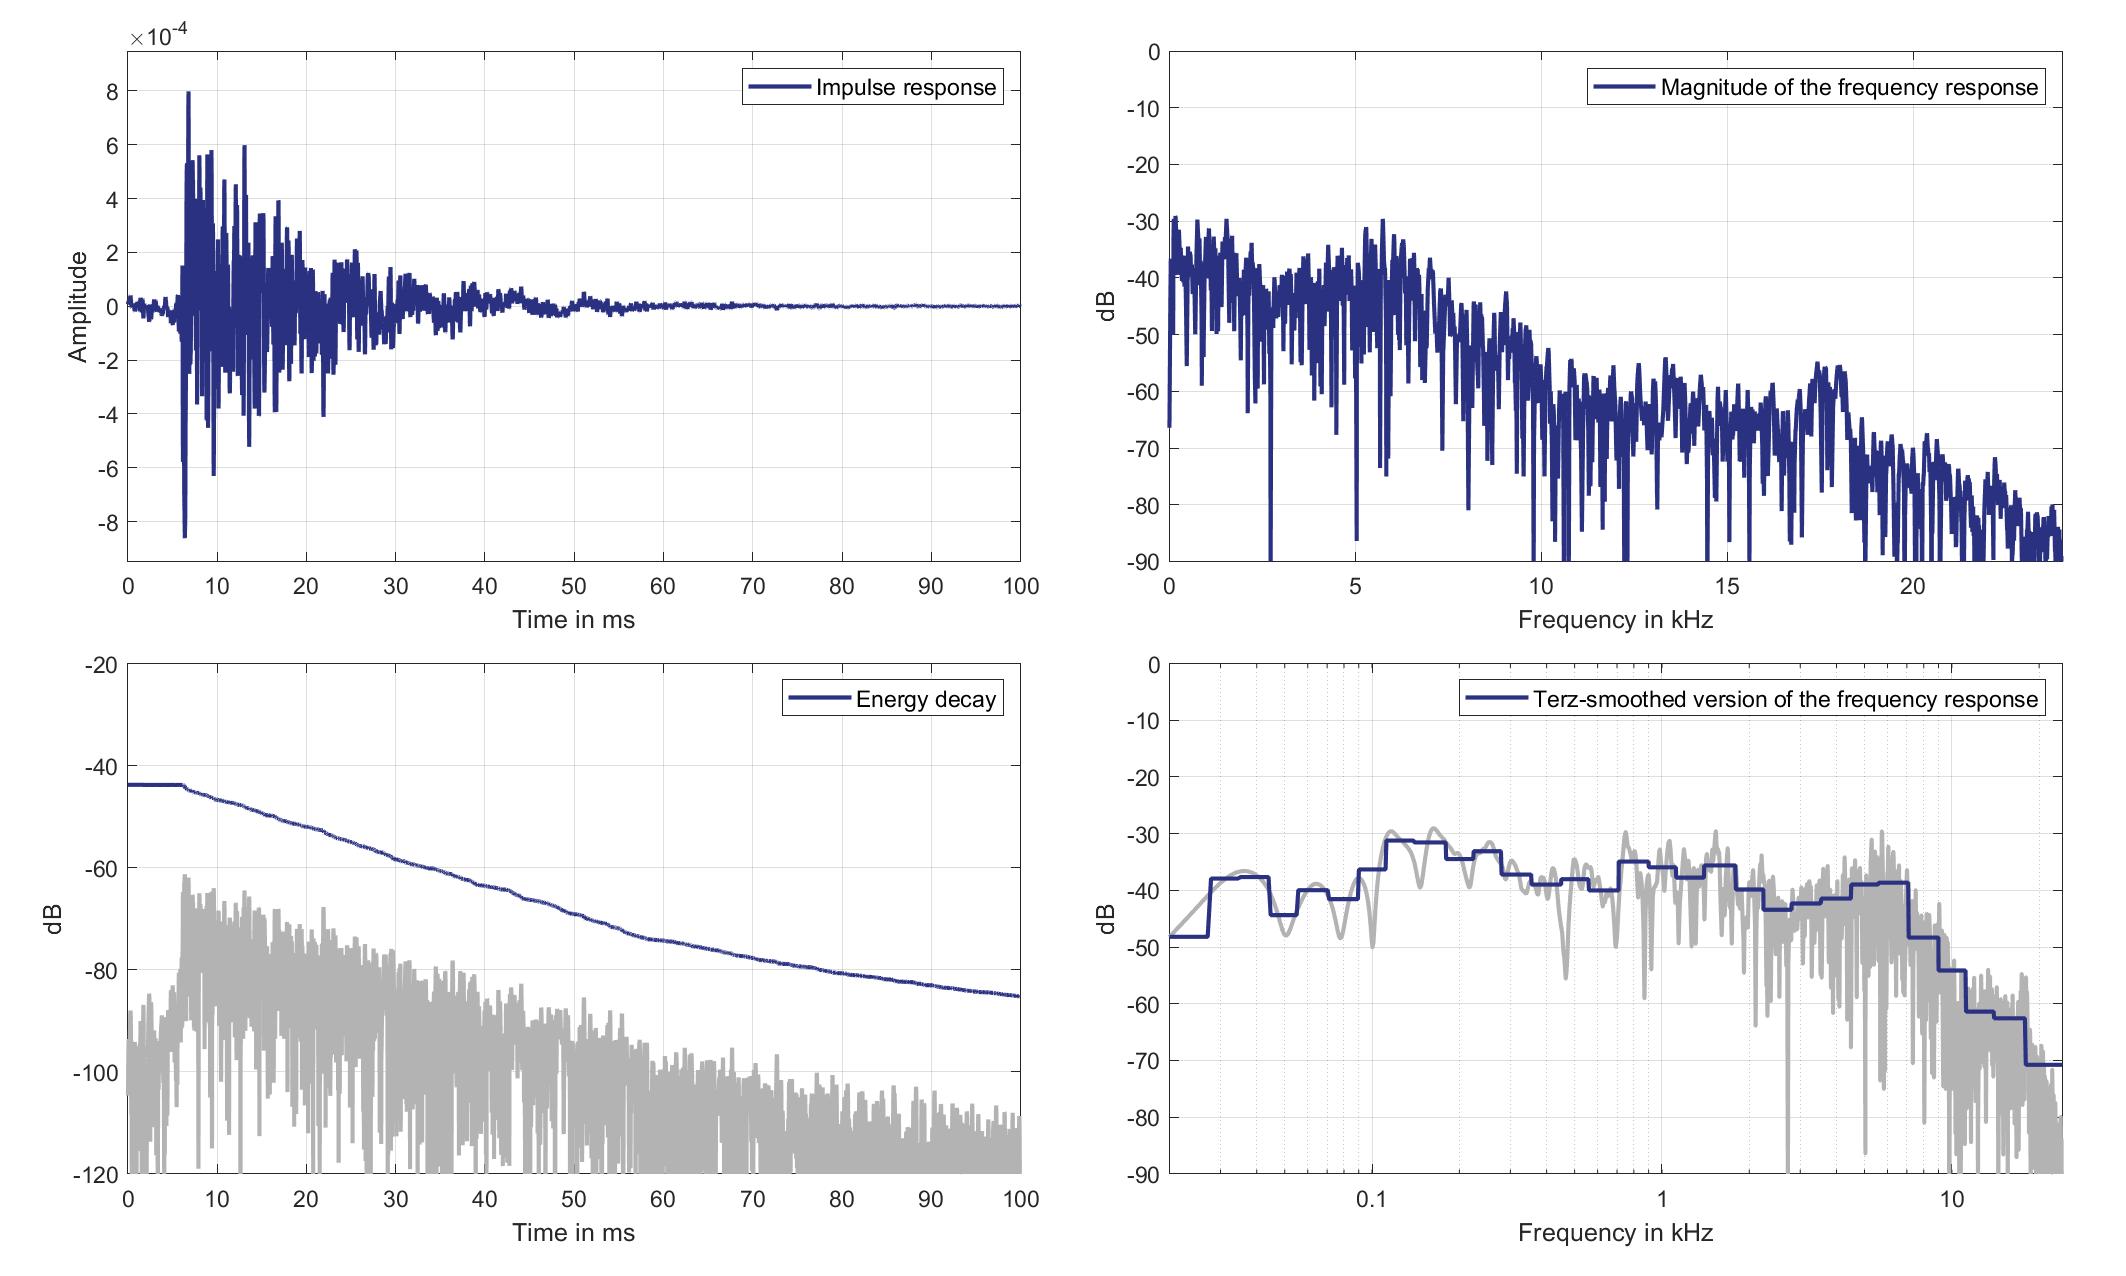
Download impulse response (in ".fir" format).
In the download section you can download all impulse response files as well as format explanation and Matlab as well as Python code examples for loading fir files.
Mic. 2
Mouth Loudspeaker of Zone 6 (Lsp. 16) to Standard Car Microphone 2 (Mic. 2)
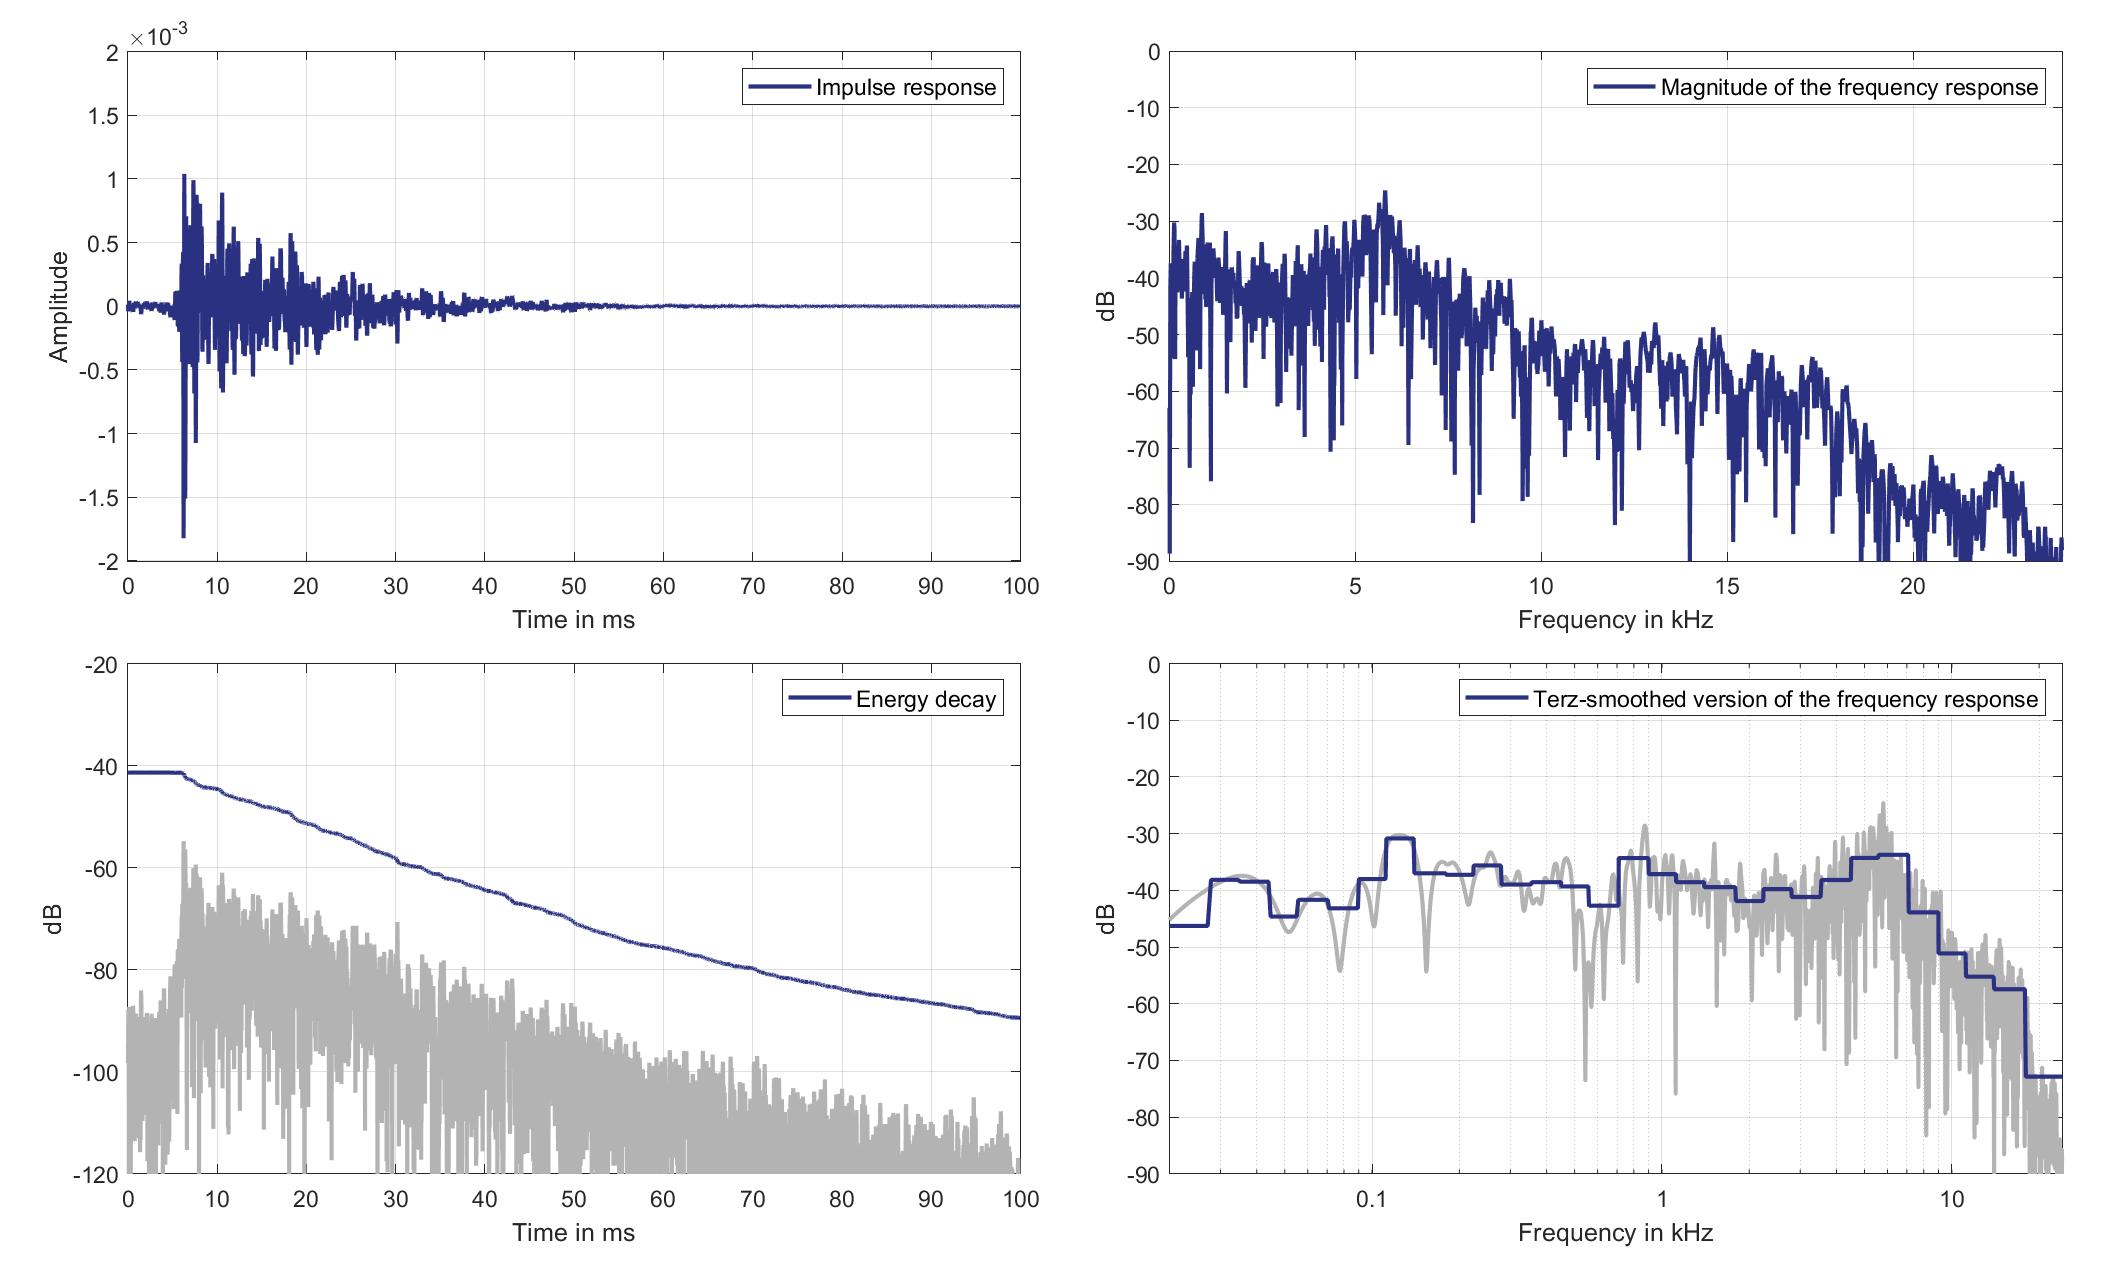
Download impulse response (in ".fir" format).
In the download section you can download all impulse response files as well as format explanation and Matlab as well as Python code examples for loading fir files.
Mic. 3
Mouth Loudspeaker of Zone 6 (Lsp. 16) to Standard Car Microphone 3 (Mic. 3)
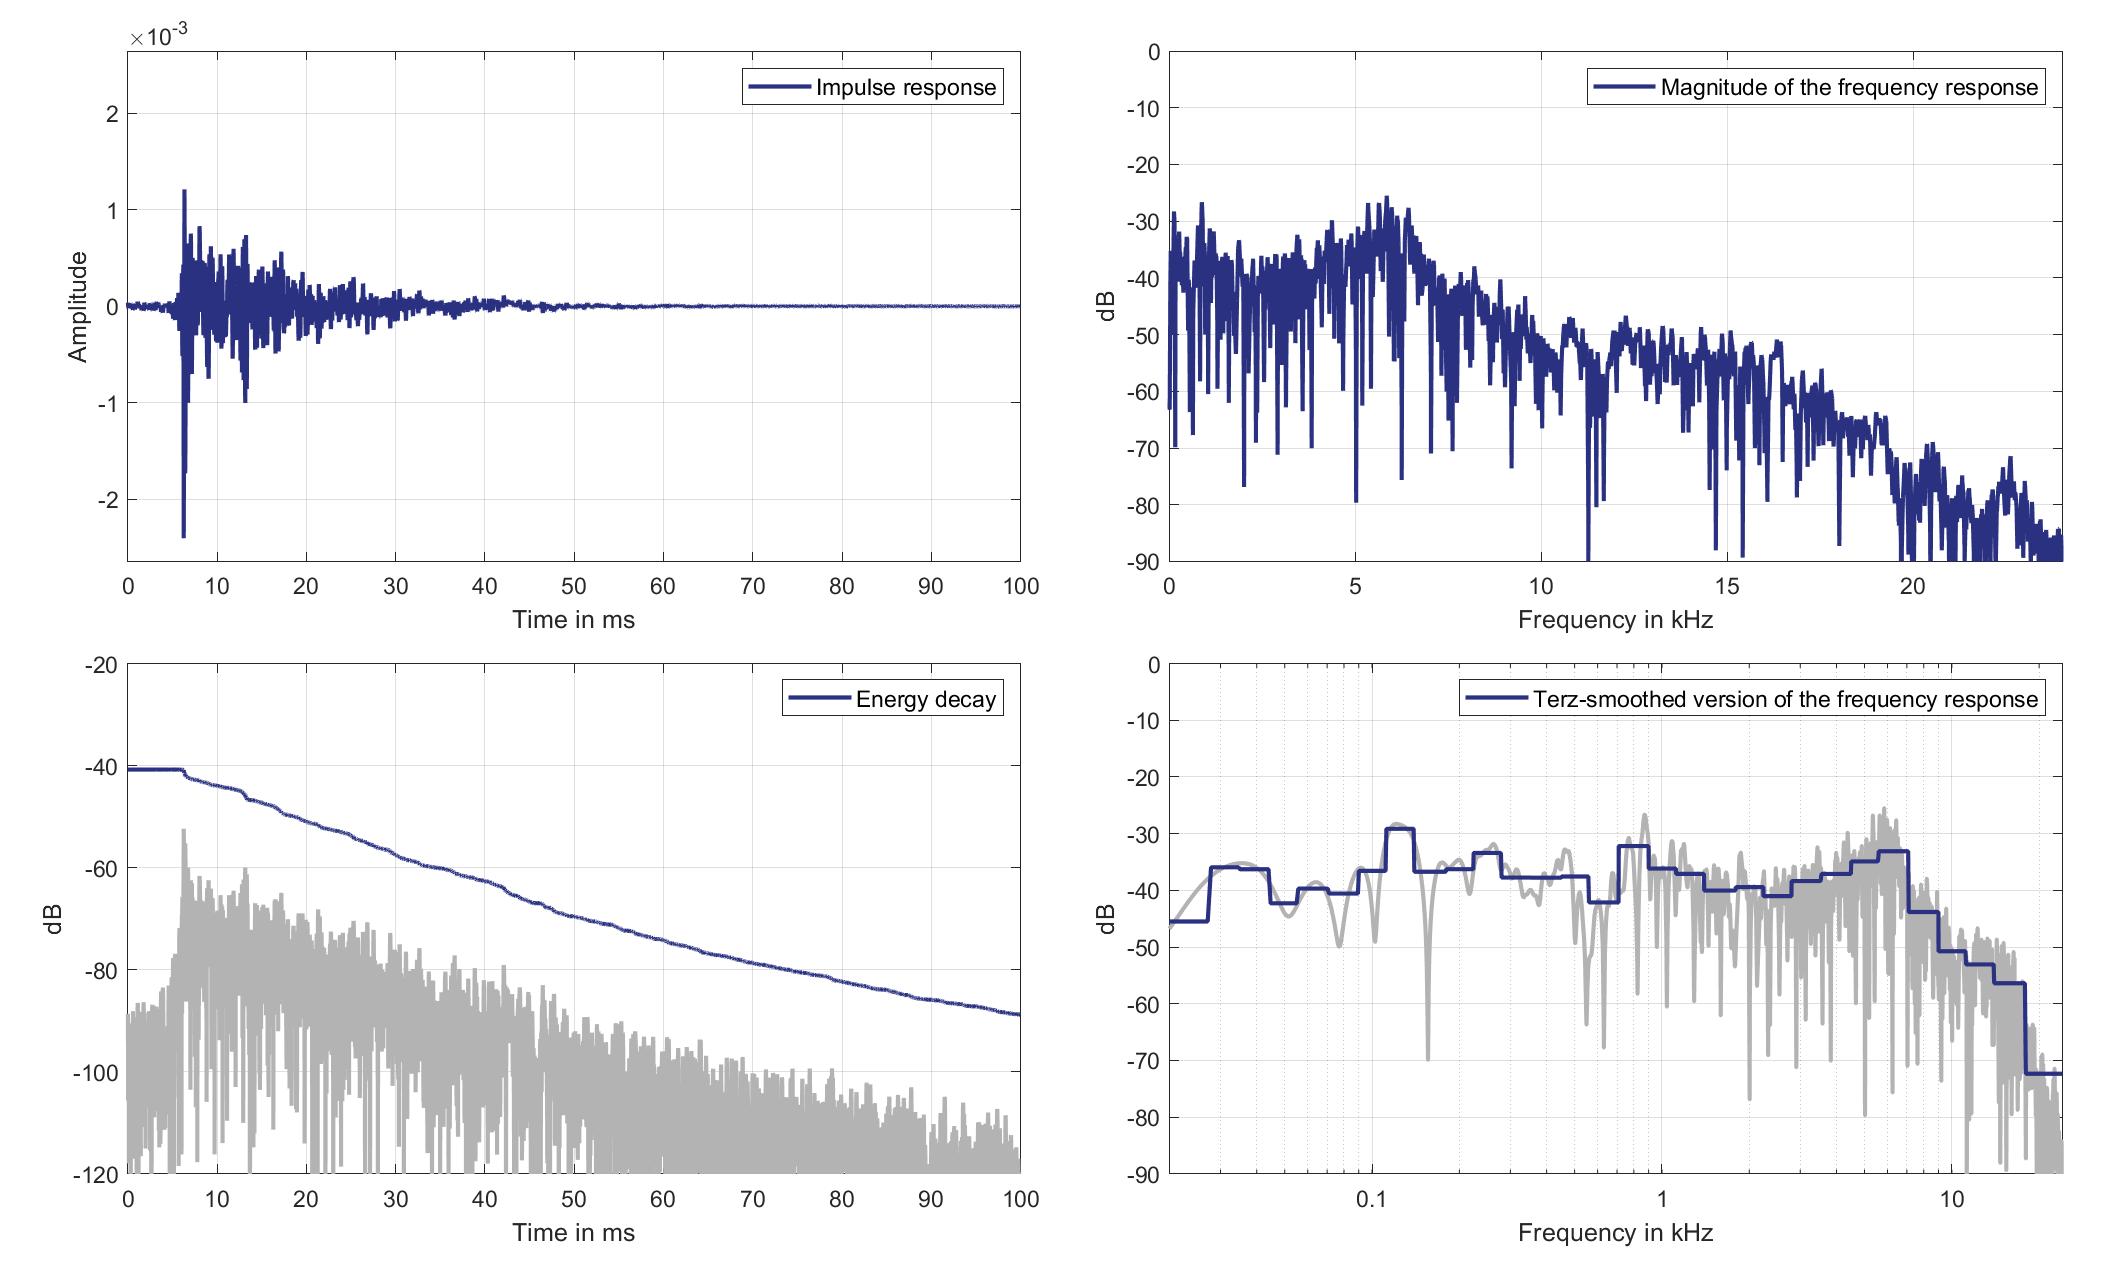
Download impulse response (in ".fir" format).
In the download section you can download all impulse response files as well as format explanation and Matlab as well as Python code examples for loading fir files.
Mic. 4
Mouth Loudspeaker of Zone 6 (Lsp. 16) to Standard Car Microphone 4 (Mic. 4)
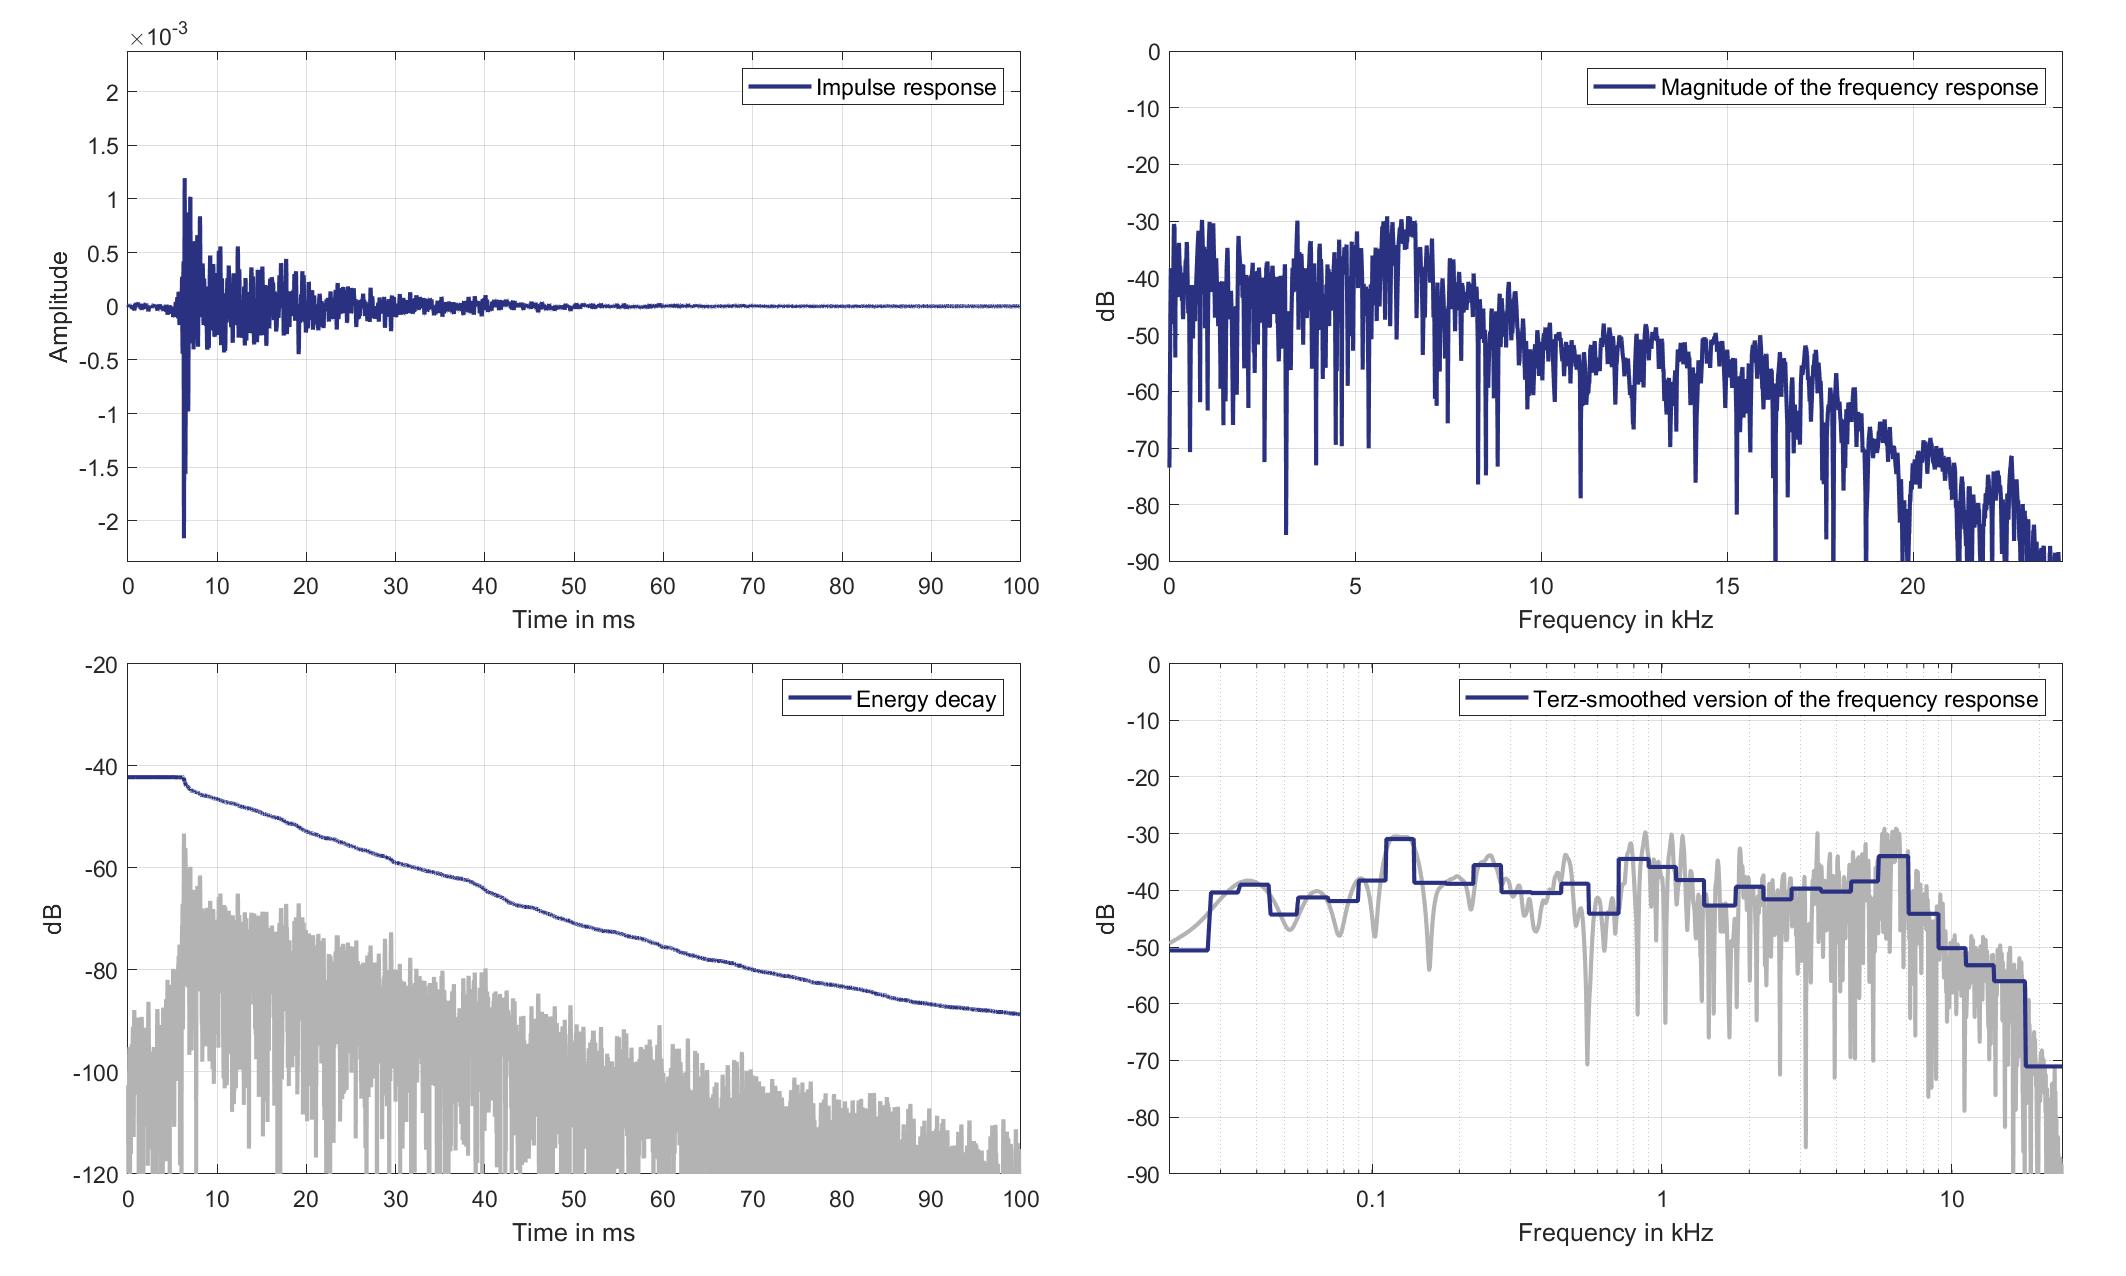
Download impulse response (in ".fir" format).
In the download section you can download all impulse response files as well as format explanation and Matlab as well as Python code examples for loading fir files.
Mic. 5
Mouth Loudspeaker of Zone 6 (Lsp. 16) to Standard Car Microphone 5 (Mic. 5)
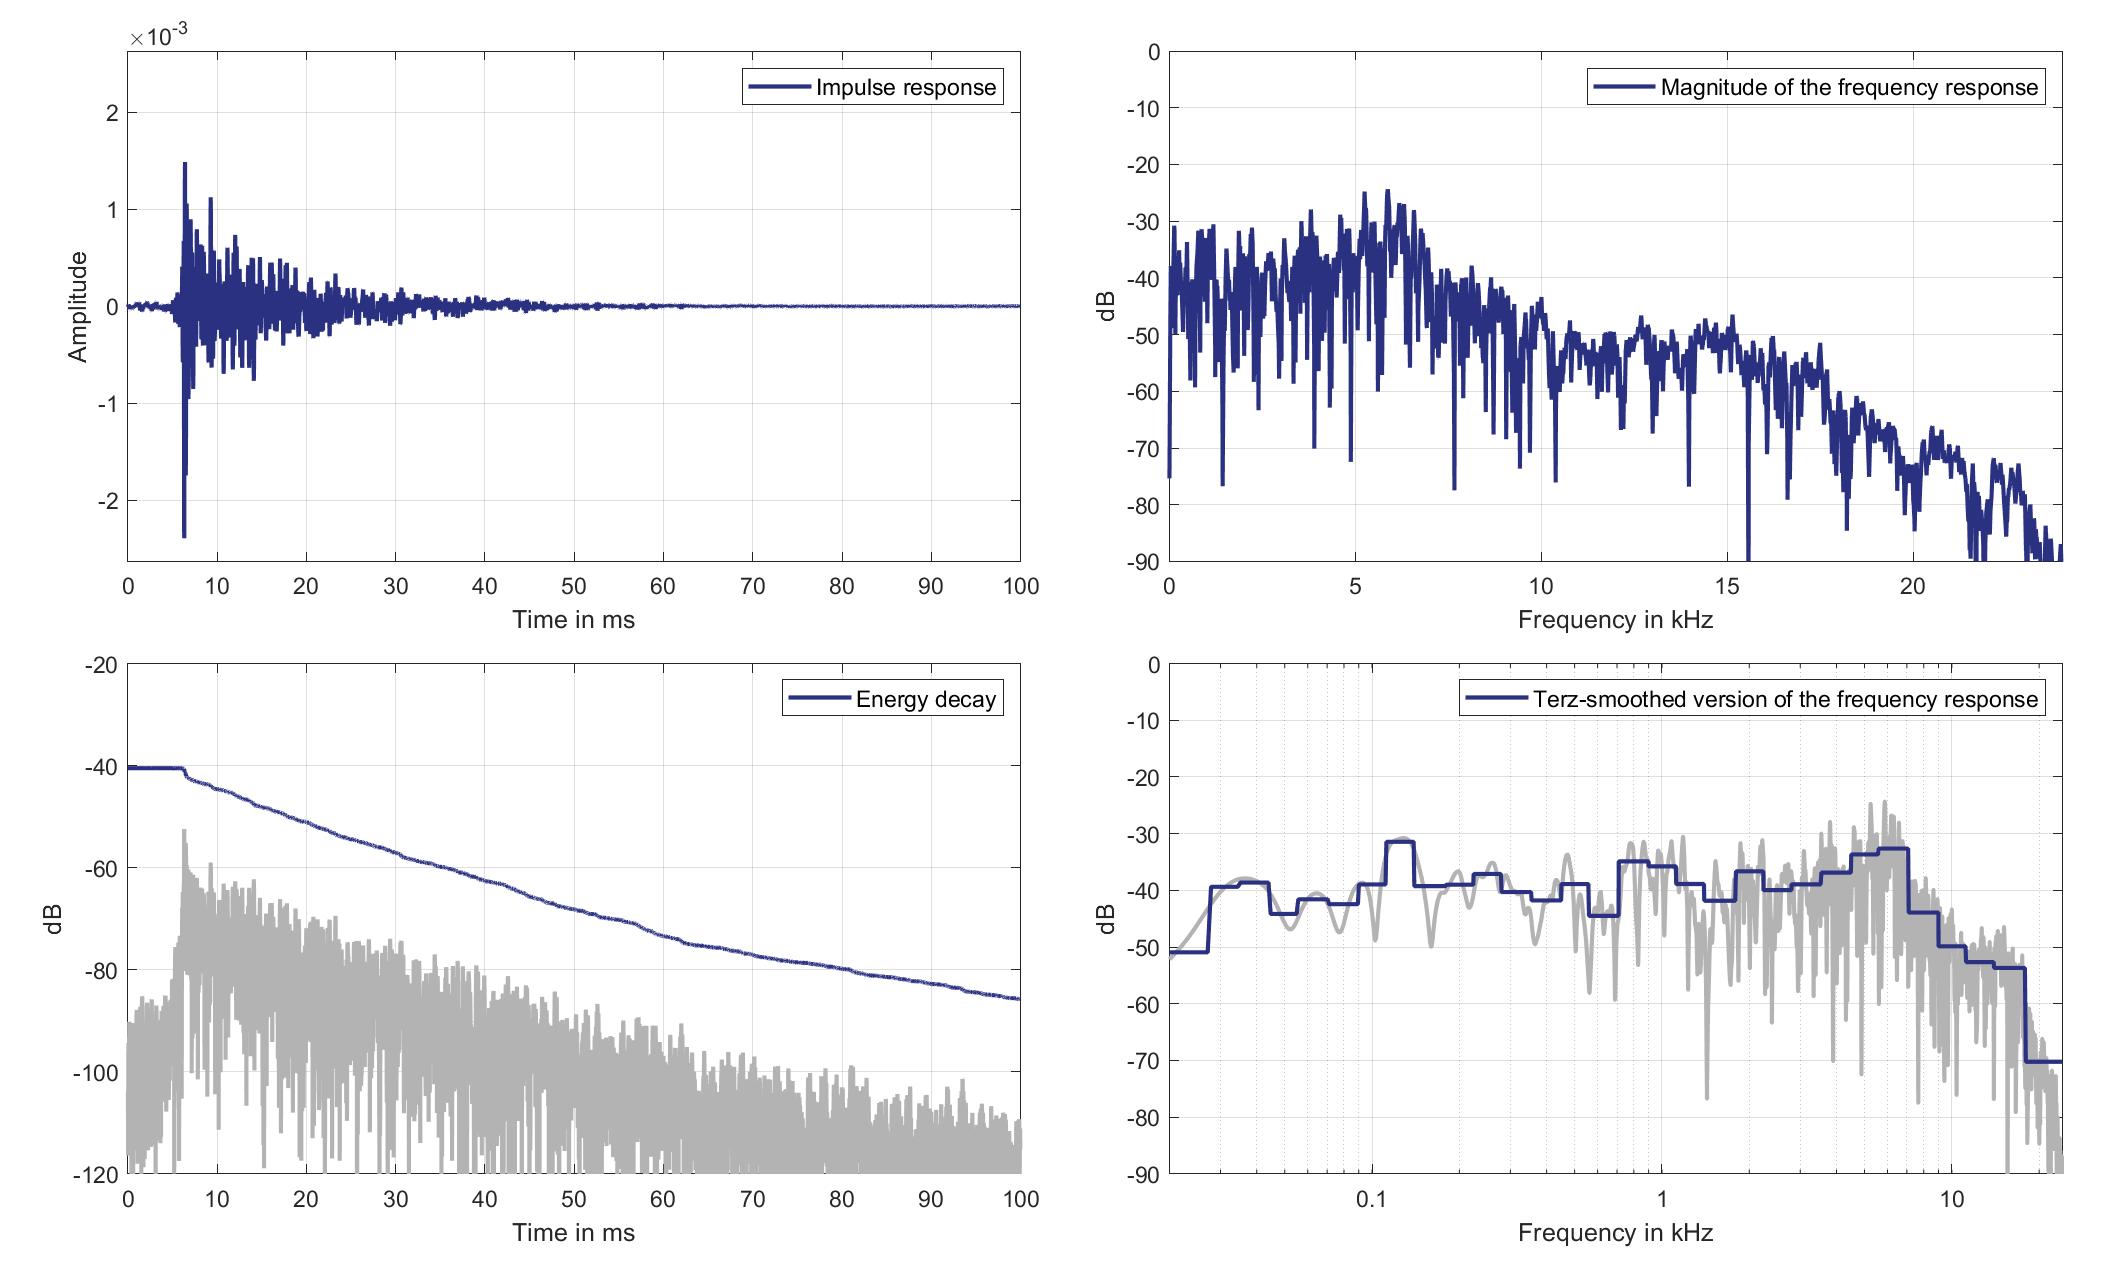
Download impulse response (in ".fir" format).
In the download section you can download all impulse response files as well as format explanation and Matlab as well as Python code examples for loading fir files.
Mic. 6
Mouth Loudspeaker of Zone 6 (Lsp. 16) to Standard Car Microphone 6 (Mic. 6)
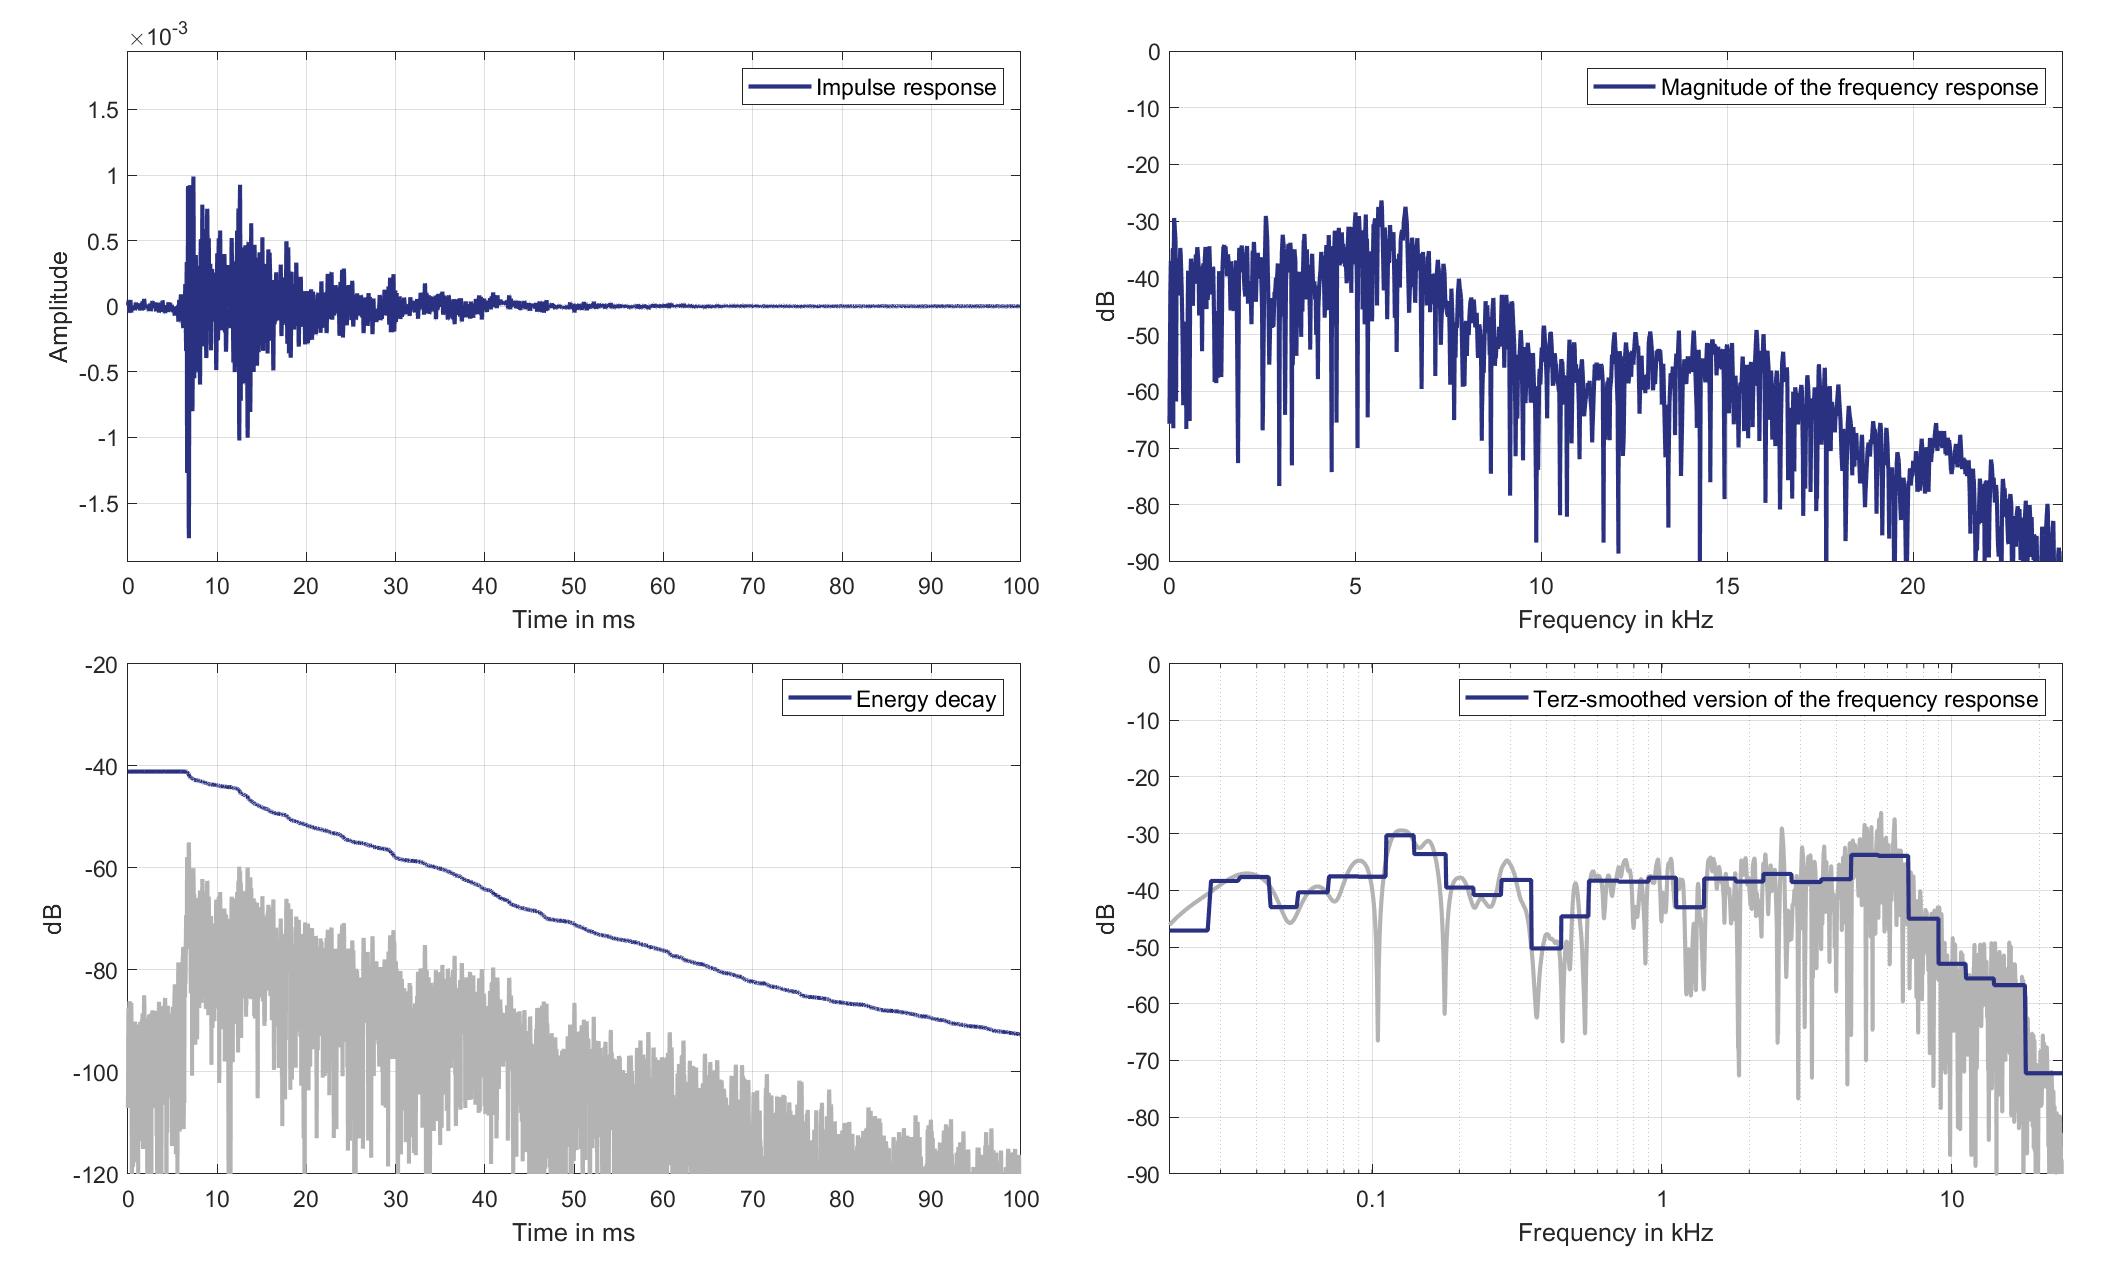
Download impulse response (in ".fir" format).
In the download section you can download all impulse response files as well as format explanation and Matlab as well as Python code examples for loading fir files.
Mic. 7
Mouth Loudspeaker of Zone 6 (Lsp. 16) to Standard Car Microphone 7 (Mic. 7)
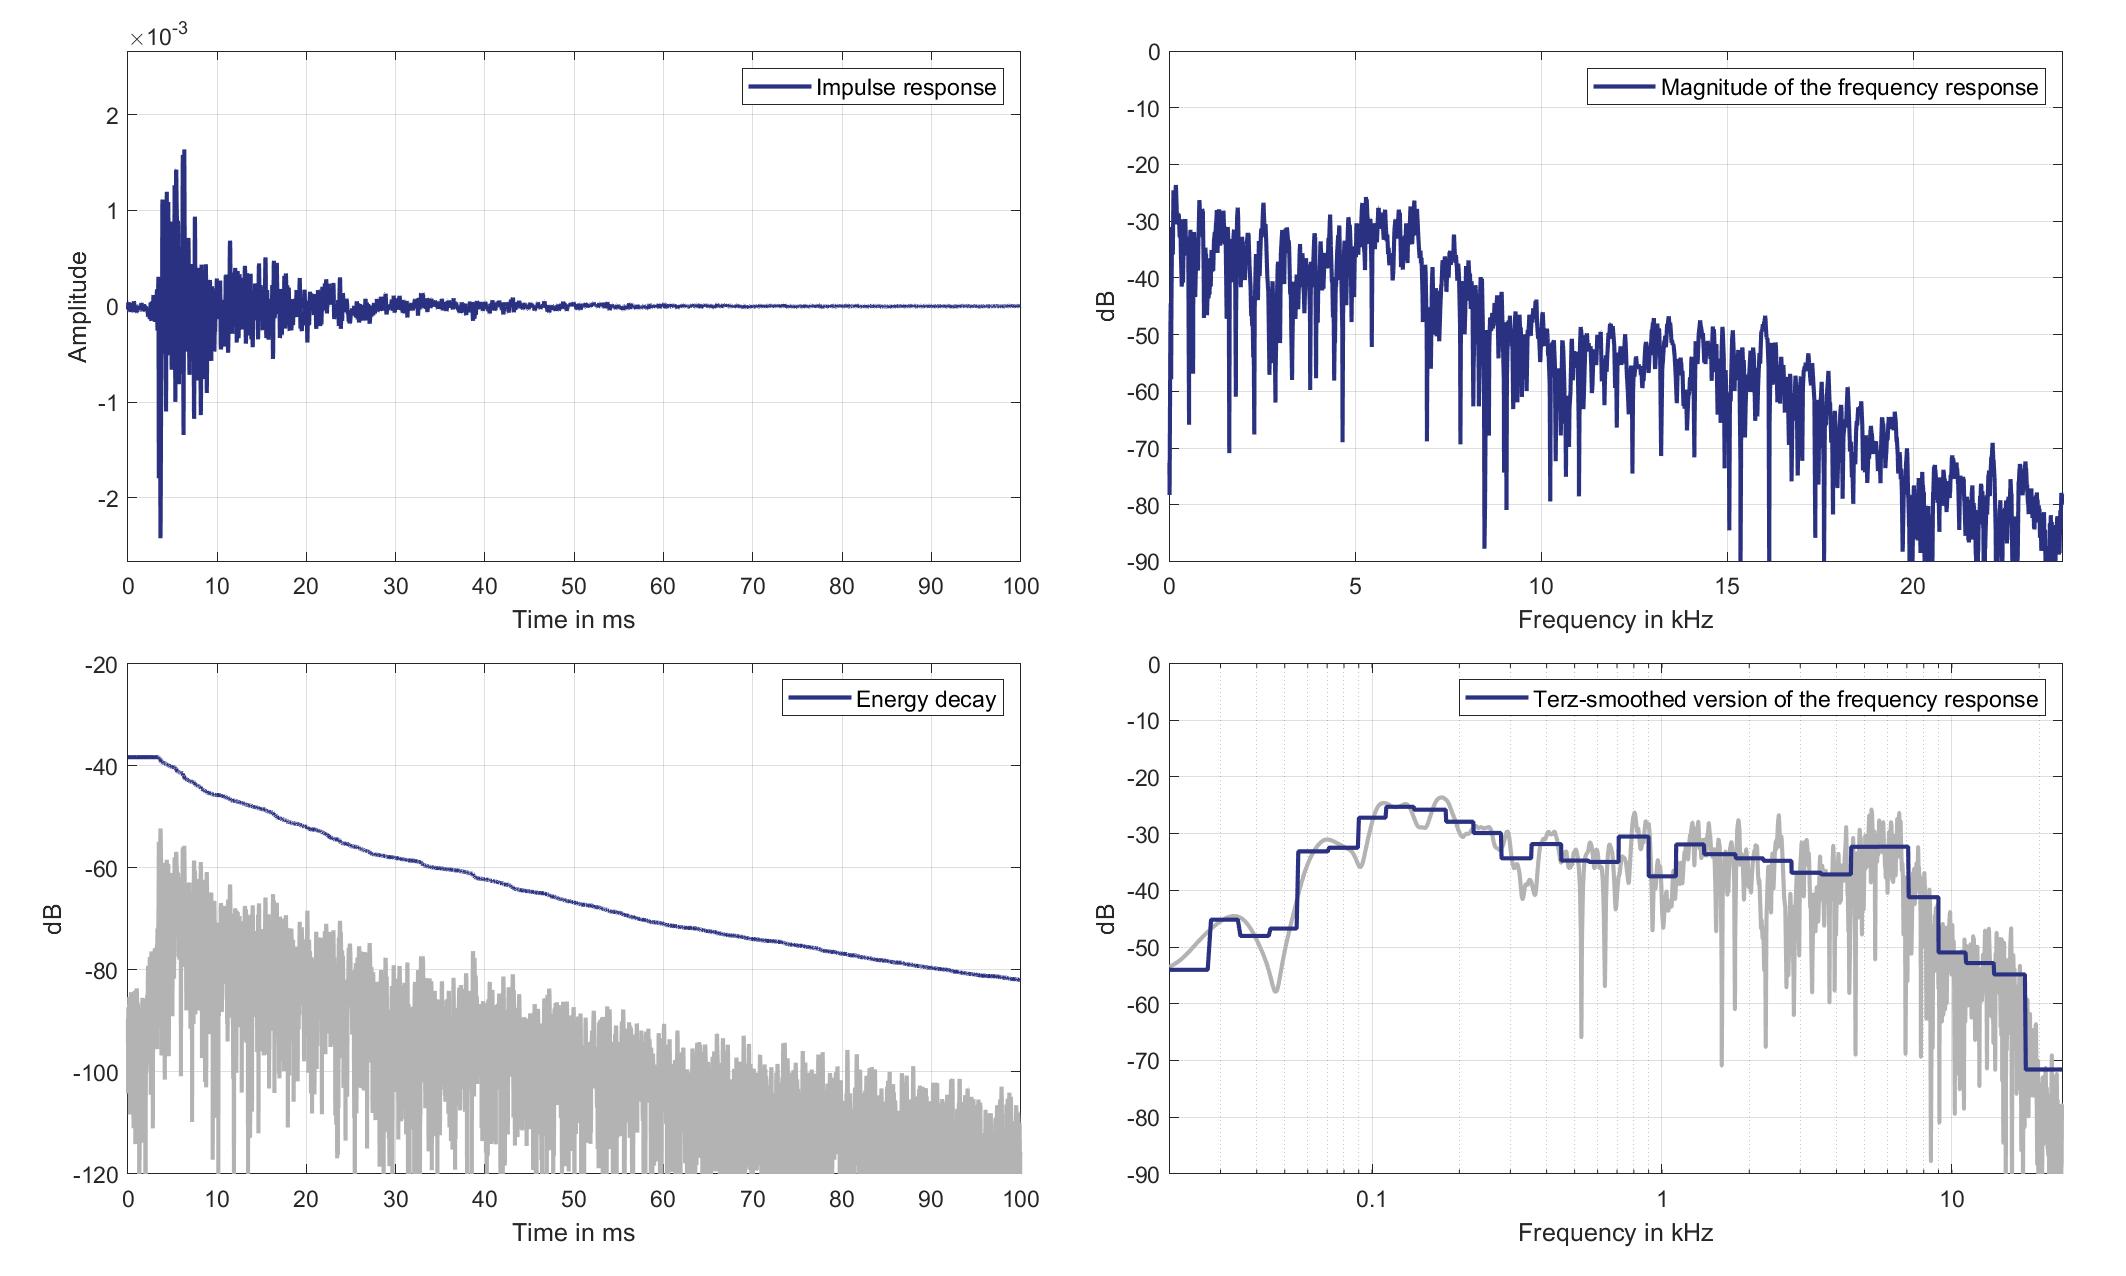
Download impulse response (in ".fir" format).
In the download section you can download all impulse response files as well as format explanation and Matlab as well as Python code examples for loading fir files.
Mic. 8
Mouth Loudspeaker of Zone 6 (Lsp. 16) to Standard Car Microphone 8 (Mic. 8)
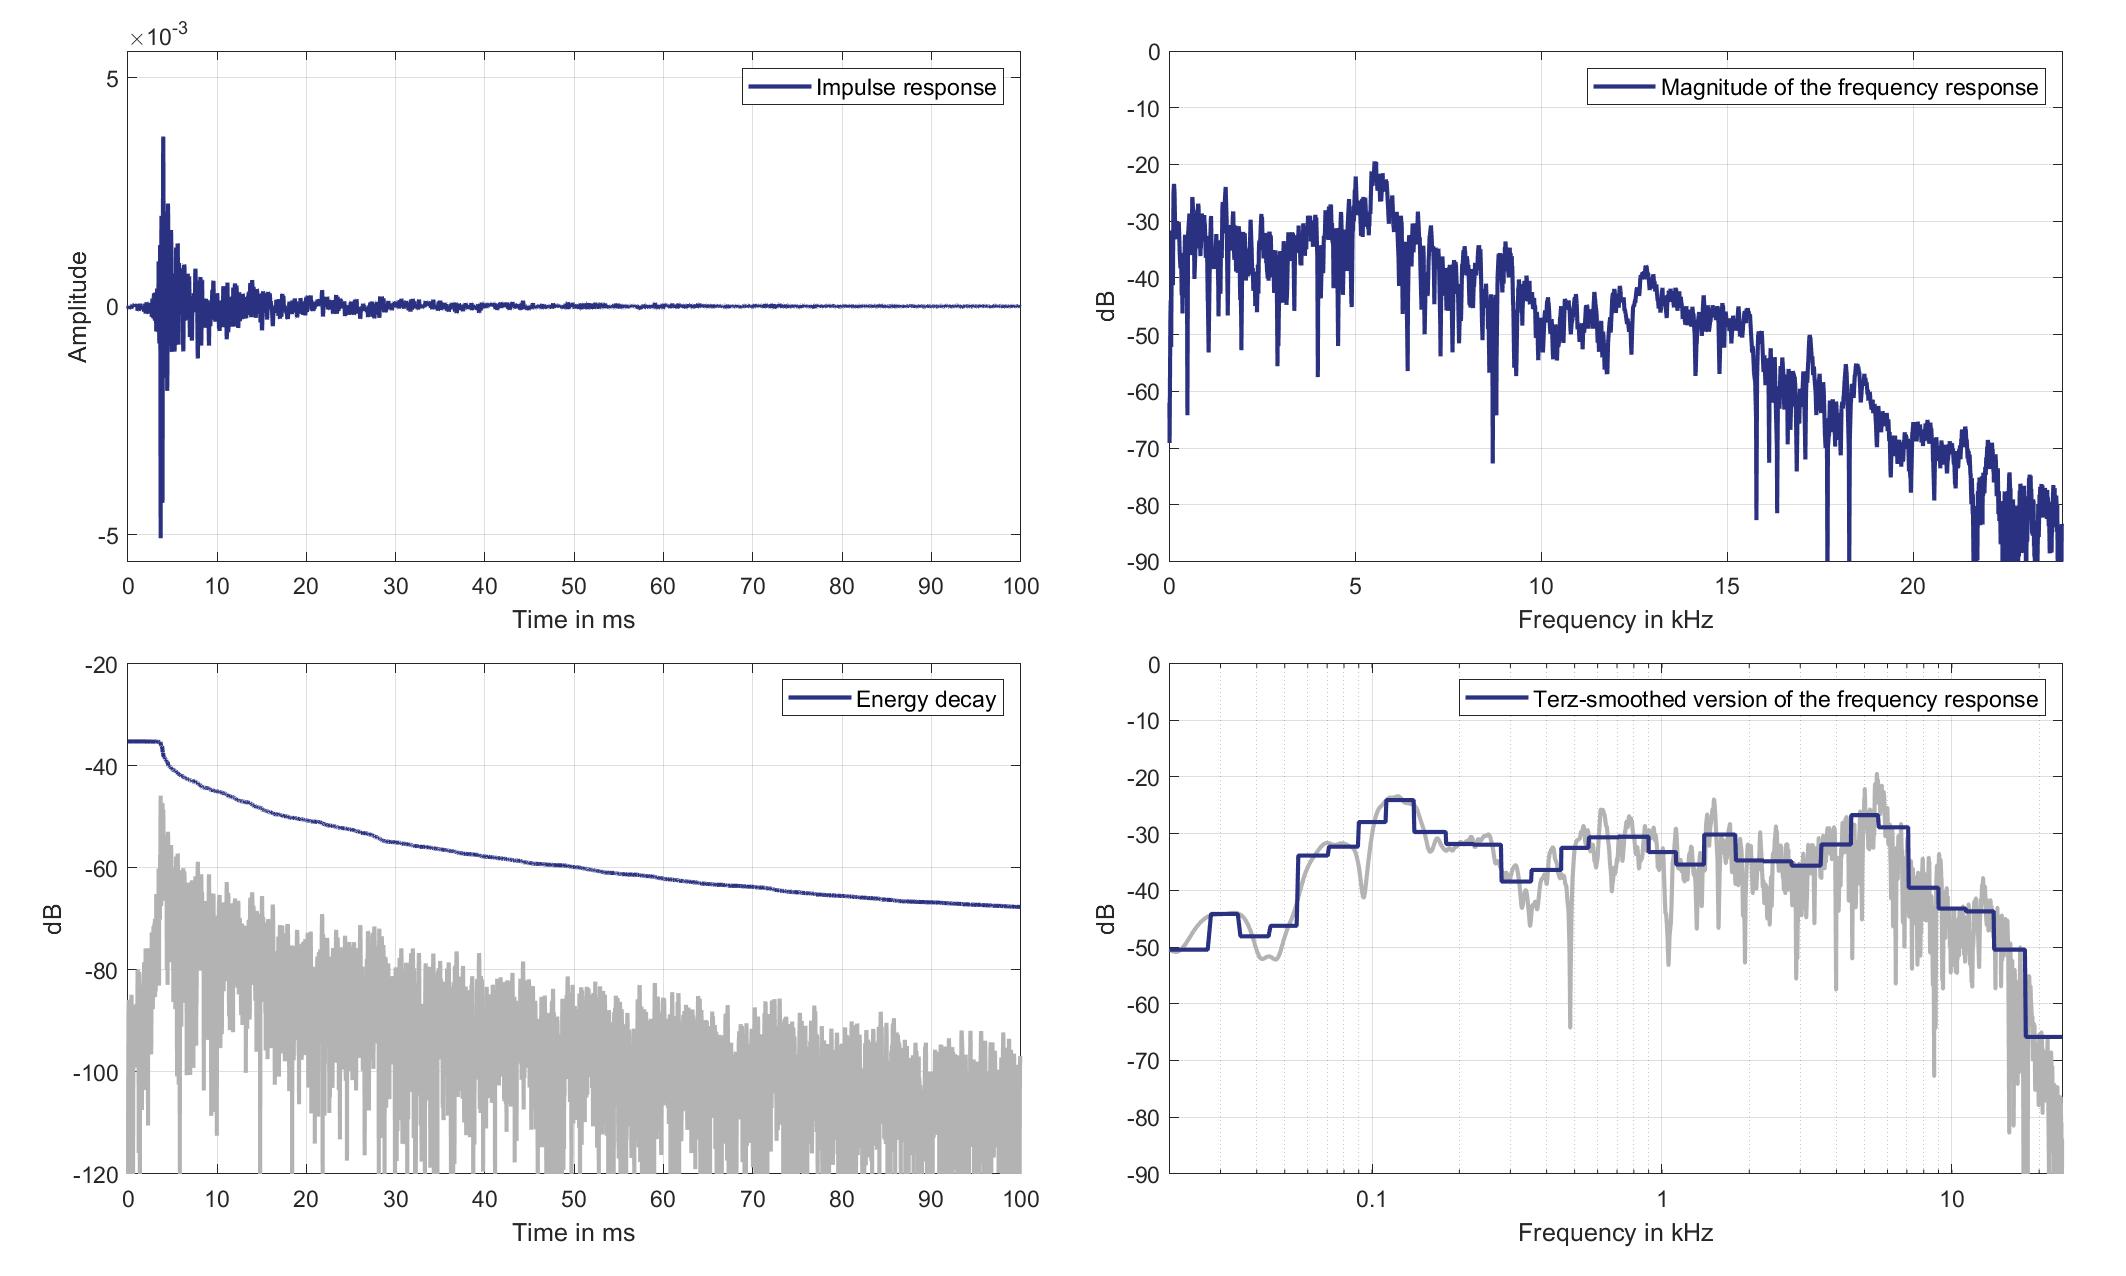
Download impulse response (in ".fir" format).
In the download section you can download all impulse response files as well as format explanation and Matlab as well as Python code examples for loading fir files.
Mic. 9
Mouth Loudspeaker of Zone 6 (Lsp. 16) to Standard Car Microphone 9 (Mic. 9)
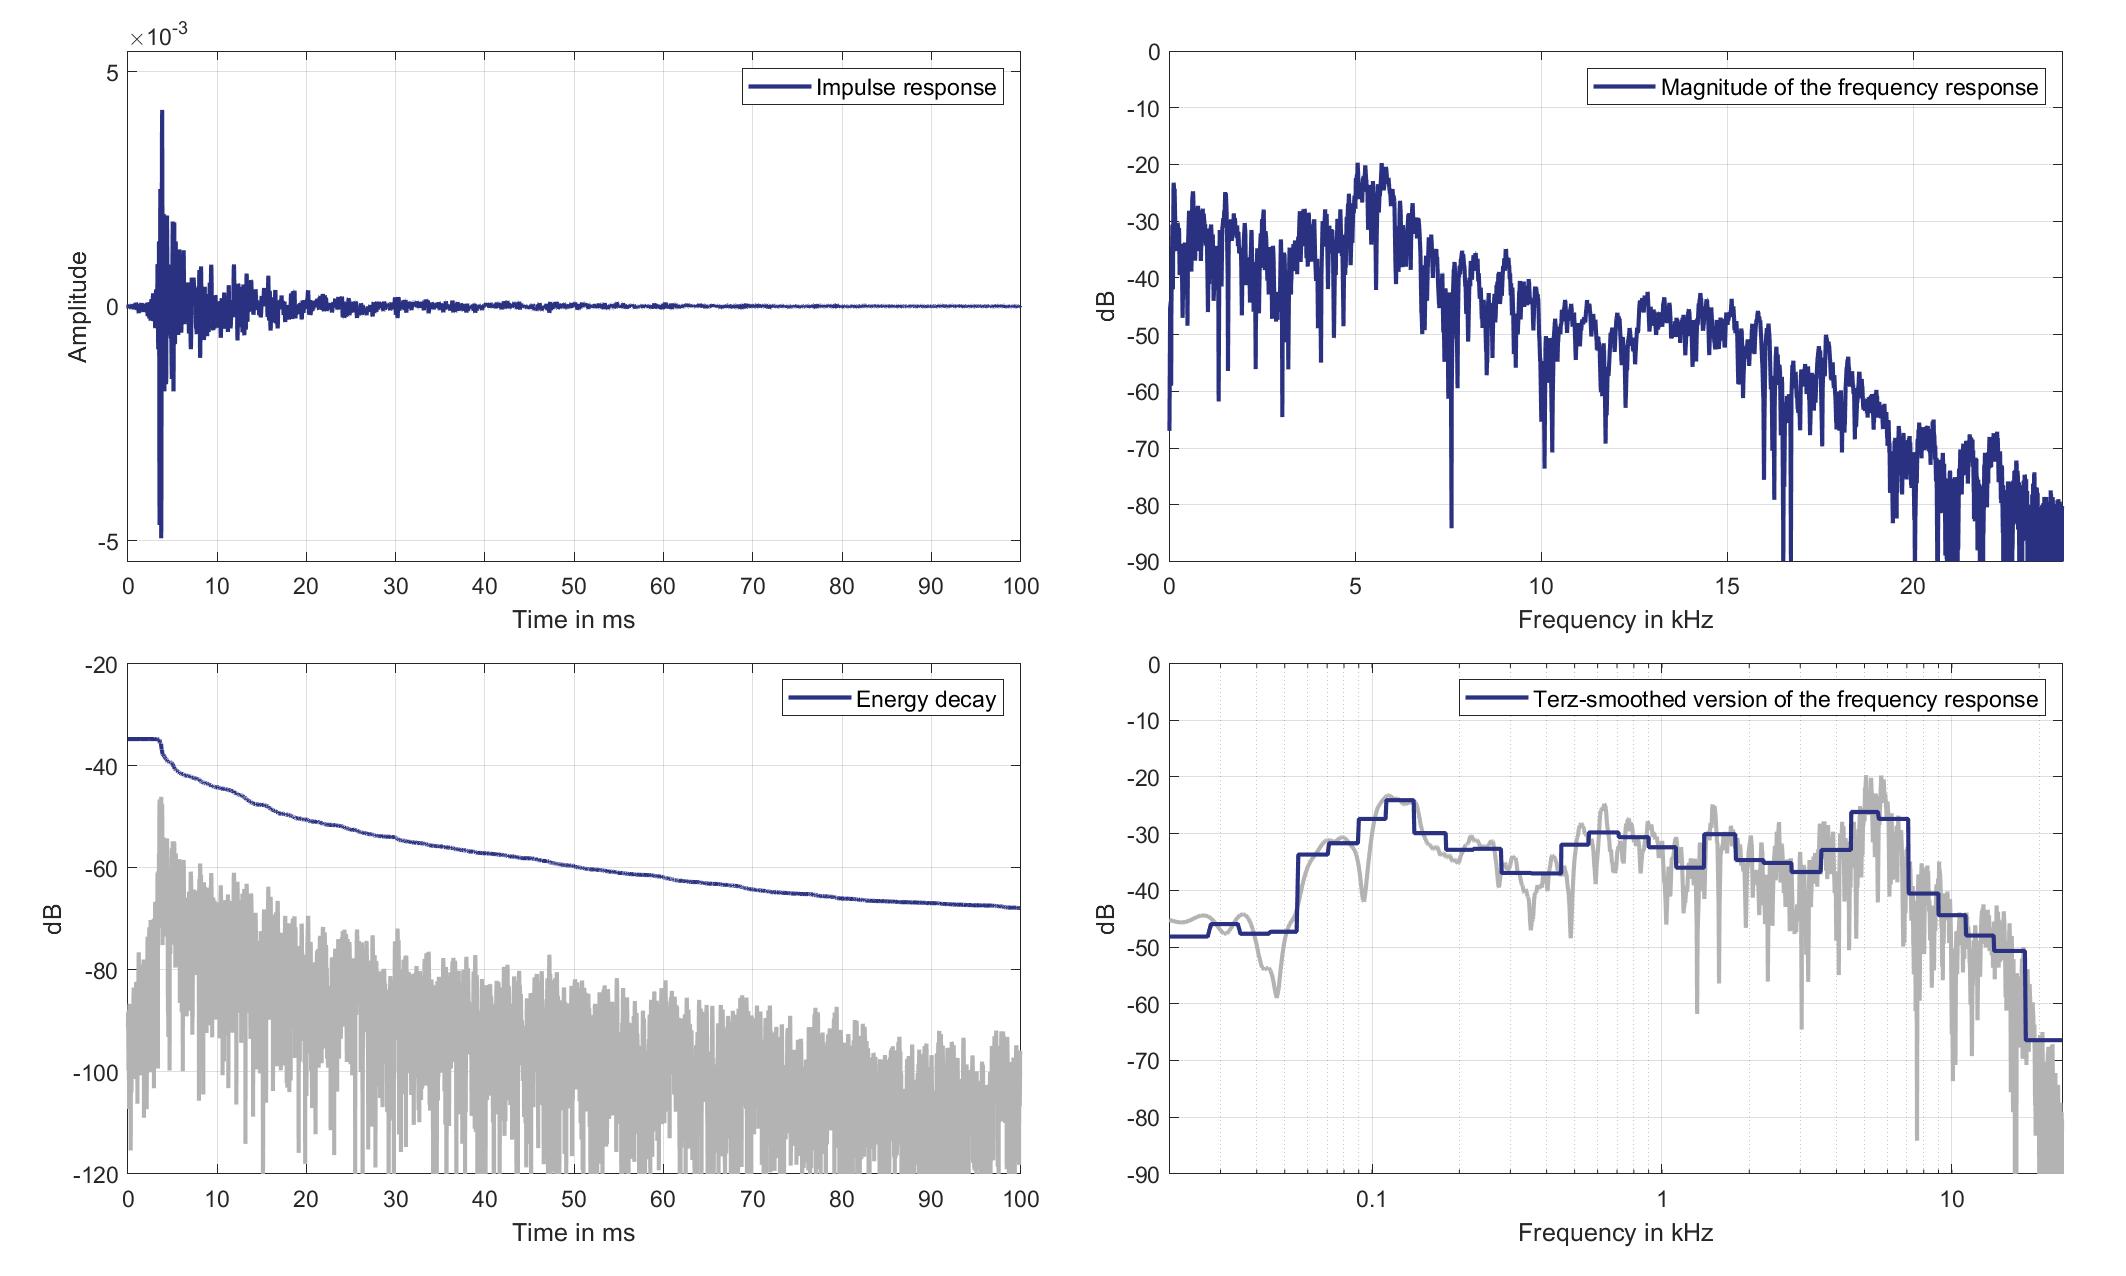
Download impulse response (in ".fir" format).
In the download section you can download all impulse response files as well as format explanation and Matlab as well as Python code examples for loading fir files.
Mic. 10
Mouth Loudspeaker of Zone 6 (Lsp. 16) to Standard Car Microphone 10 (Mic. 10)
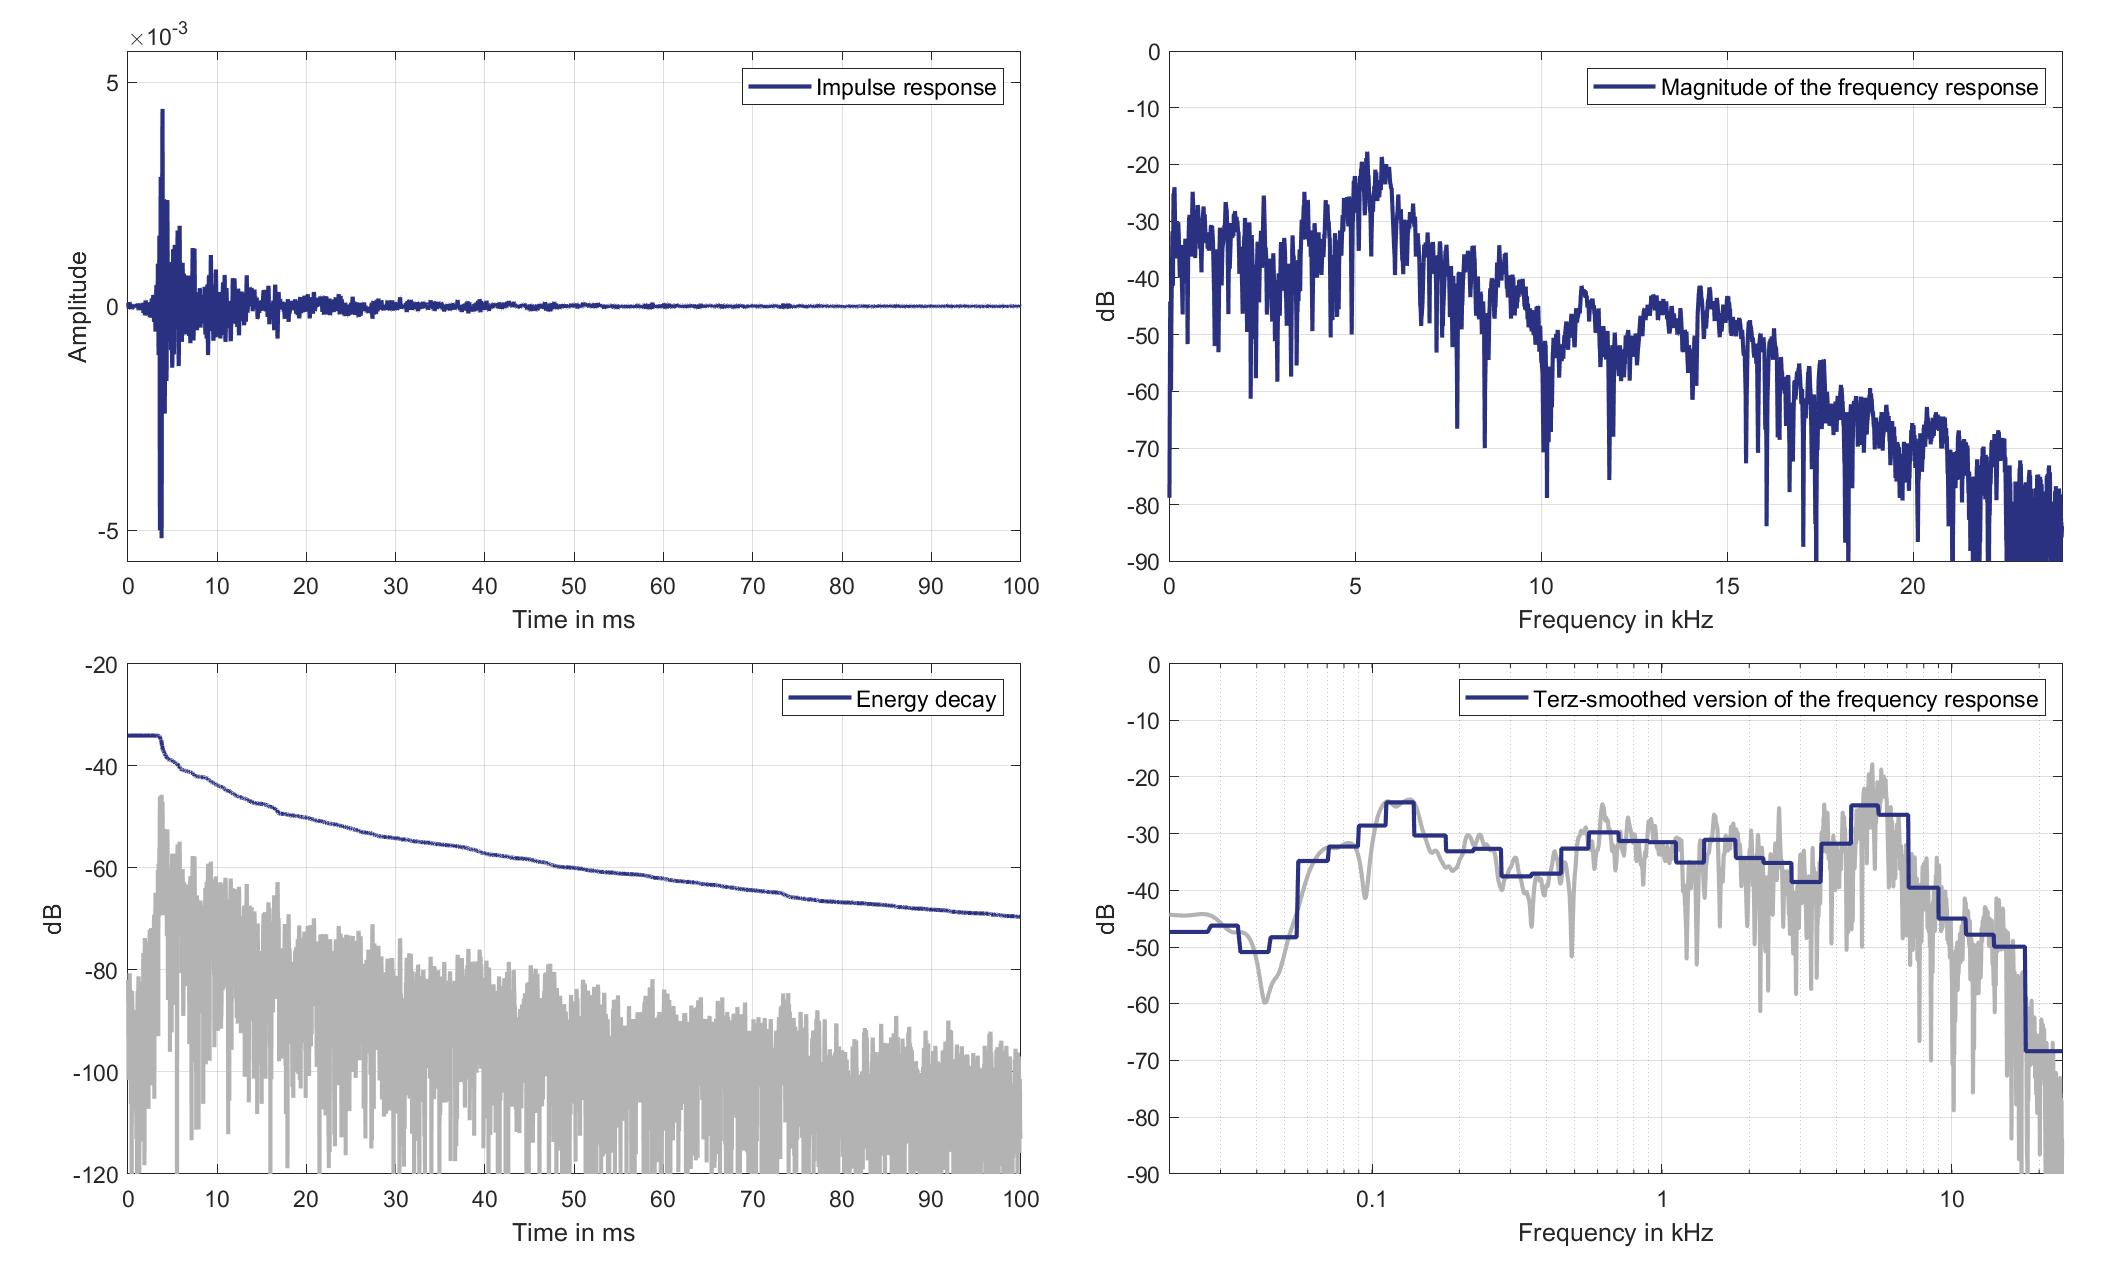
Download impulse response (in ".fir" format).
In the download section you can download all impulse response files as well as format explanation and Matlab as well as Python code examples for loading fir files.
Mic. 11
Mouth Loudspeaker of Zone 6 (Lsp. 16) to Standard Car Microphone 11 (Mic. 11)
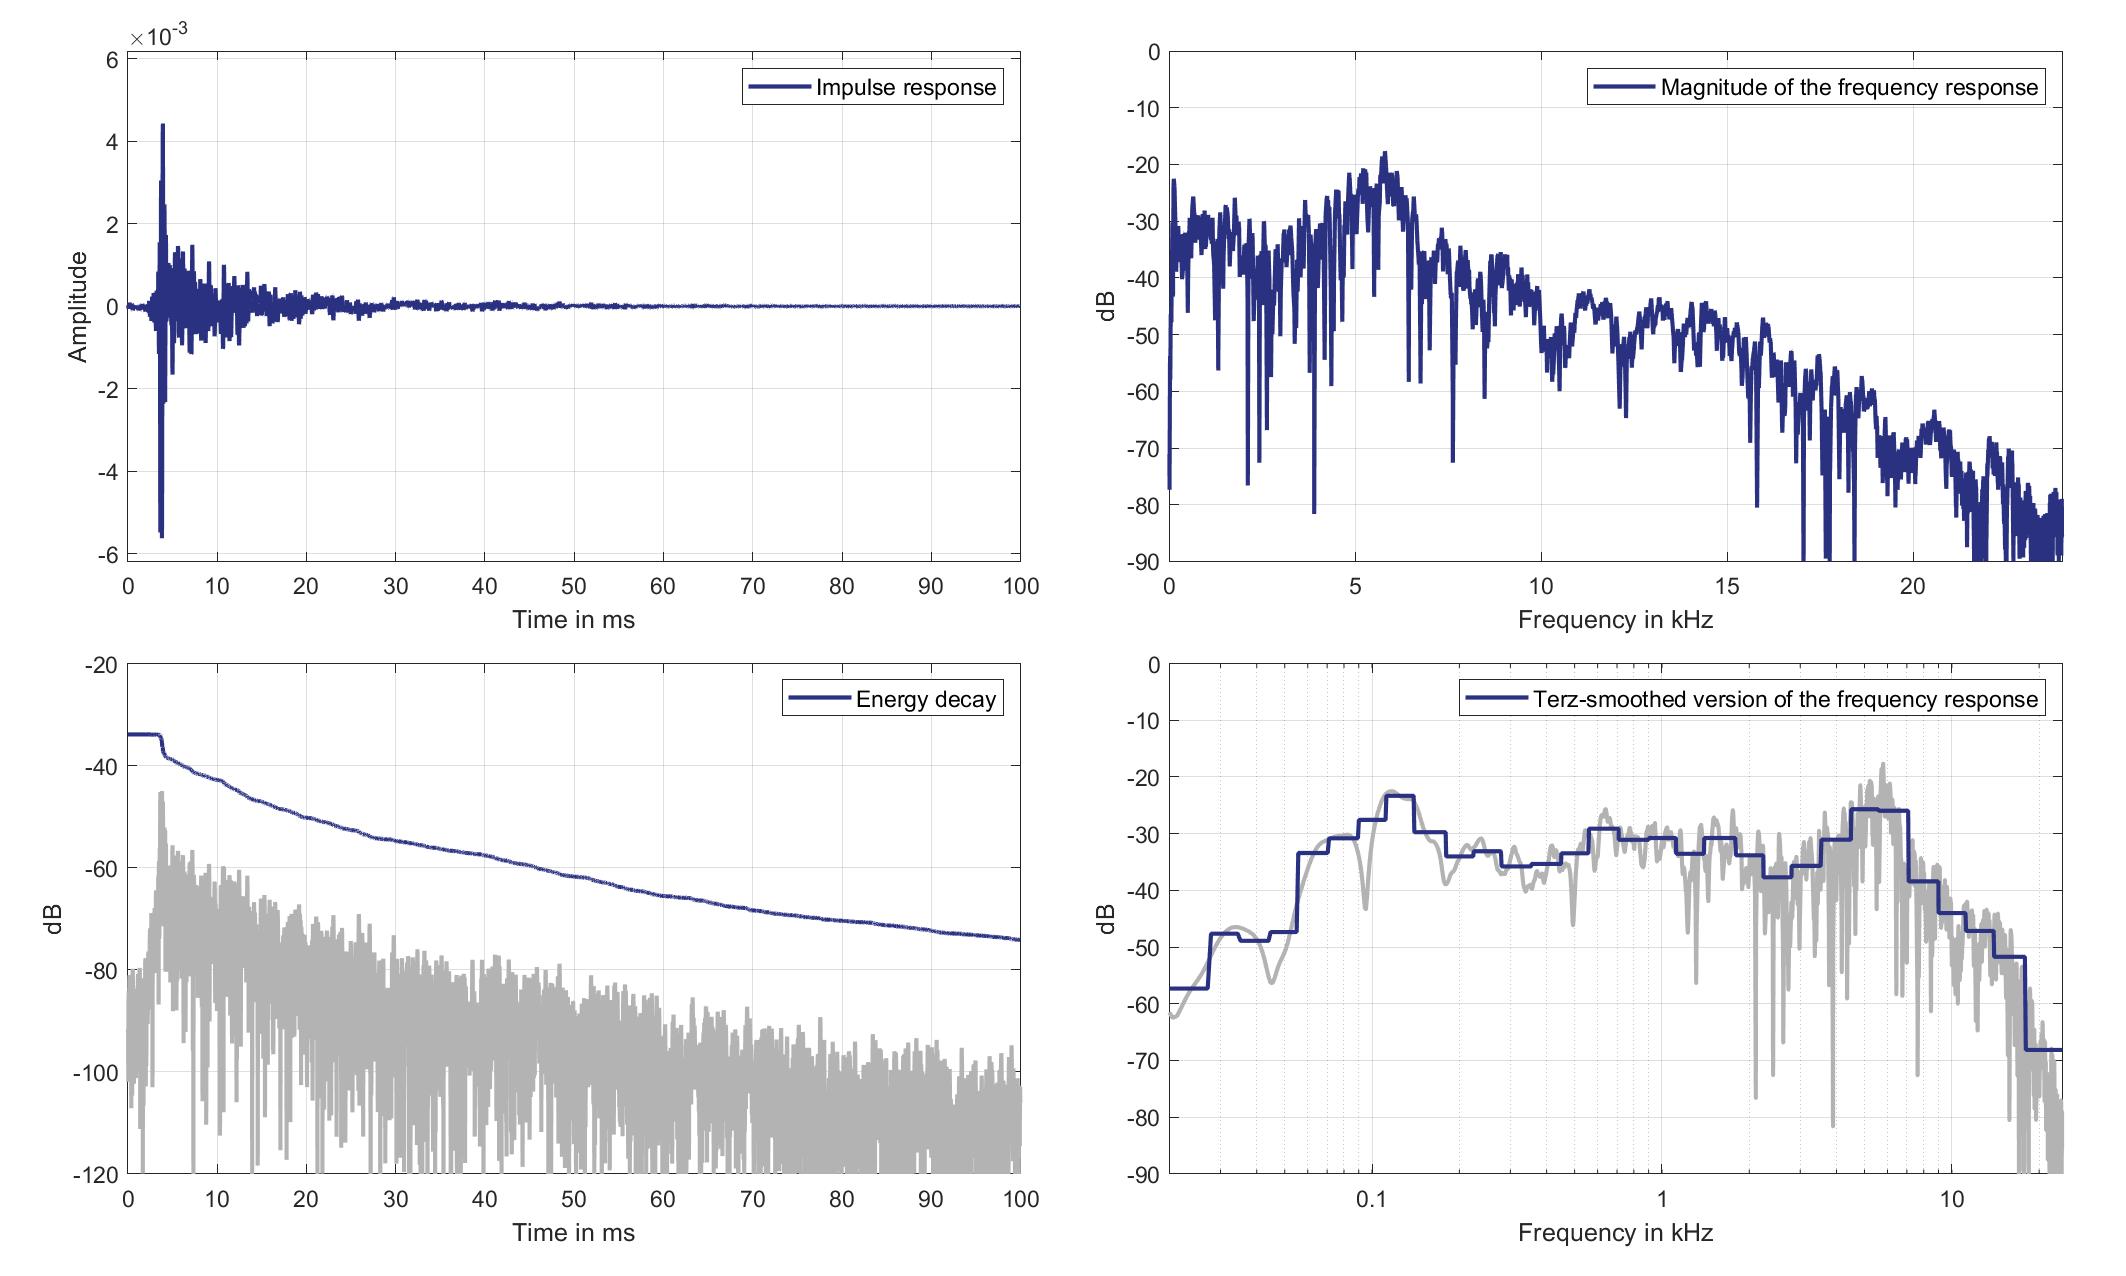
Download impulse response (in ".fir" format).
In the download section you can download all impulse response files as well as format explanation and Matlab as well as Python code examples for loading fir files.
Mic. 12
Mouth Loudspeaker of Zone 6 (Lsp. 16) to Standard Car Microphone 12 (Mic. 12)
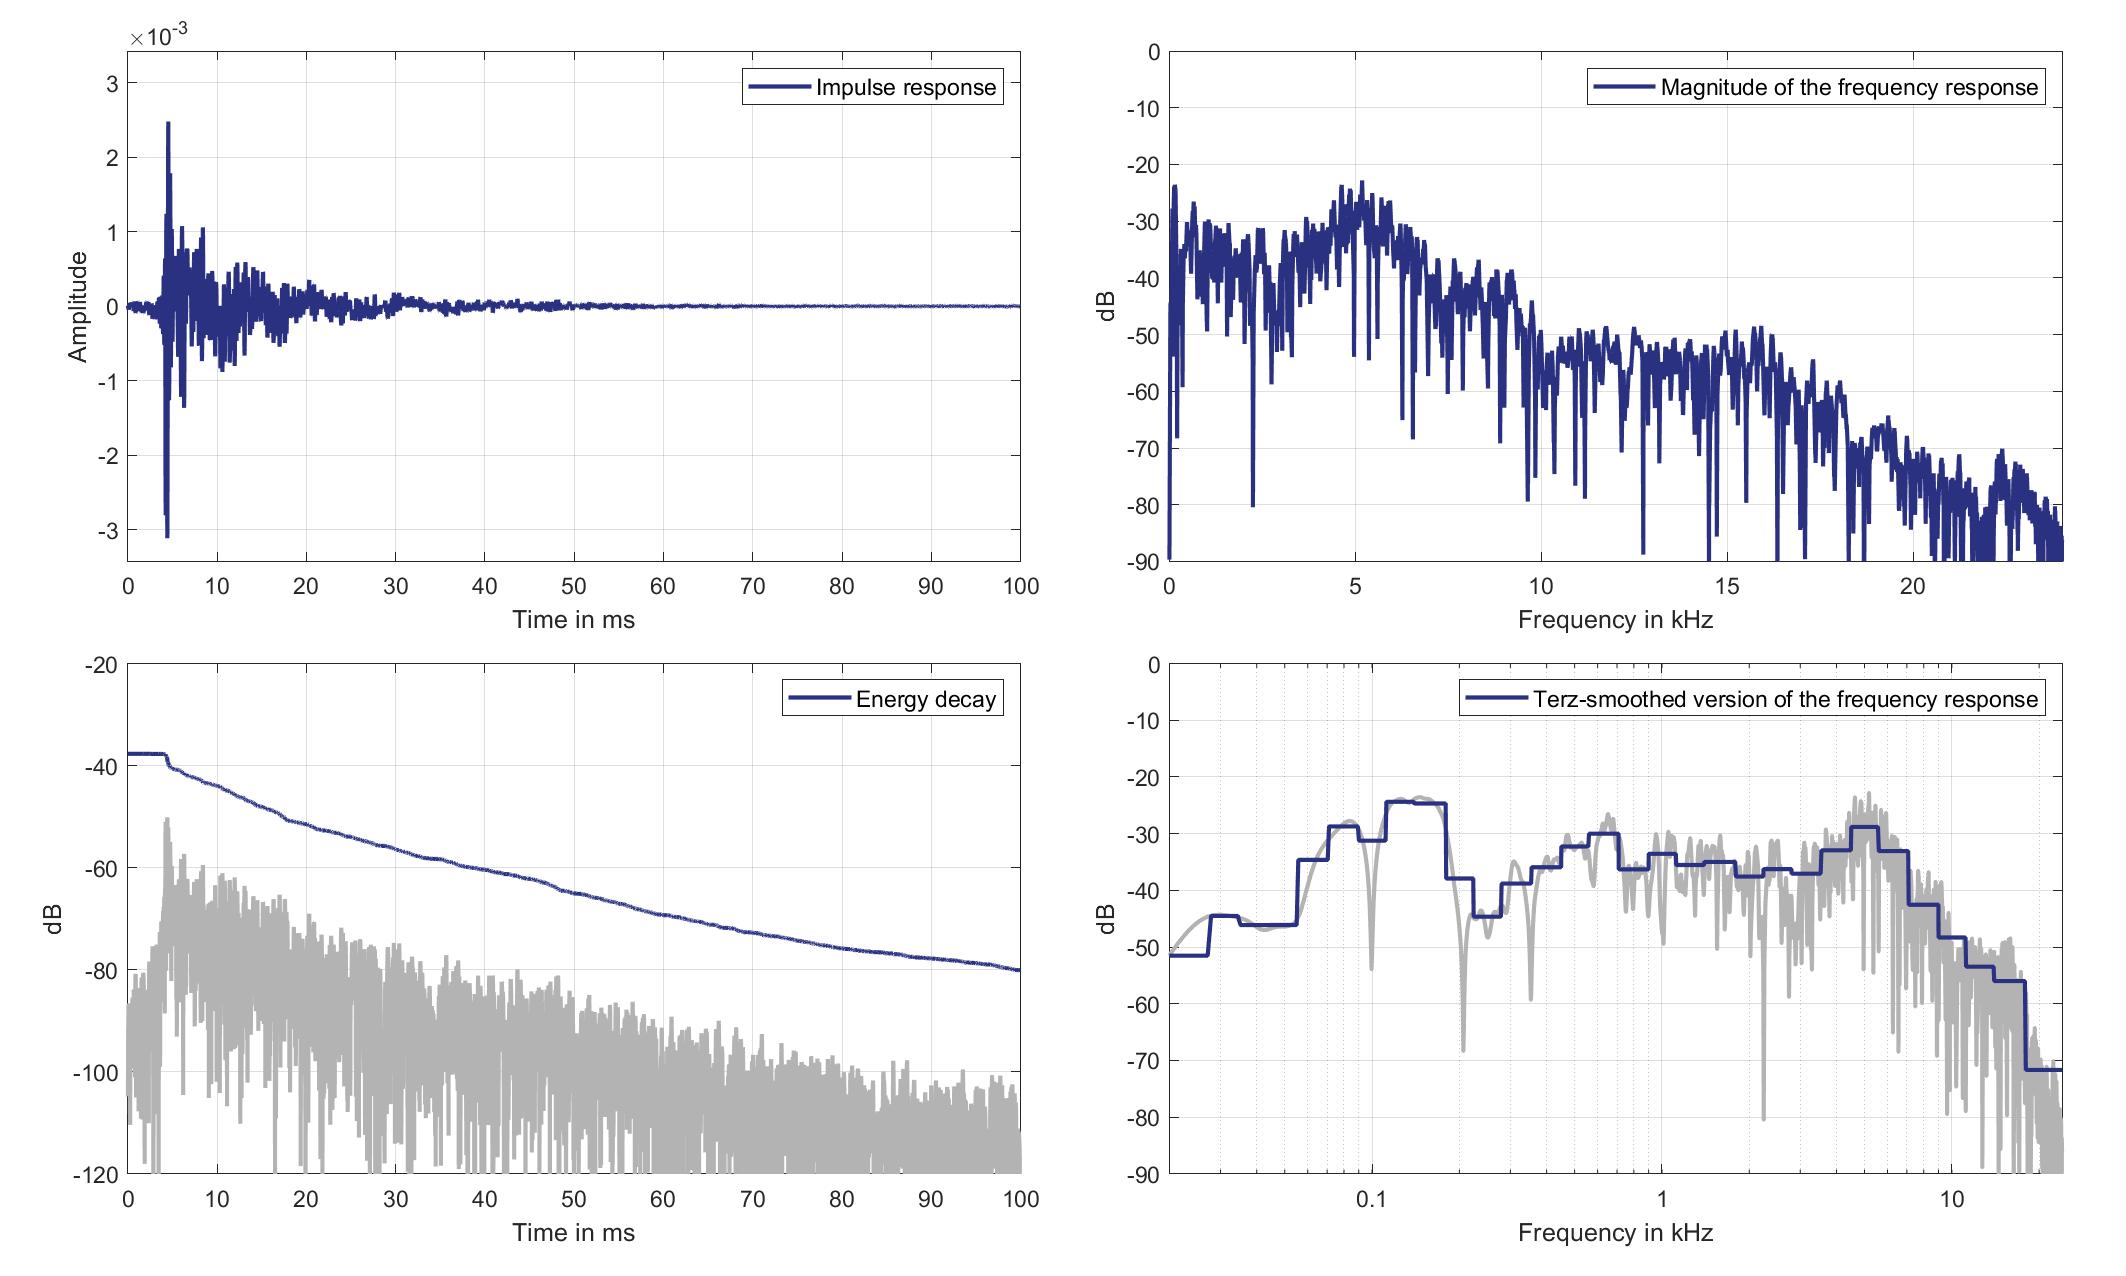
Download impulse response (in ".fir" format).
In the download section you can download all impulse response files as well as format explanation and Matlab as well as Python code examples for loading fir files.
Mic. 13
Mouth Loudspeaker of Zone 6 (Lsp. 16) to Standard Car Microphone 13 (Mic. 13)
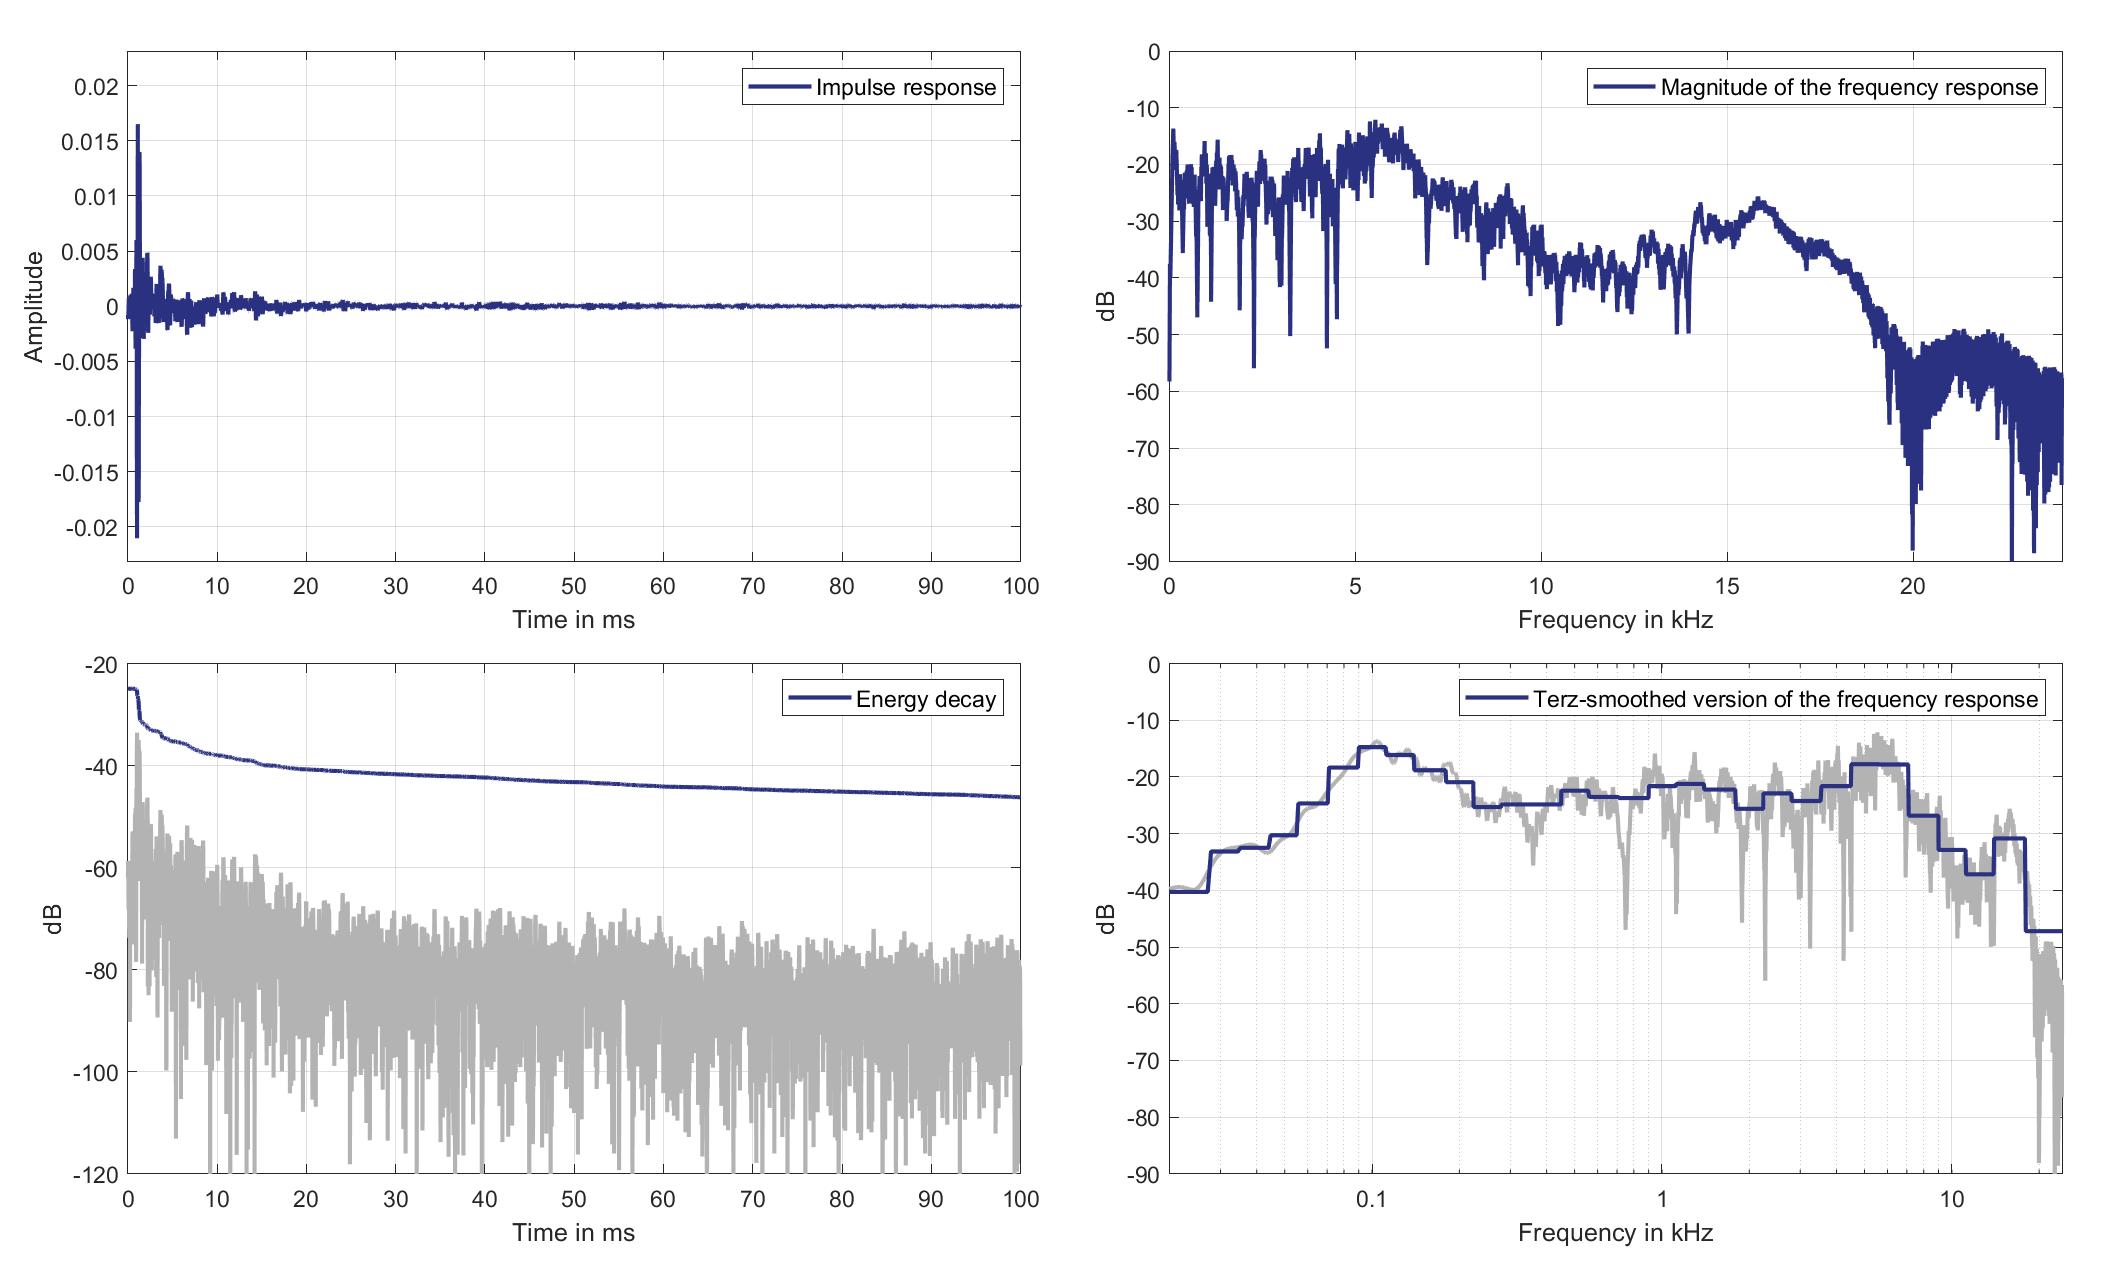
Download impulse response (in ".fir" format).
In the download section you can download all impulse response files as well as format explanation and Matlab as well as Python code examples for loading fir files.
Mic. 14
Mouth Loudspeaker of Zone 6 (Lsp. 16) to Standard Car Microphone 14 (Mic. 14)
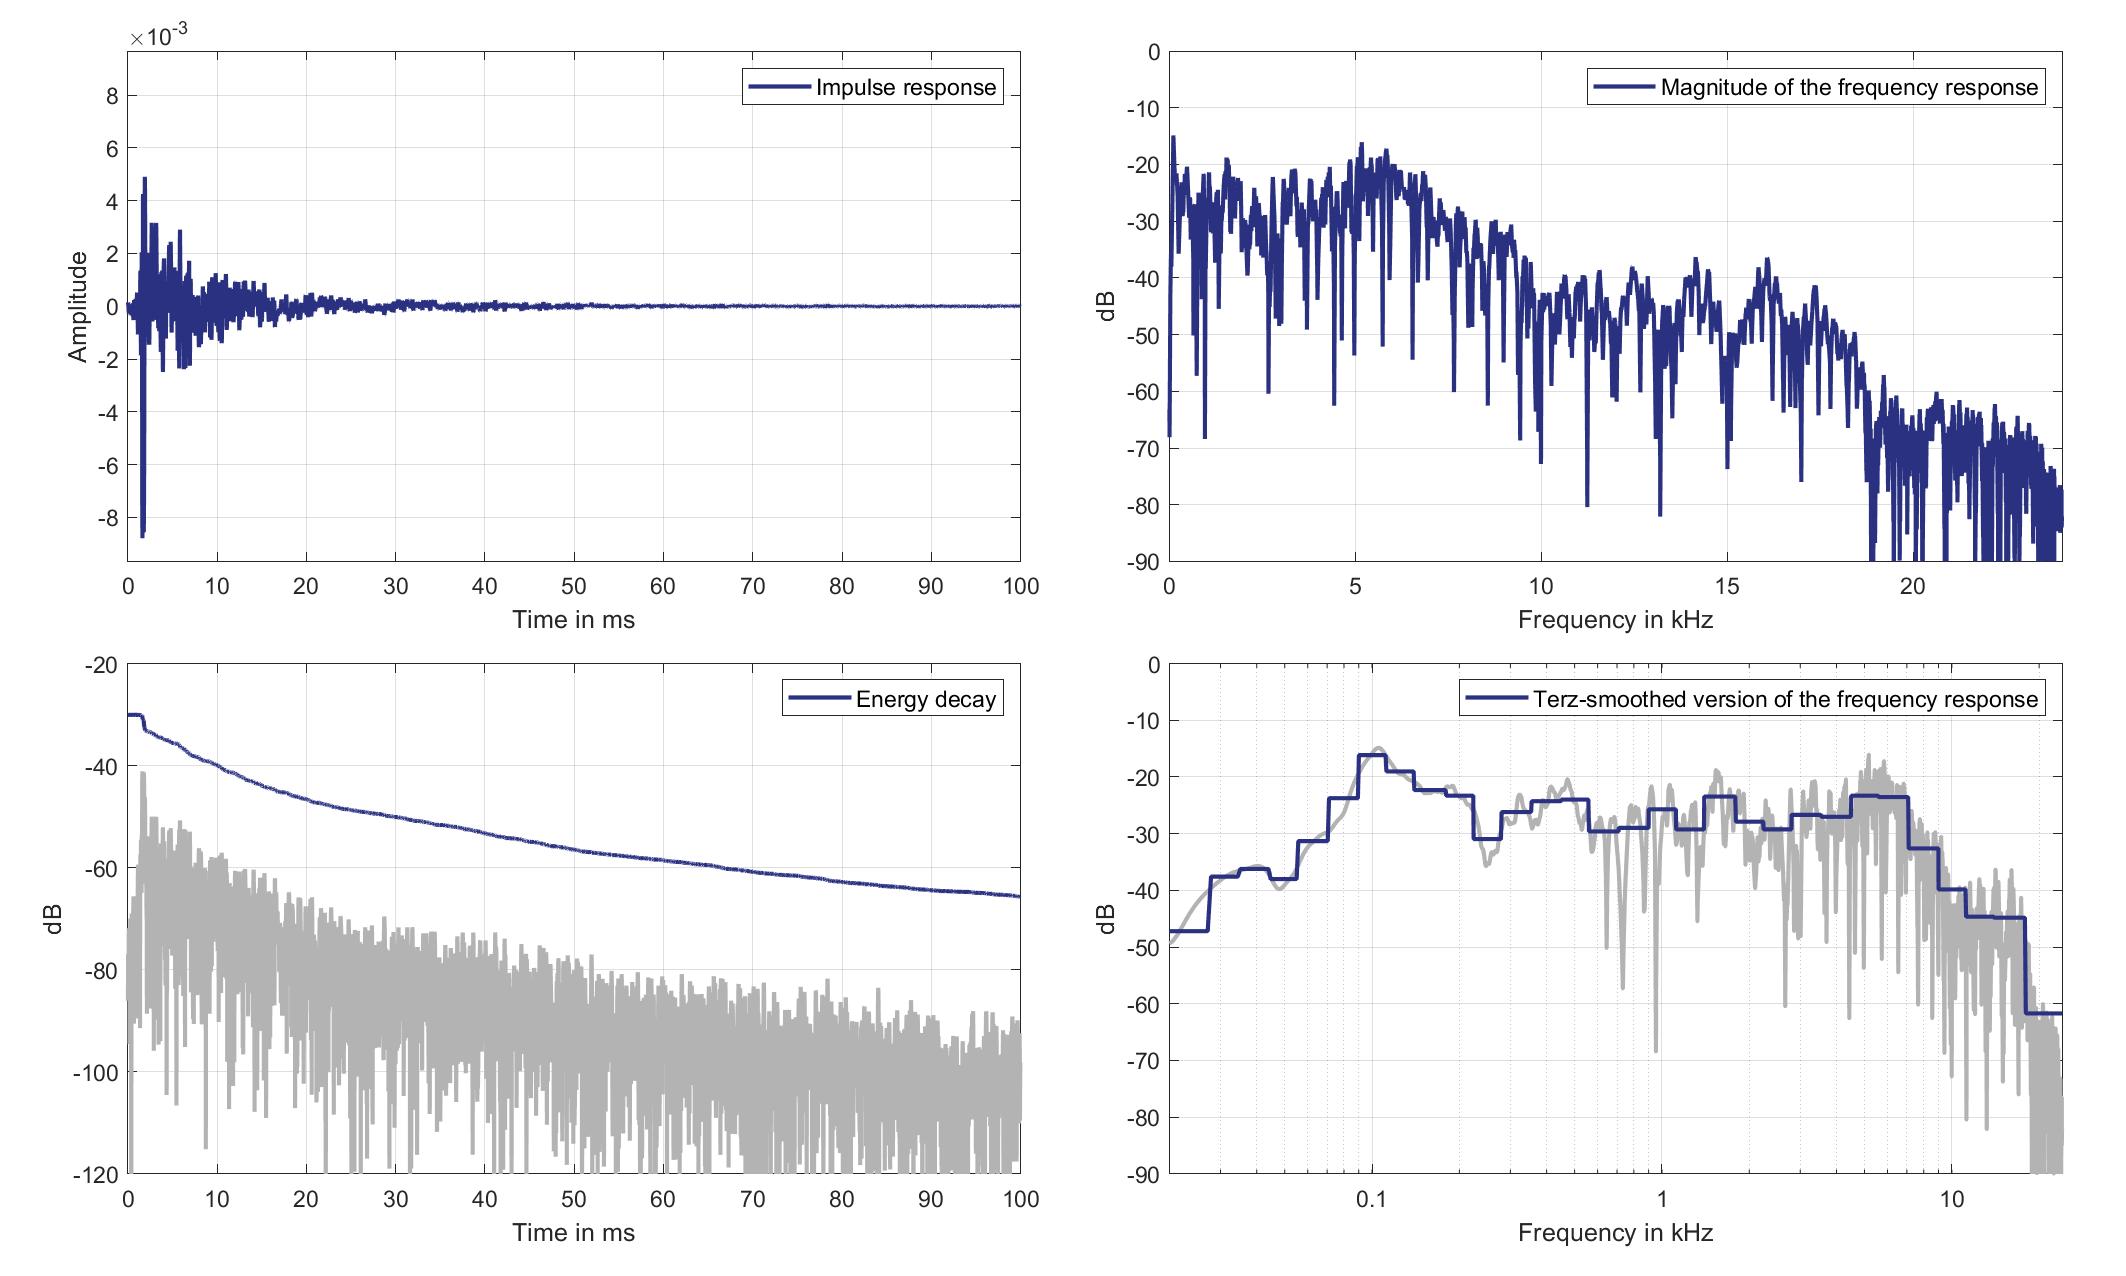
Download impulse response (in ".fir" format).
In the download section you can download all impulse response files as well as format explanation and Matlab as well as Python code examples for loading fir files.
Mic. 15
Mouth Loudspeaker of Zone 6 (Lsp. 16) to Standard Car Microphone 15 (Mic. 15)
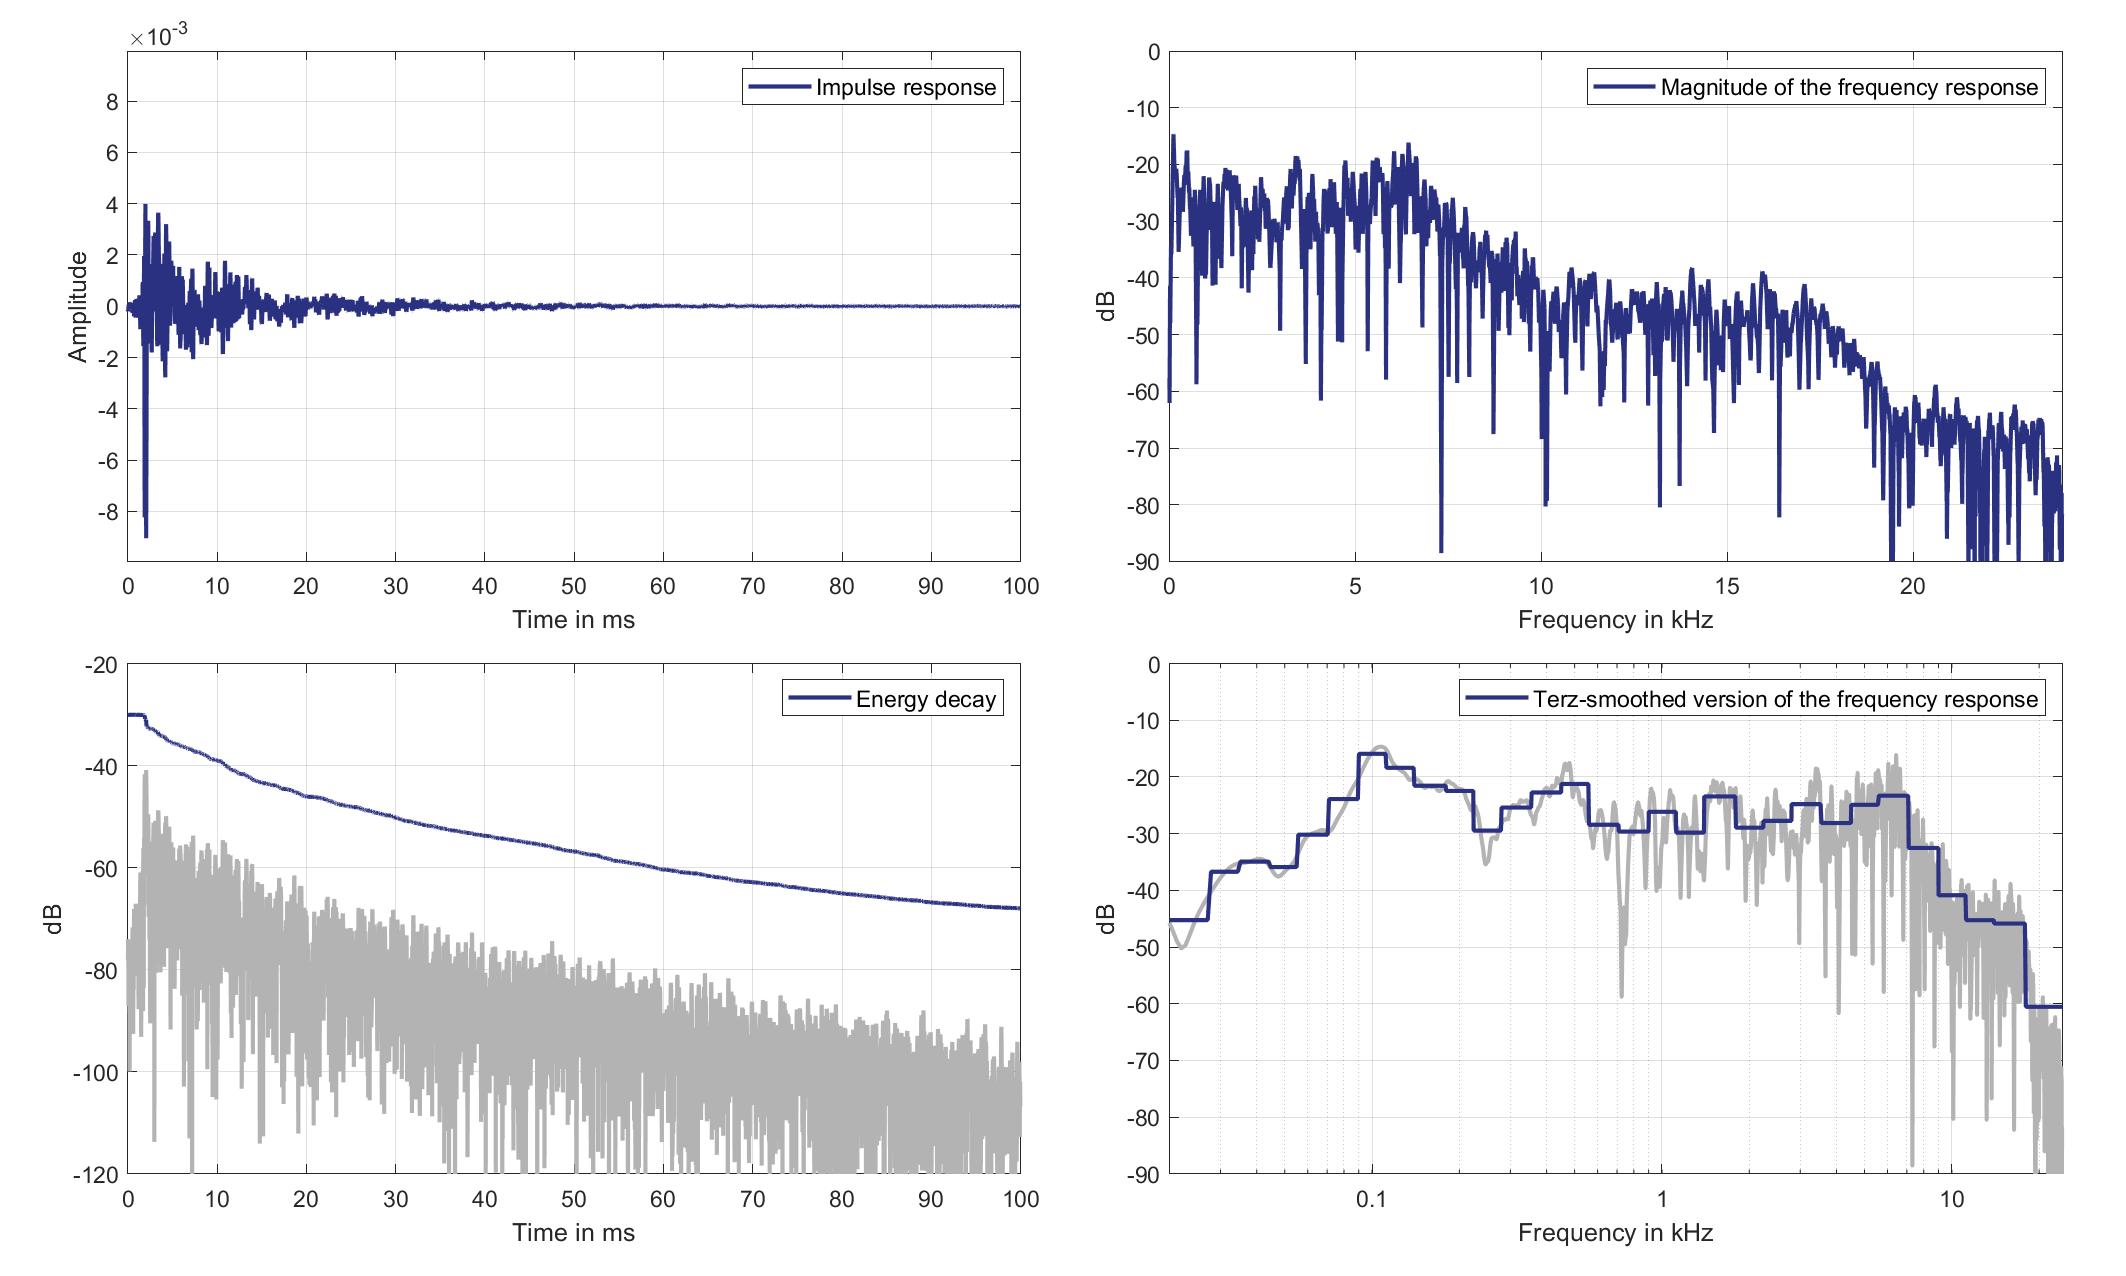
Download impulse response (in ".fir" format).
In the download section you can download all impulse response files as well as format explanation and Matlab as well as Python code examples for loading fir files.
Mic. 16
Mouth Loudspeaker of Zone 6 (Lsp. 16) to Standard Car Microphone 16 (Mic. 16)
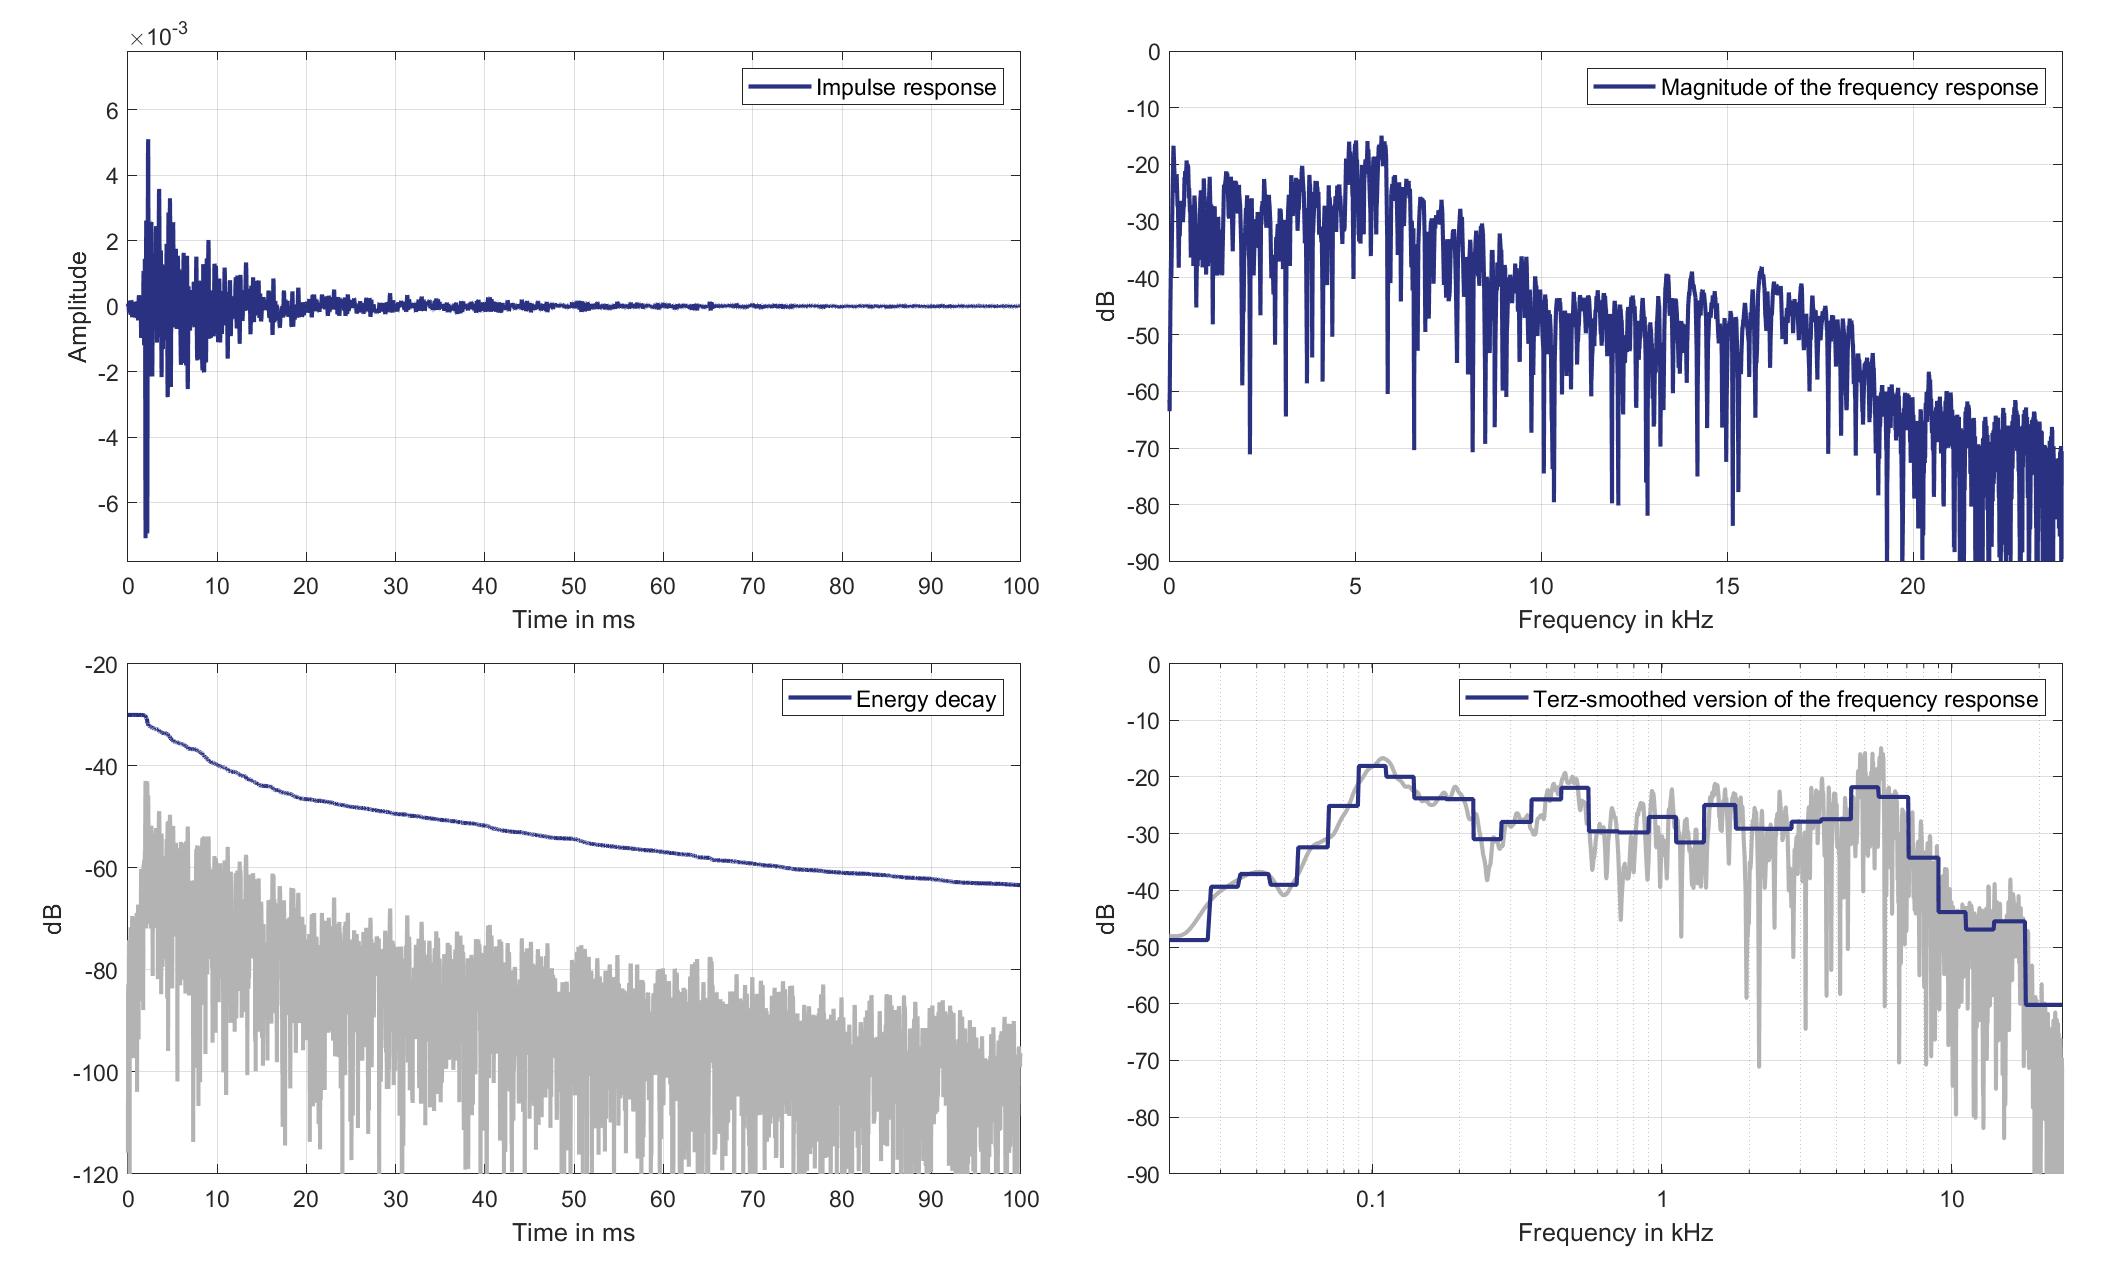
Download impulse response (in ".fir" format).
In the download section you can download all impulse response files as well as format explanation and Matlab as well as Python code examples for loading fir files.
Mic. 17
Mouth Loudspeaker of Zone 6 (Lsp. 16) to Standard Car Microphone 17 (Mic. 17)
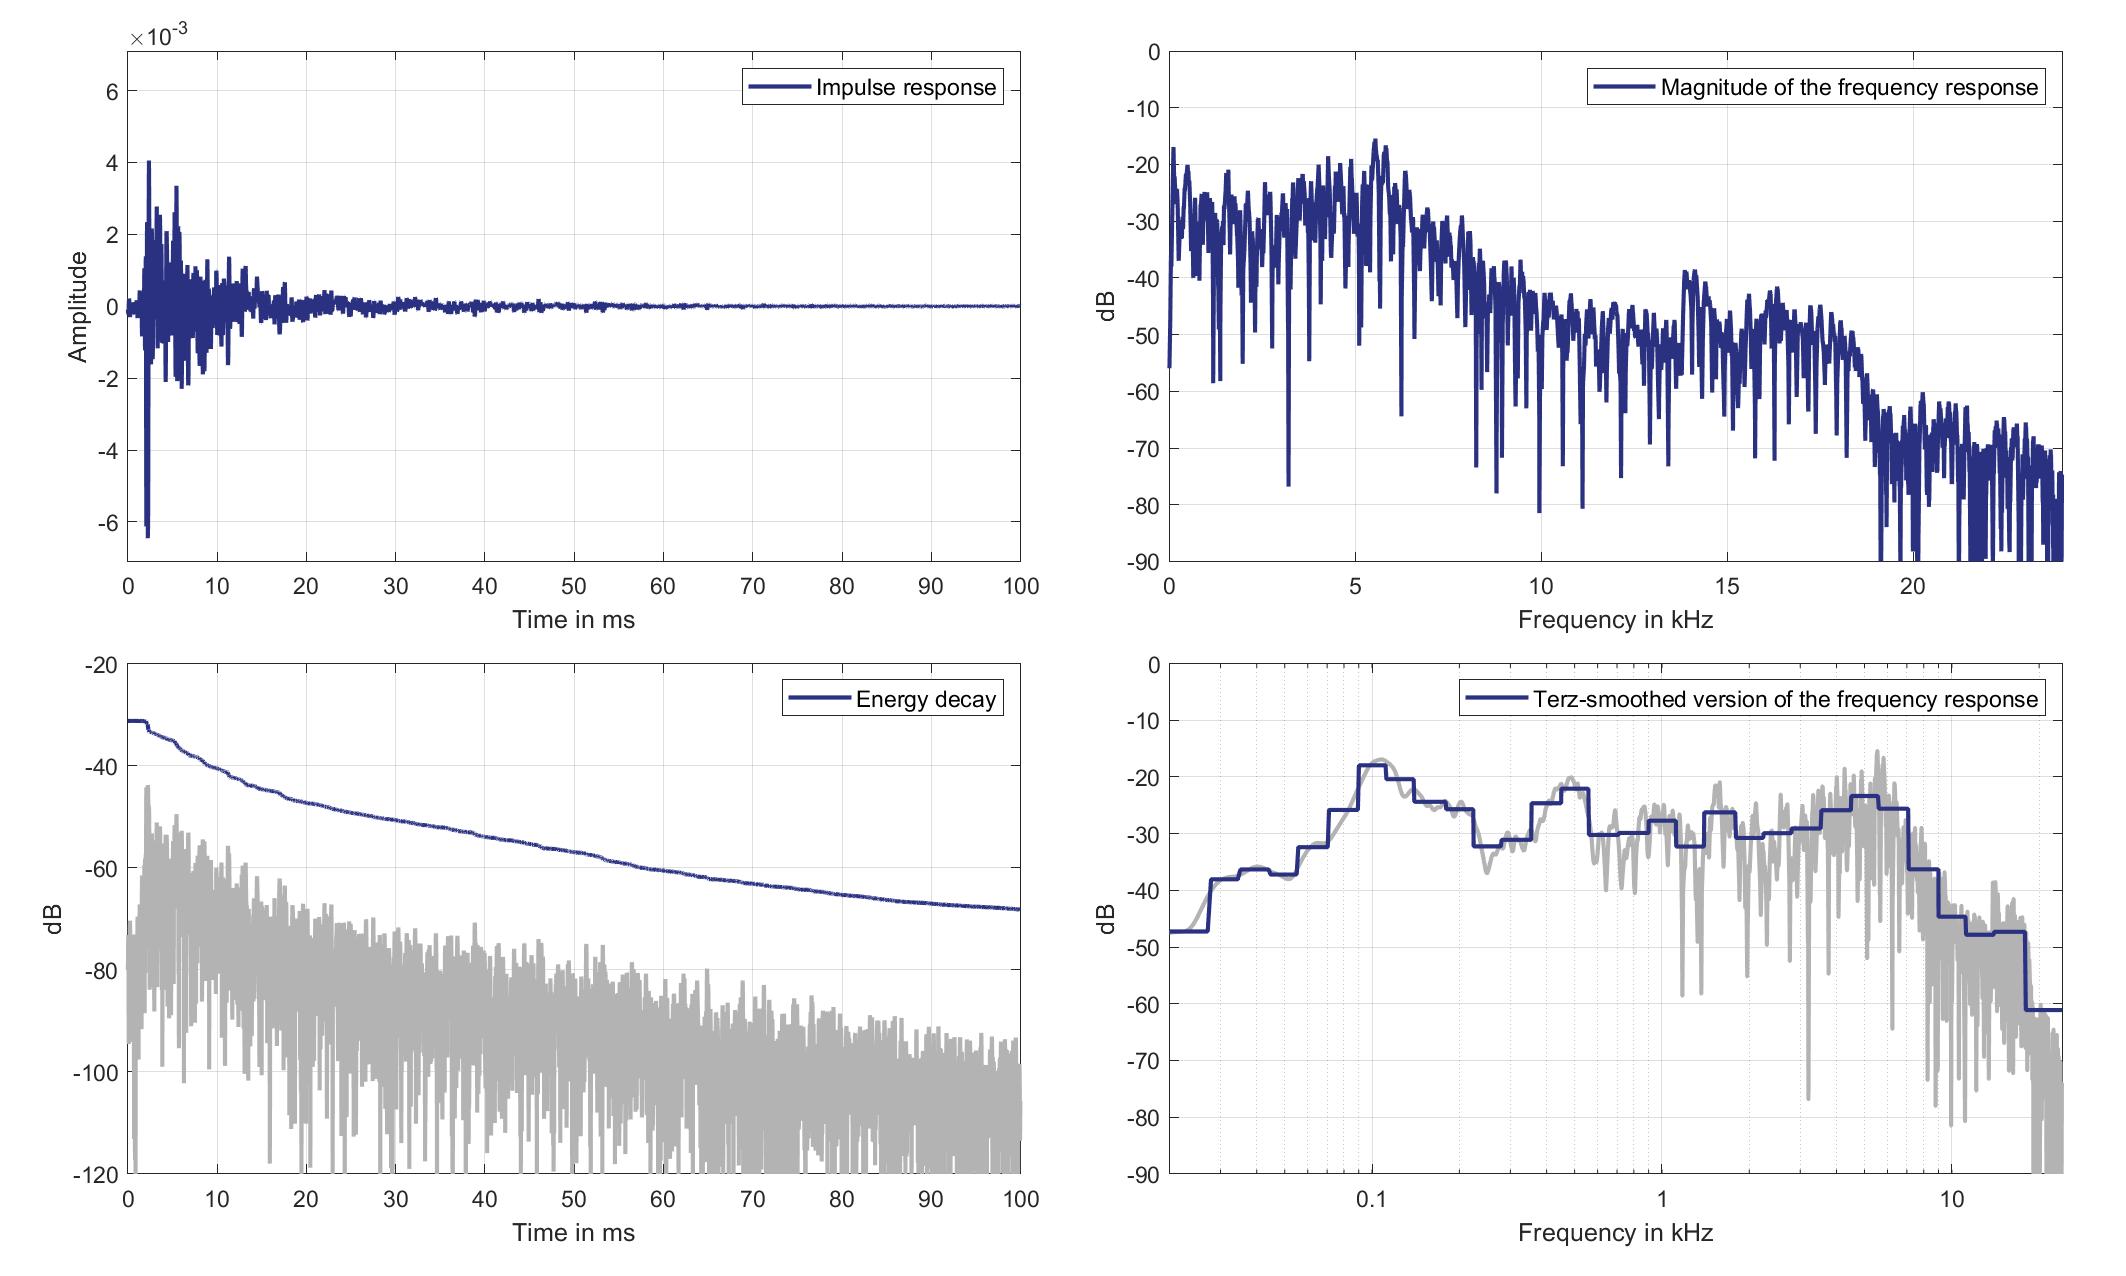
Download impulse response (in ".fir" format).
In the download section you can download all impulse response files as well as format explanation and Matlab as well as Python code examples for loading fir files.
Mic. 18
Mouth Loudspeaker of Zone 6 (Lsp. 16) to Standard Car Microphone 18 (Mic. 18)
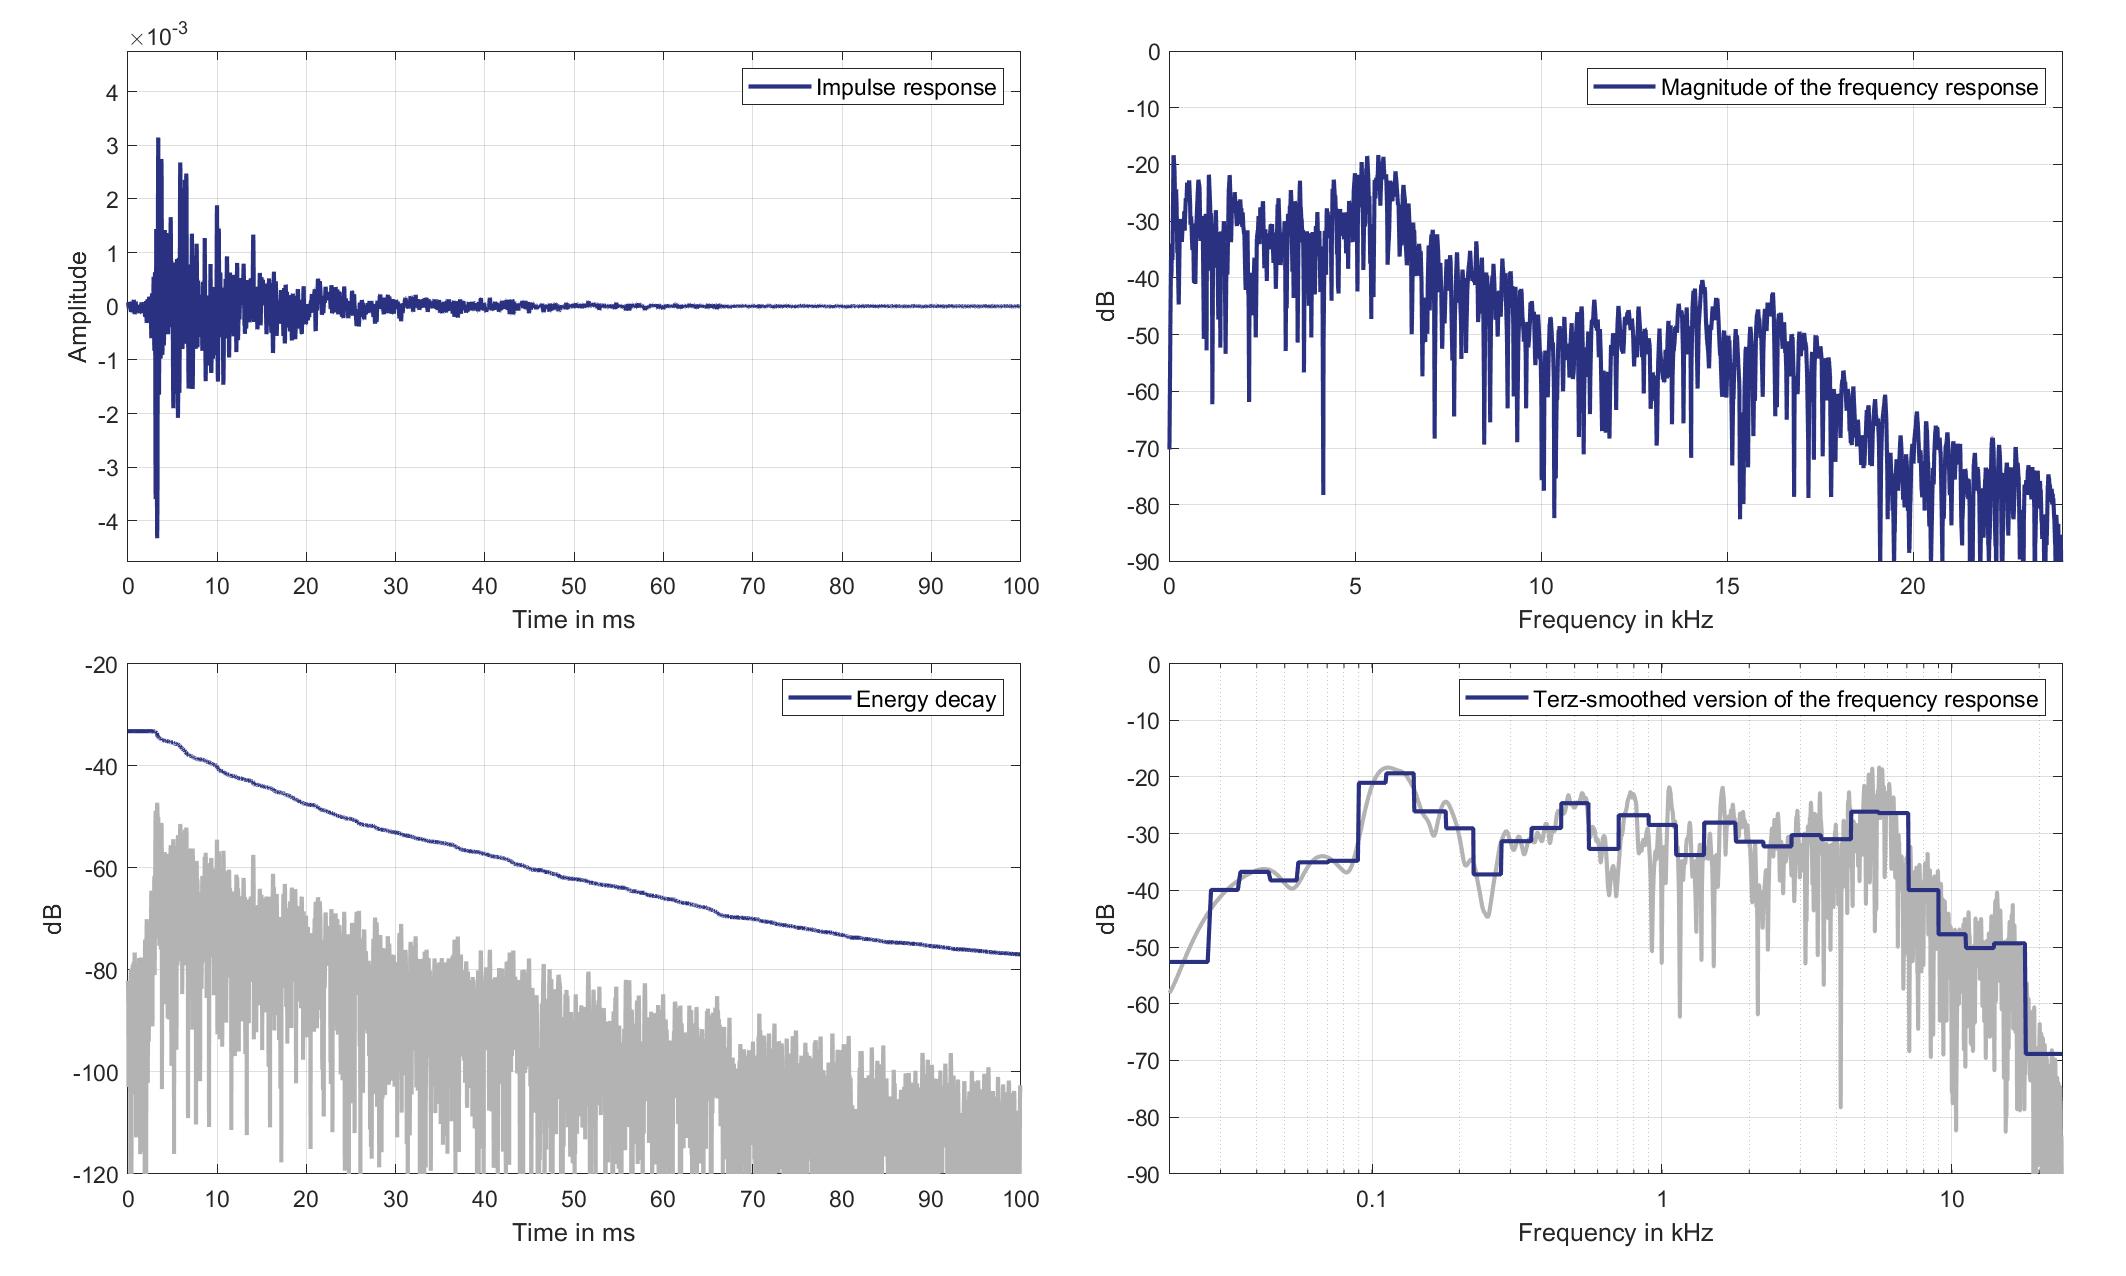
Download impulse response (in ".fir" format).
In the download section you can download all impulse response files as well as format explanation and Matlab as well as Python code examples for loading fir files.
Lsp. 17
Mic. 0
Mouth Loudspeaker of Zone 8 (Lsp. 17) to Standard Car Microphone 0 (Mic. 0)
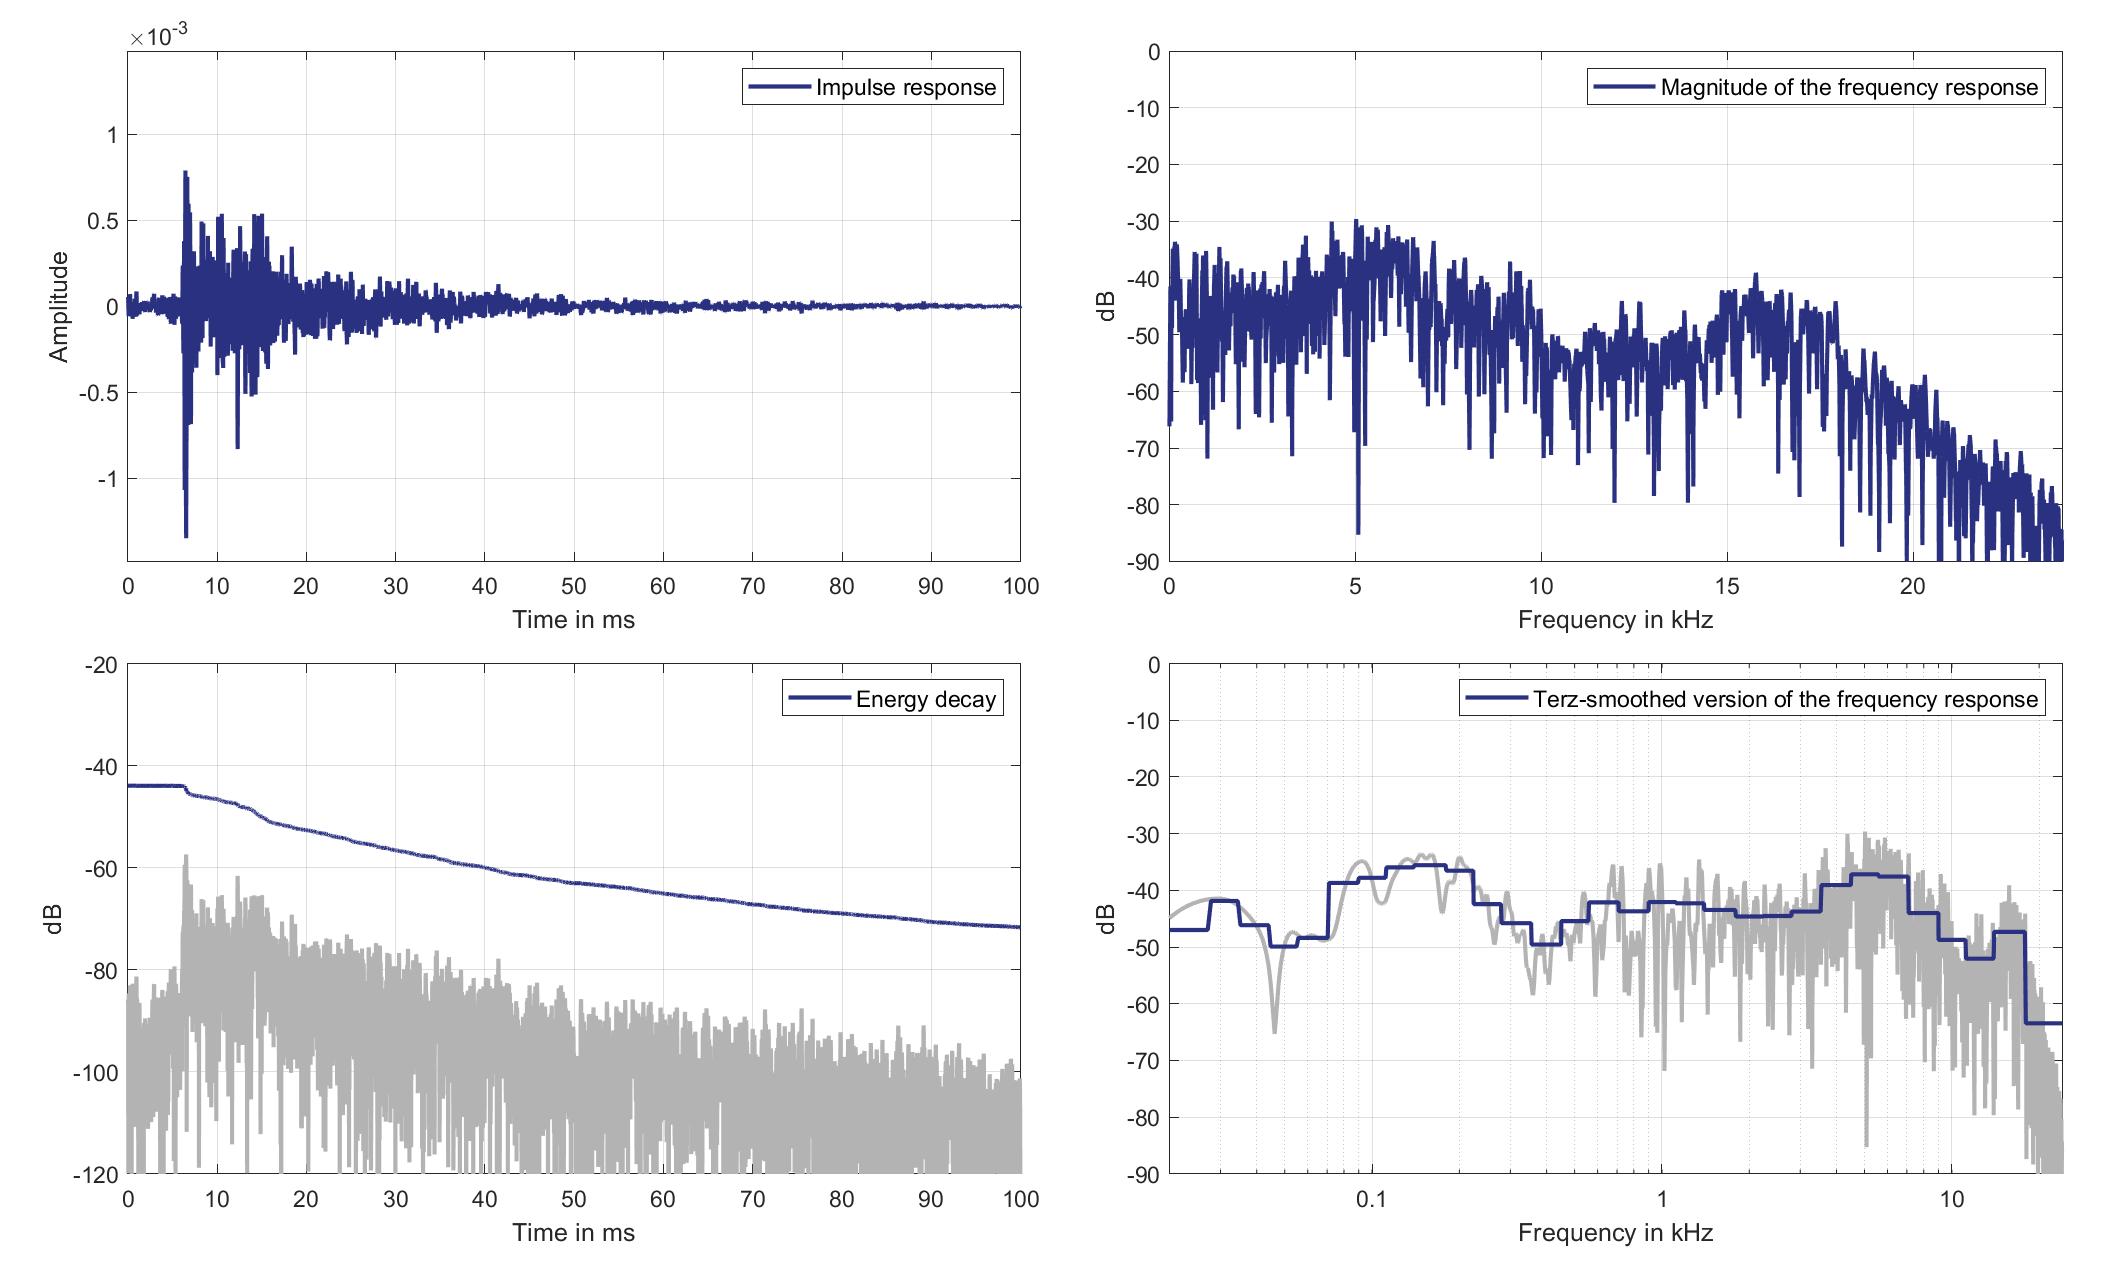
Download impulse response (in ".fir" format).
In the download section you can download all impulse response files as well as format explanation and Matlab as well as Python code examples for loading fir files.
Mic. 1
Mouth Loudspeaker of Zone 8 (Lsp. 17) to Standard Car Microphone 1 (Mic. 1)
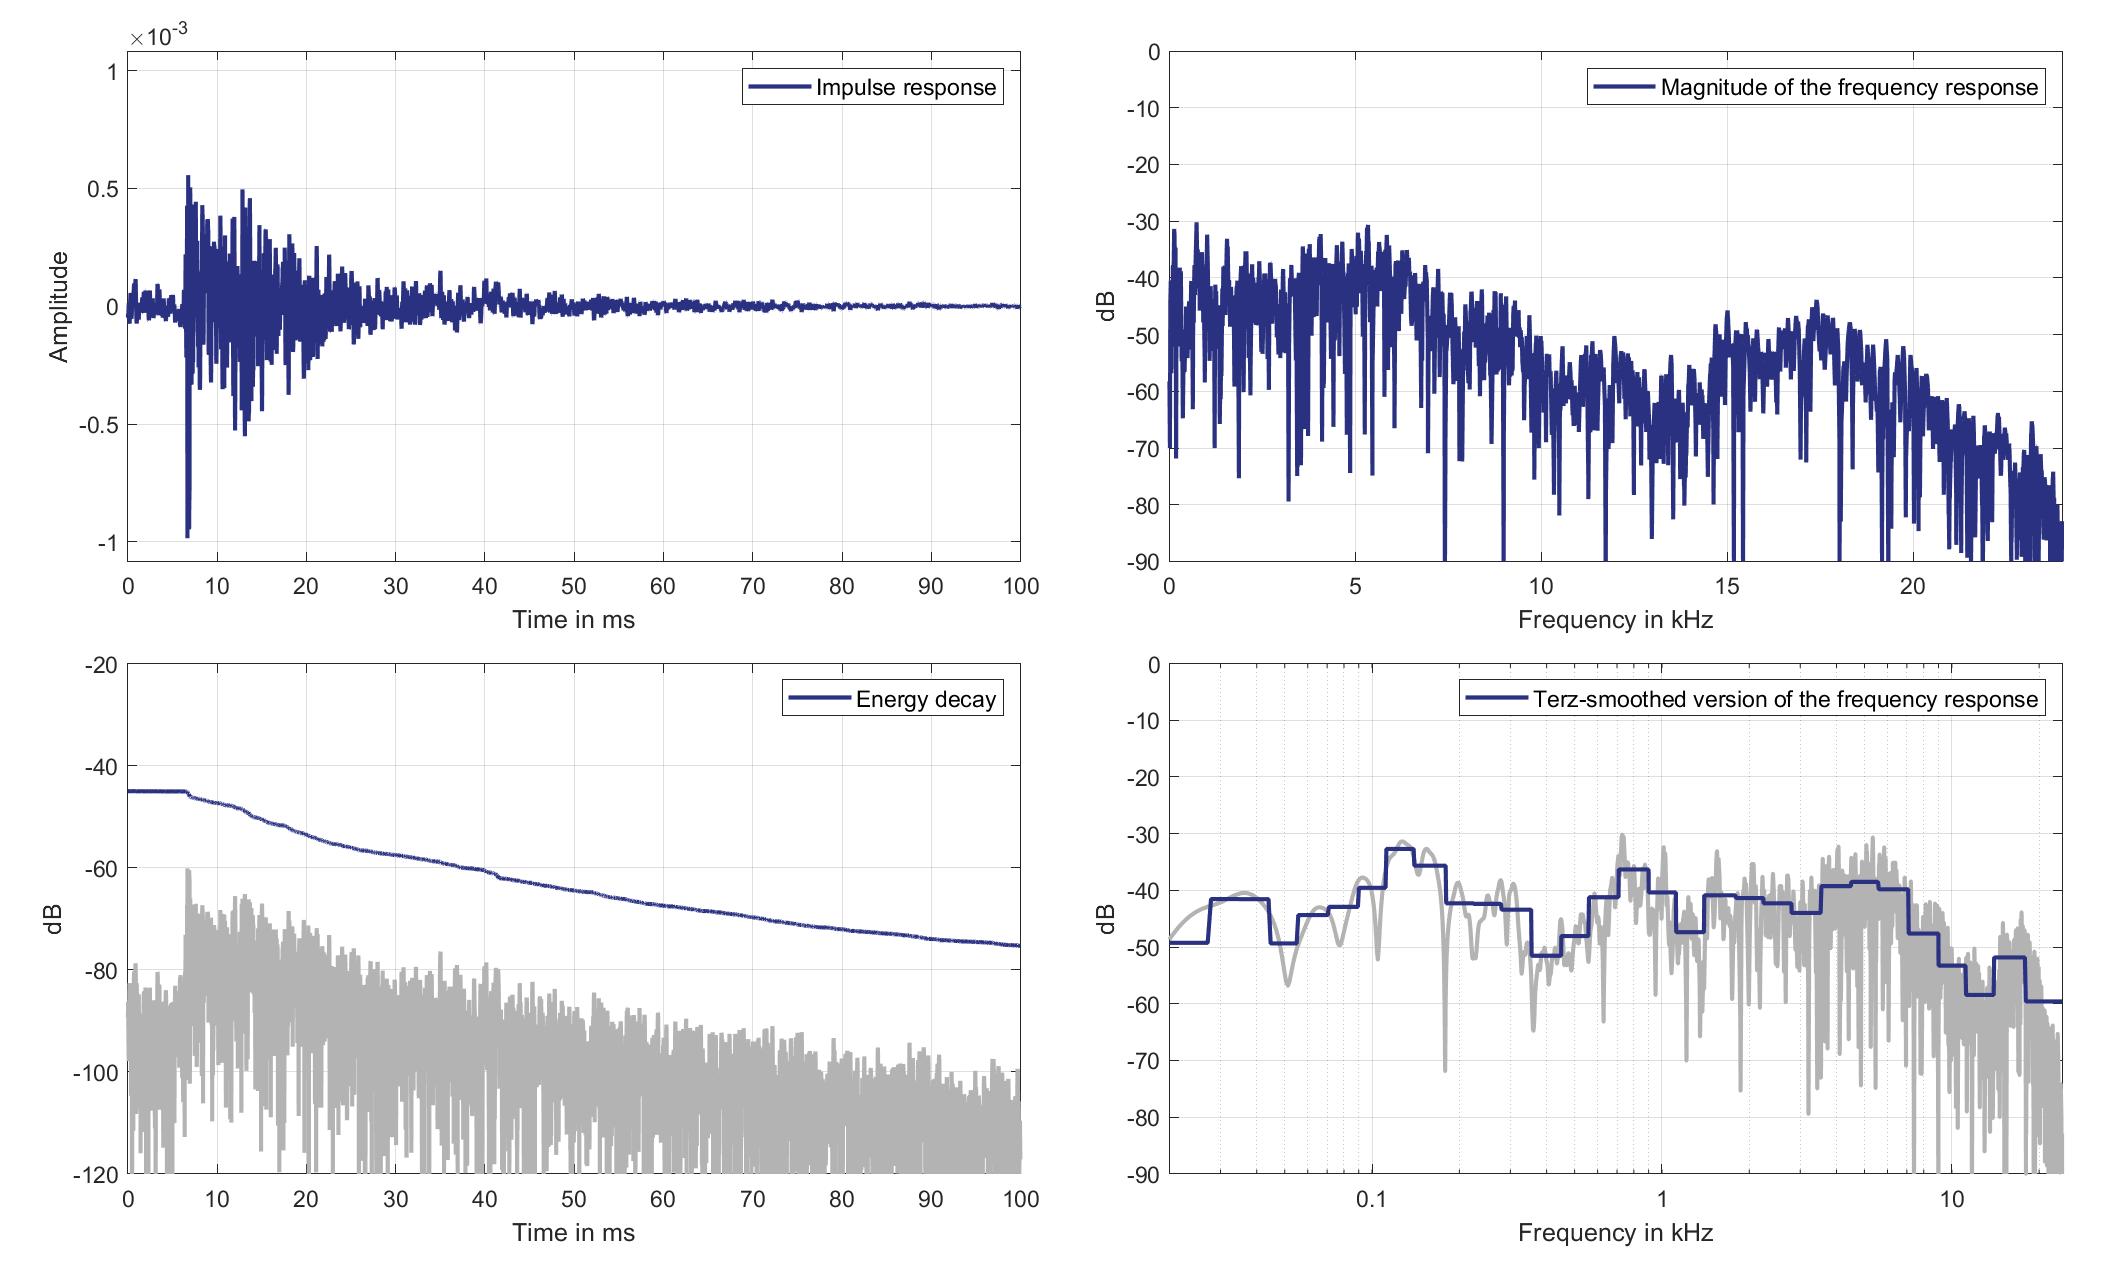
Download impulse response (in ".fir" format).
In the download section you can download all impulse response files as well as format explanation and Matlab as well as Python code examples for loading fir files.
Mic. 2
Mouth Loudspeaker of Zone 8 (Lsp. 17) to Standard Car Microphone 2 (Mic. 2)
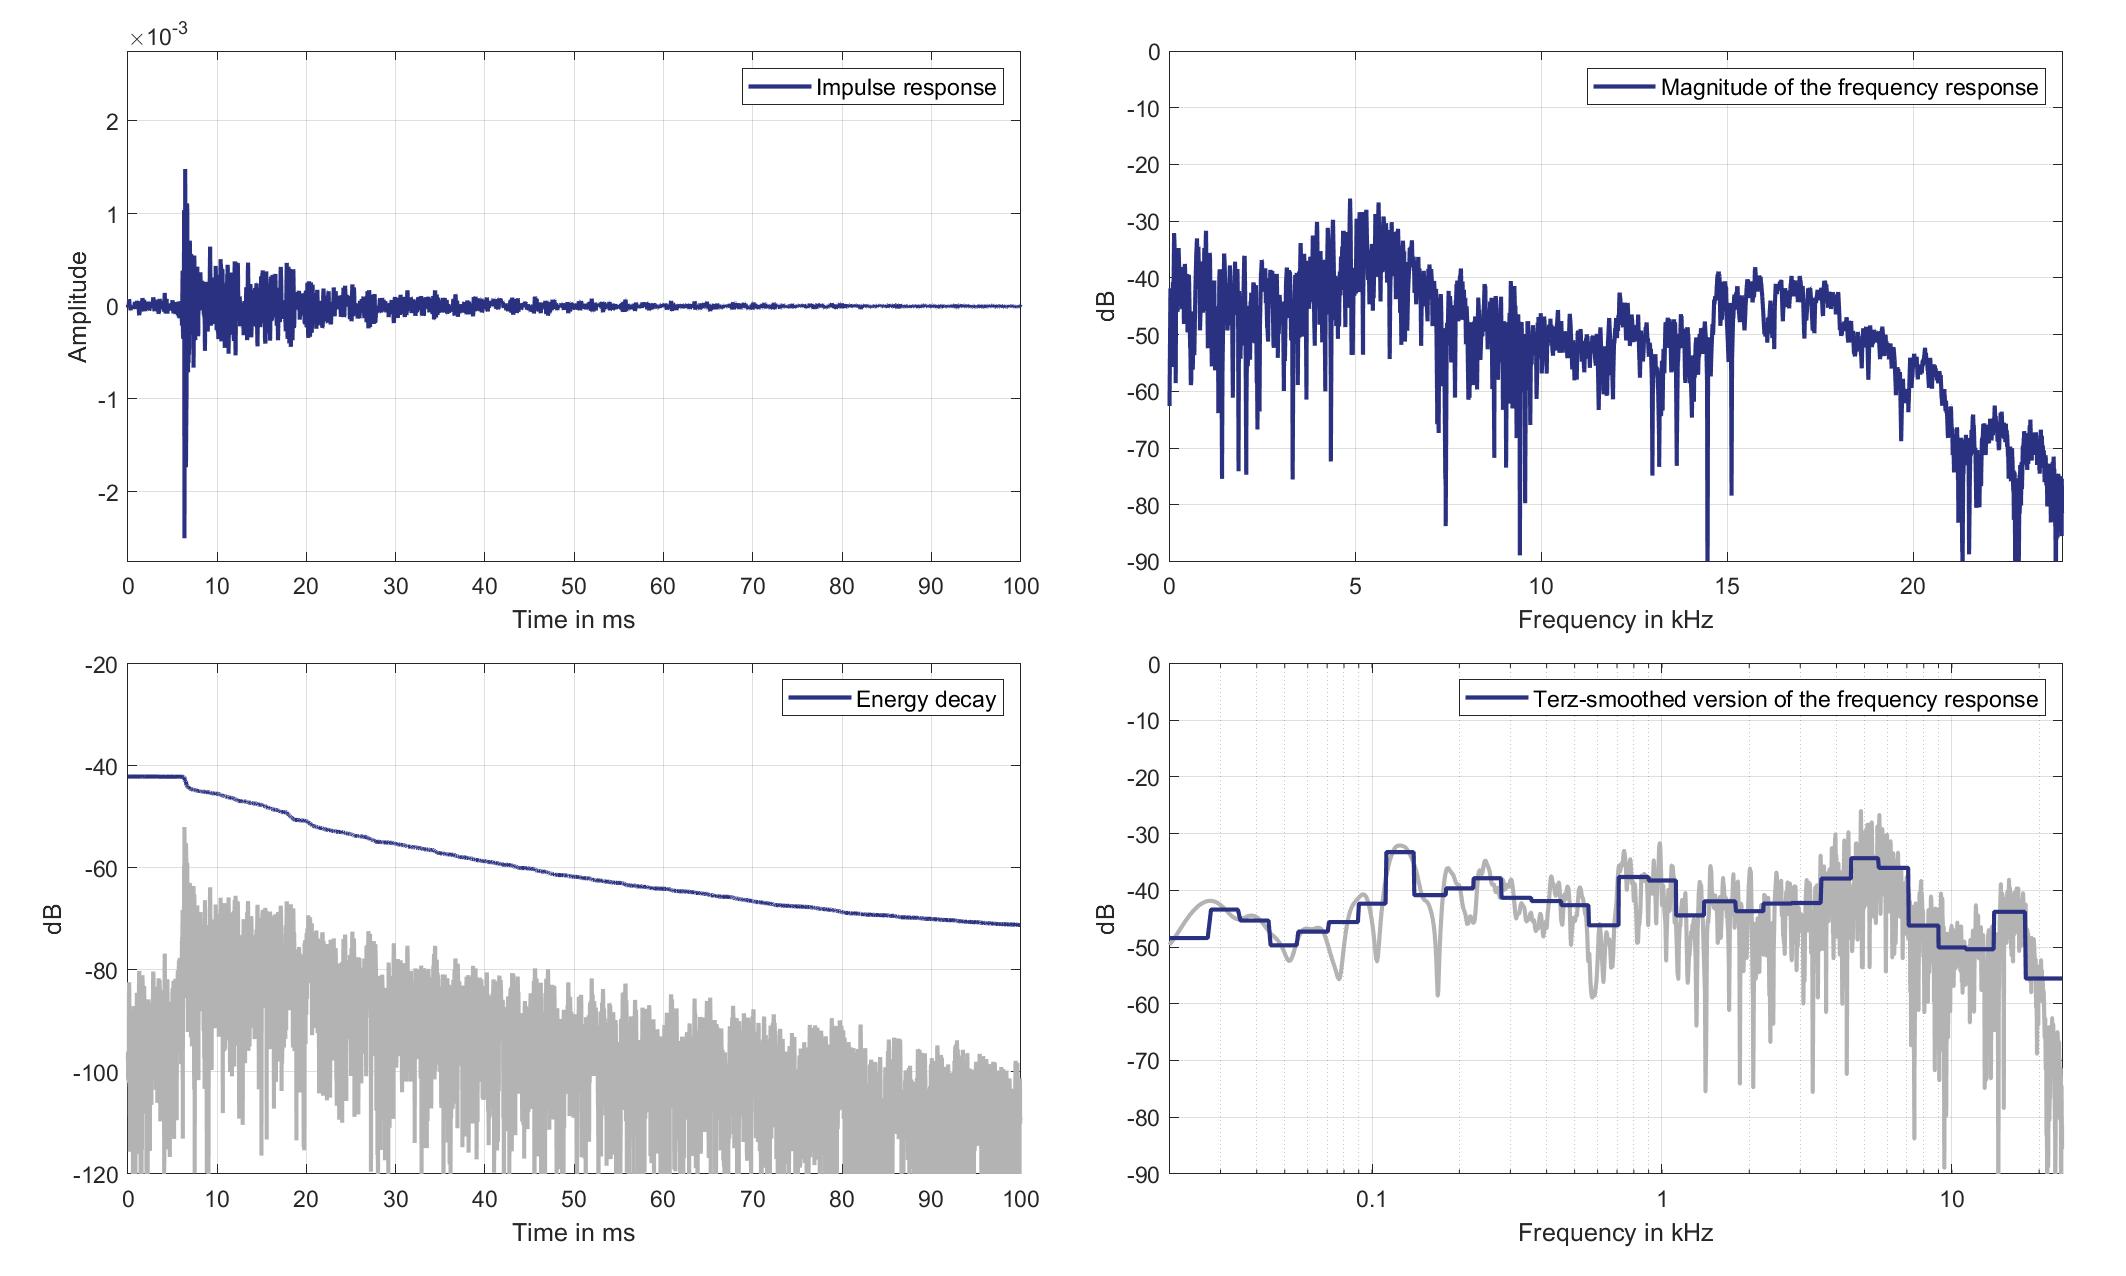
Download impulse response (in ".fir" format).
In the download section you can download all impulse response files as well as format explanation and Matlab as well as Python code examples for loading fir files.
Mic. 3
Mouth Loudspeaker of Zone 8 (Lsp. 17) to Standard Car Microphone 3 (Mic. 3)
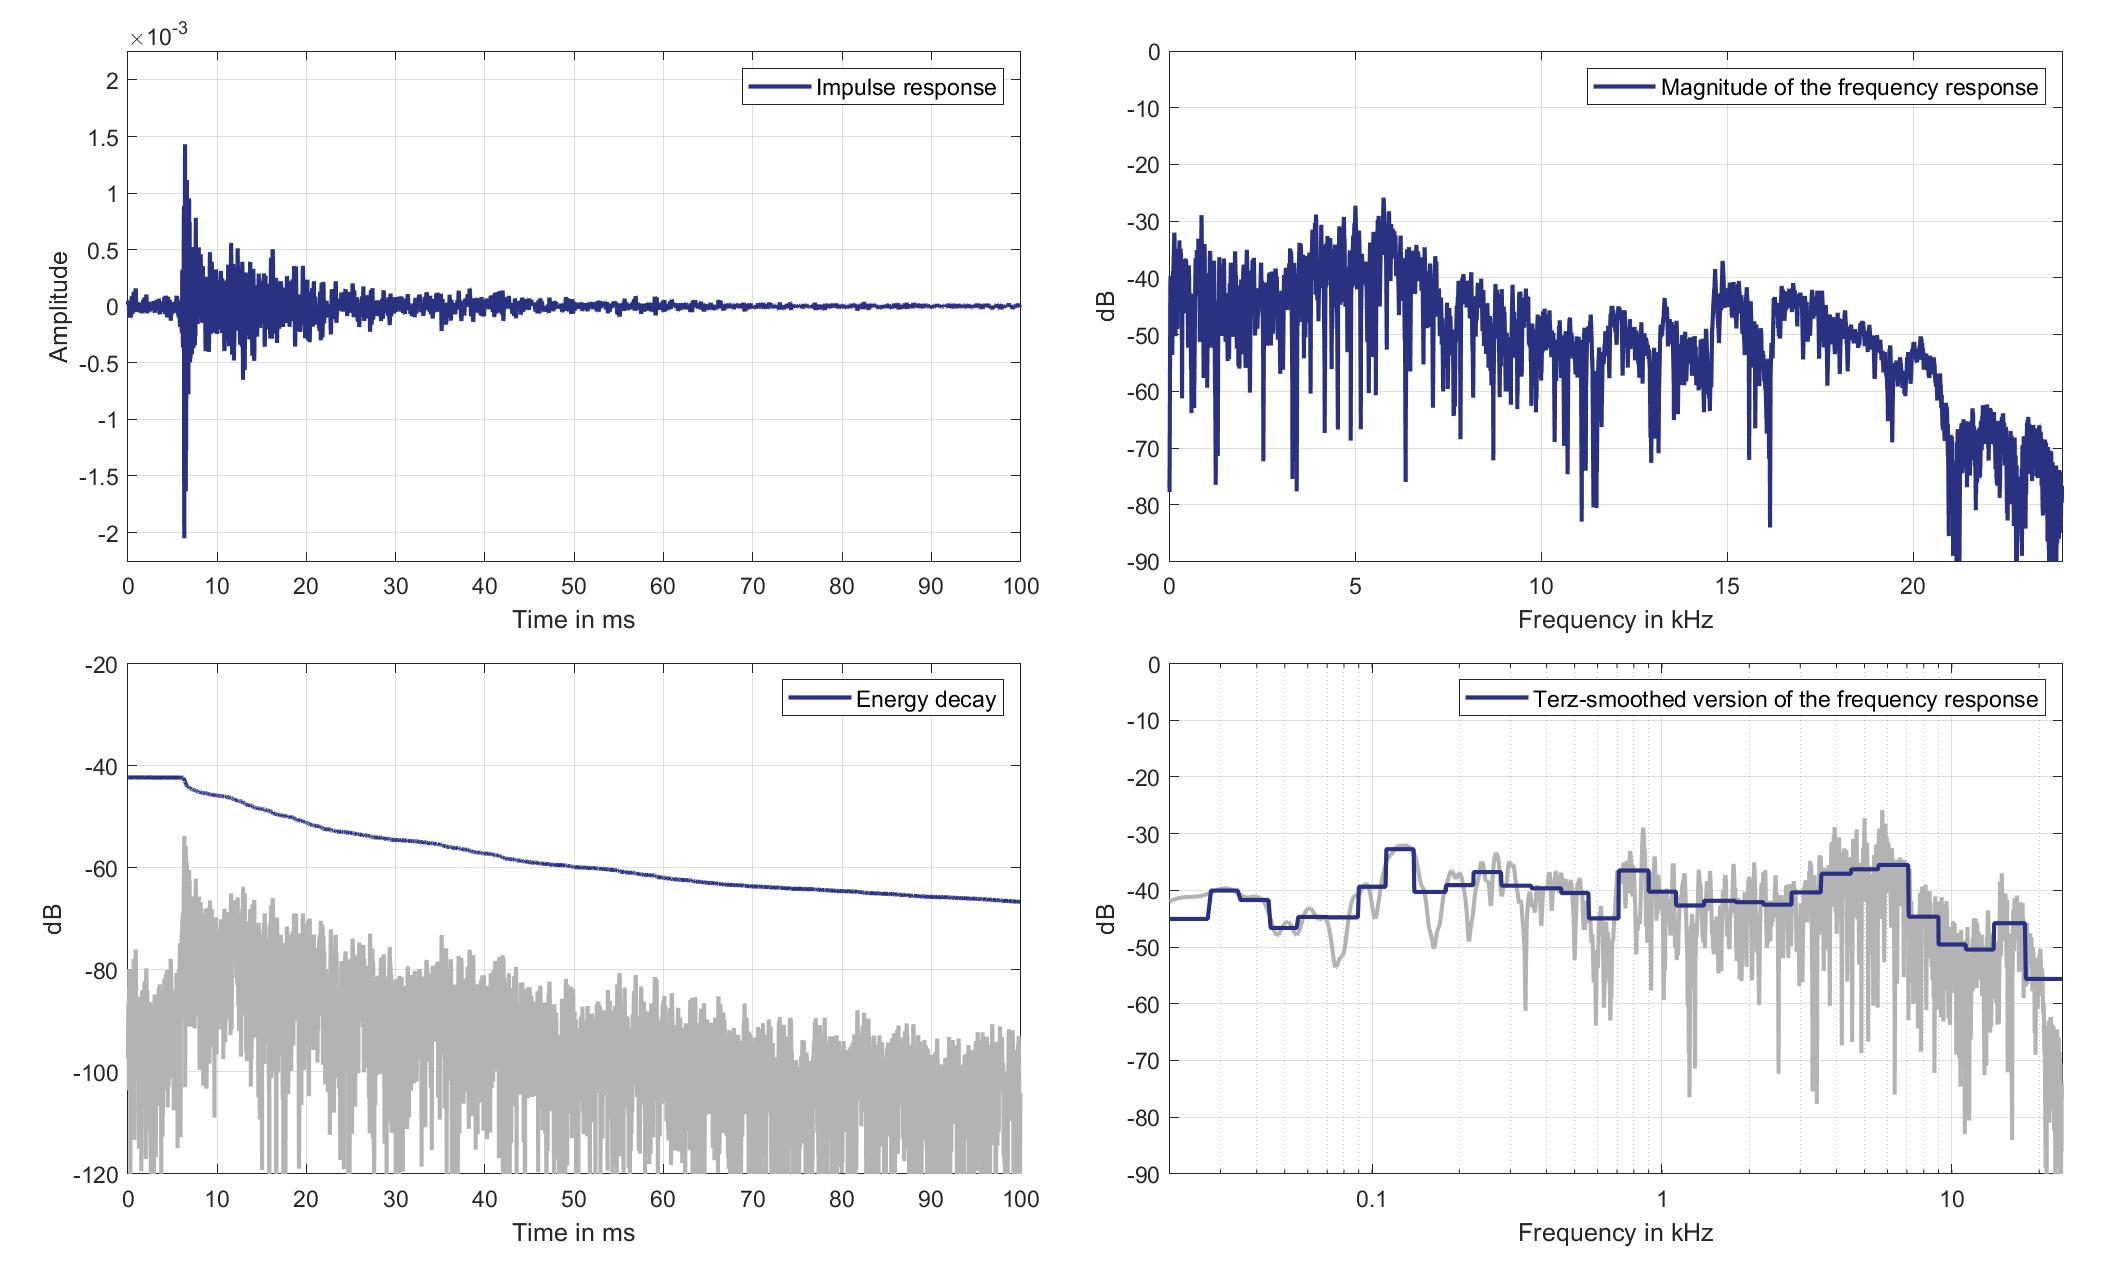
Download impulse response (in ".fir" format).
In the download section you can download all impulse response files as well as format explanation and Matlab as well as Python code examples for loading fir files.
Mic. 4
Mouth Loudspeaker of Zone 8 (Lsp. 17) to Standard Car Microphone 4 (Mic. 4)
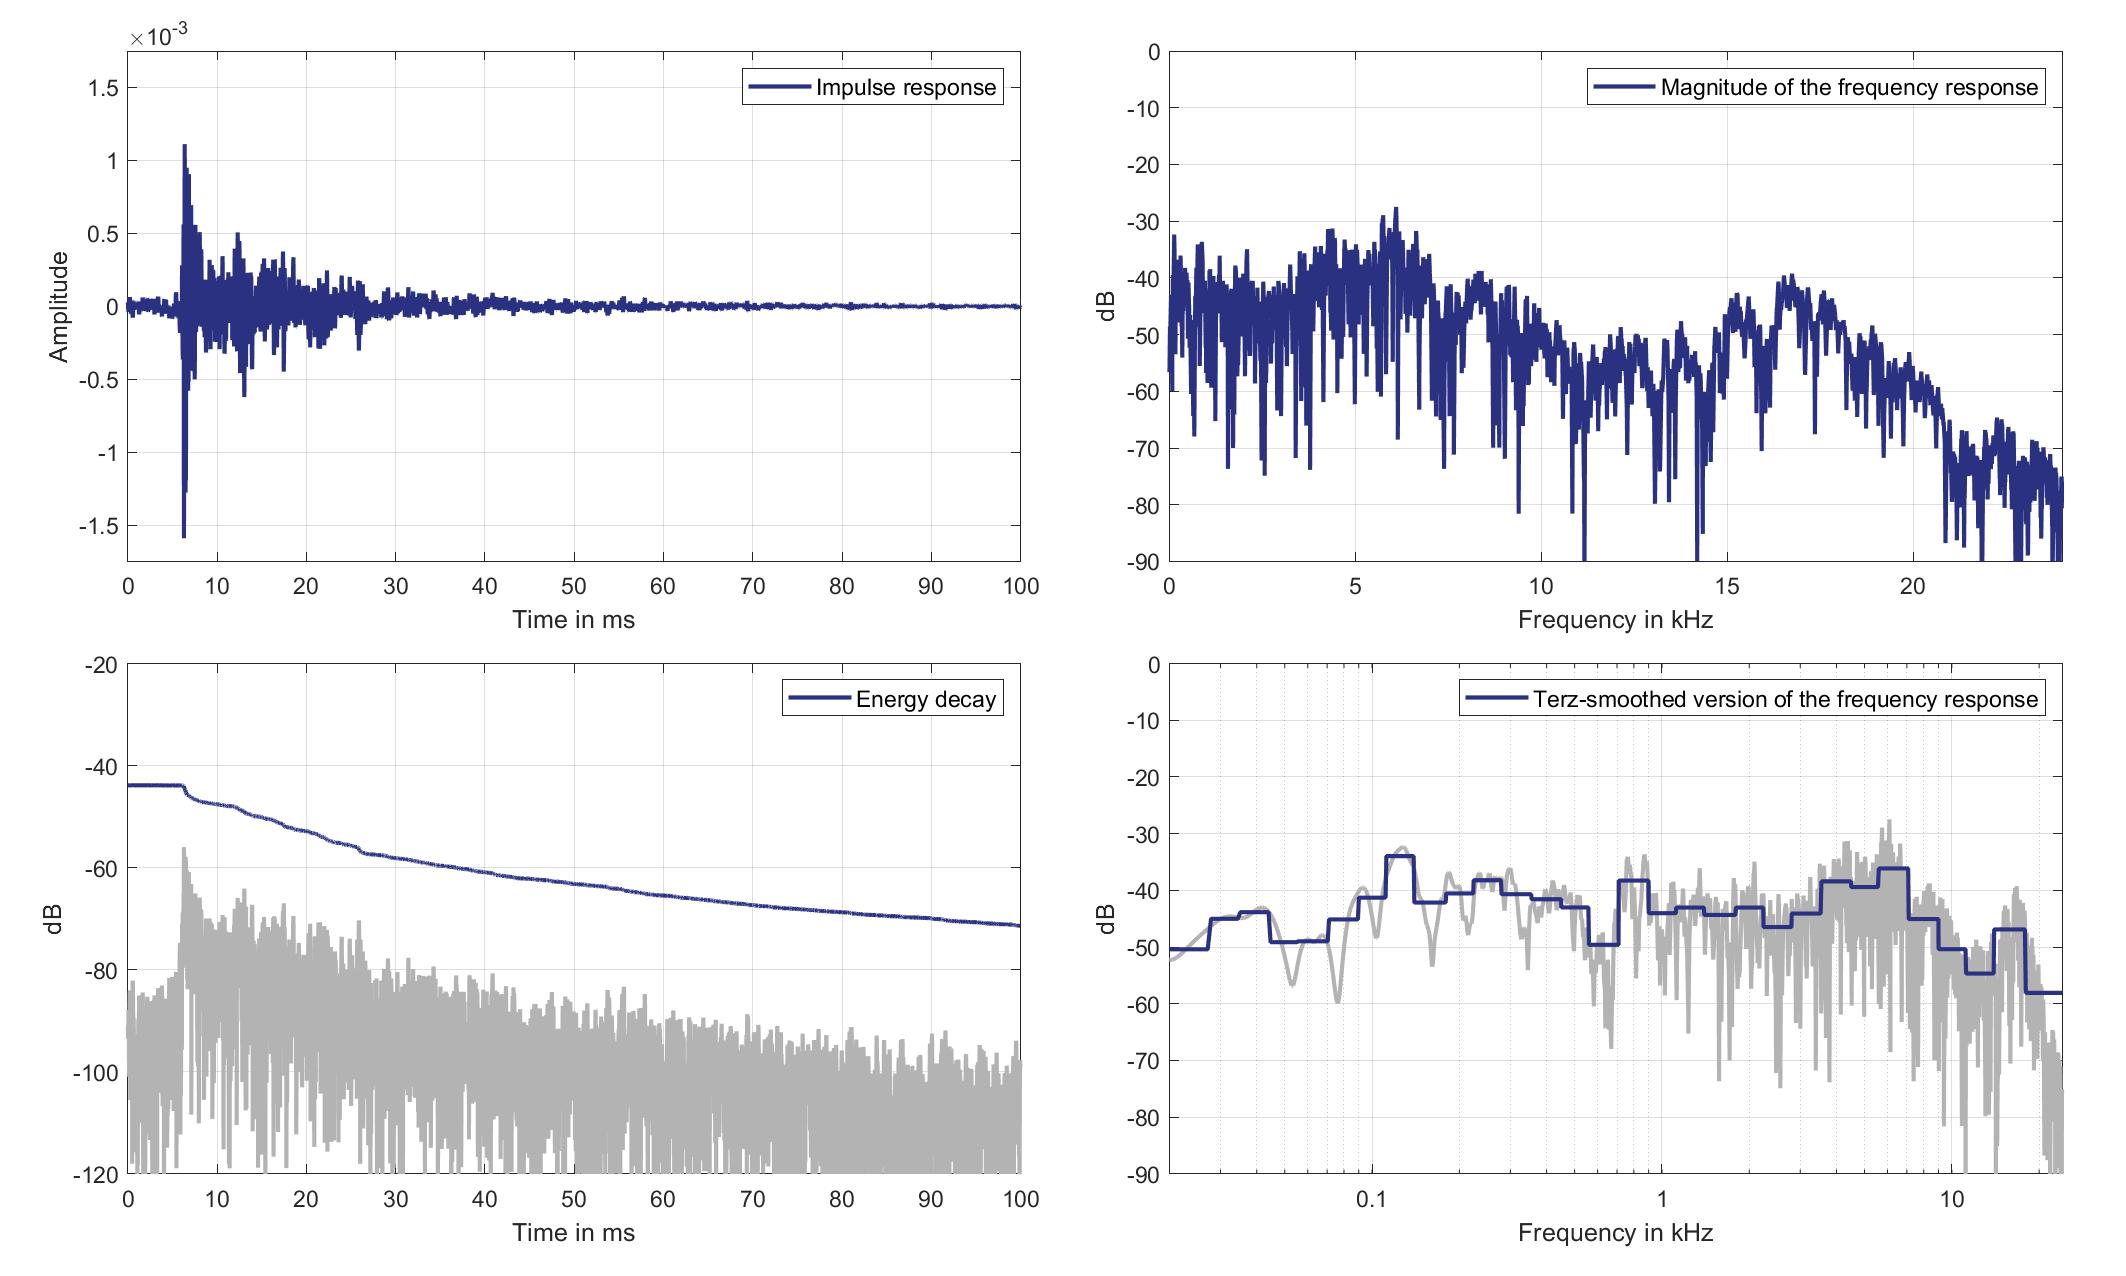
Download impulse response (in ".fir" format).
In the download section you can download all impulse response files as well as format explanation and Matlab as well as Python code examples for loading fir files.
Mic. 5
Mouth Loudspeaker of Zone 8 (Lsp. 17) to Standard Car Microphone 5 (Mic. 5)
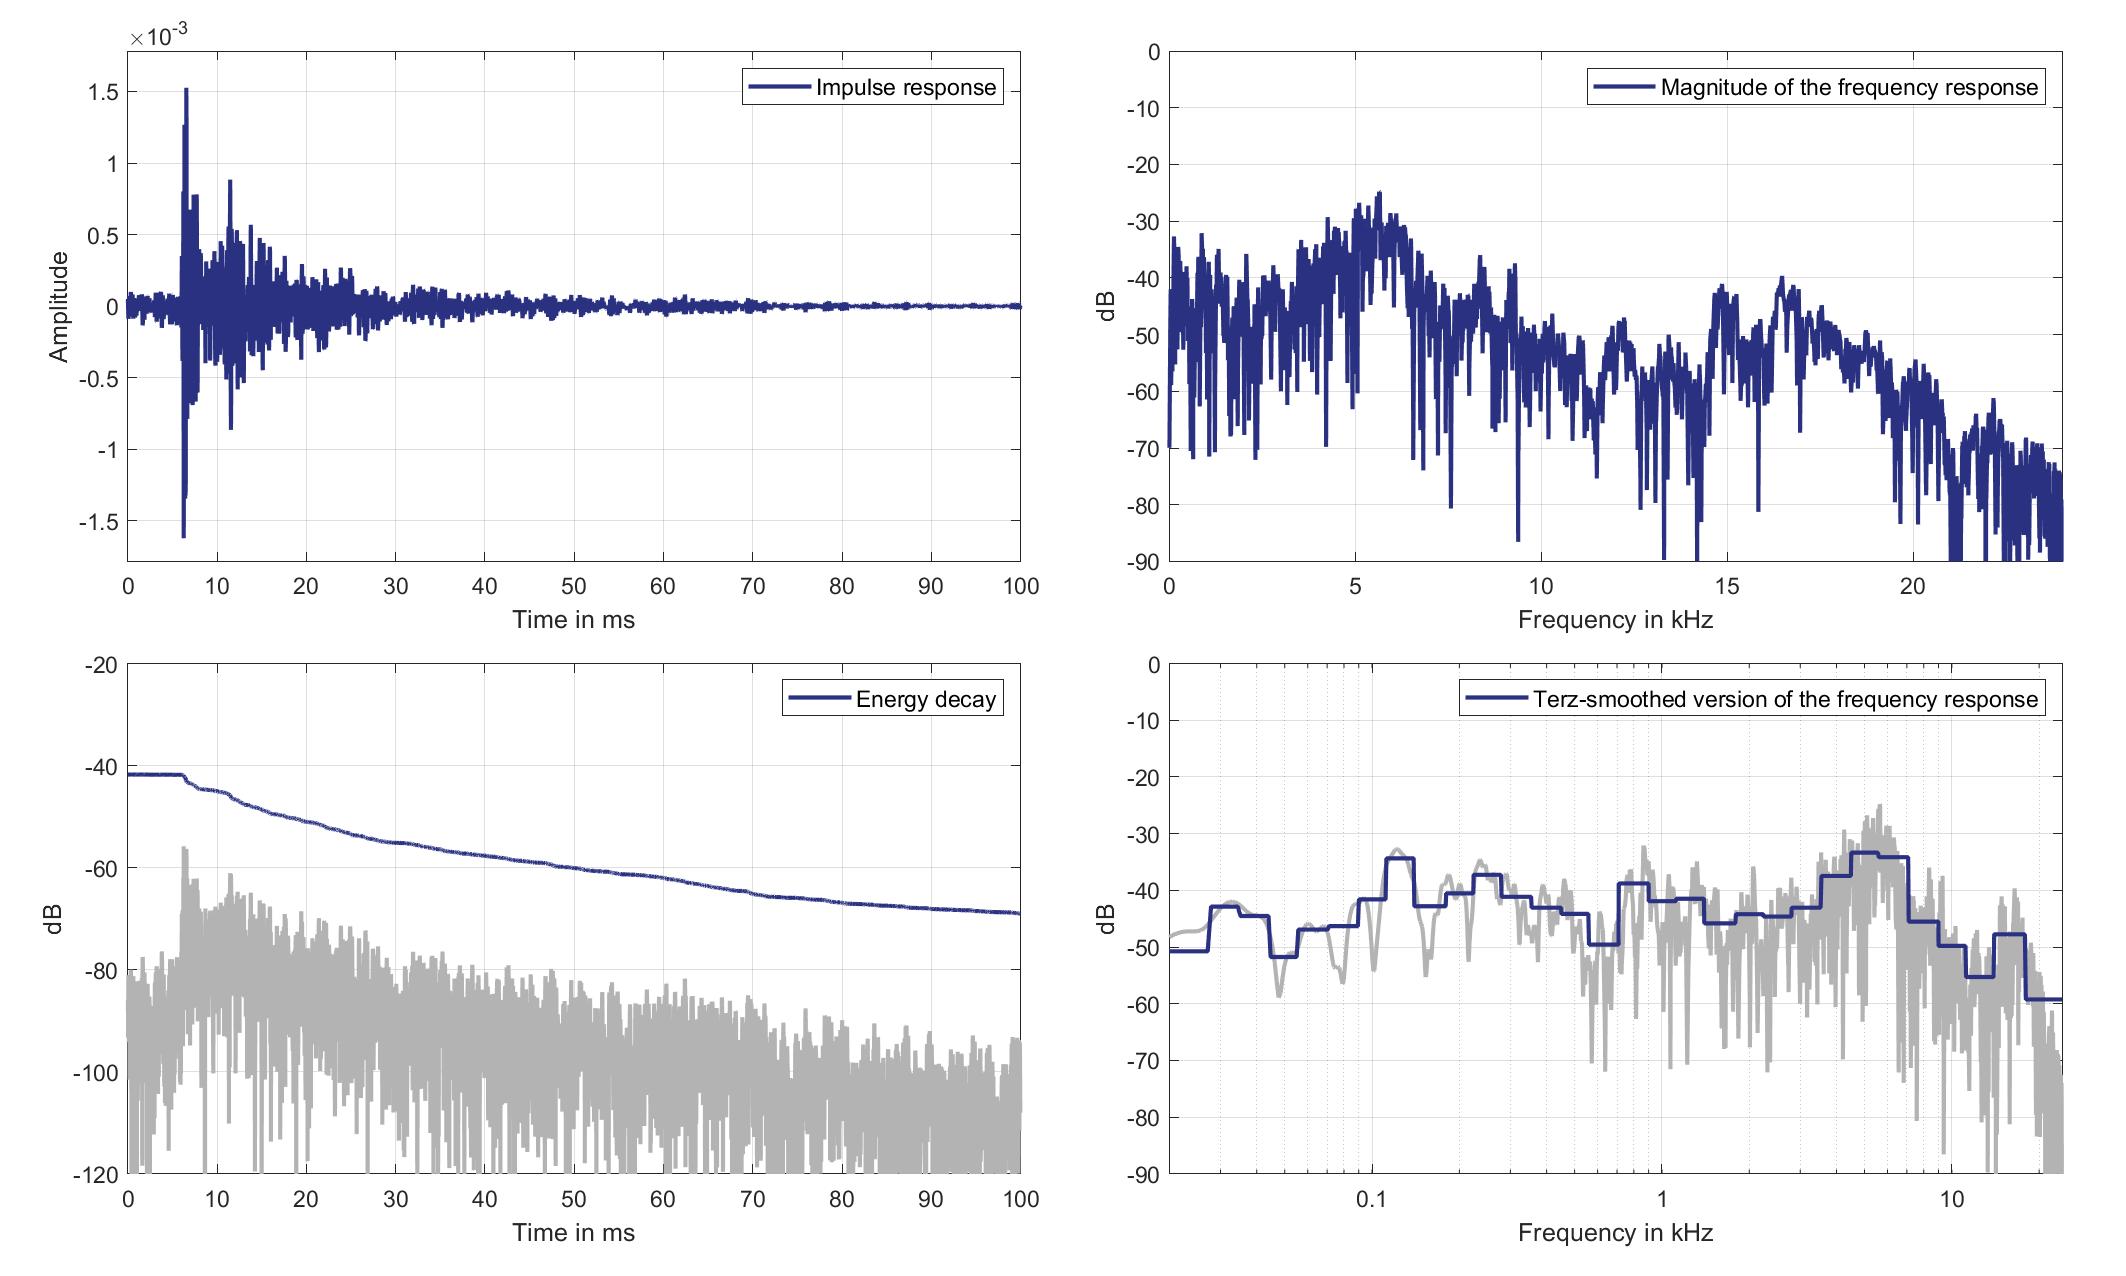
Download impulse response (in ".fir" format).
In the download section you can download all impulse response files as well as format explanation and Matlab as well as Python code examples for loading fir files.
Mic. 6
Mouth Loudspeaker of Zone 8 (Lsp. 17) to Standard Car Microphone 6 (Mic. 6)
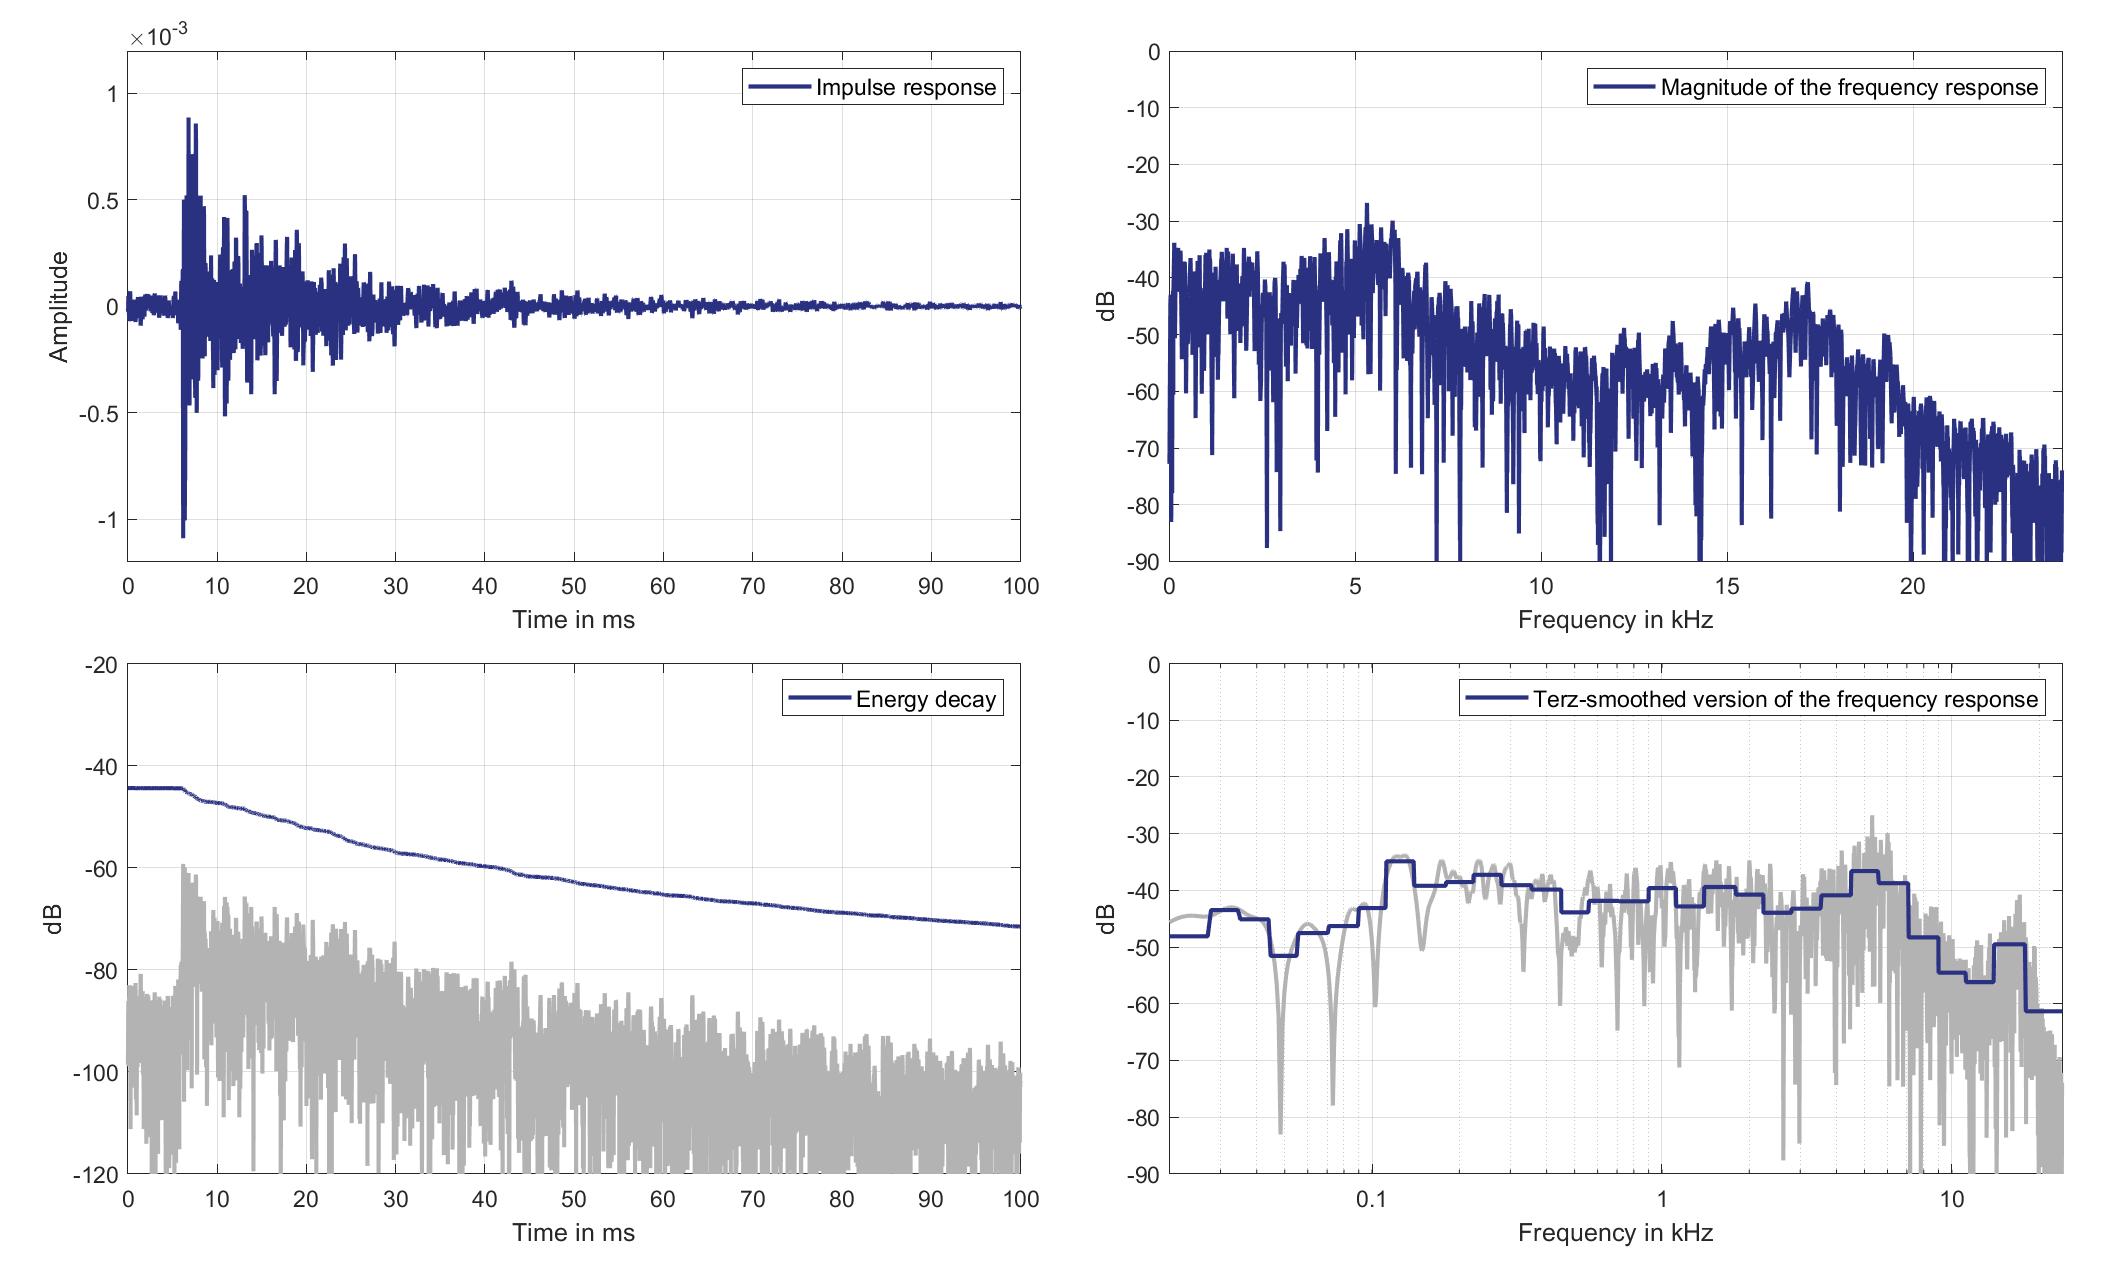
Download impulse response (in ".fir" format).
In the download section you can download all impulse response files as well as format explanation and Matlab as well as Python code examples for loading fir files.
Mic. 7
Mouth Loudspeaker of Zone 8 (Lsp. 17) to Standard Car Microphone 7 (Mic. 7)
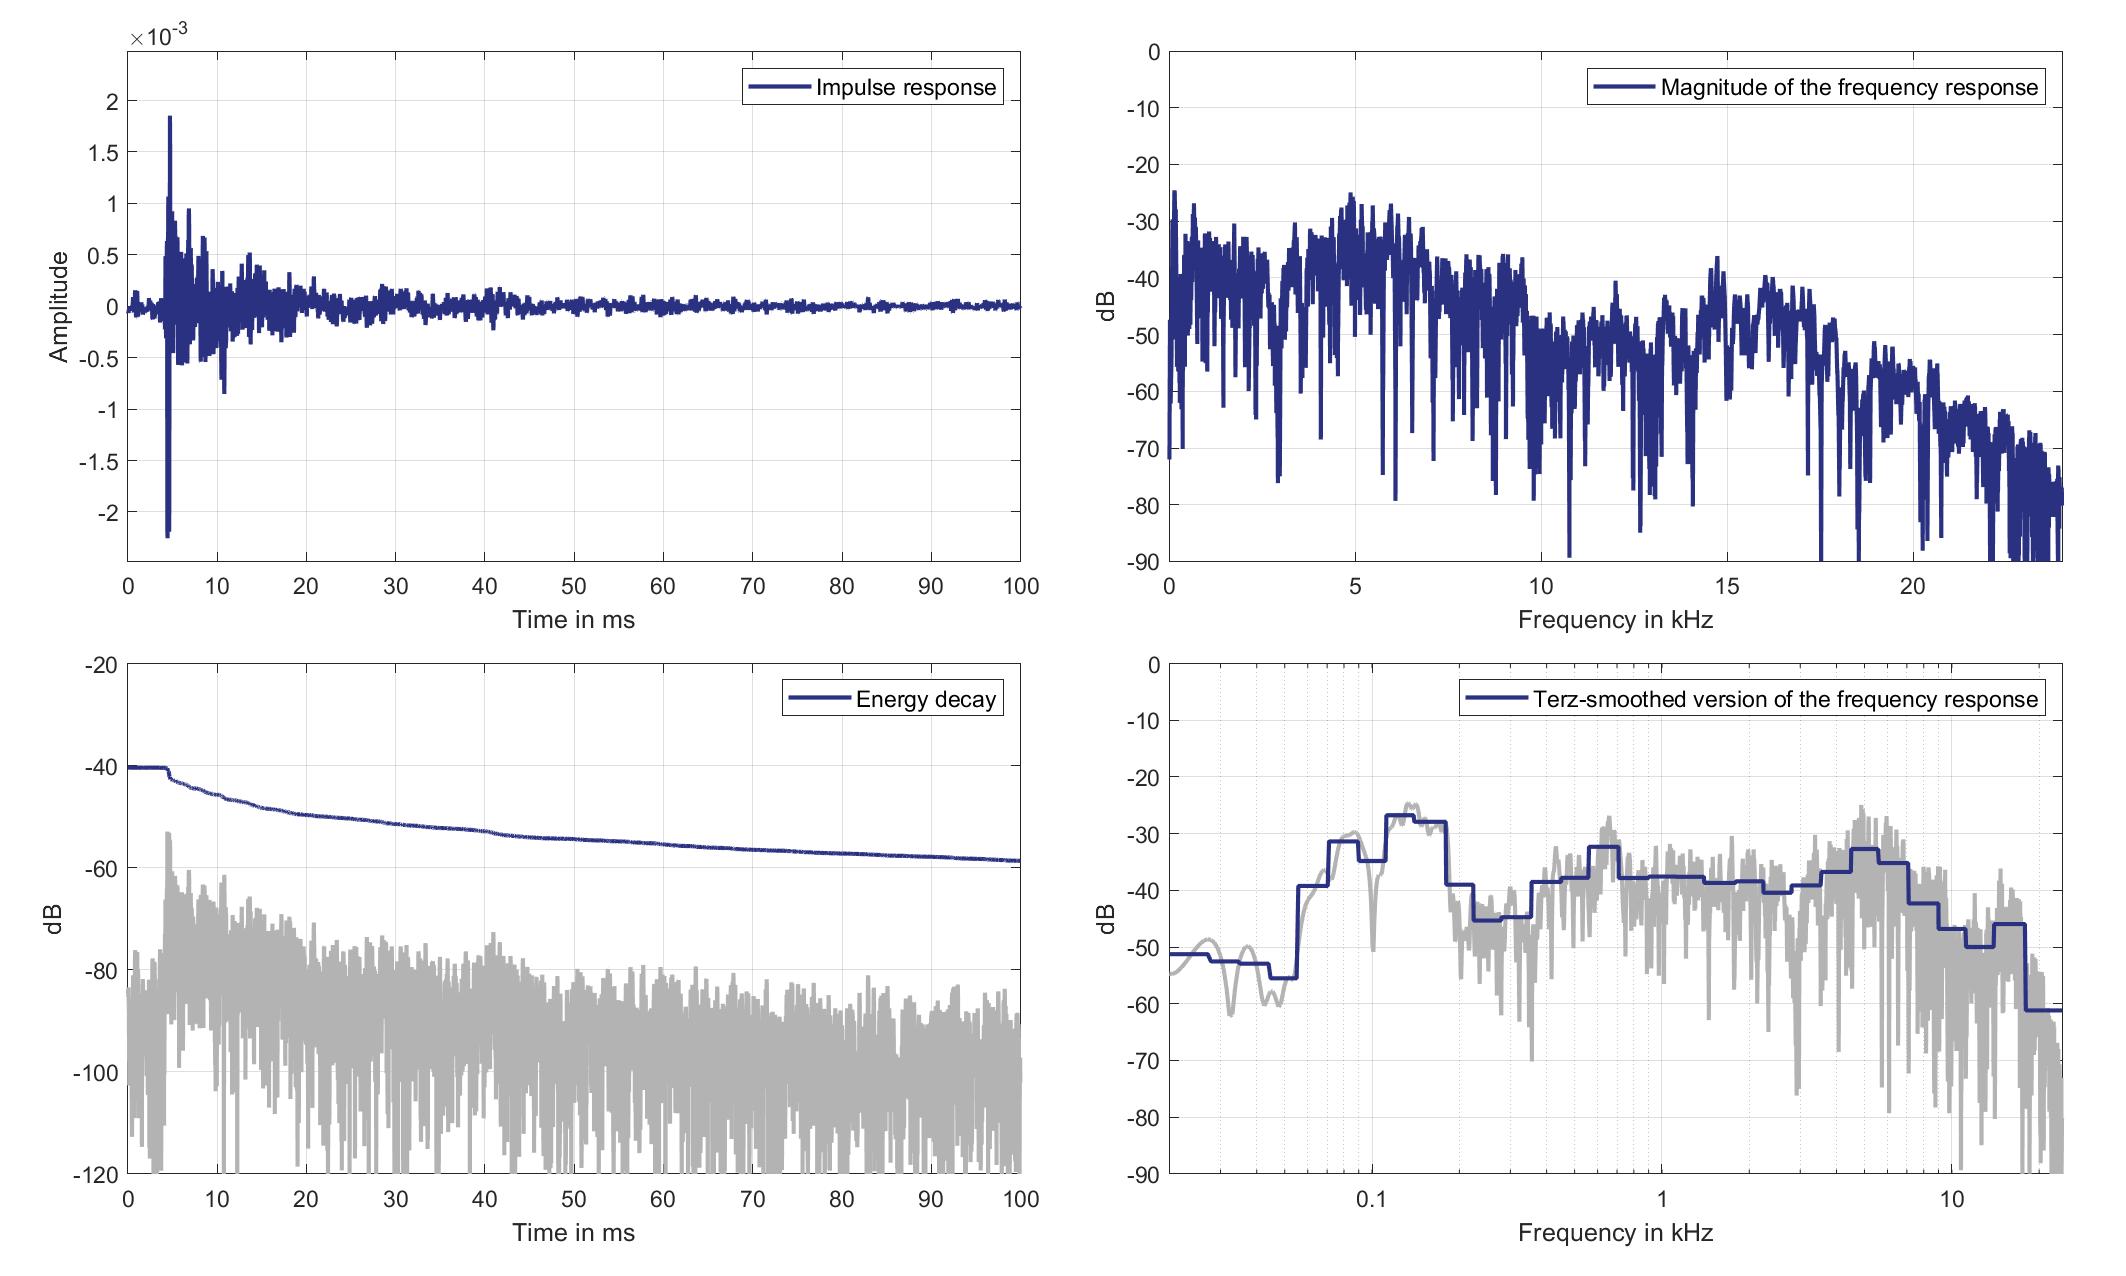
Download impulse response (in ".fir" format).
In the download section you can download all impulse response files as well as format explanation and Matlab as well as Python code examples for loading fir files.
Mic. 8
Mouth Loudspeaker of Zone 8 (Lsp. 17) to Standard Car Microphone 8 (Mic. 8)
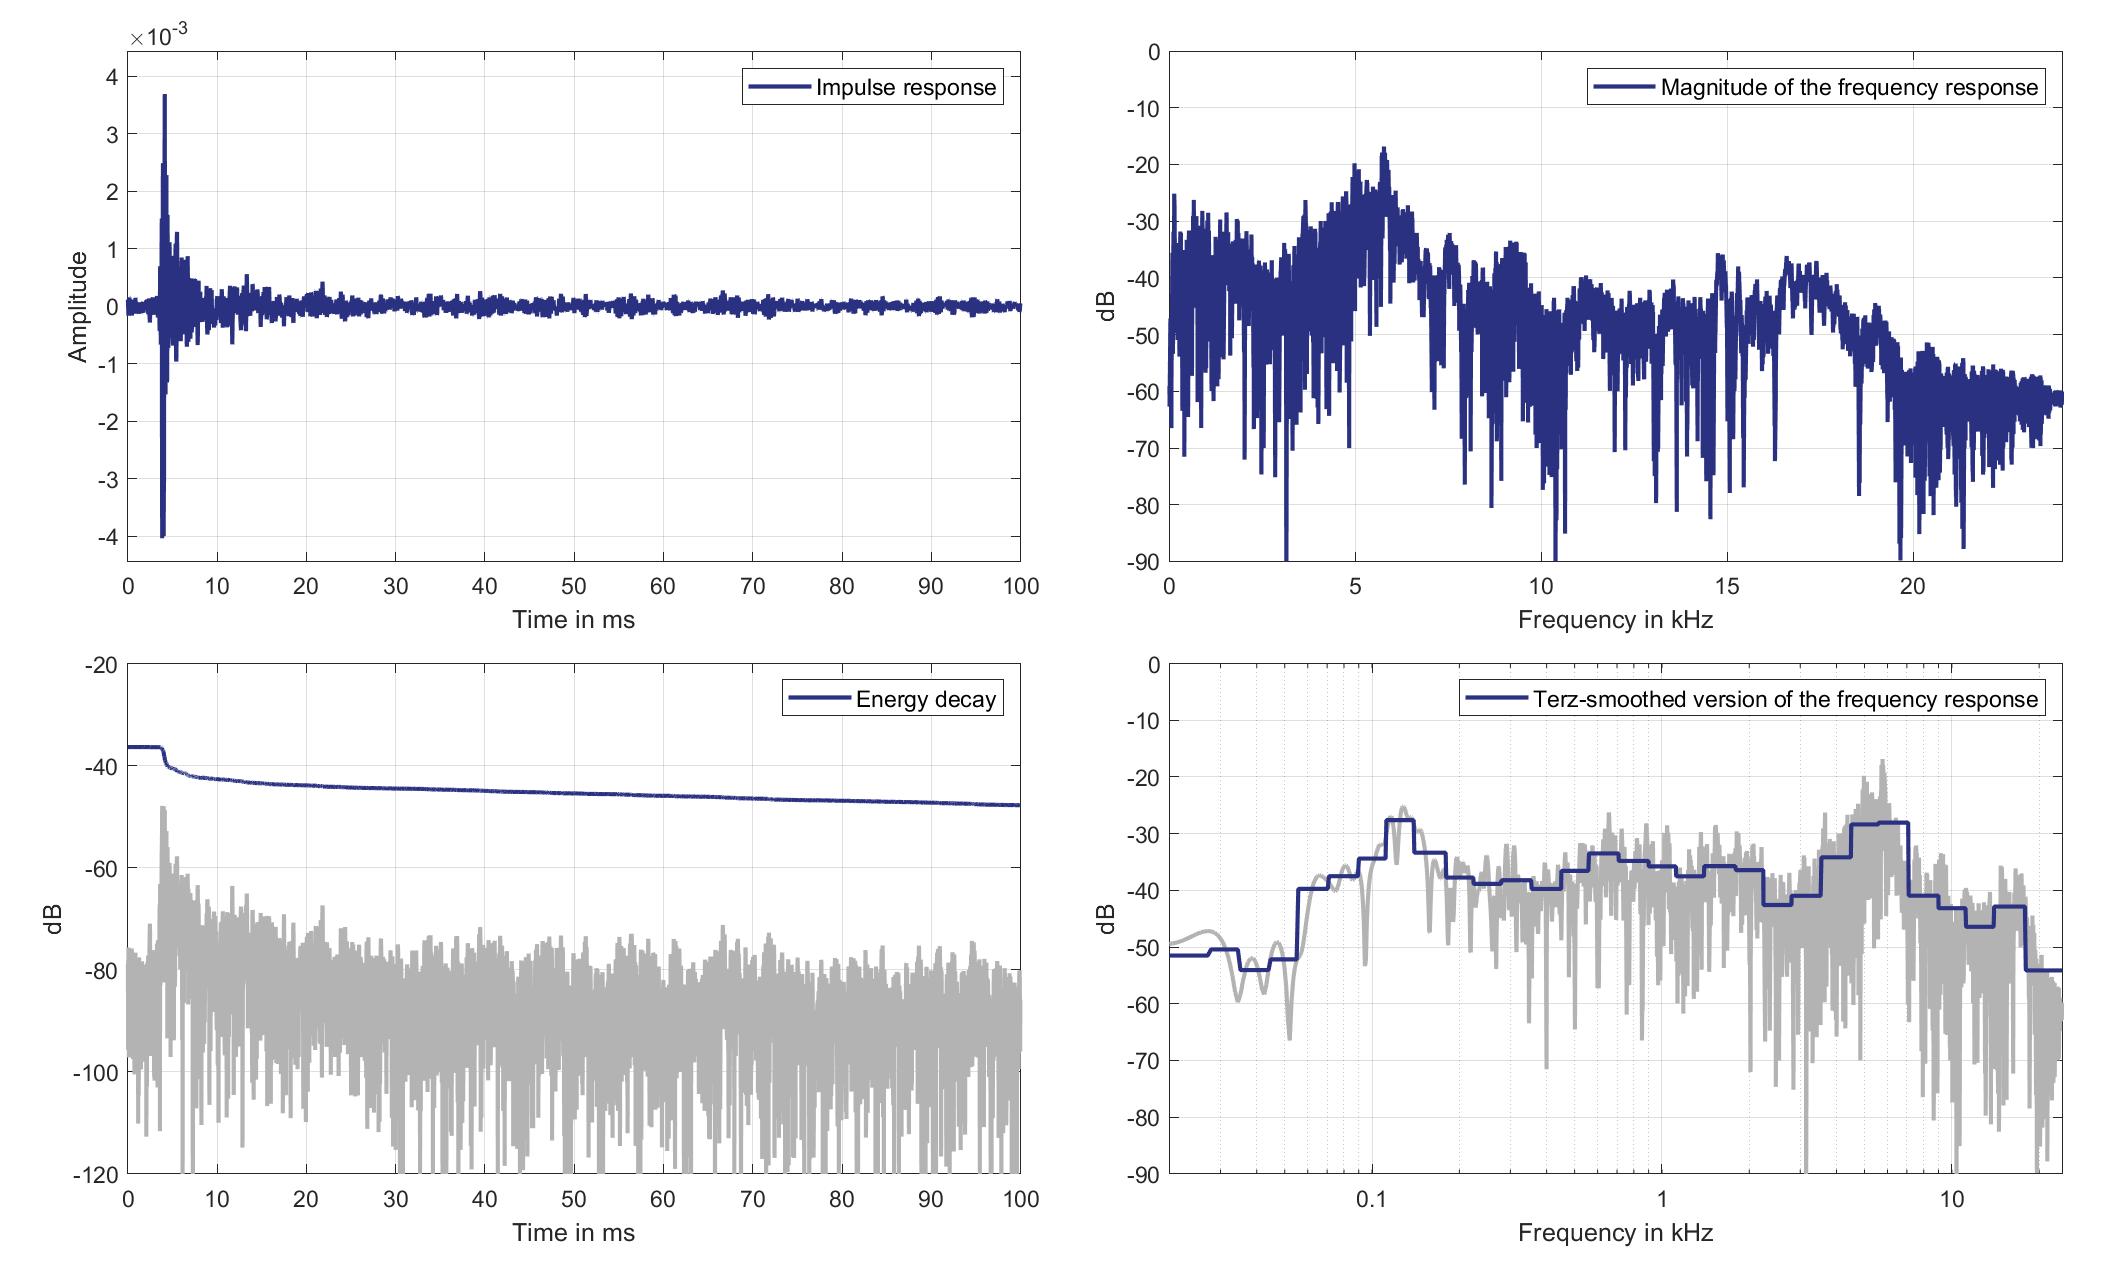
Download impulse response (in ".fir" format).
In the download section you can download all impulse response files as well as format explanation and Matlab as well as Python code examples for loading fir files.
Mic. 9
Mouth Loudspeaker of Zone 8 (Lsp. 17) to Standard Car Microphone 9 (Mic. 9)
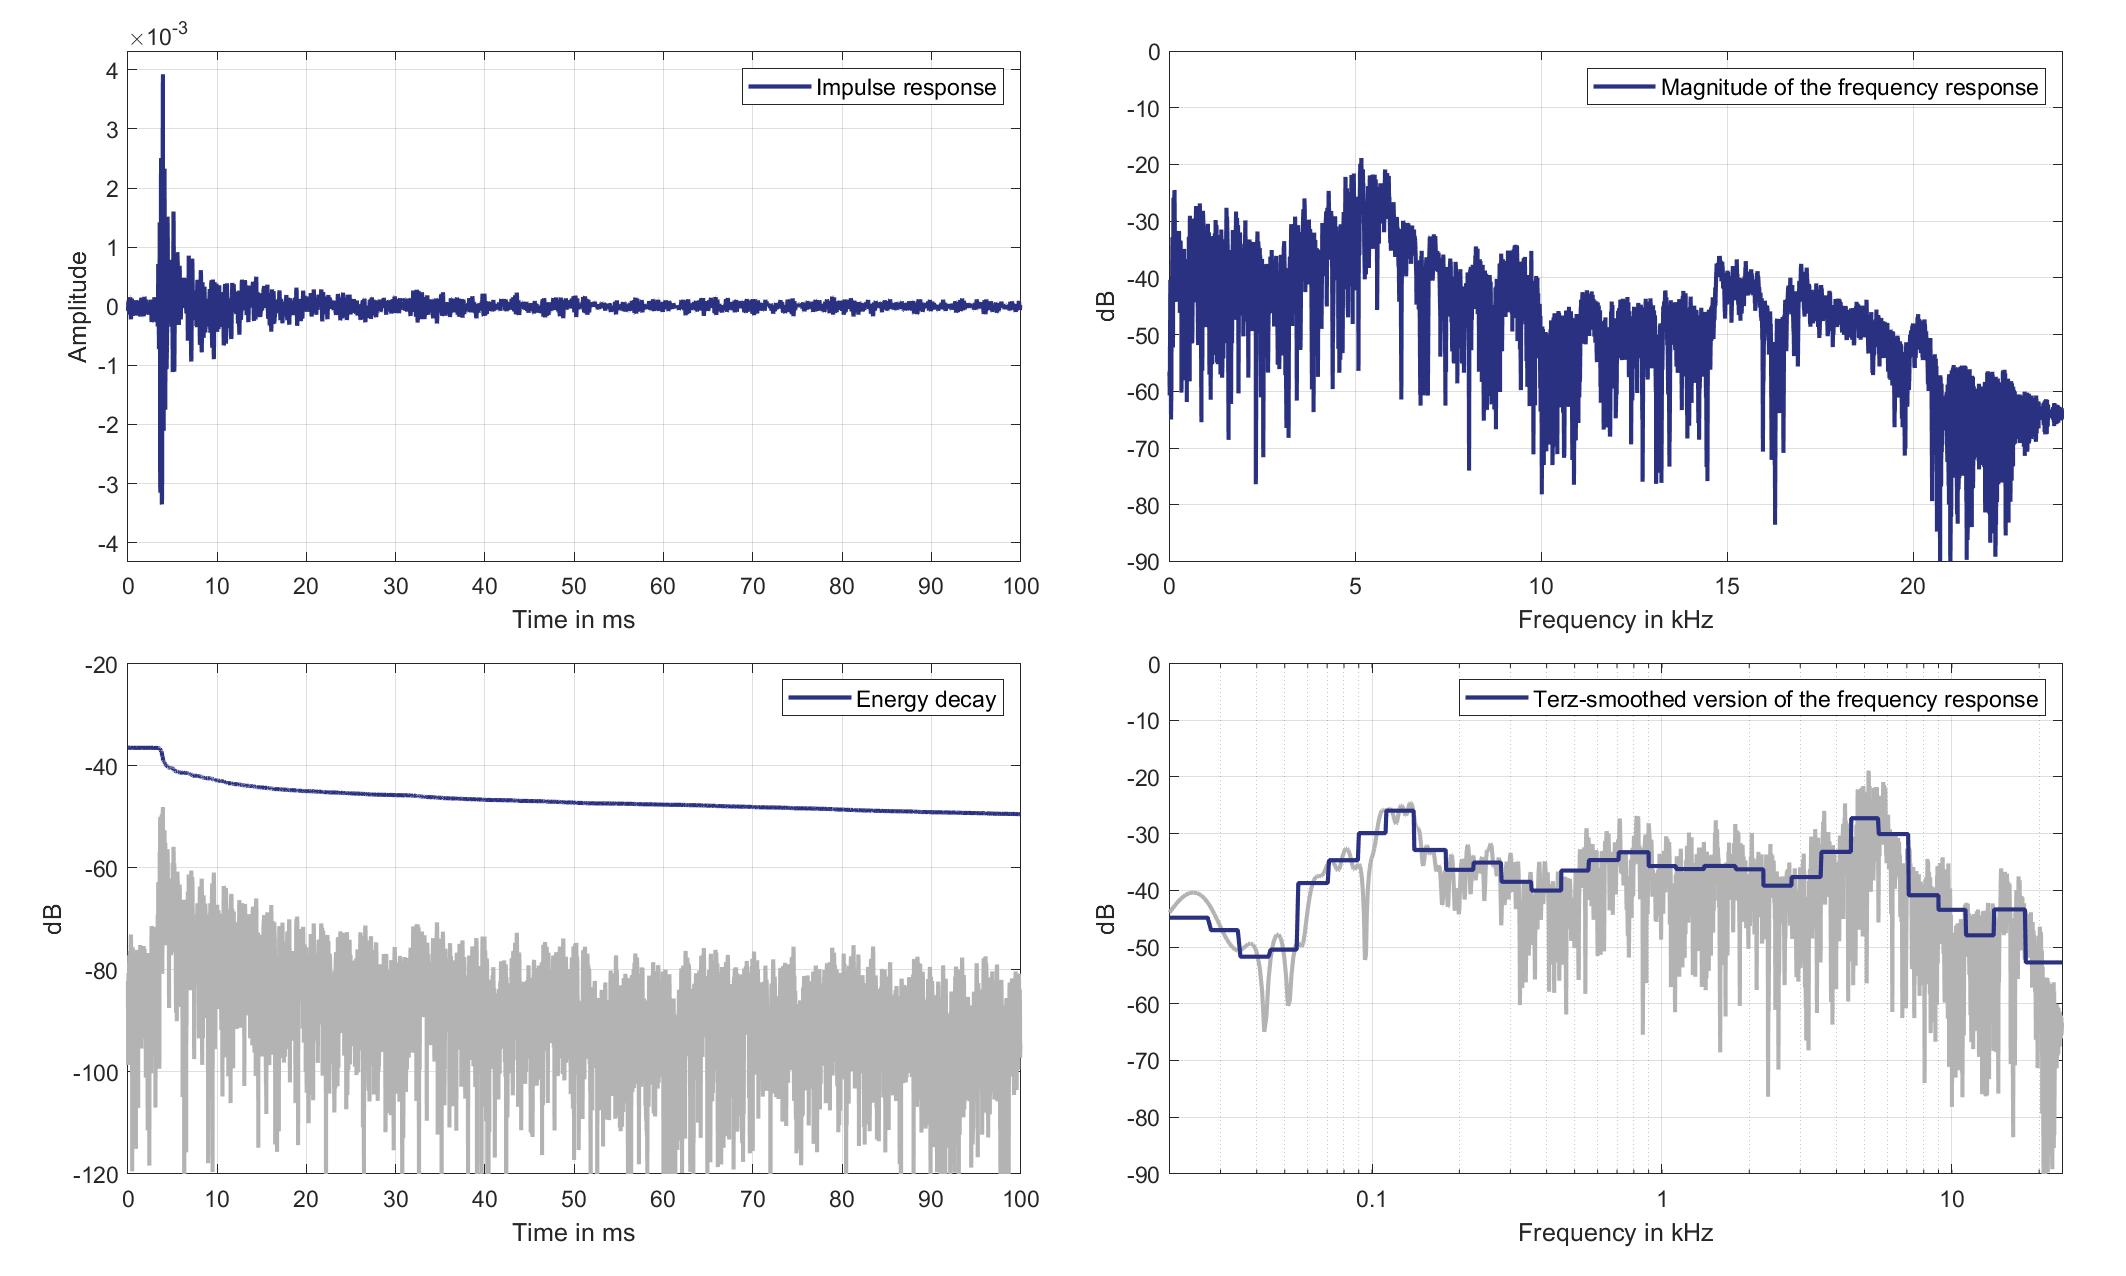
Download impulse response (in ".fir" format).
In the download section you can download all impulse response files as well as format explanation and Matlab as well as Python code examples for loading fir files.
Mic. 10
Mouth Loudspeaker of Zone 8 (Lsp. 17) to Standard Car Microphone 10 (Mic. 10)
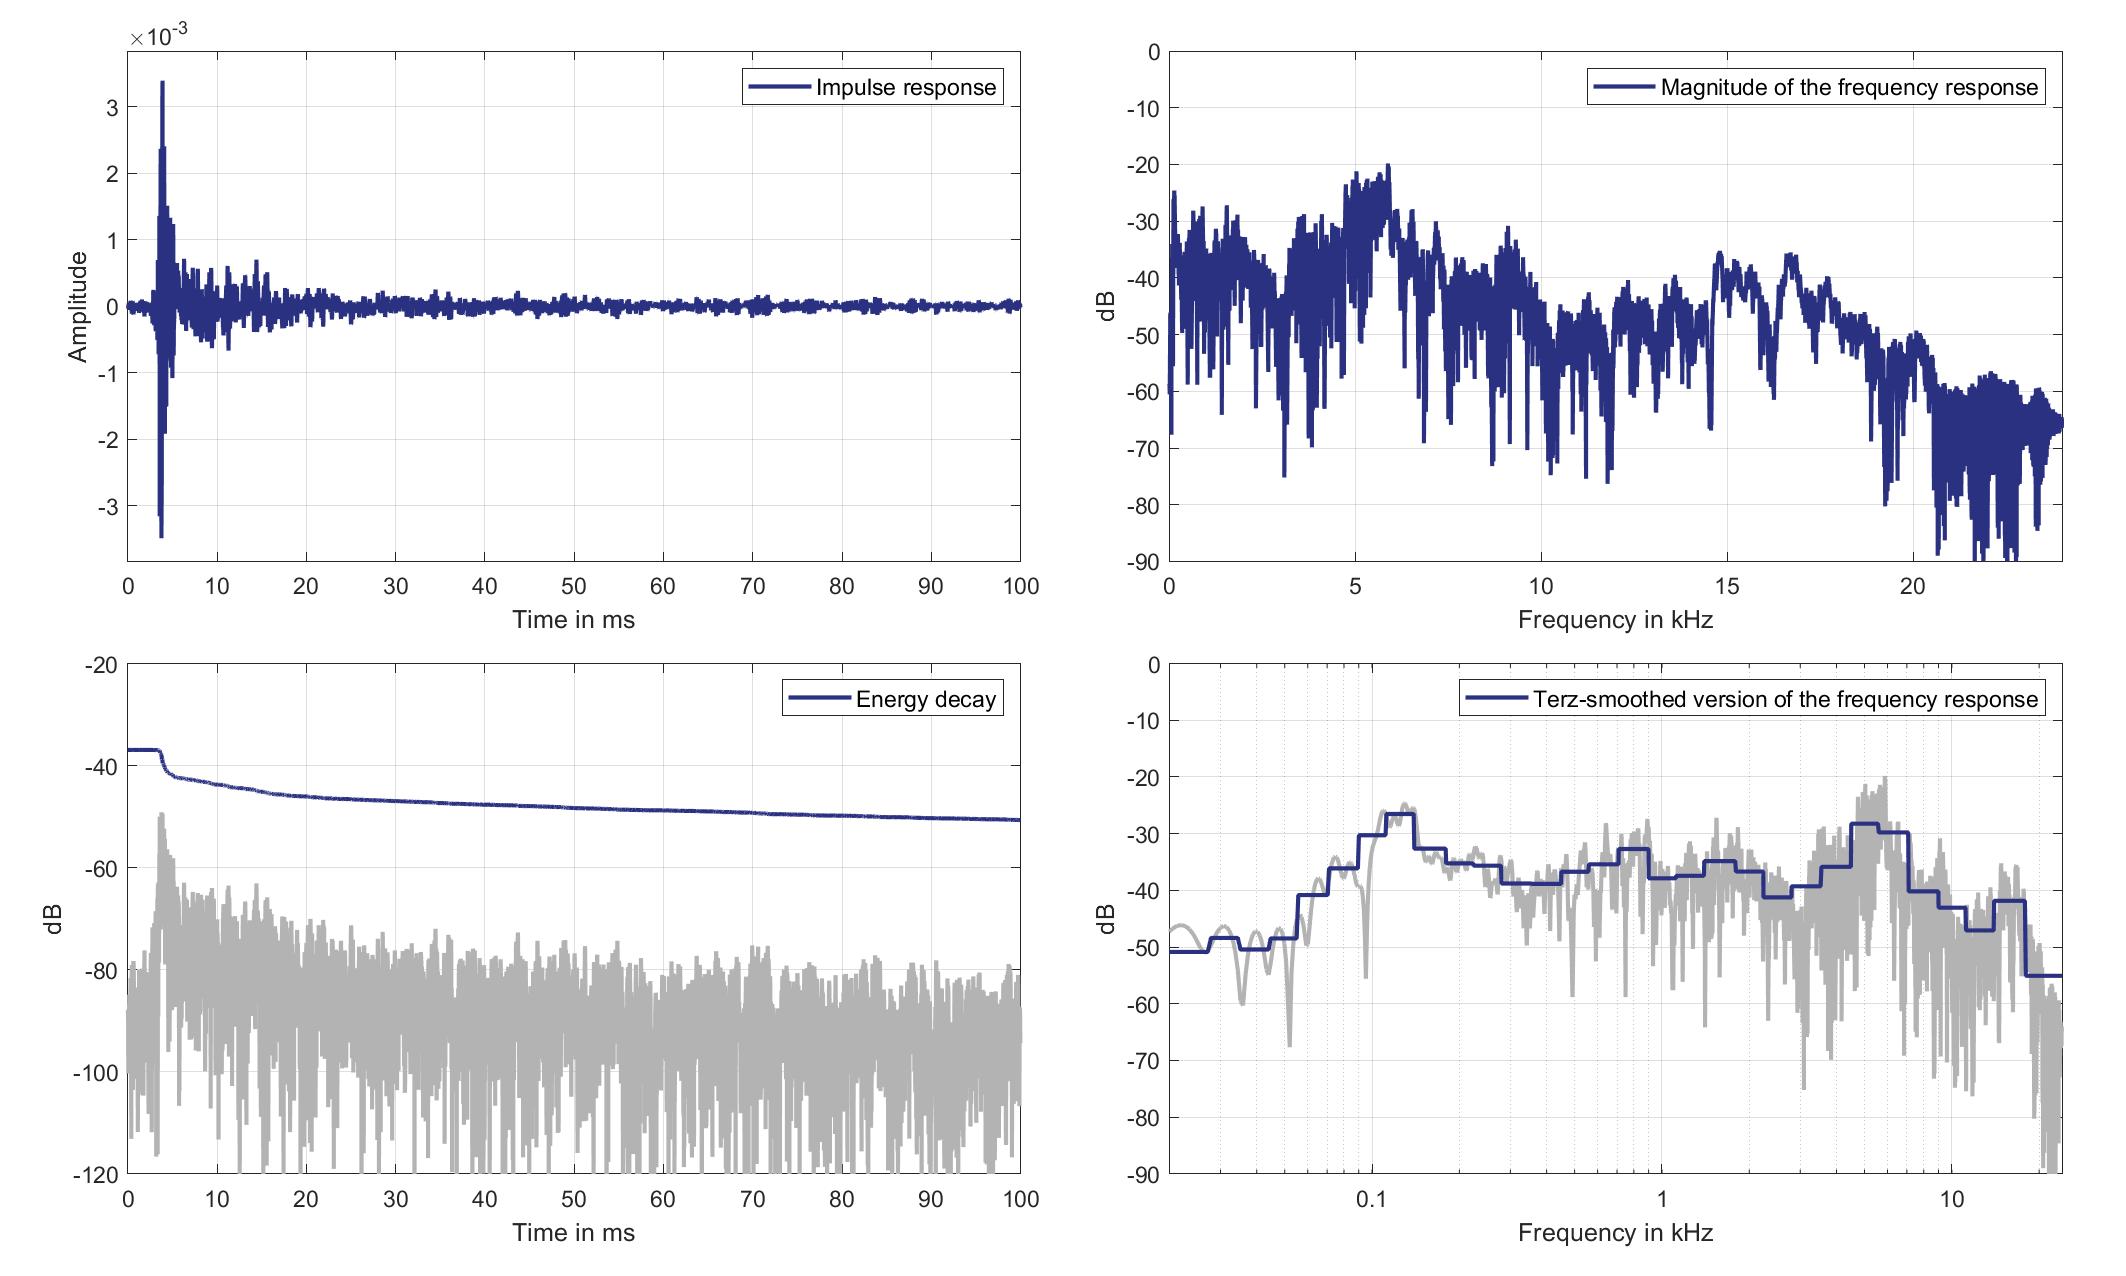
Download impulse response (in ".fir" format).
In the download section you can download all impulse response files as well as format explanation and Matlab as well as Python code examples for loading fir files.
Mic. 11
Mouth Loudspeaker of Zone 8 (Lsp. 17) to Standard Car Microphone 11 (Mic. 11)
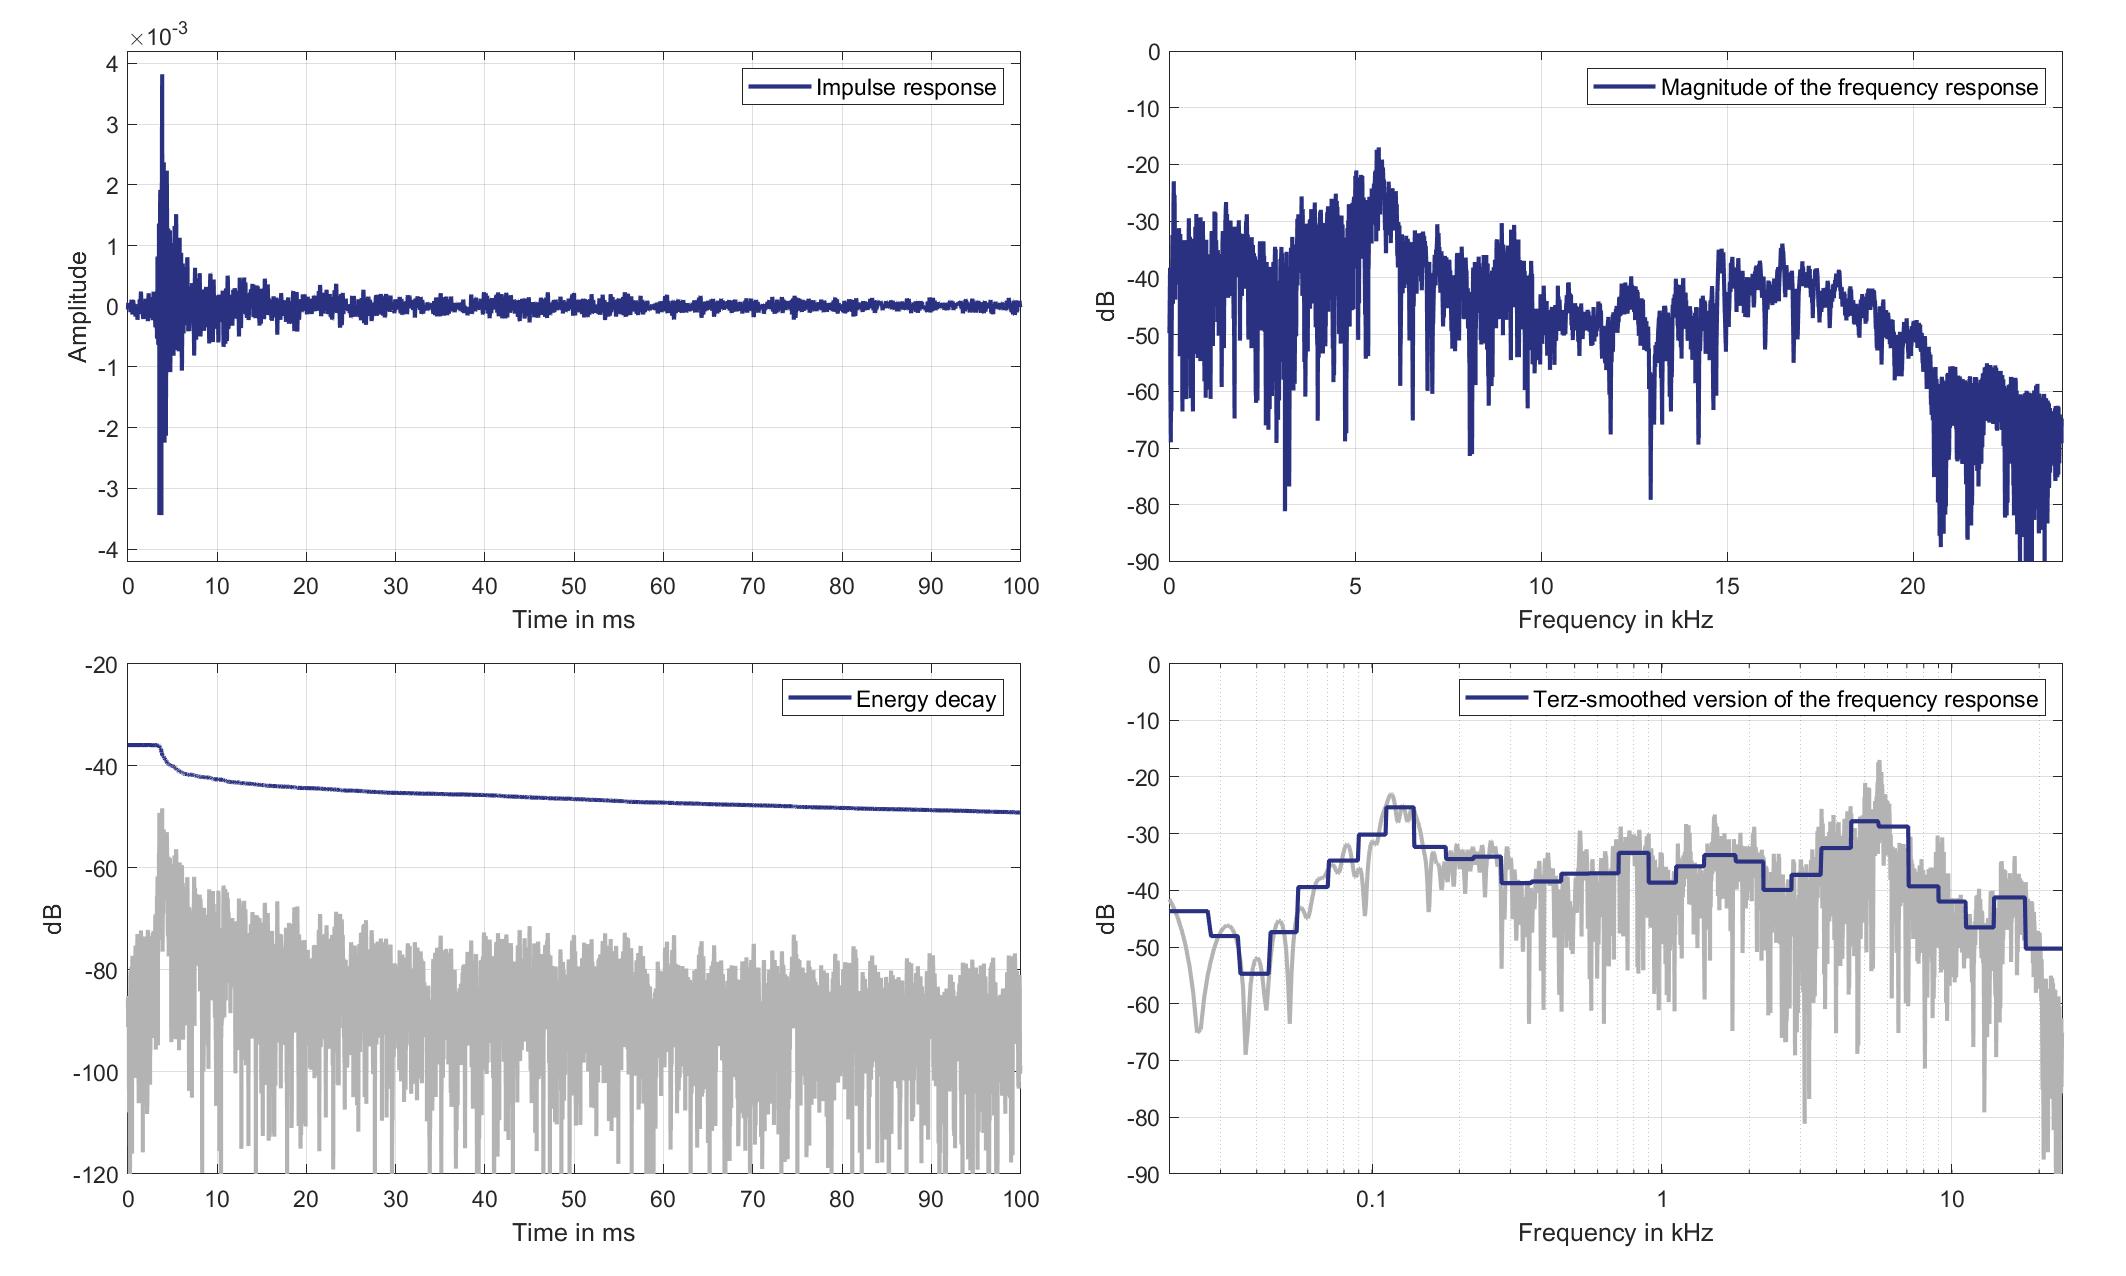
Download impulse response (in ".fir" format).
In the download section you can download all impulse response files as well as format explanation and Matlab as well as Python code examples for loading fir files.
Mic. 12
Mouth Loudspeaker of Zone 8 (Lsp. 17) to Standard Car Microphone 12 (Mic. 12)
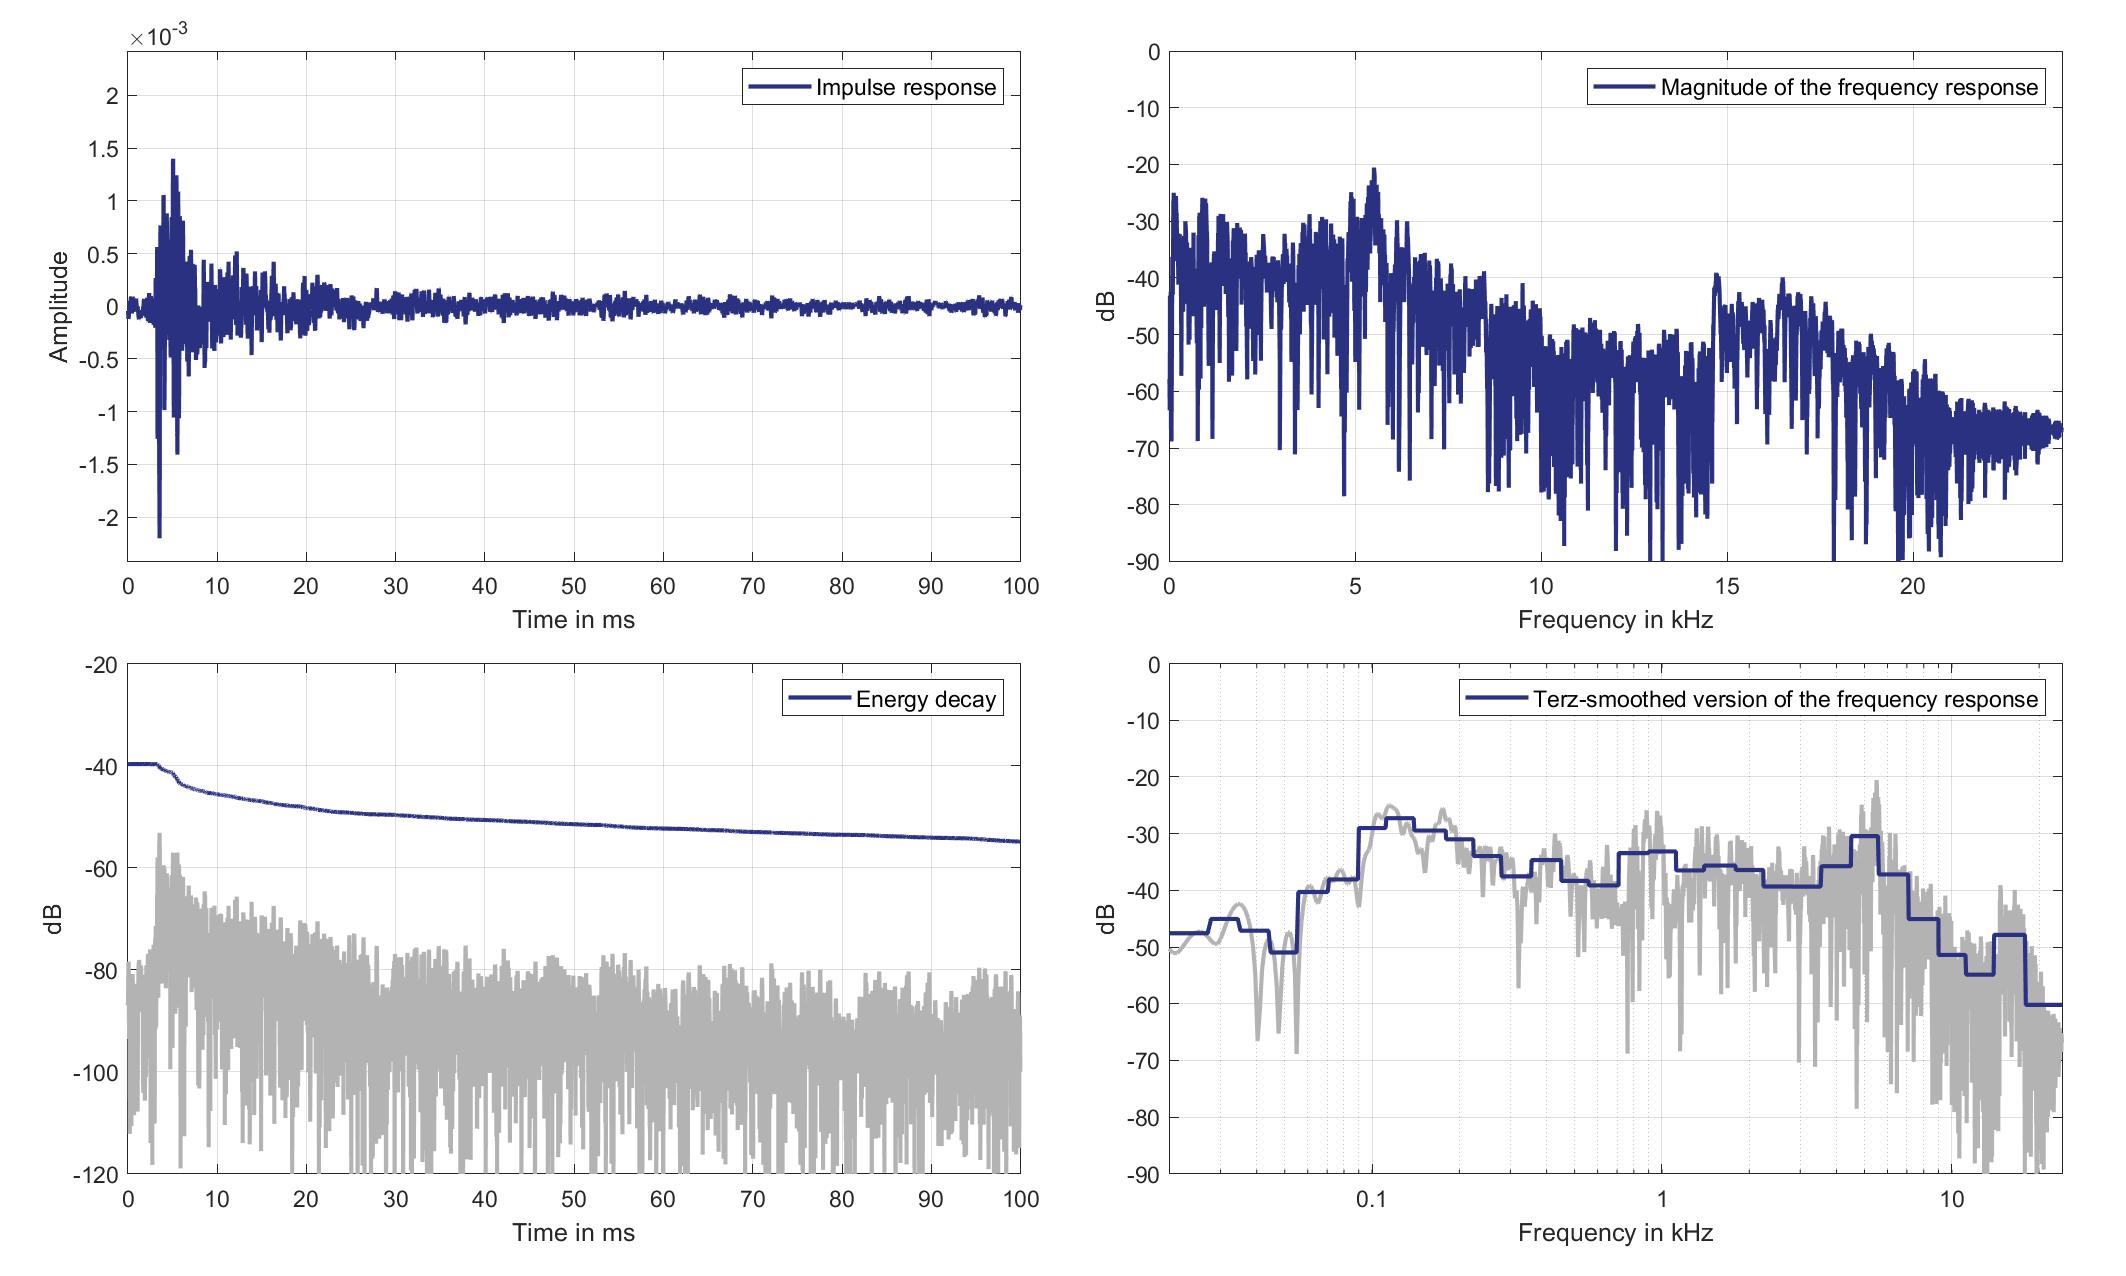
Download impulse response (in ".fir" format).
In the download section you can download all impulse response files as well as format explanation and Matlab as well as Python code examples for loading fir files.
Mic. 13
Mouth Loudspeaker of Zone 8 (Lsp. 17) to Standard Car Microphone 13 (Mic. 13)
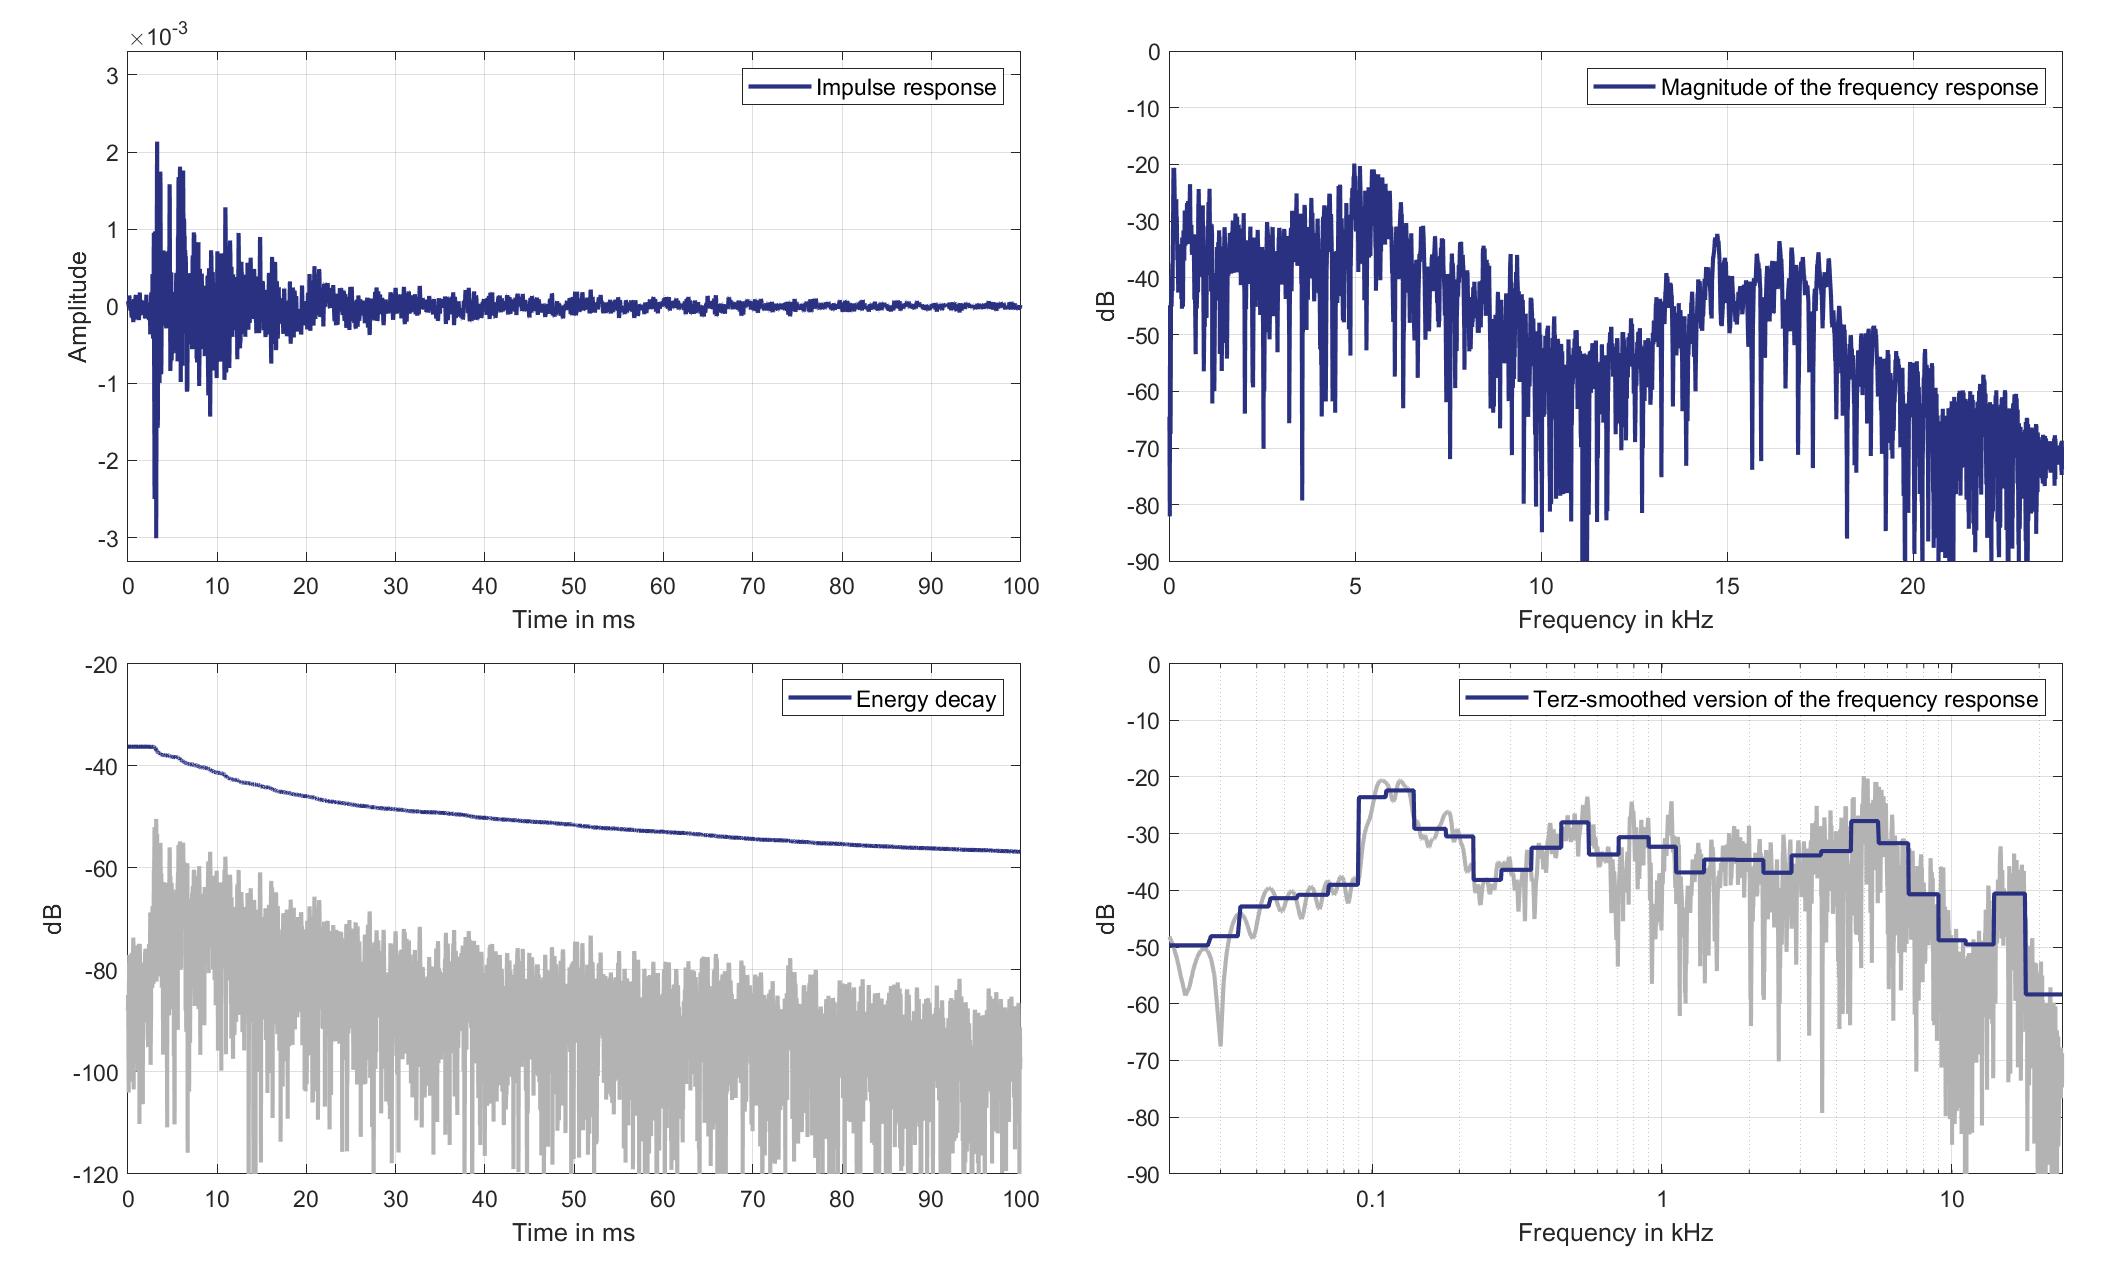
Download impulse response (in ".fir" format).
In the download section you can download all impulse response files as well as format explanation and Matlab as well as Python code examples for loading fir files.
Mic. 14
Mouth Loudspeaker of Zone 8 (Lsp. 17) to Standard Car Microphone 14 (Mic. 14)
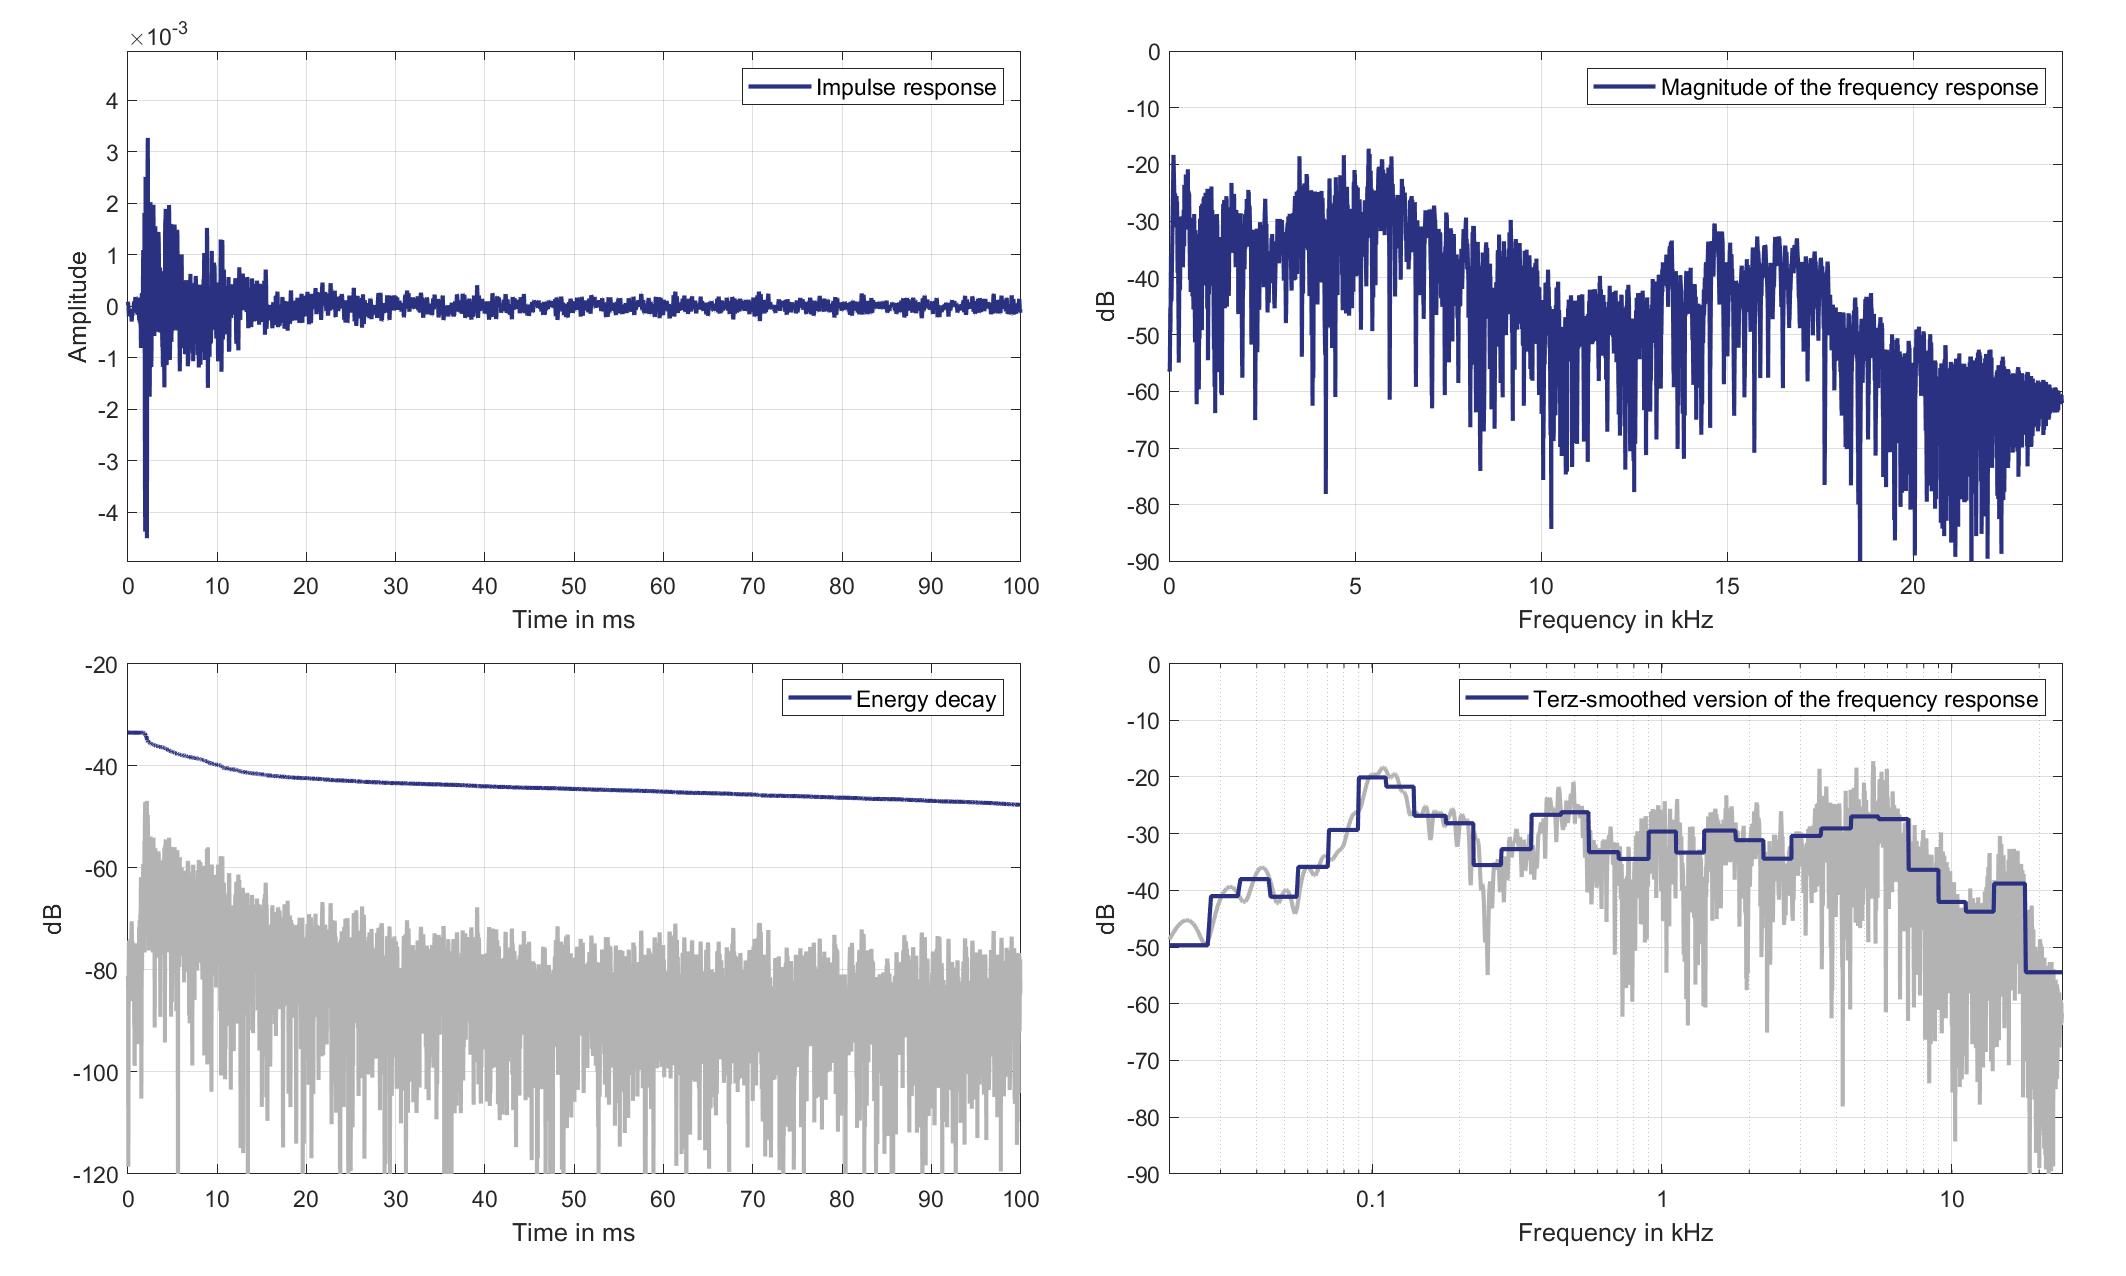
Download impulse response (in ".fir" format).
In the download section you can download all impulse response files as well as format explanation and Matlab as well as Python code examples for loading fir files.
Mic. 15
Mouth Loudspeaker of Zone 8 (Lsp. 17) to Standard Car Microphone 15 (Mic. 15)
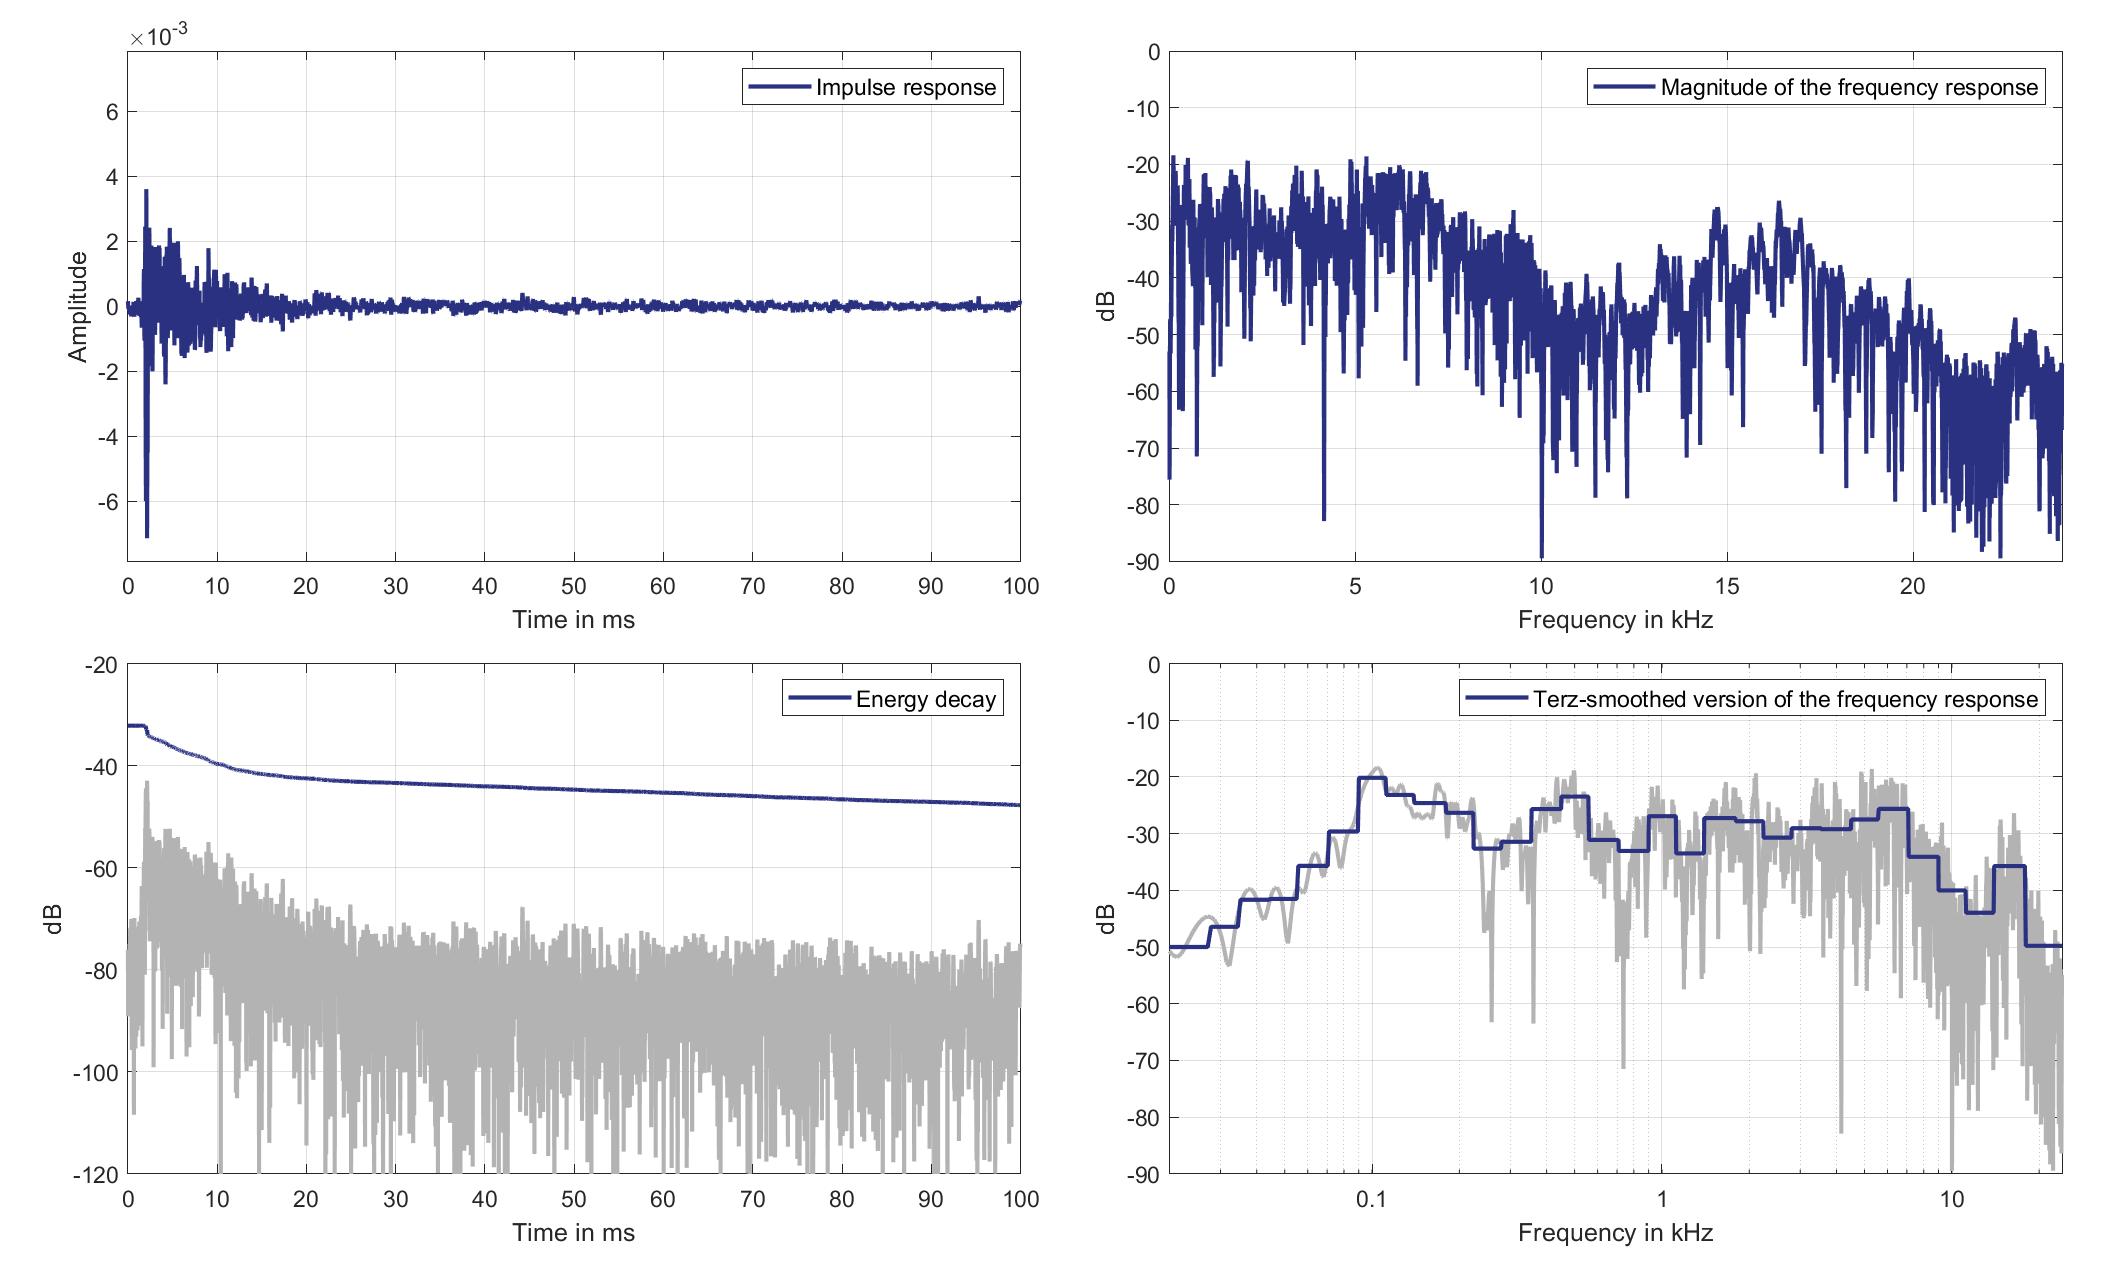
Download impulse response (in ".fir" format).
In the download section you can download all impulse response files as well as format explanation and Matlab as well as Python code examples for loading fir files.
Mic. 16
Mouth Loudspeaker of Zone 8 (Lsp. 17) to Standard Car Microphone 16 (Mic. 16)
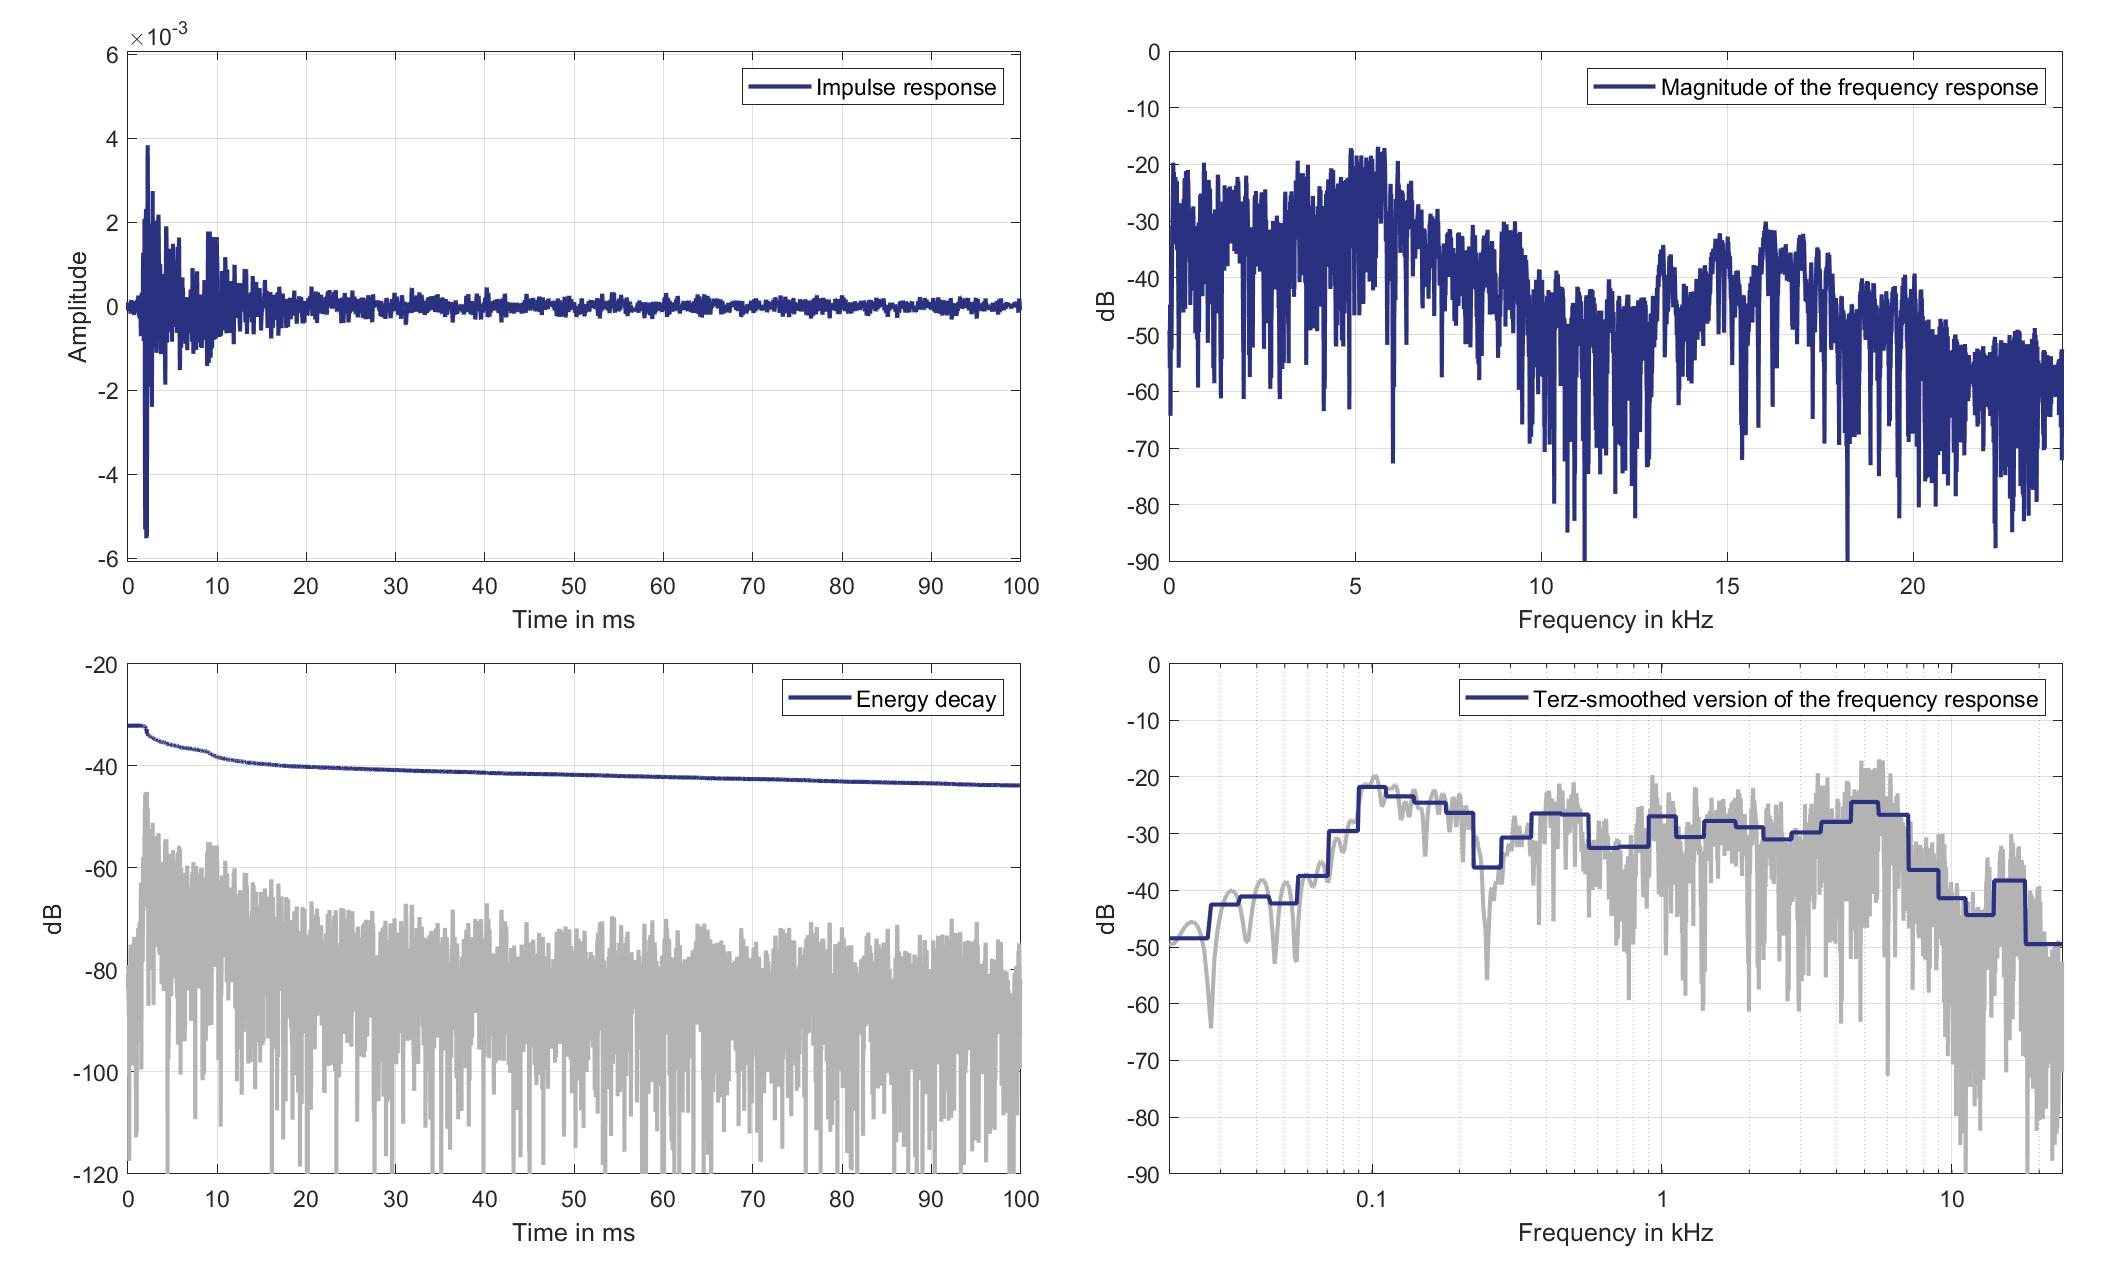
Download impulse response (in ".fir" format).
In the download section you can download all impulse response files as well as format explanation and Matlab as well as Python code examples for loading fir files.
Mic. 17
Mouth Loudspeaker of Zone 8 (Lsp. 17) to Standard Car Microphone 17 (Mic. 17)
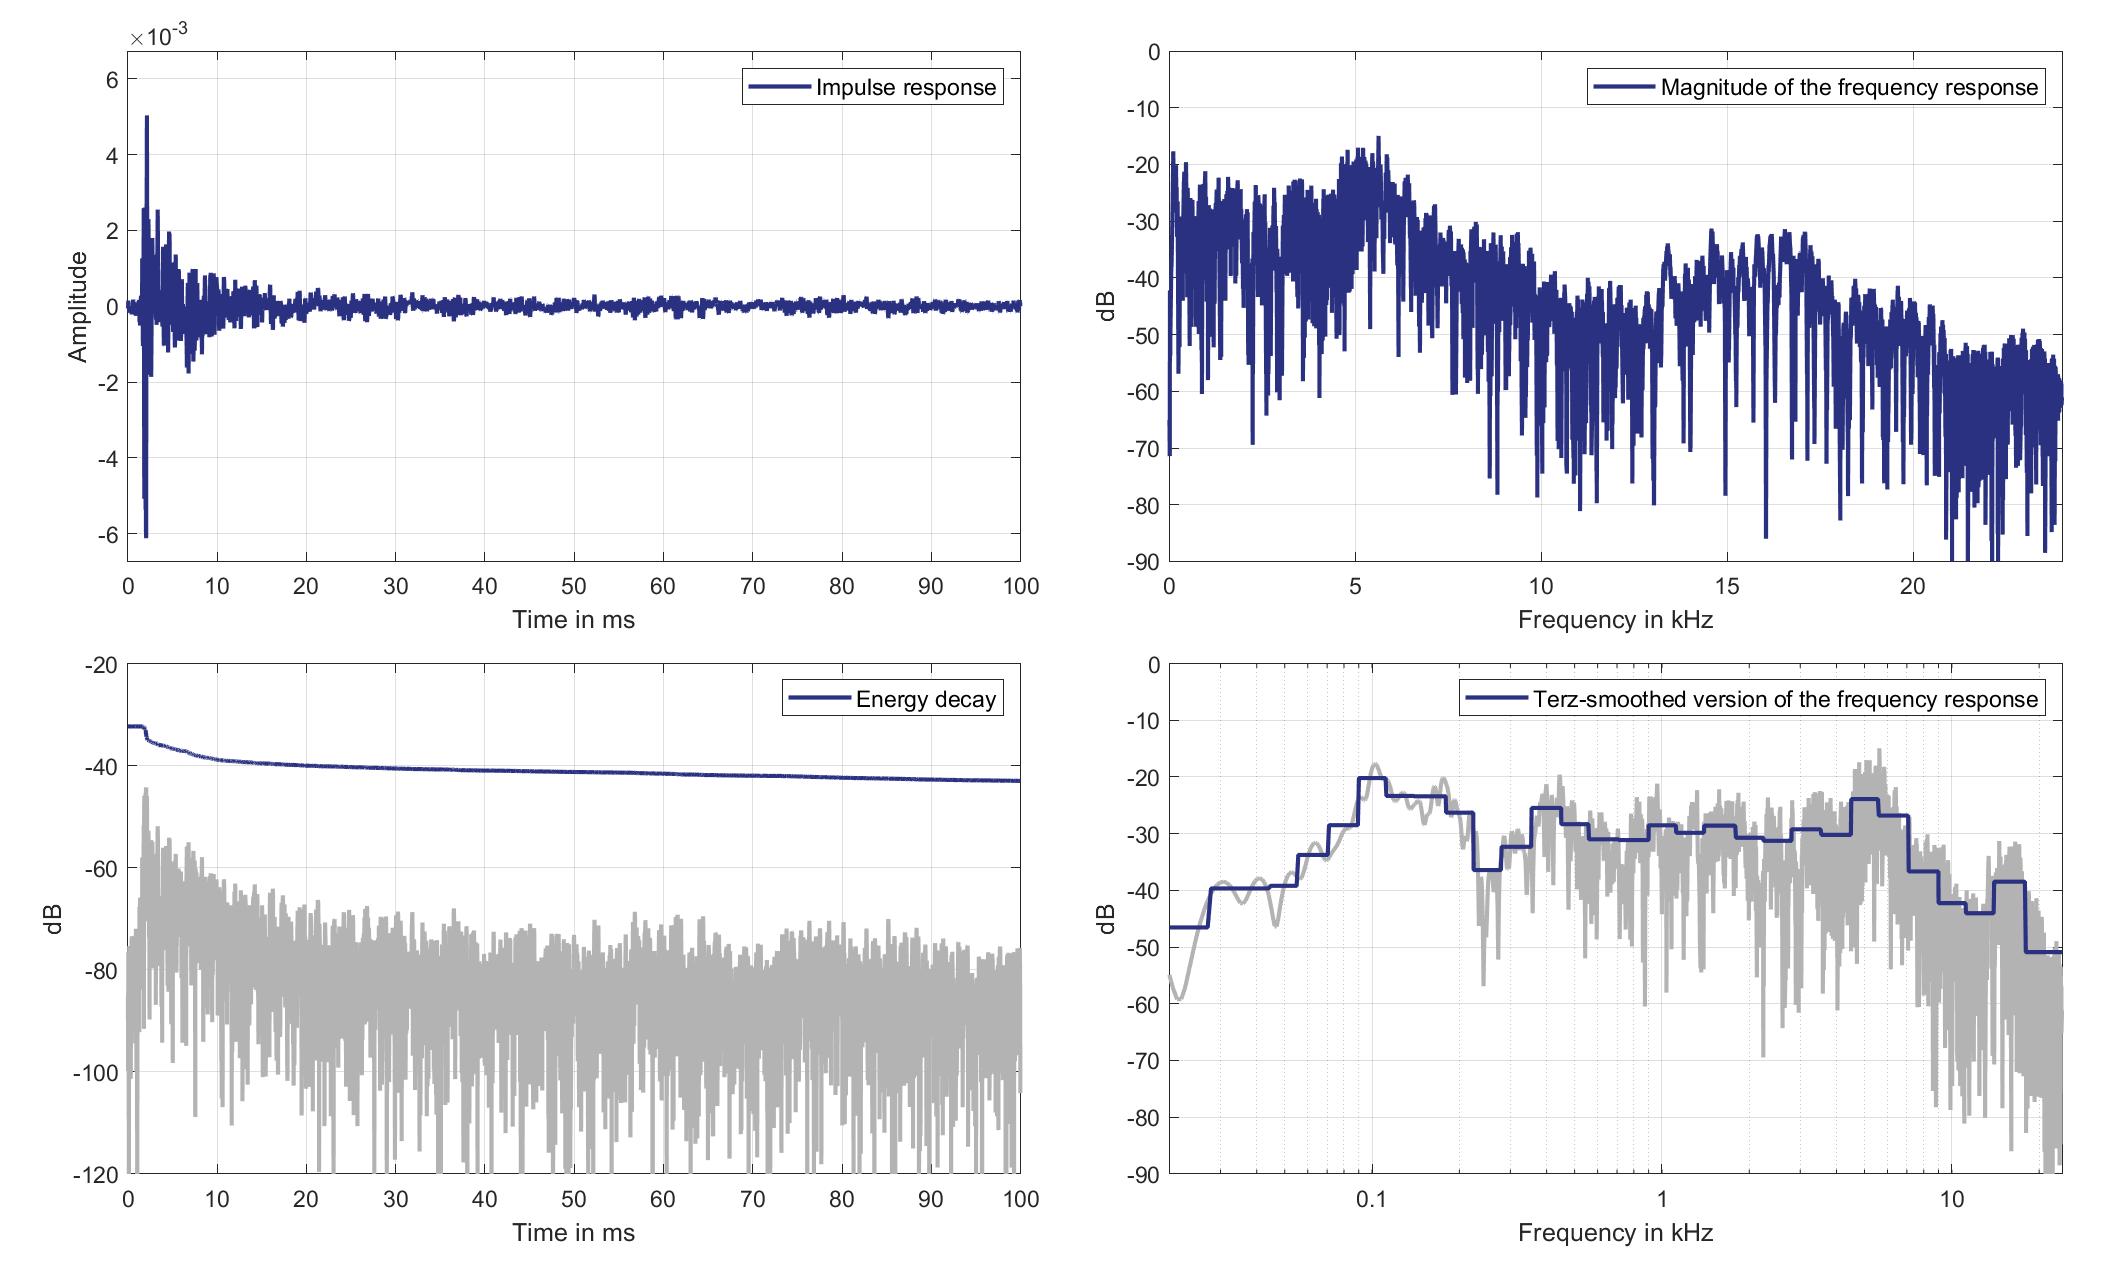
Download impulse response (in ".fir" format).
In the download section you can download all impulse response files as well as format explanation and Matlab as well as Python code examples for loading fir files.
Mic. 18
Mouth Loudspeaker of Zone 8 (Lsp. 17) to Standard Car Microphone 18 (Mic. 18)
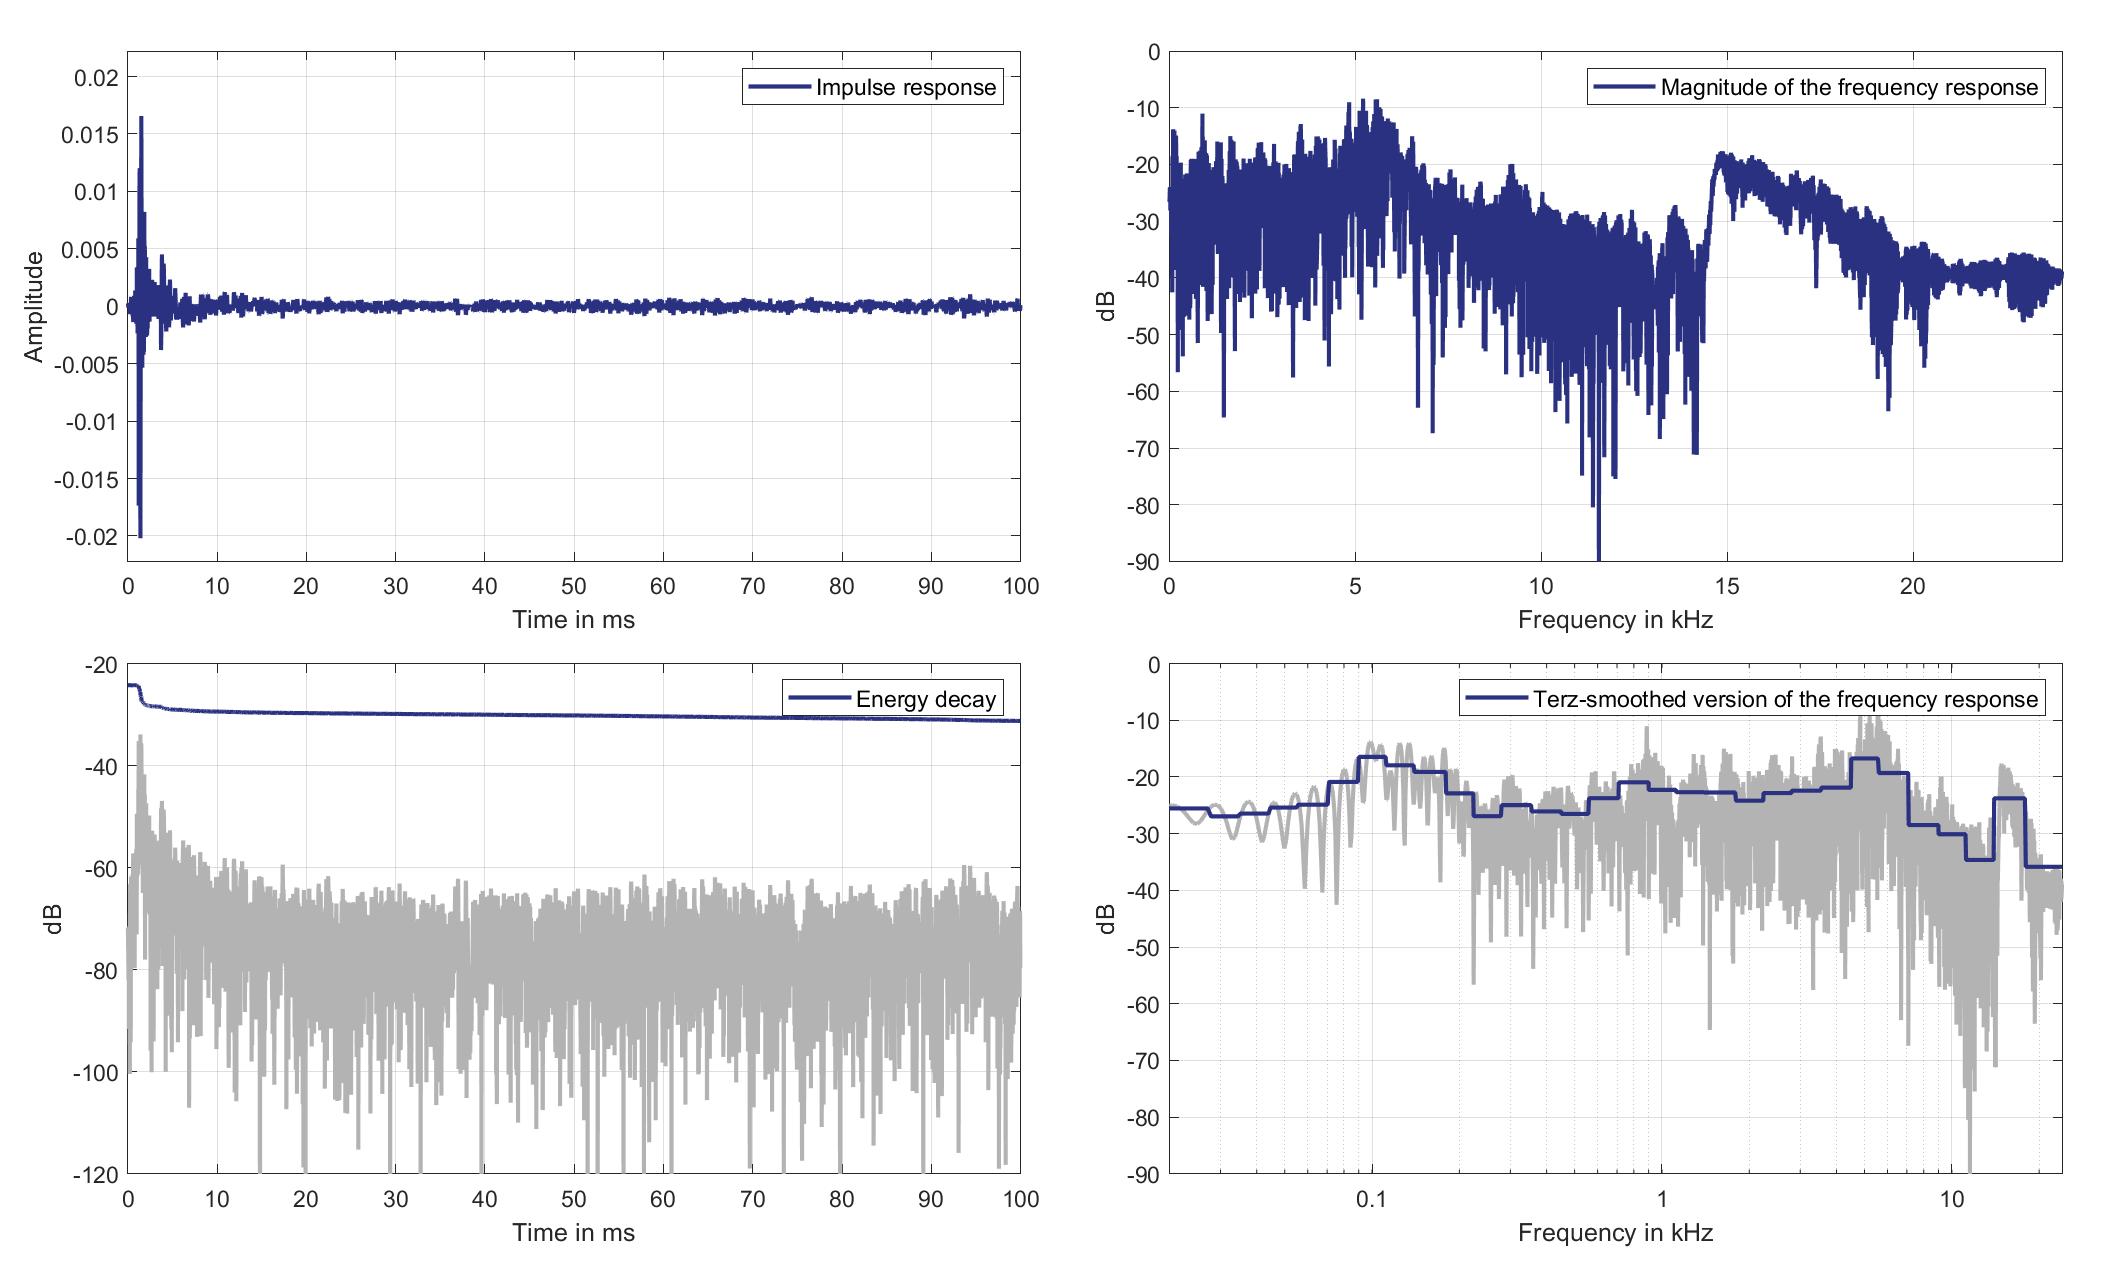
Download impulse response (in ".fir" format).
In the download section you can download all impulse response files as well as format explanation and Matlab as well as Python code examples for loading fir files.
Mouth Loudspeakers to Ear Microphones
Lsp. 12
Mics. 19/20
Left Ear Microphone
Mouth Loudspeaker of Zone 1 (Lsp. 12) to Left Ear Microphone of Zone 1 (Mic. 19)
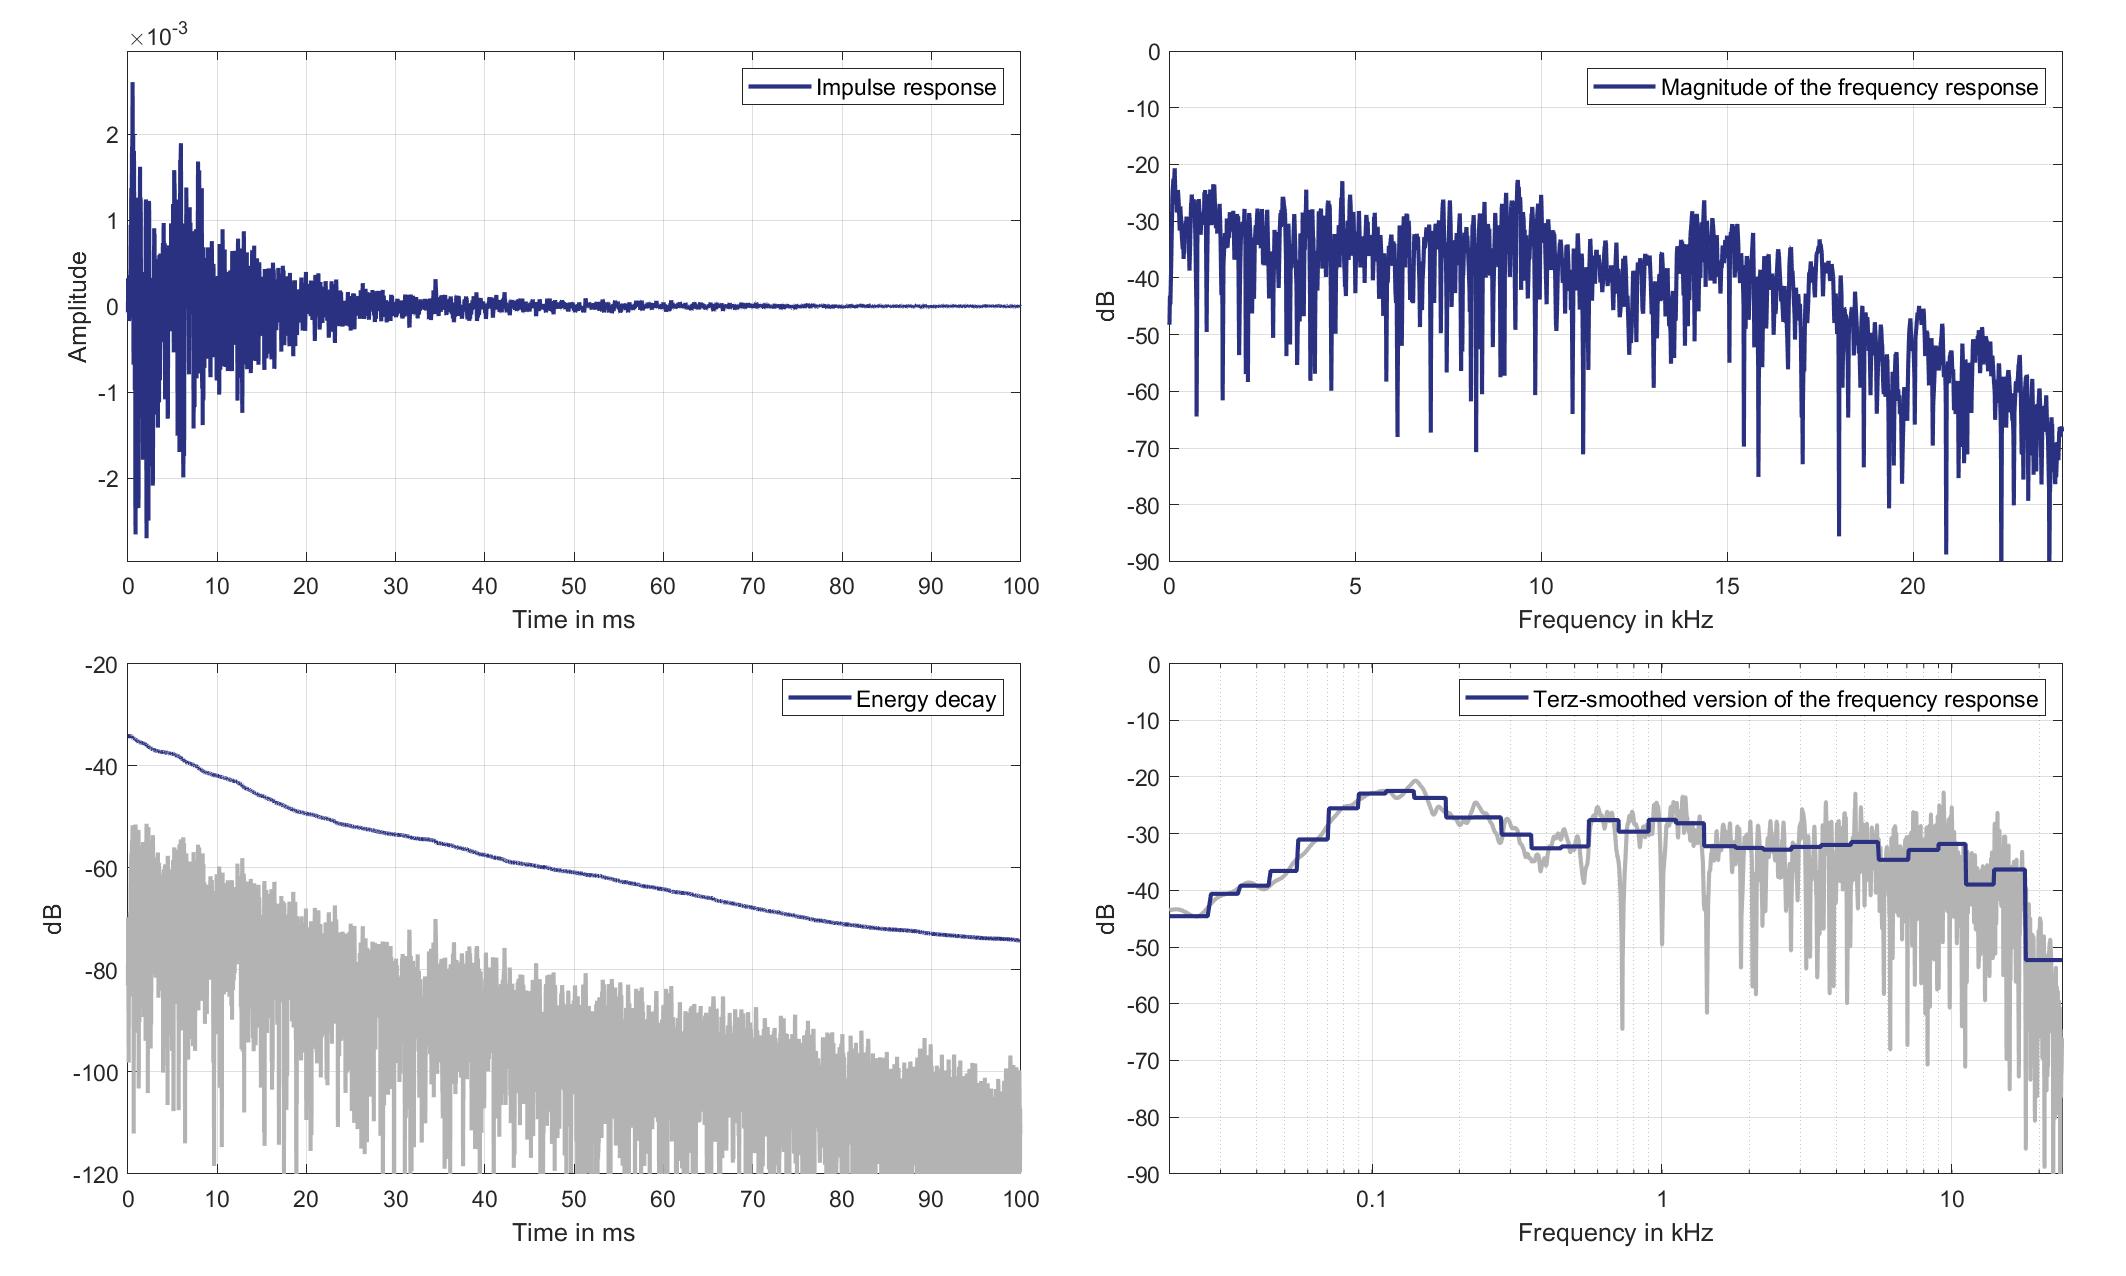
Download impulse response (in ".fir" format).
In the download section you can download all impulse response files as well as format explanation and Matlab as well as Python code examples for loading fir files.
Right Ear Microphone
Mouth Loudspeaker of Zone 1 (Lsp. 12) to Right Ear Microphone of Zone 1 (Mic. 20)
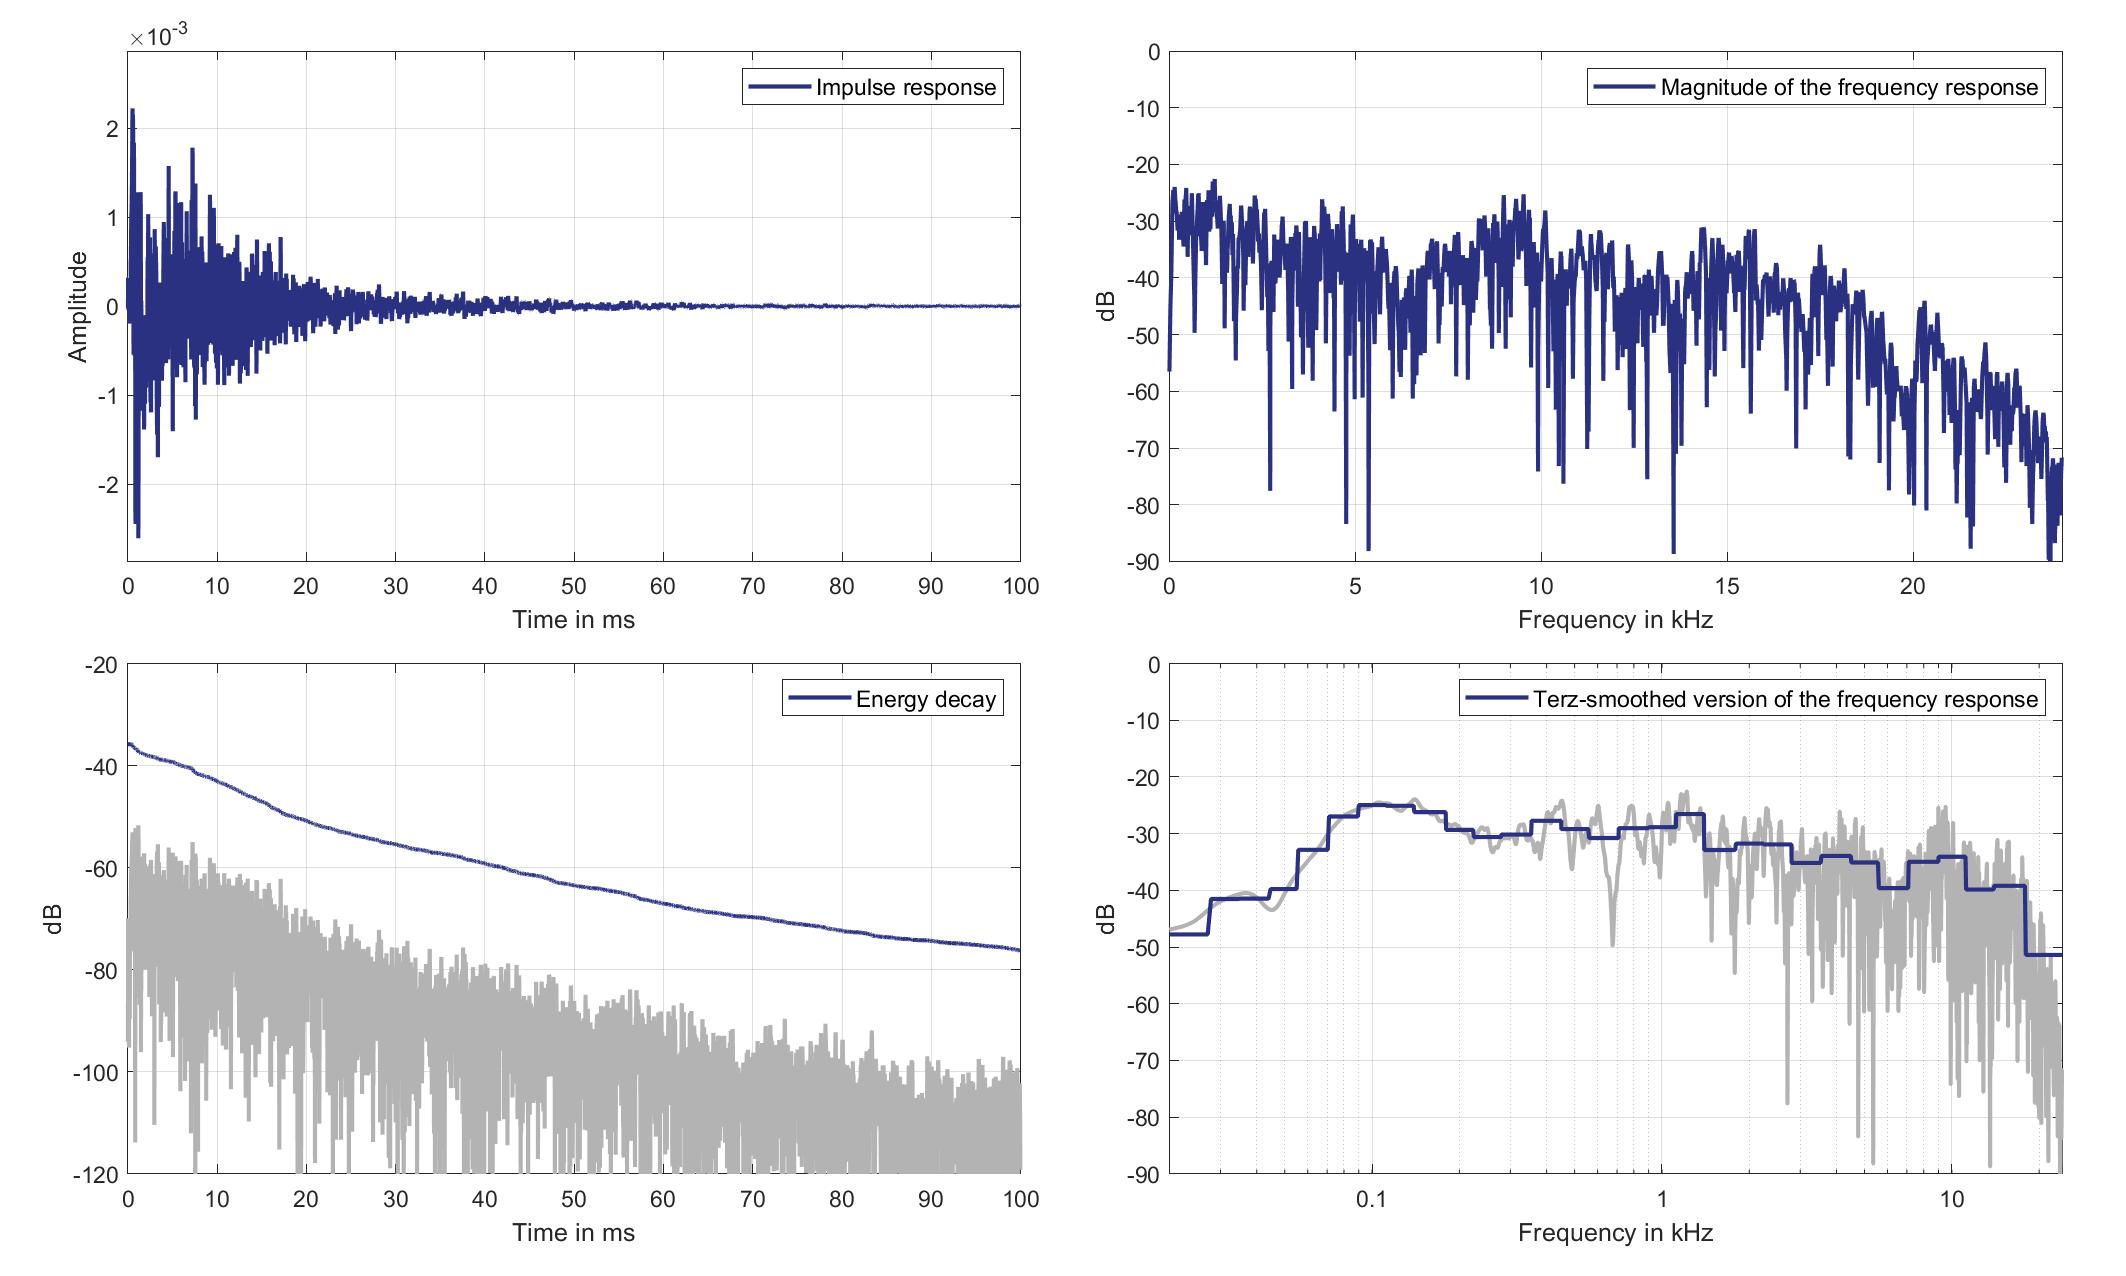
Download impulse response (in ".fir" format).
In the download section you can download all impulse response files as well as format explanation and Matlab as well as Python code examples for loading fir files.
Mics. 21/22
Left Ear Microphone
Mouth Loudspeaker of Zone 1 (Lsp. 12) to Left Ear Microphone of Zone 2 (Mic. 21)
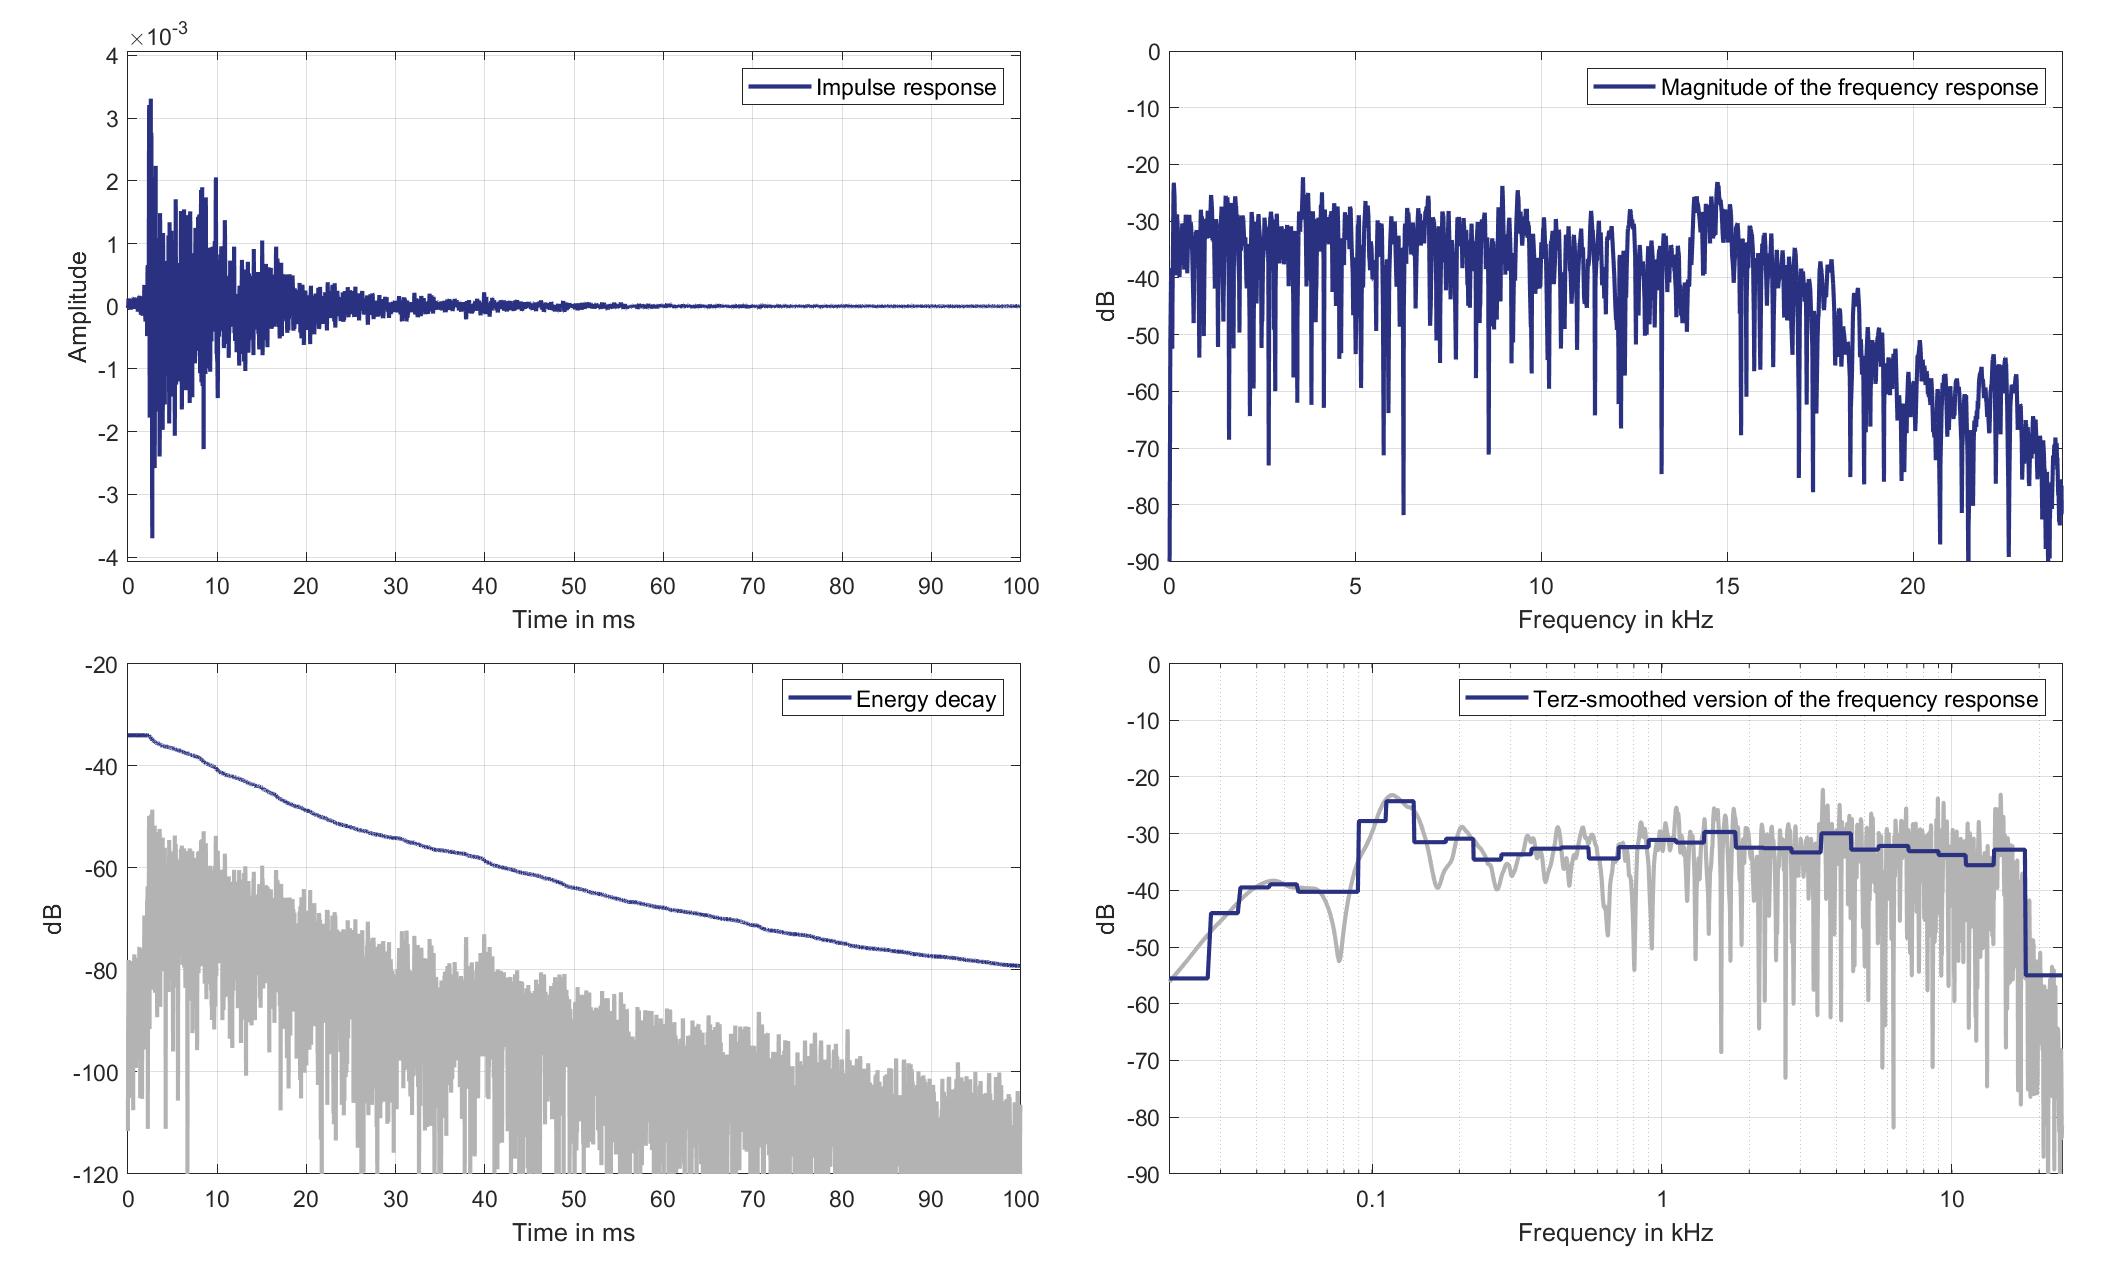
Download impulse response (in ".fir" format).
In the download section you can download all impulse response files as well as format explanation and Matlab as well as Python code examples for loading fir files.
Right Ear Microphone
Mouth Loudspeaker of Zone 1 (Lsp. 12) to Right Ear Microphone of Zone 2 (Mic. 22)
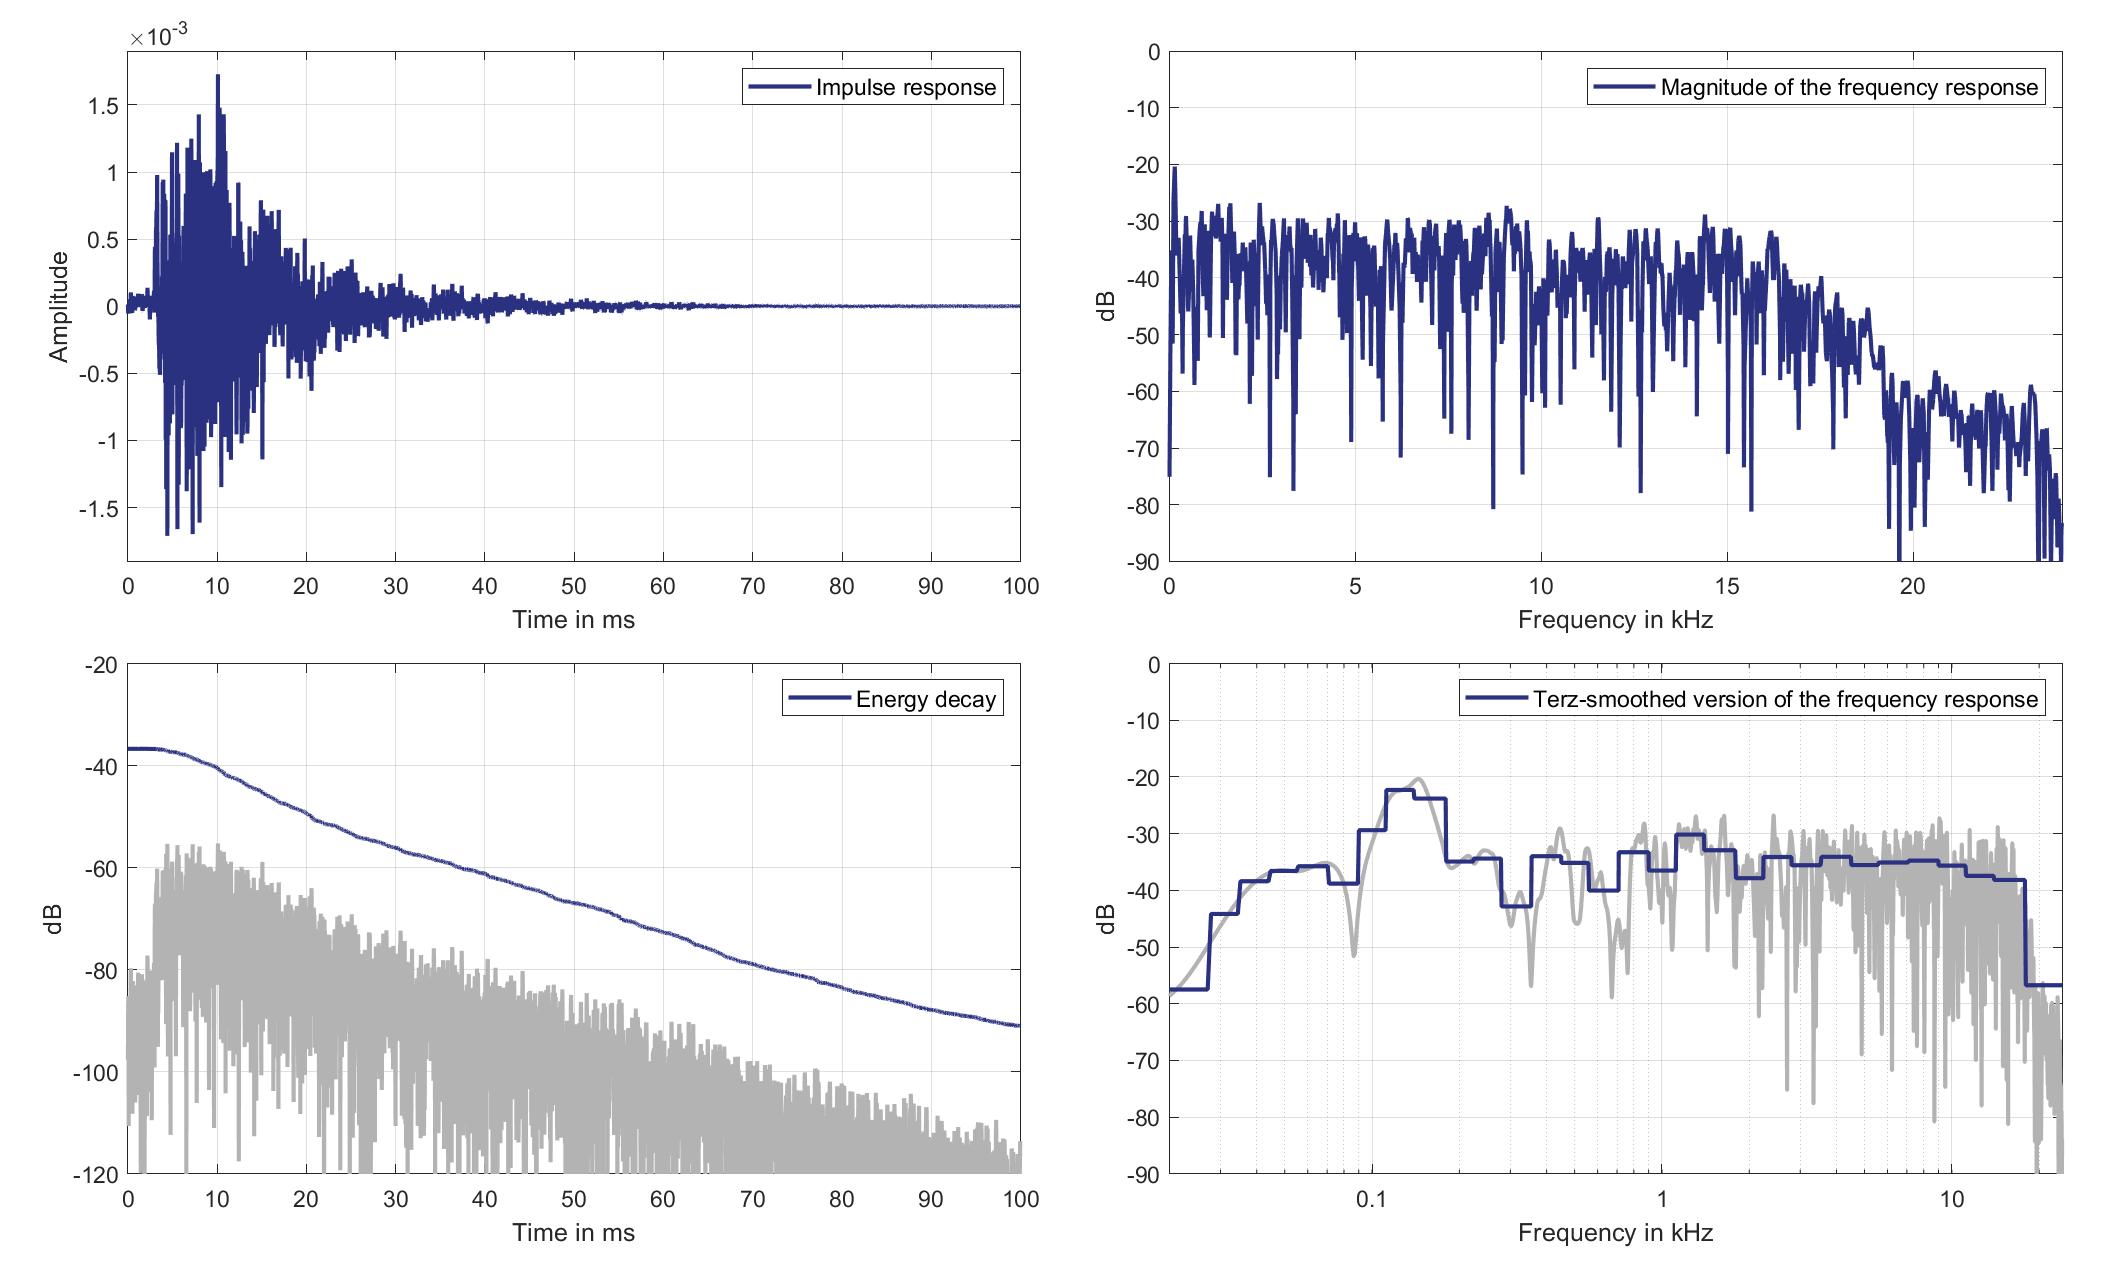
Download impulse response (in ".fir" format).
In the download section you can download all impulse response files as well as format explanation and Matlab as well as Python code examples for loading fir files.
Mics. 23/24
Left Ear Microphone
Mouth Loudspeaker of Zone 1 (Lsp. 12) to Left Ear Microphone of Zone 3 (Mic. 23)
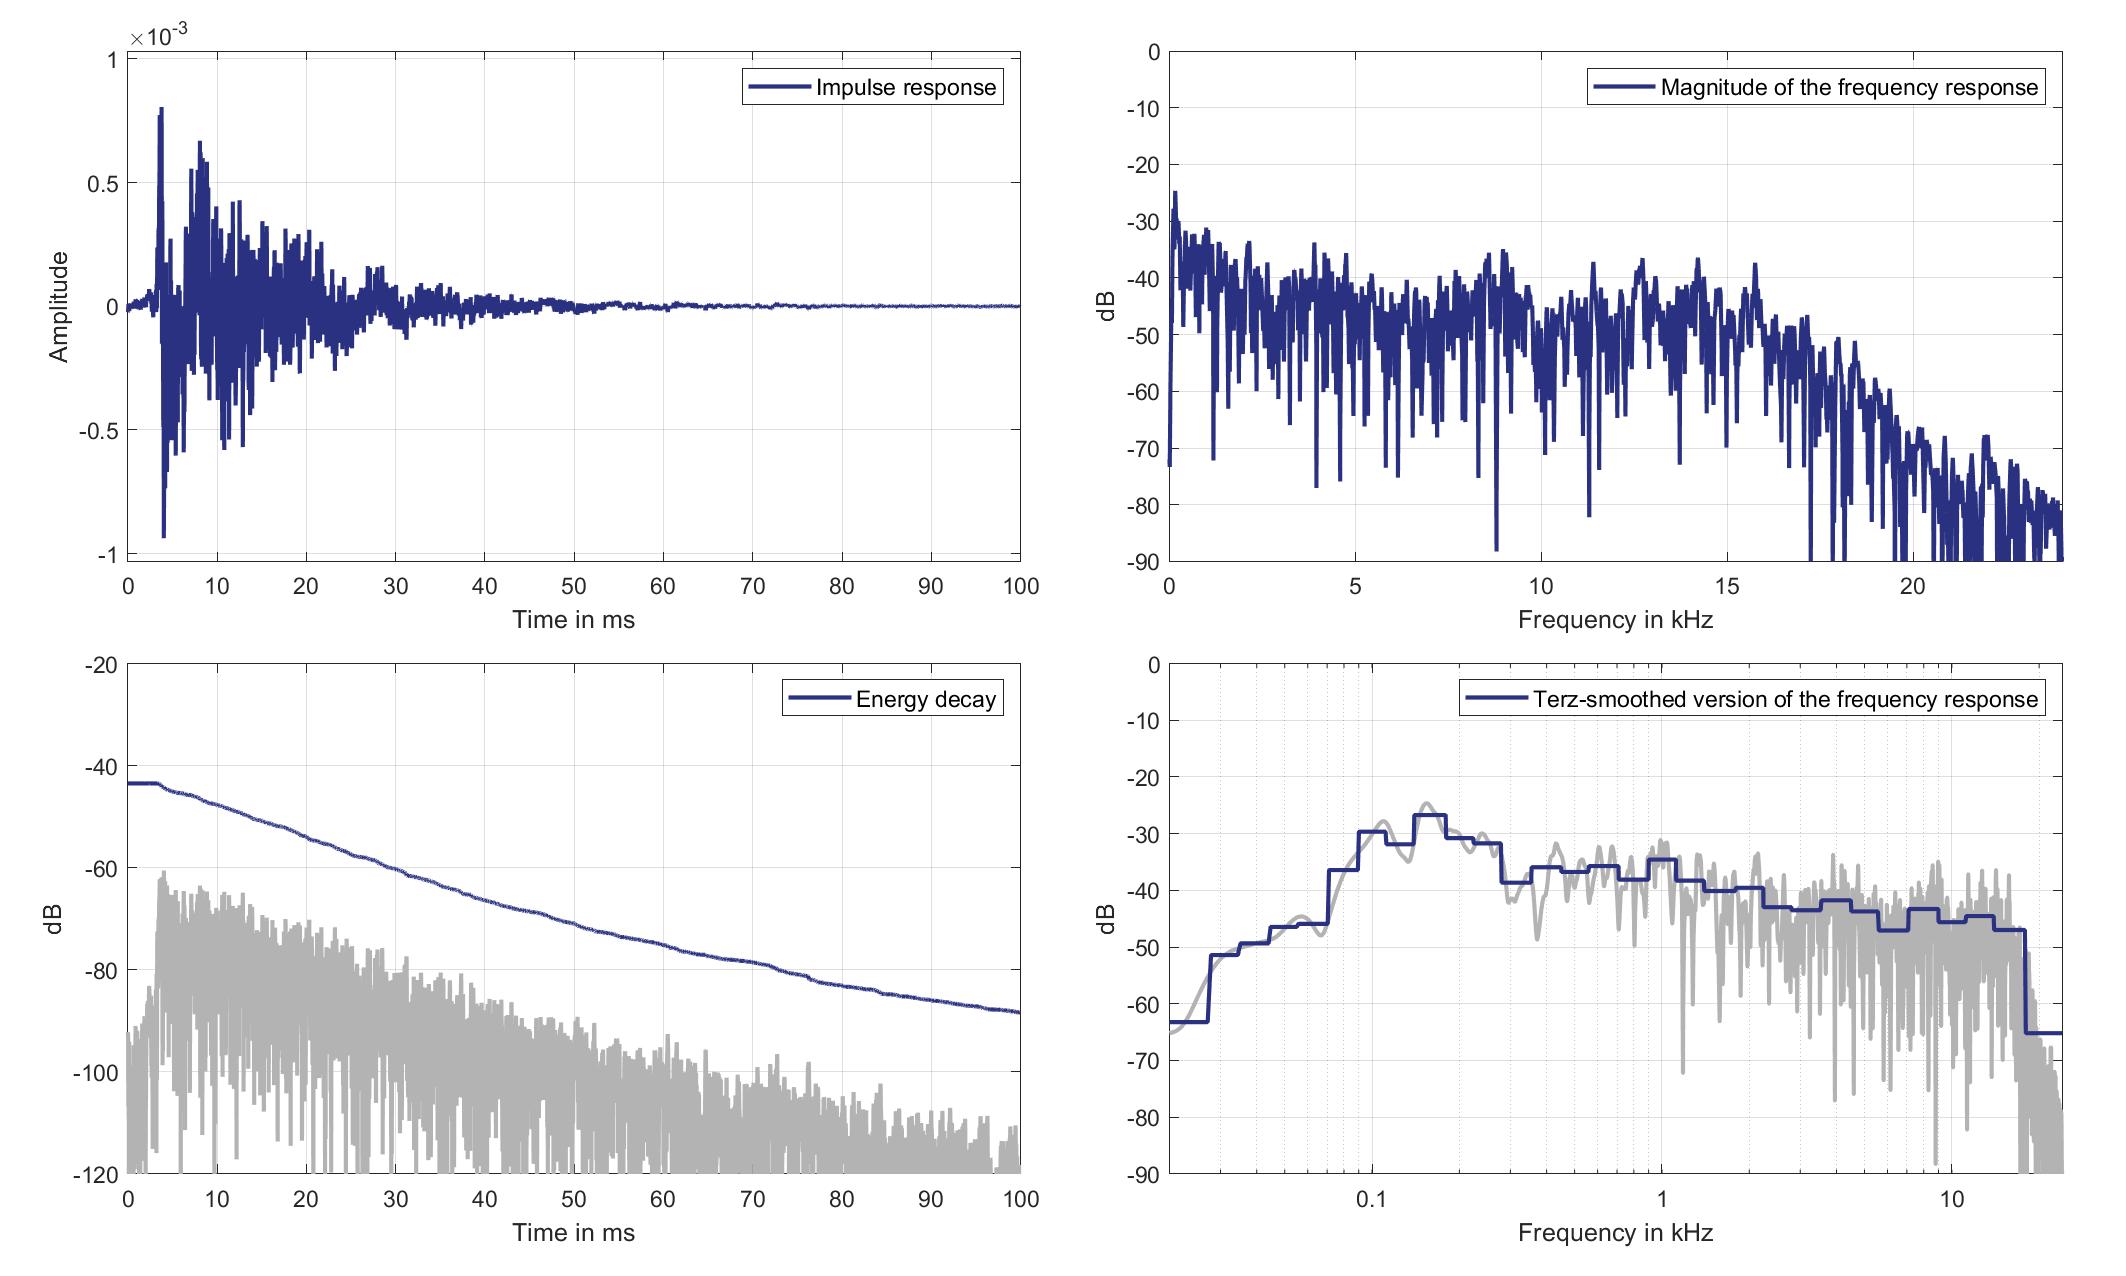
Download impulse response (in ".fir" format).
In the download section you can download all impulse response files as well as format explanation and Matlab as well as Python code examples for loading fir files.
Right Ear Microphone
Mouth Loudspeaker of Zone 1 (Lsp. 12) to Right Ear Microphone of Zone 3 (Mic. 24)
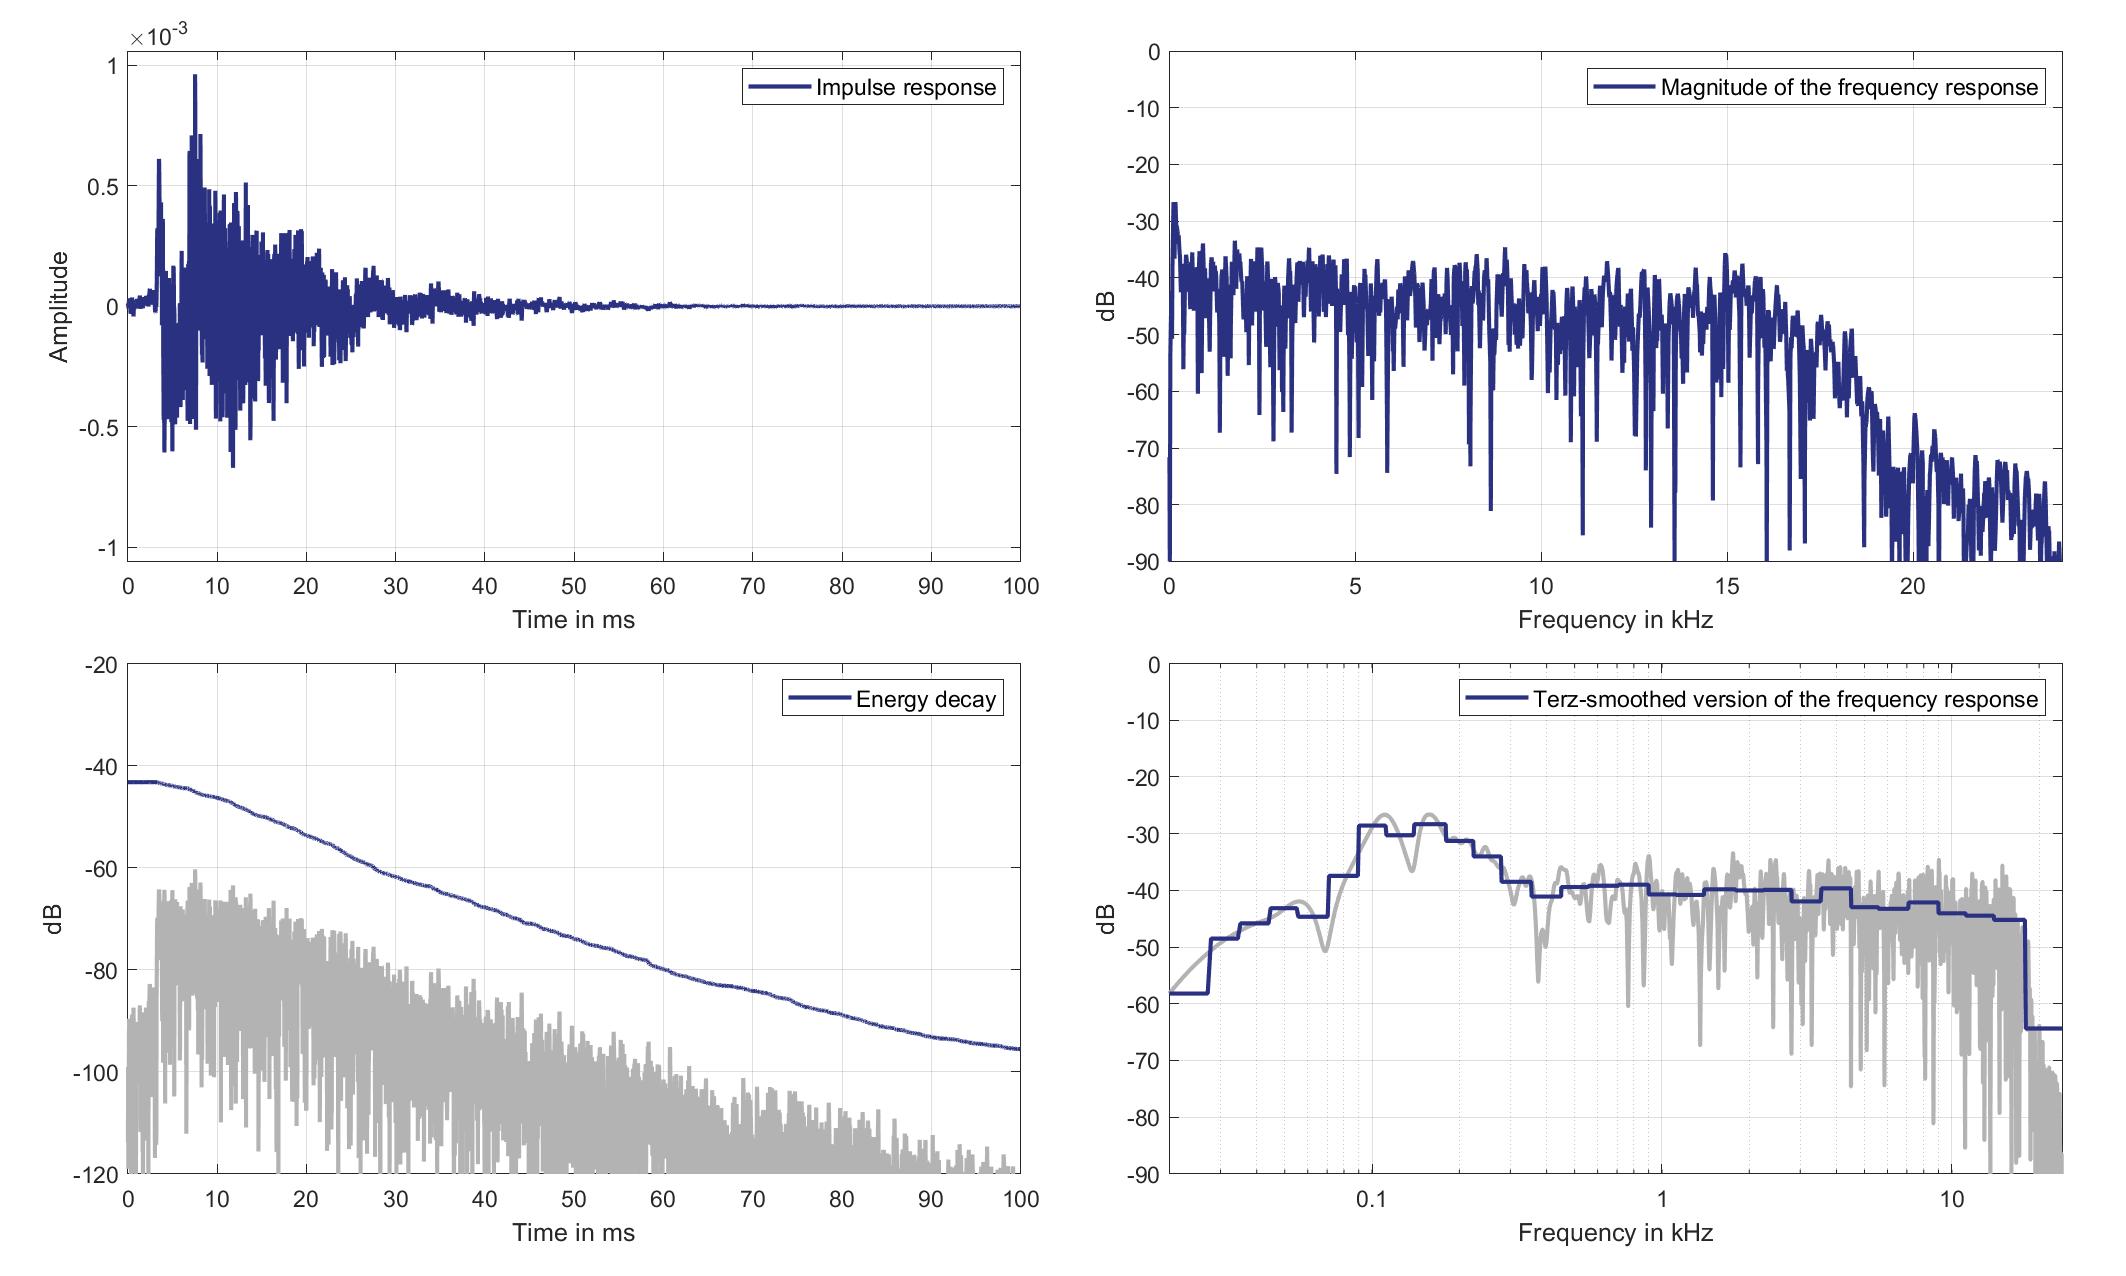
Download impulse response (in ".fir" format).
In the download section you can download all impulse response files as well as format explanation and Matlab as well as Python code examples for loading fir files.
Mics. 25/26
Left Ear Microphone
Mouth Loudspeaker of Zone 1 (Lsp. 12) to Left Ear Microphone of Zone 5 (Mic. 25)
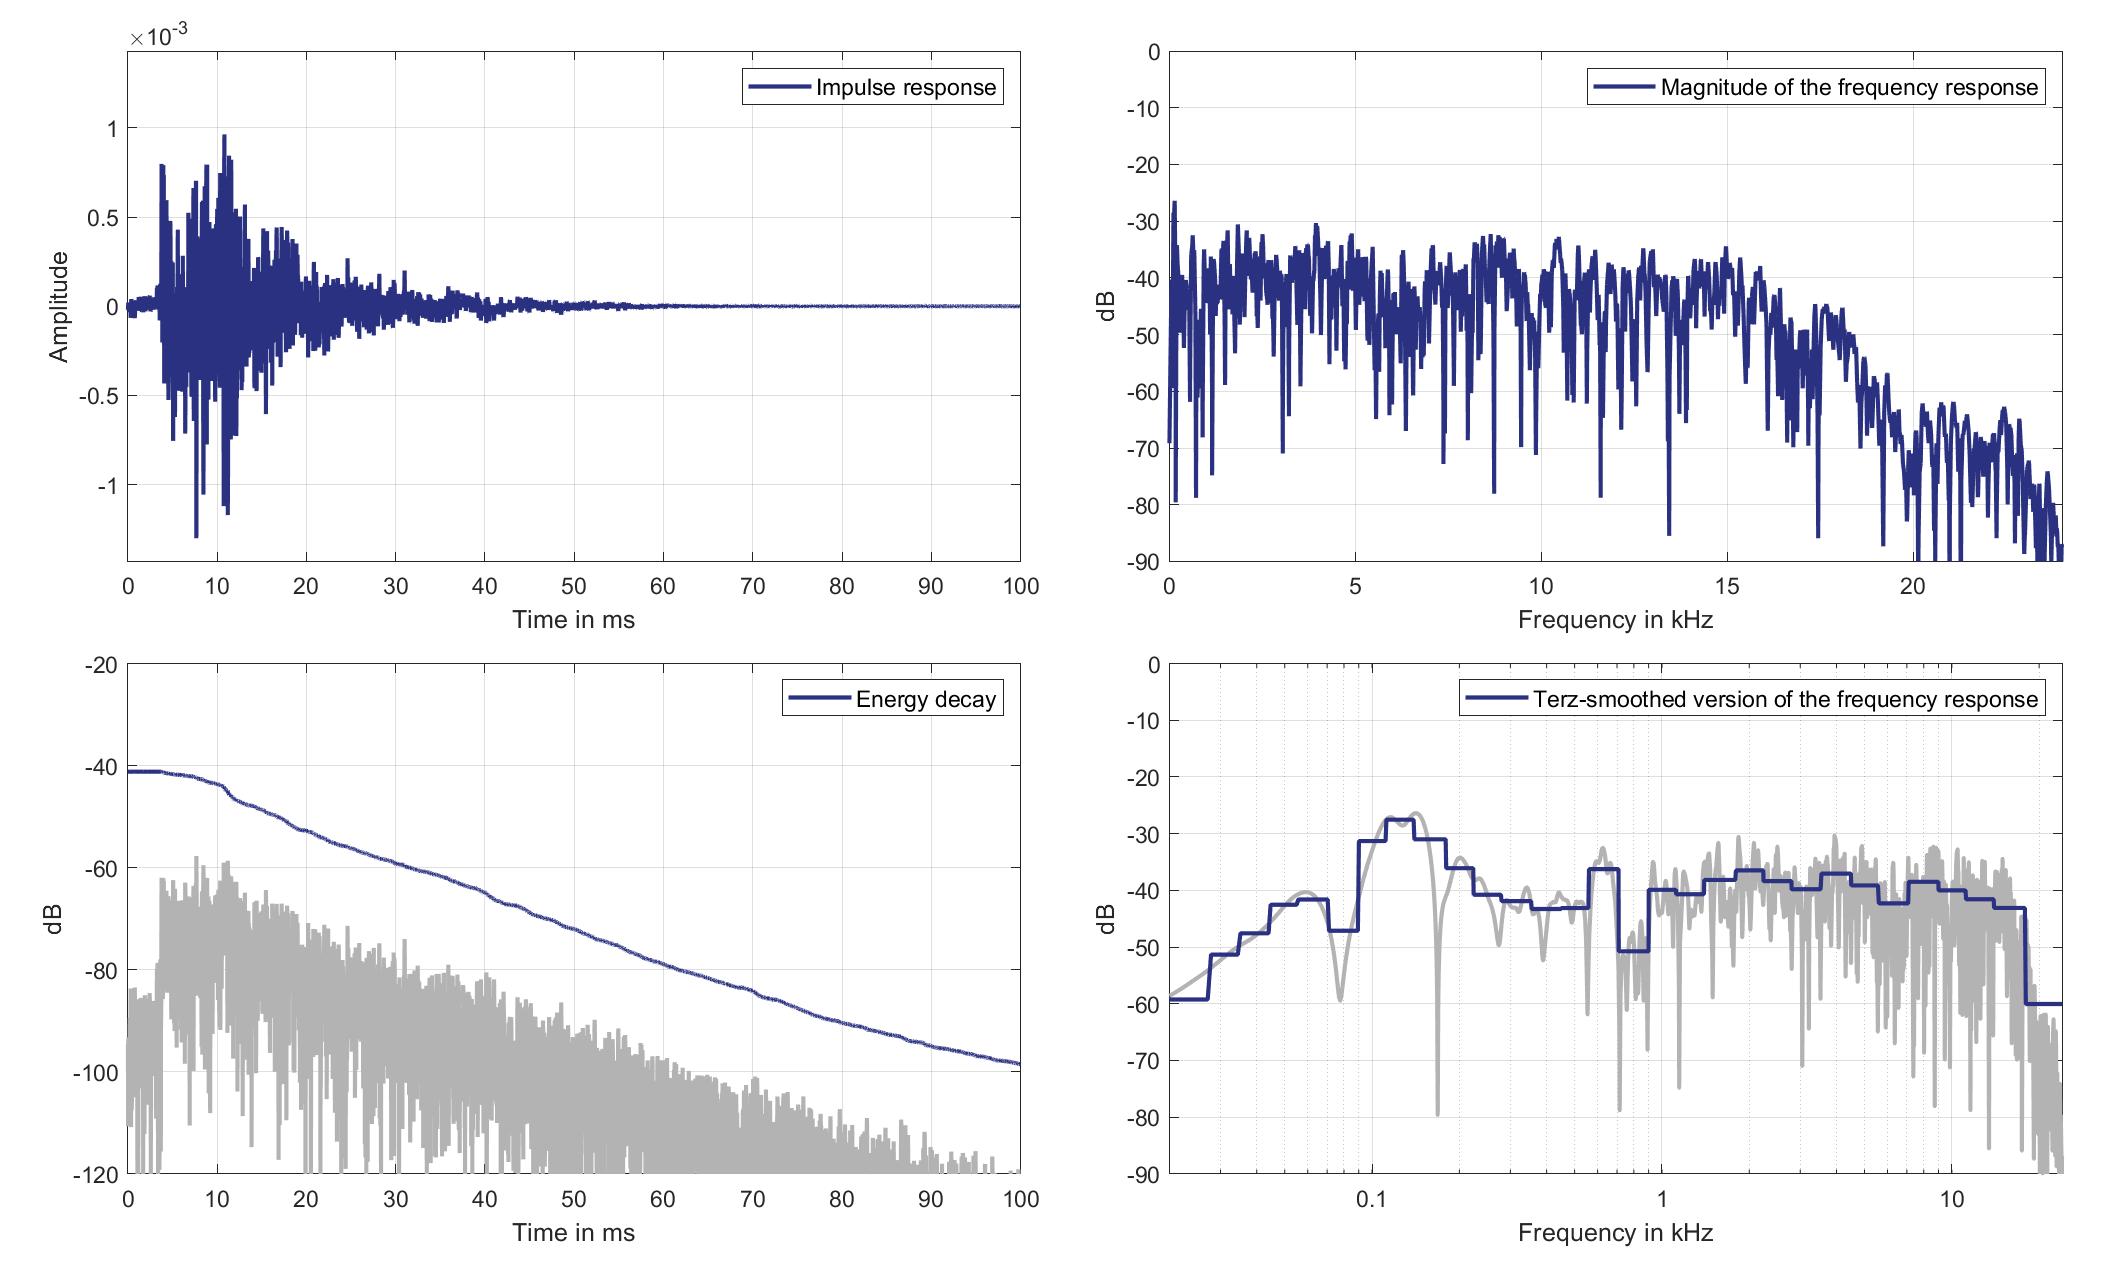
Download impulse response (in ".fir" format).
In the download section you can download all impulse response files as well as format explanation and Matlab as well as Python code examples for loading fir files.
Right Ear Microphone
Mouth Loudspeaker of Zone 1 (Lsp. 12) to Right Ear Microphone of Zone 5 (Mic. 26)
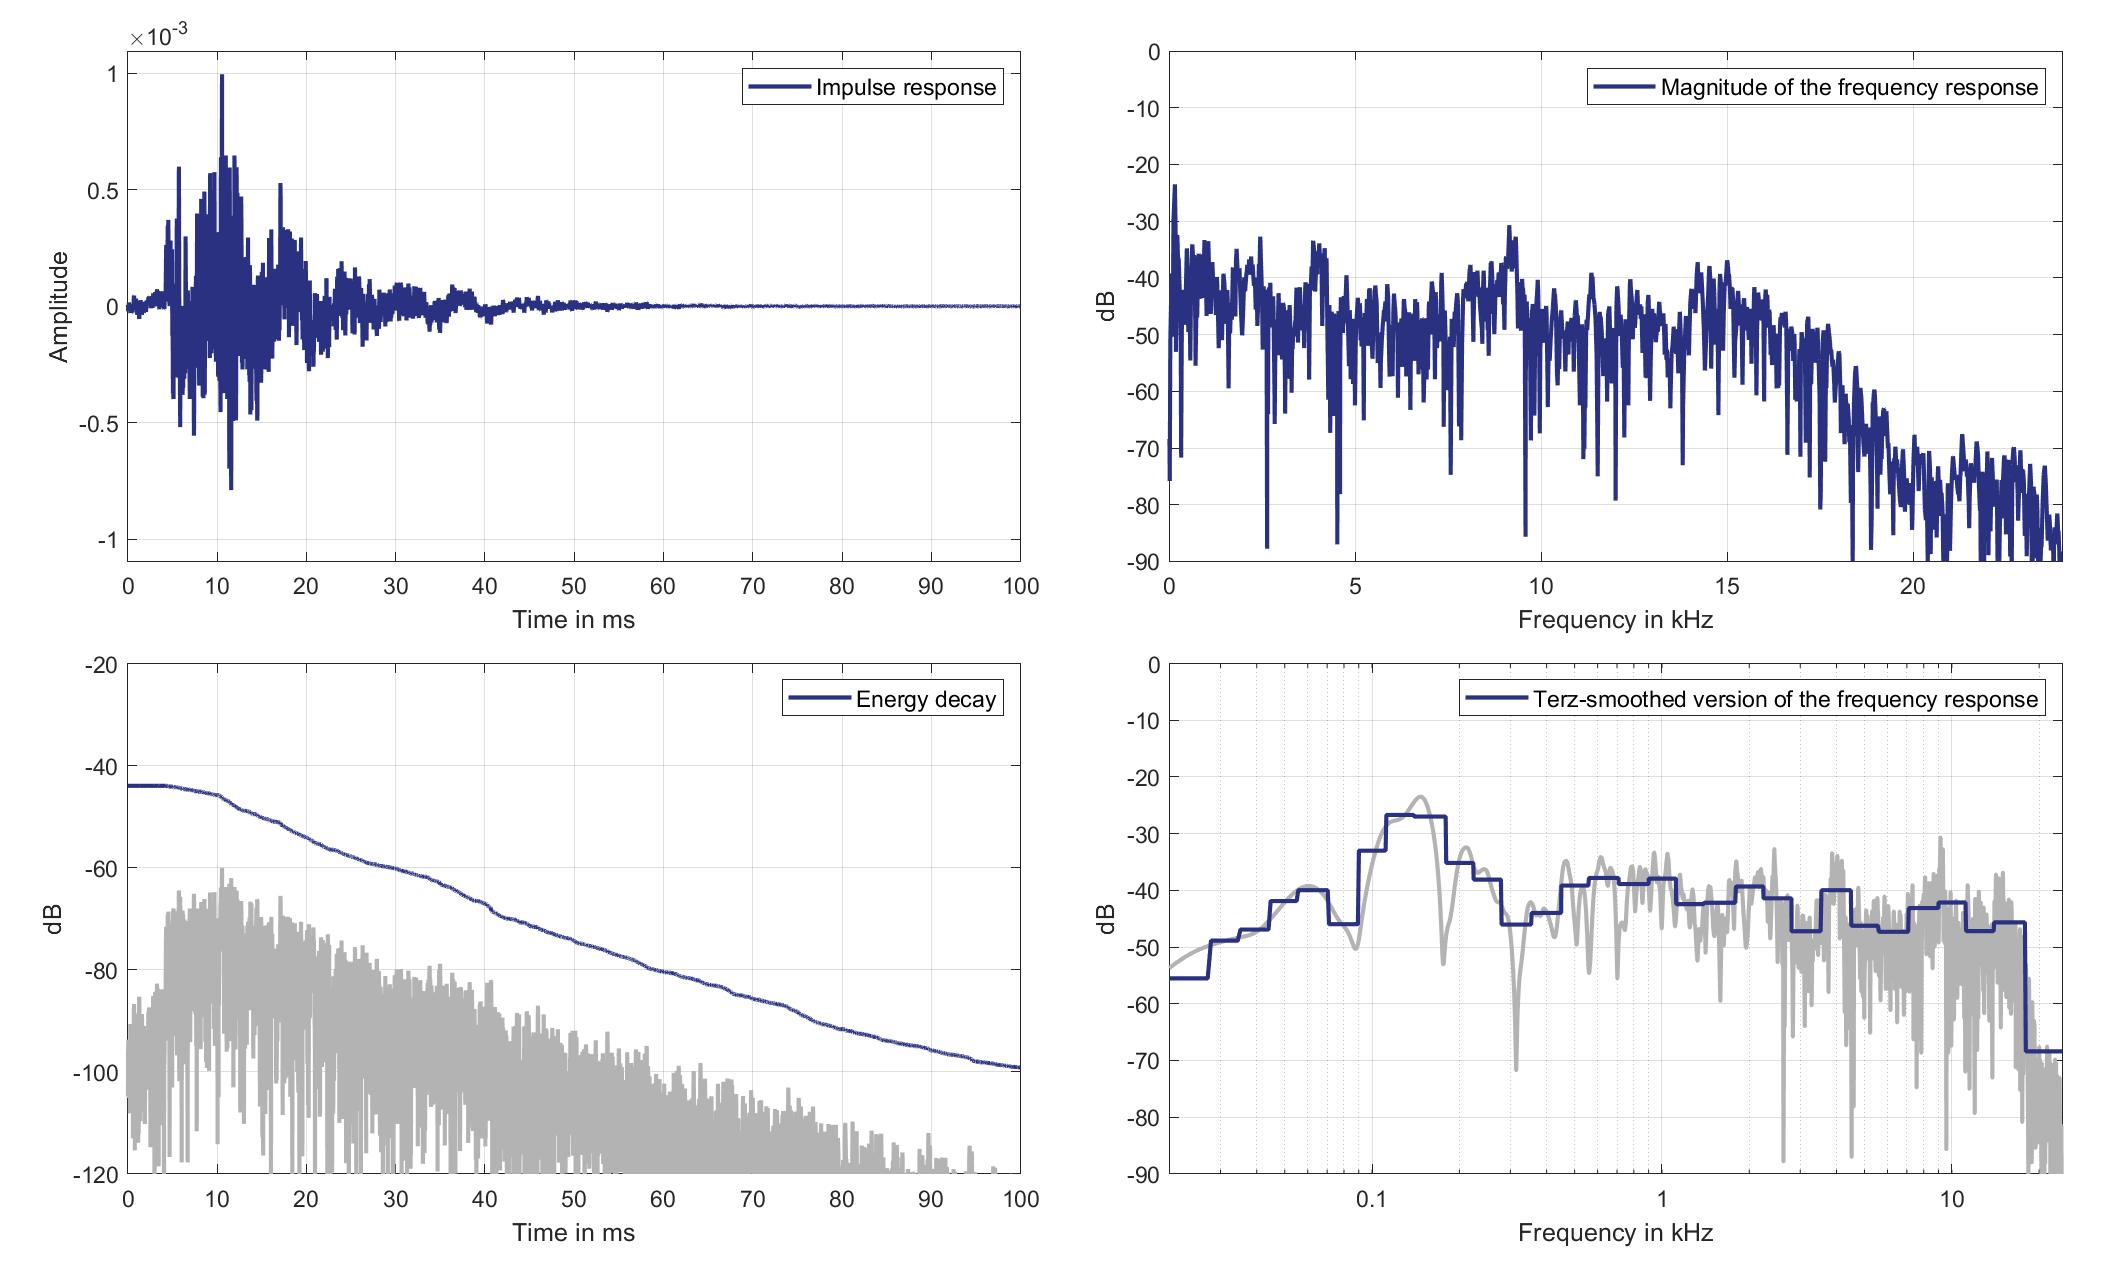
Download impulse response (in ".fir" format).
In the download section you can download all impulse response files as well as format explanation and Matlab as well as Python code examples for loading fir files.
Mics. 27/28
Left Ear Microphone
Mouth Loudspeaker of Zone 1 (Lsp. 12) to Left Ear Microphone of Zone 6 (Mic. 27)
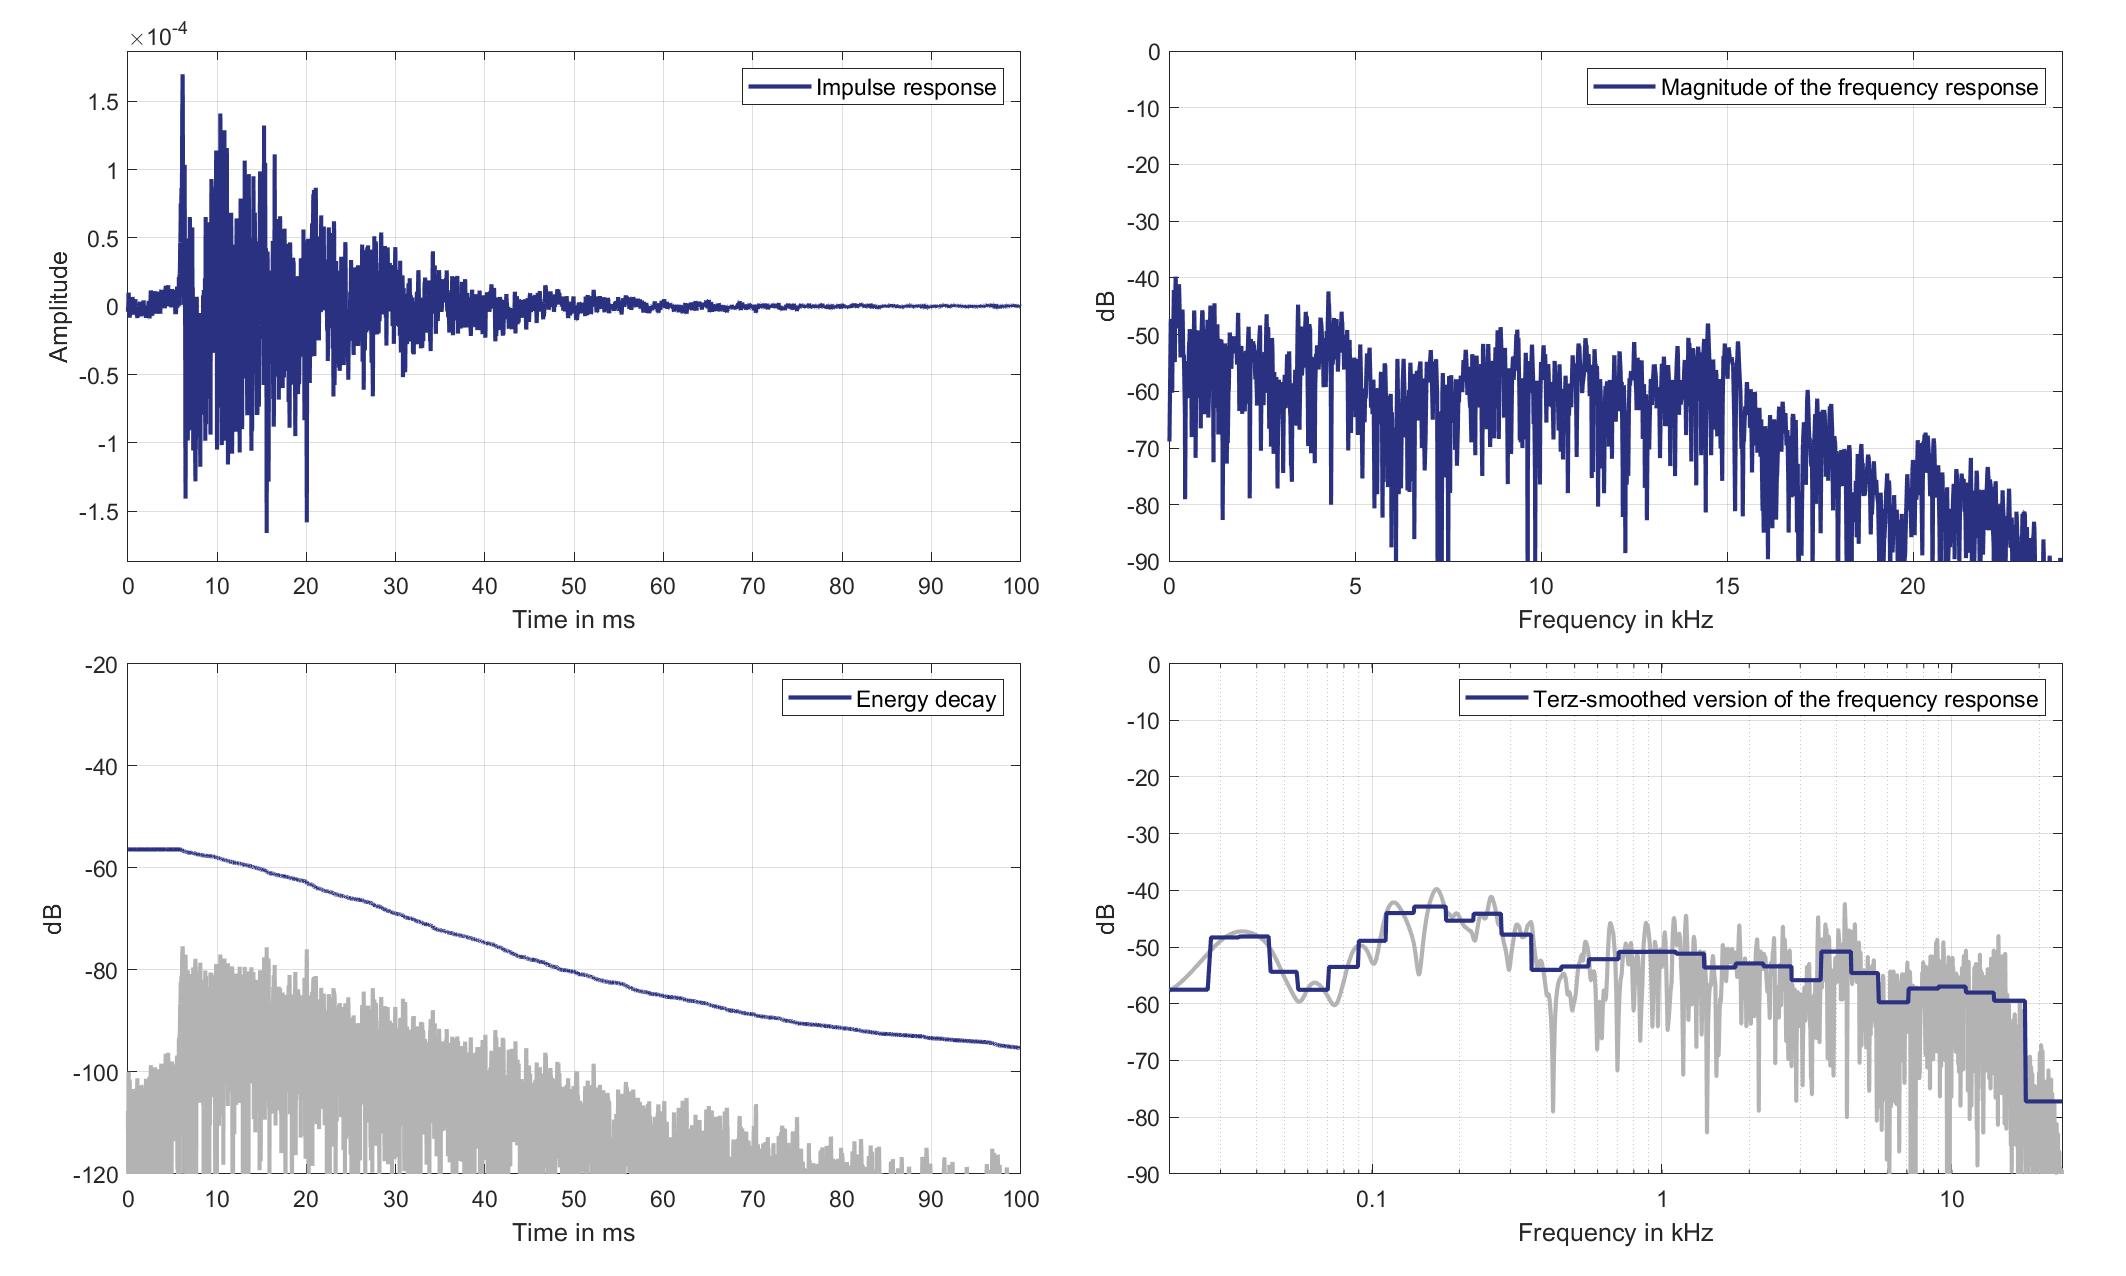
Download impulse response (in ".fir" format).
In the download section you can download all impulse response files as well as format explanation and Matlab as well as Python code examples for loading fir files.
Right Ear Microphone
Mouth Loudspeaker of Zone 1 (Lsp. 12) to Right Ear Microphone of Zone 6 (Mic. 28)
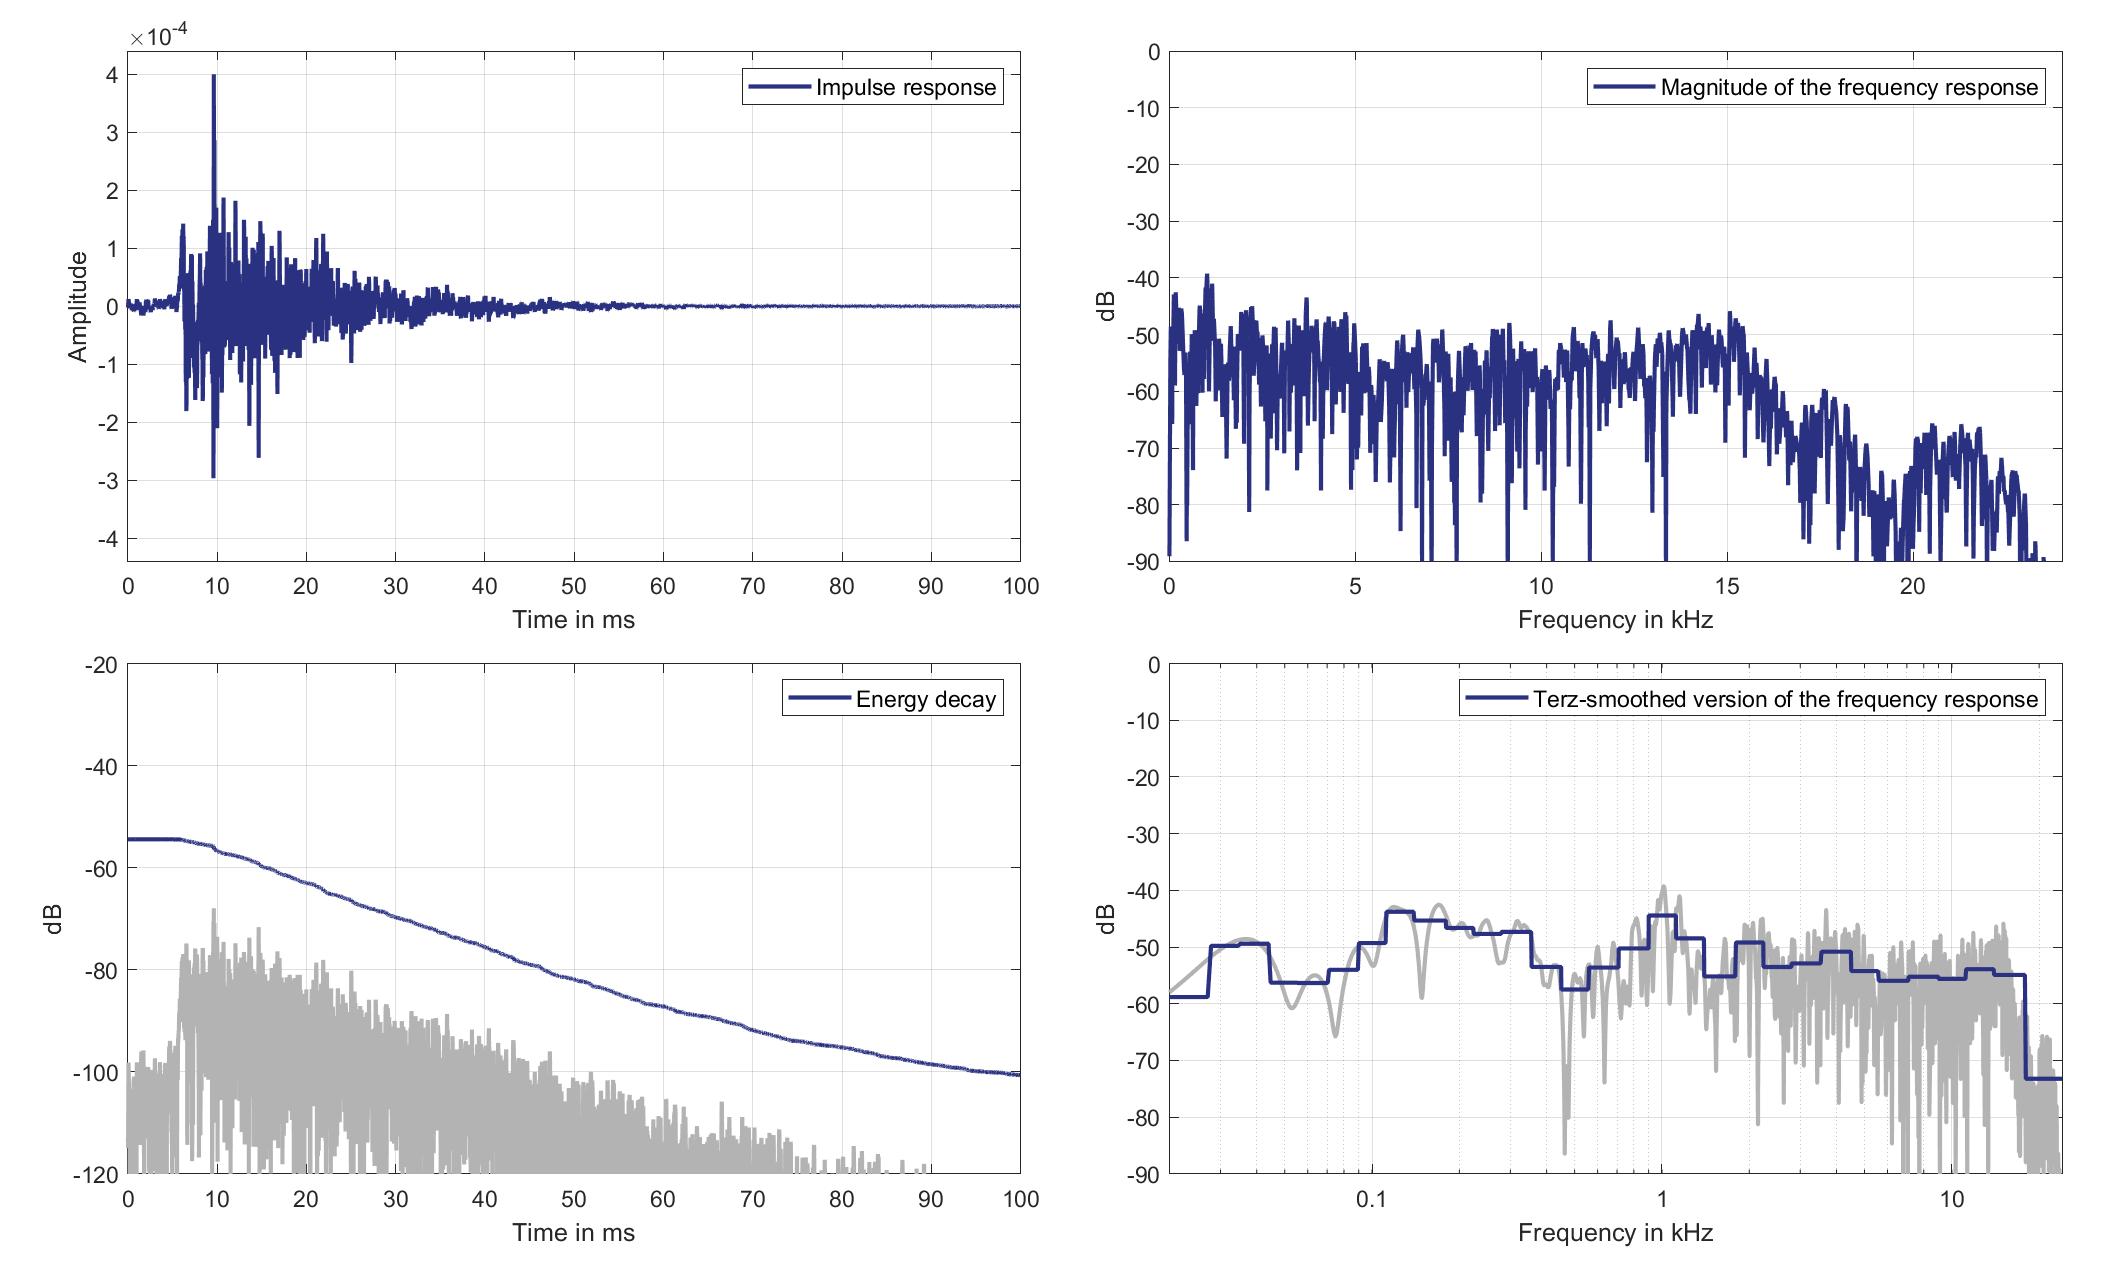
Download impulse response (in ".fir" format).
In the download section you can download all impulse response files as well as format explanation and Matlab as well as Python code examples for loading fir files.
Mics. 29/30
Left Ear Microphone
Mouth Loudspeaker of Zone 1 (Lsp. 12) to Left Ear Microphone of Zone 8 (Mic. 29)

Download impulse response (in ".fir" format).
In the download section you can download all impulse response files as well as format explanation and Matlab as well as Python code examples for loading fir files.
Right Ear Microphone
Mouth Loudspeaker of Zone 1 (Lsp. 12) to Right Ear Microphone of Zone 8 (Mic. 30)
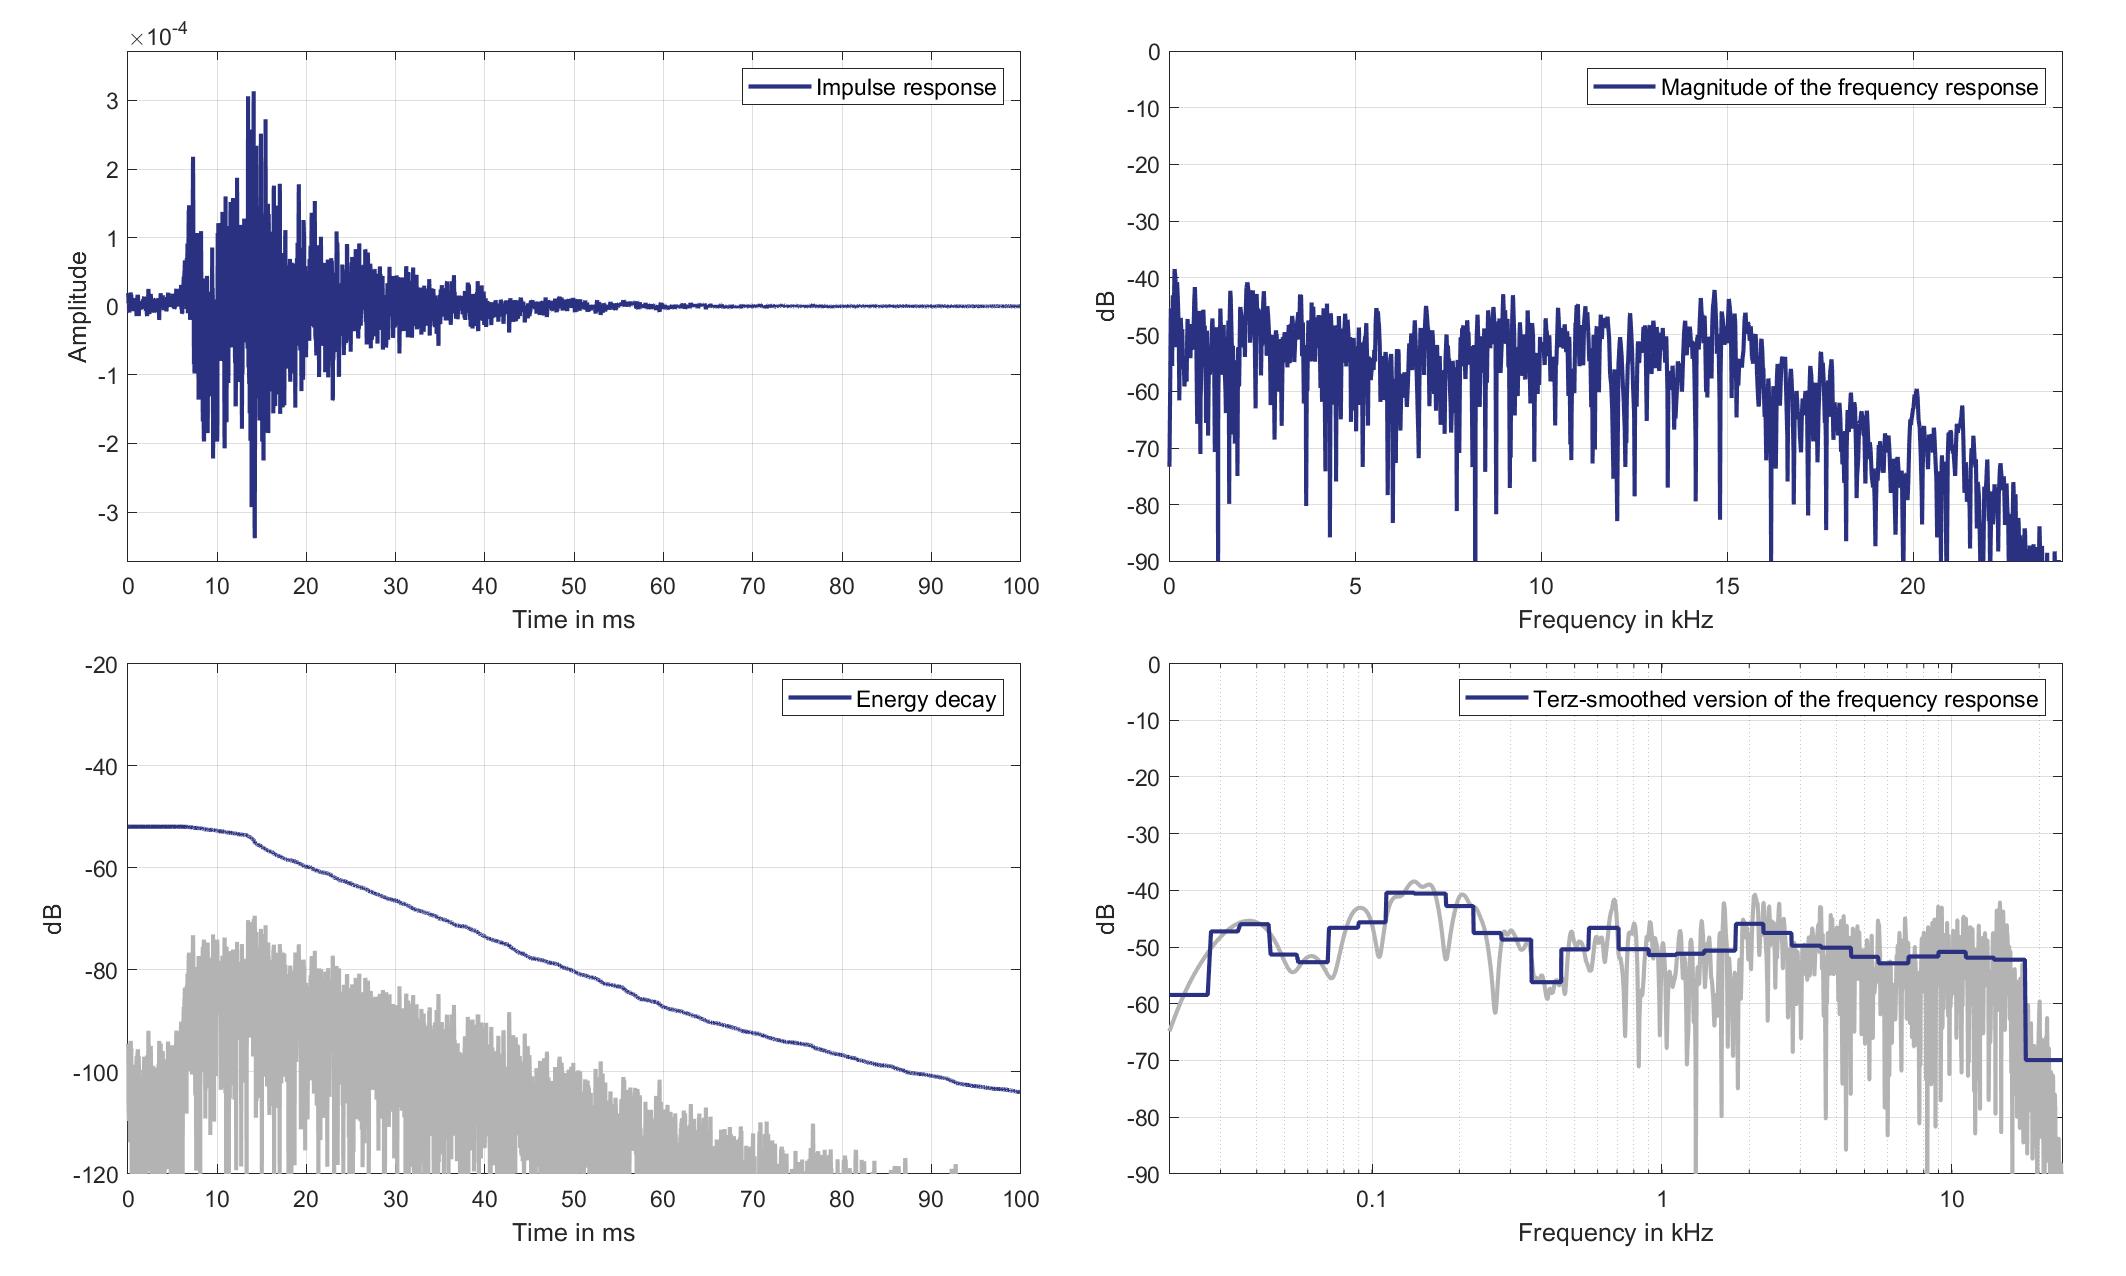
Download impulse response (in ".fir" format).
In the download section you can download all impulse response files as well as format explanation and Matlab as well as Python code examples for loading fir files.
Lsp. 13
Mics. 19/20
Left Ear Microphone
Mouth Loudspeaker of Zone 2 (Lsp. 13) to Left Ear Microphone of Zone 1 (Mic. 19)
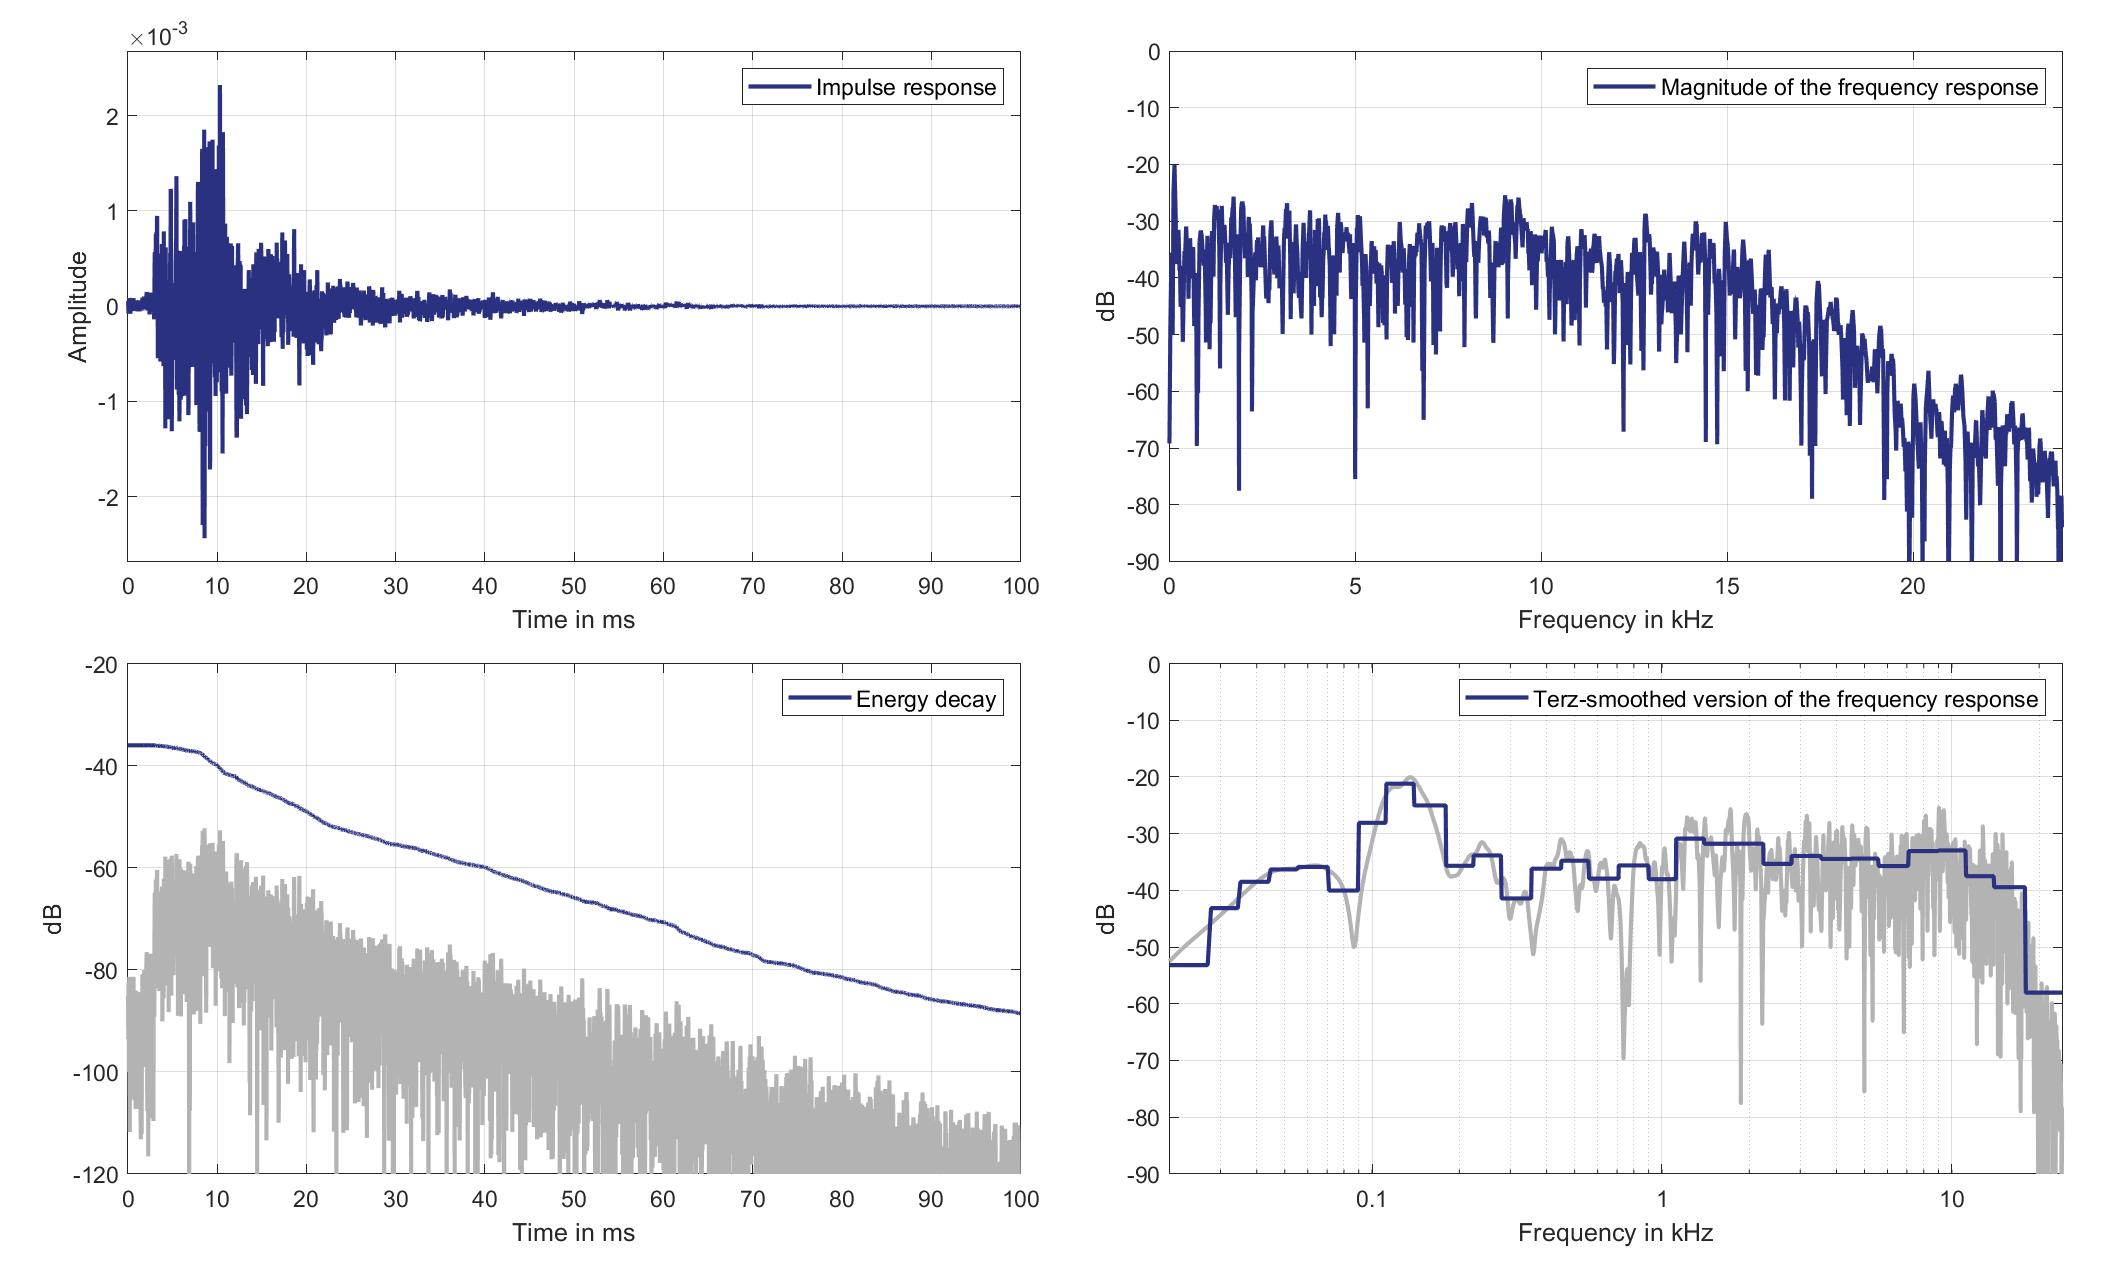
Download impulse response (in ".fir" format).
In the download section you can download all impulse response files as well as format explanation and Matlab as well as Python code examples for loading fir files.
Right Ear Microphone
Mouth Loudspeaker of Zone 2 (Lsp. 13) to Right Ear Microphone of Zone 1 (Mic. 20)
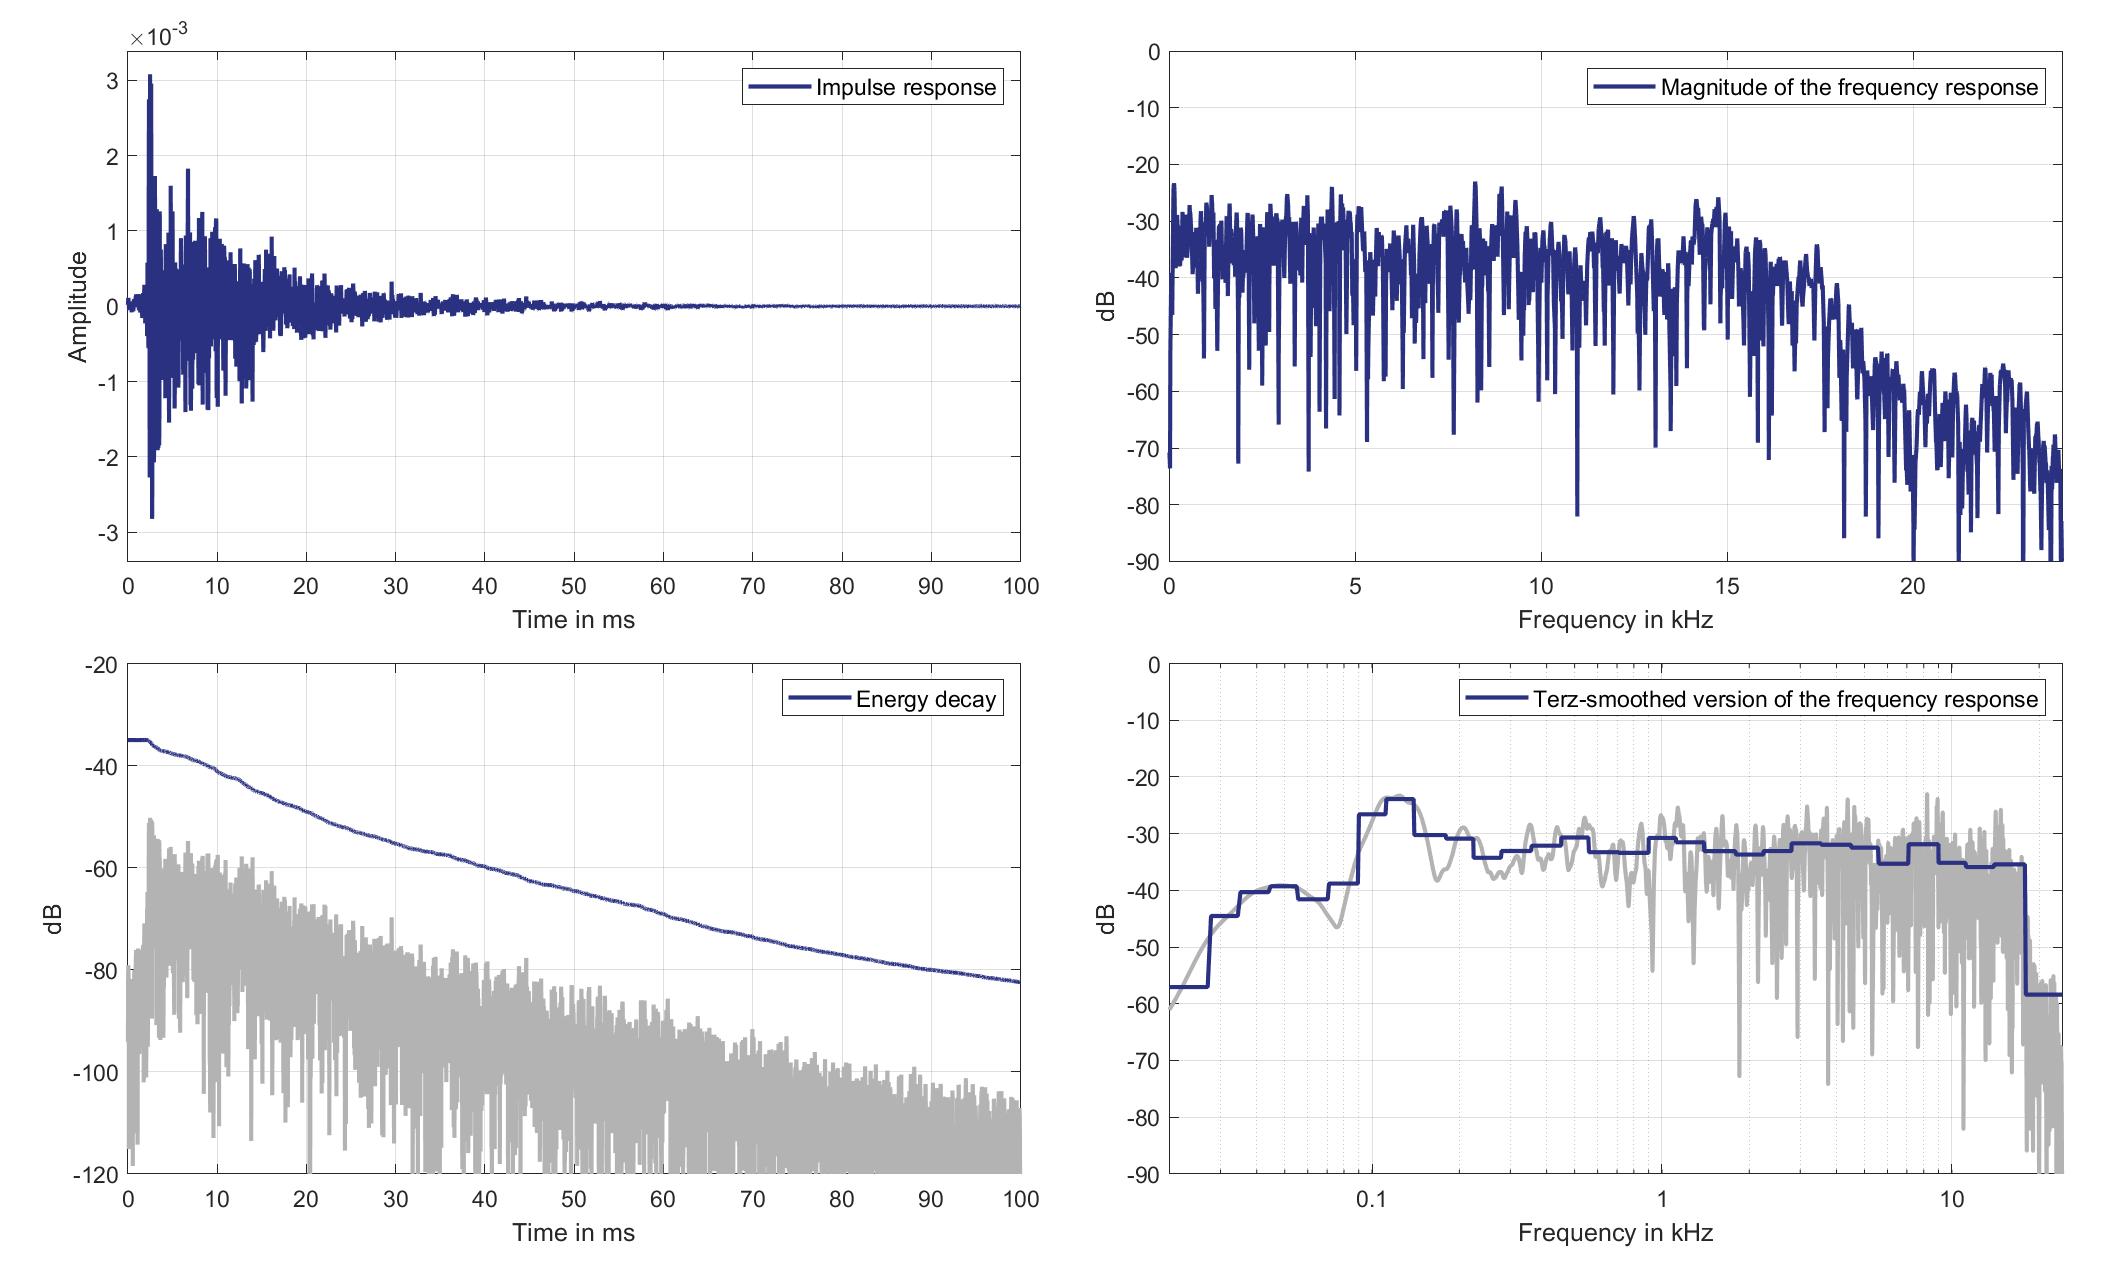
Download impulse response (in ".fir" format).
In the download section you can download all impulse response files as well as format explanation and Matlab as well as Python code examples for loading fir files.
Mics. 21/22
Left Ear Microphone
Mouth Loudspeaker of Zone 2 (Lsp. 13) to Left Ear Microphone of Zone 2 (Mic. 21)
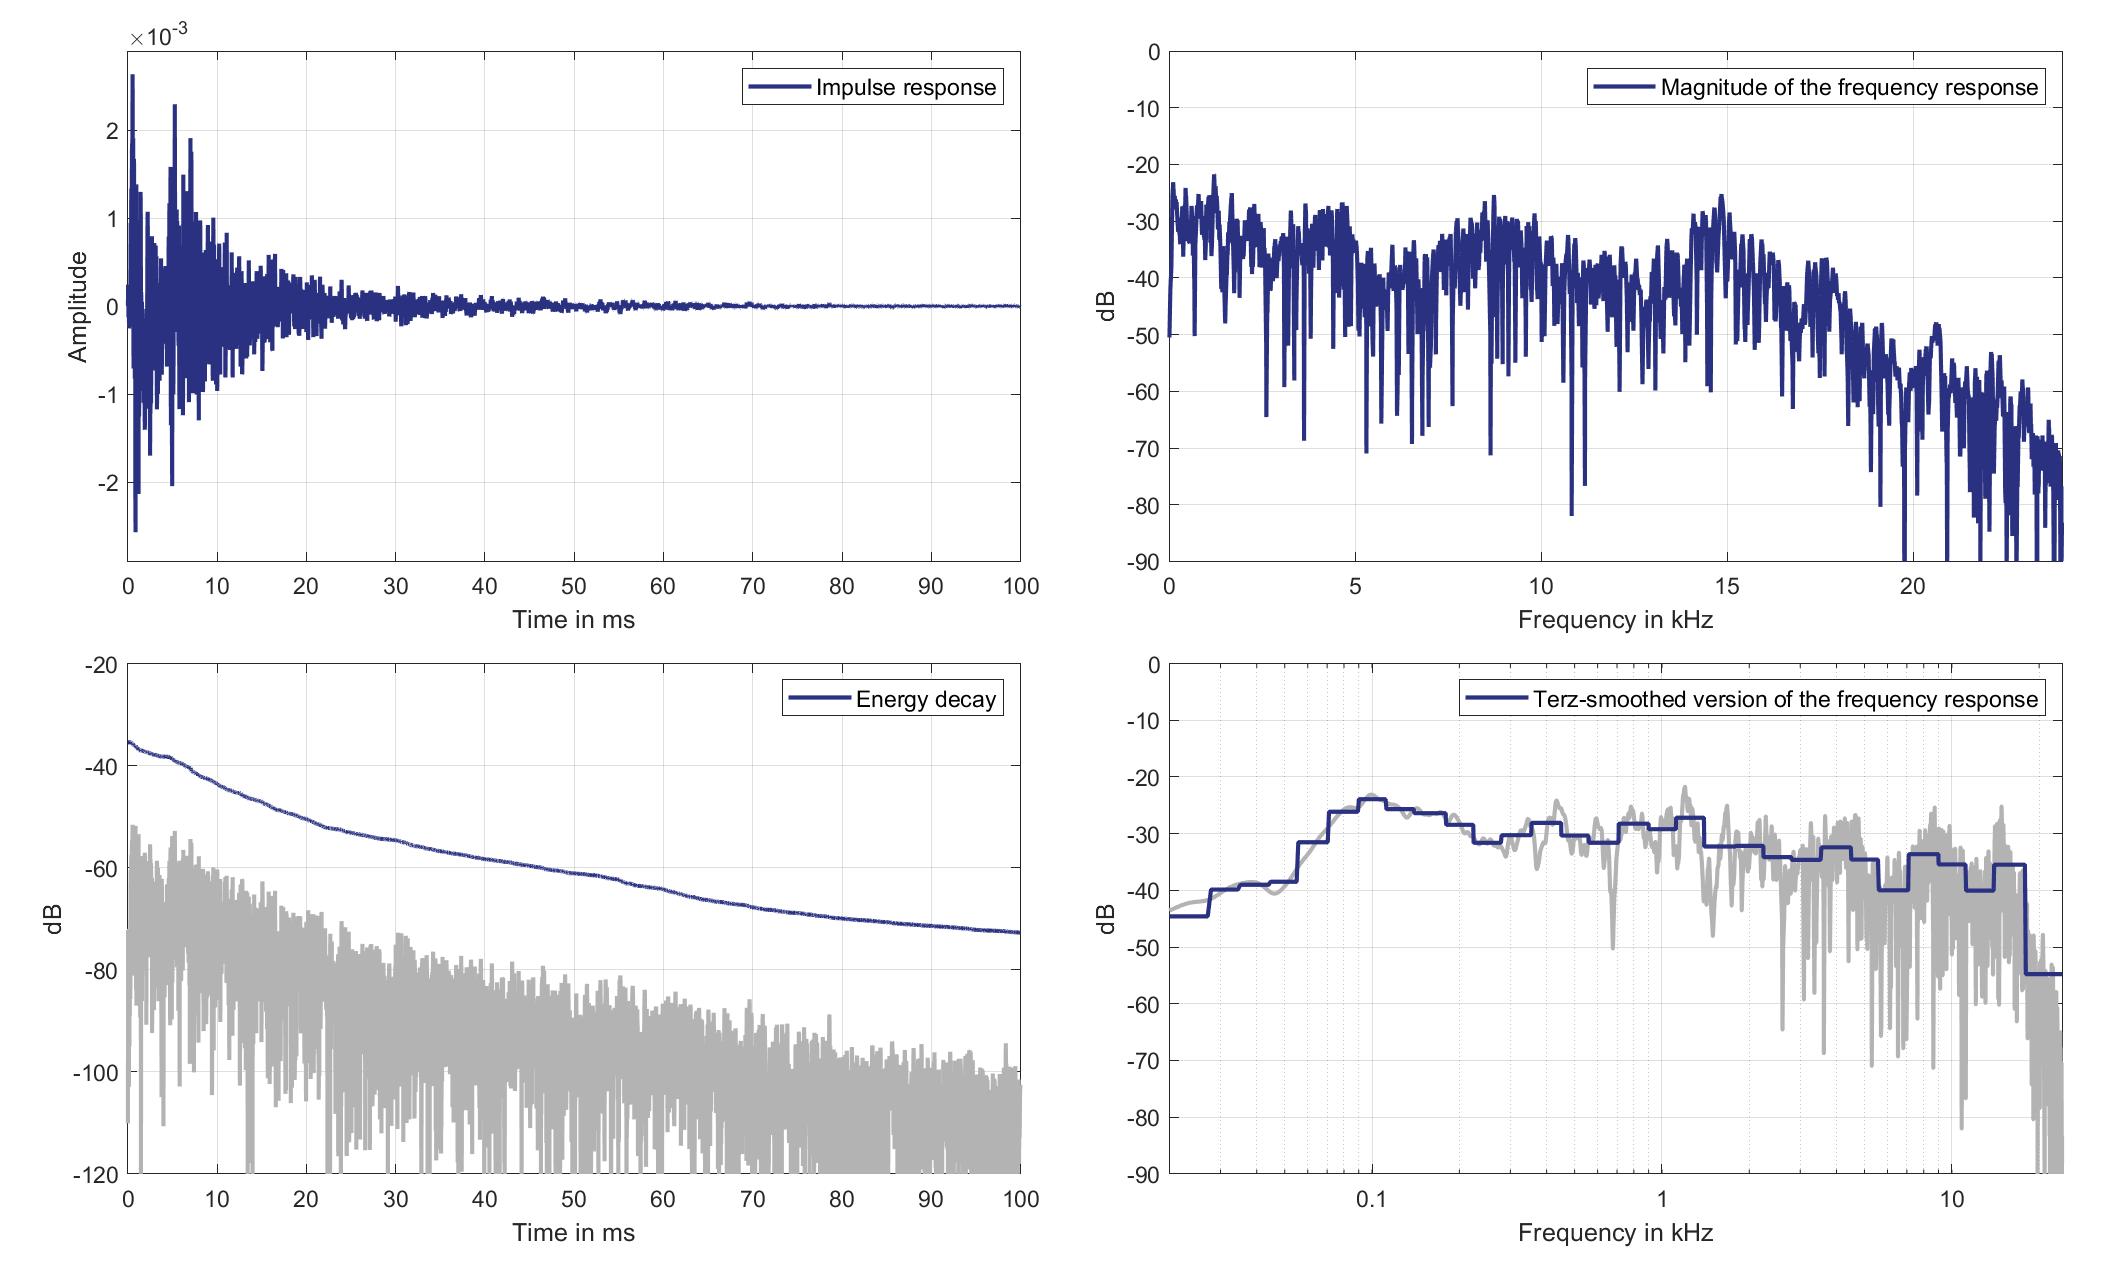
Download impulse response (in ".fir" format).
In the download section you can download all impulse response files as well as format explanation and Matlab as well as Python code examples for loading fir files.
Right Ear Microphone
Mouth Loudspeaker of Zone 2 (Lsp. 13) to Right Ear Microphone of Zone 2 (Mic. 22)
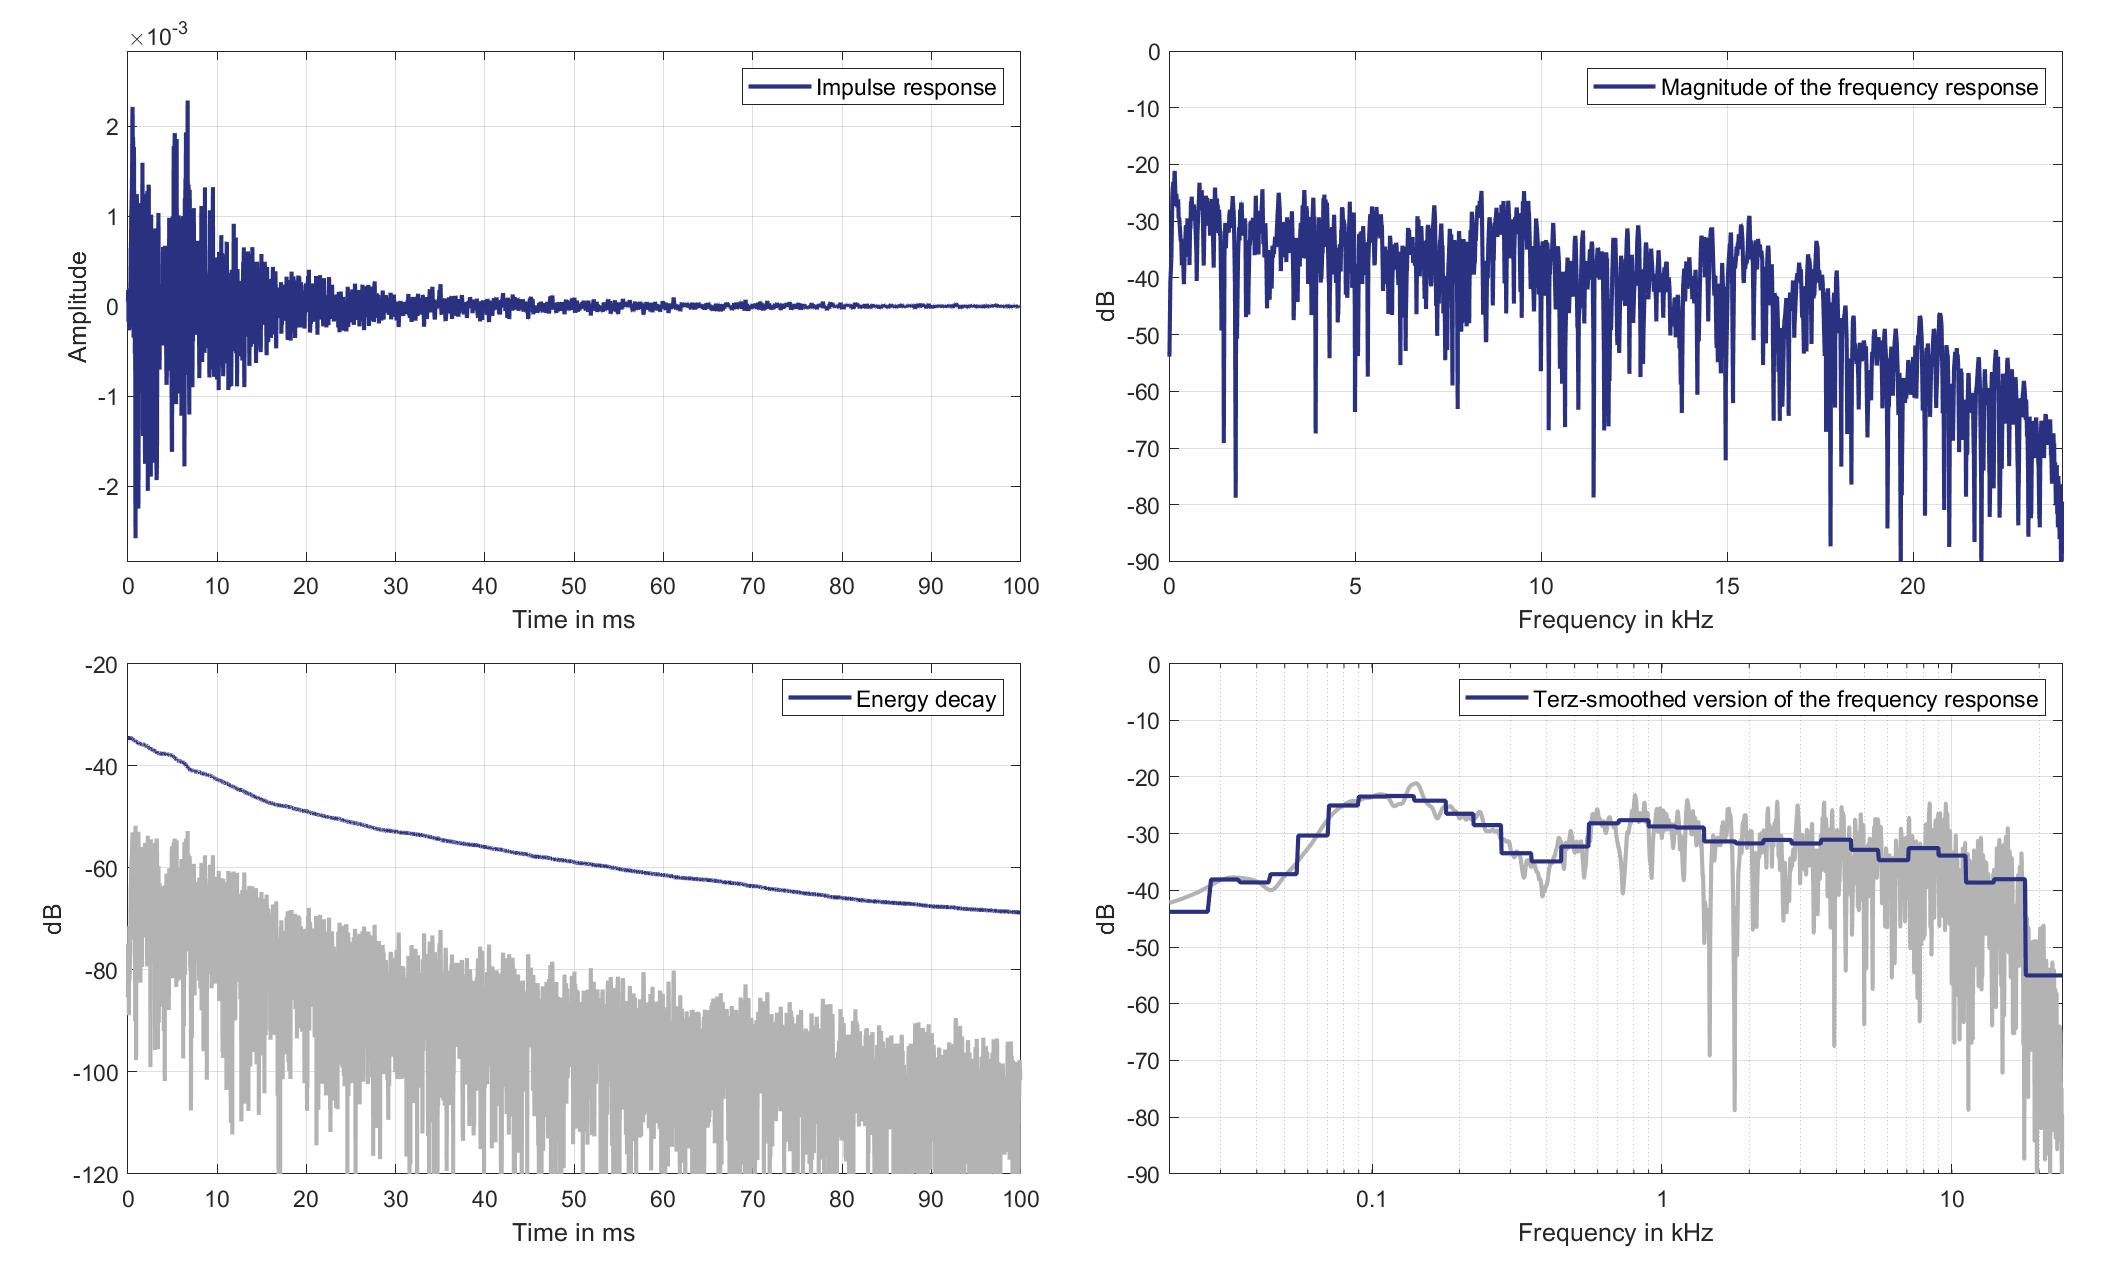
Download impulse response (in ".fir" format).
In the download section you can download all impulse response files as well as format explanation and Matlab as well as Python code examples for loading fir files.
Mics. 23/24
Left Ear Microphone
Mouth Loudspeaker of Zone 2 (Lsp. 13) to Left Ear Microphone of Zone 3 (Mic. 23)
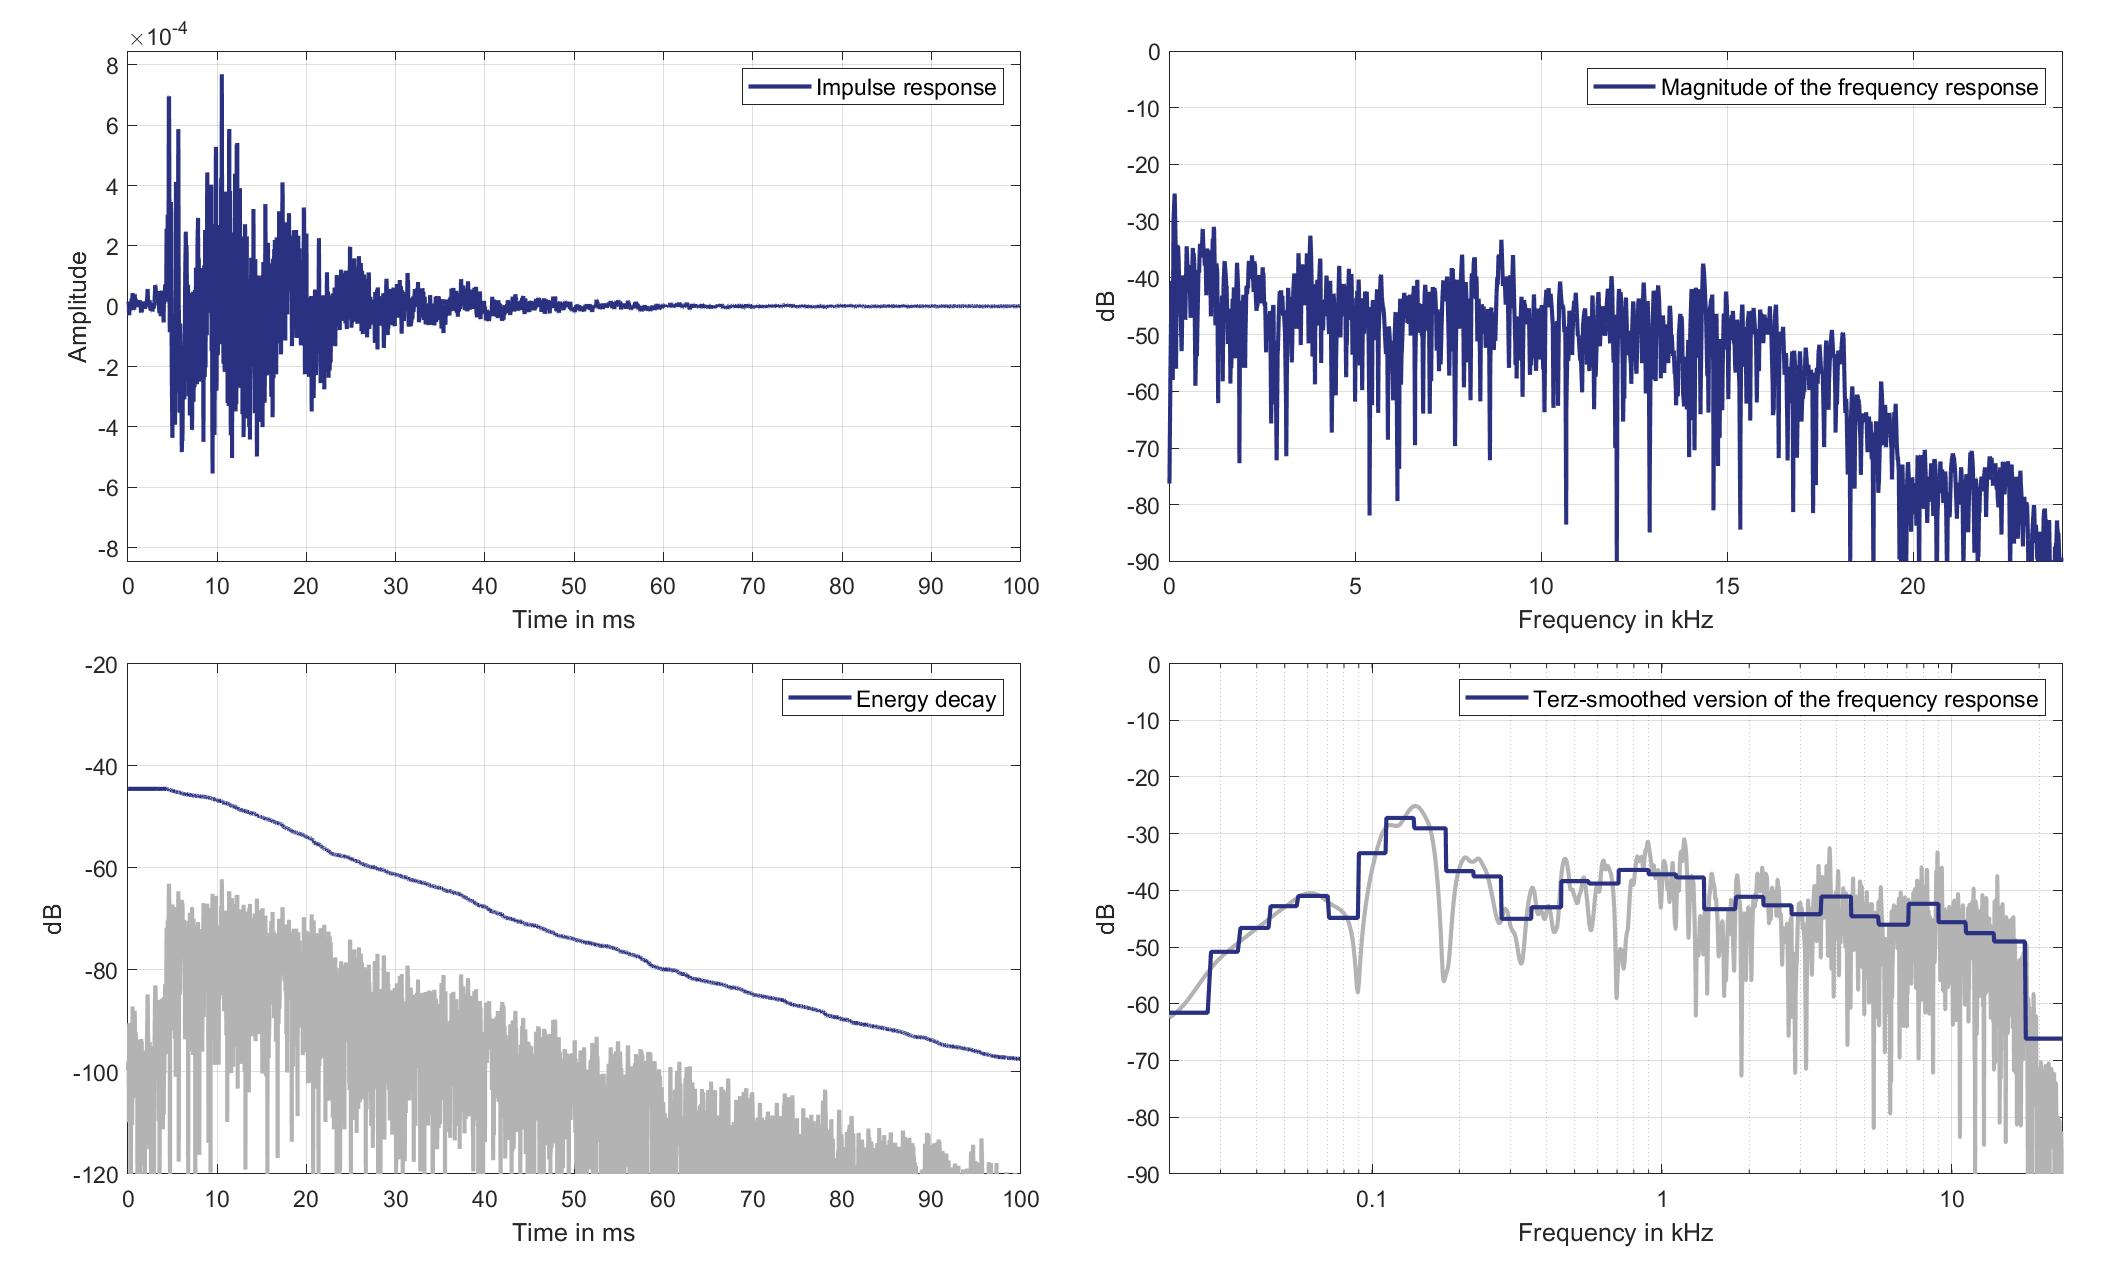
Download impulse response (in ".fir" format).
In the download section you can download all impulse response files as well as format explanation and Matlab as well as Python code examples for loading fir files.
Right Ear Microphone
Mouth Loudspeaker of Zone 2 (Lsp. 13) to Right Ear Microphone of Zone 3 (Mic. 24)
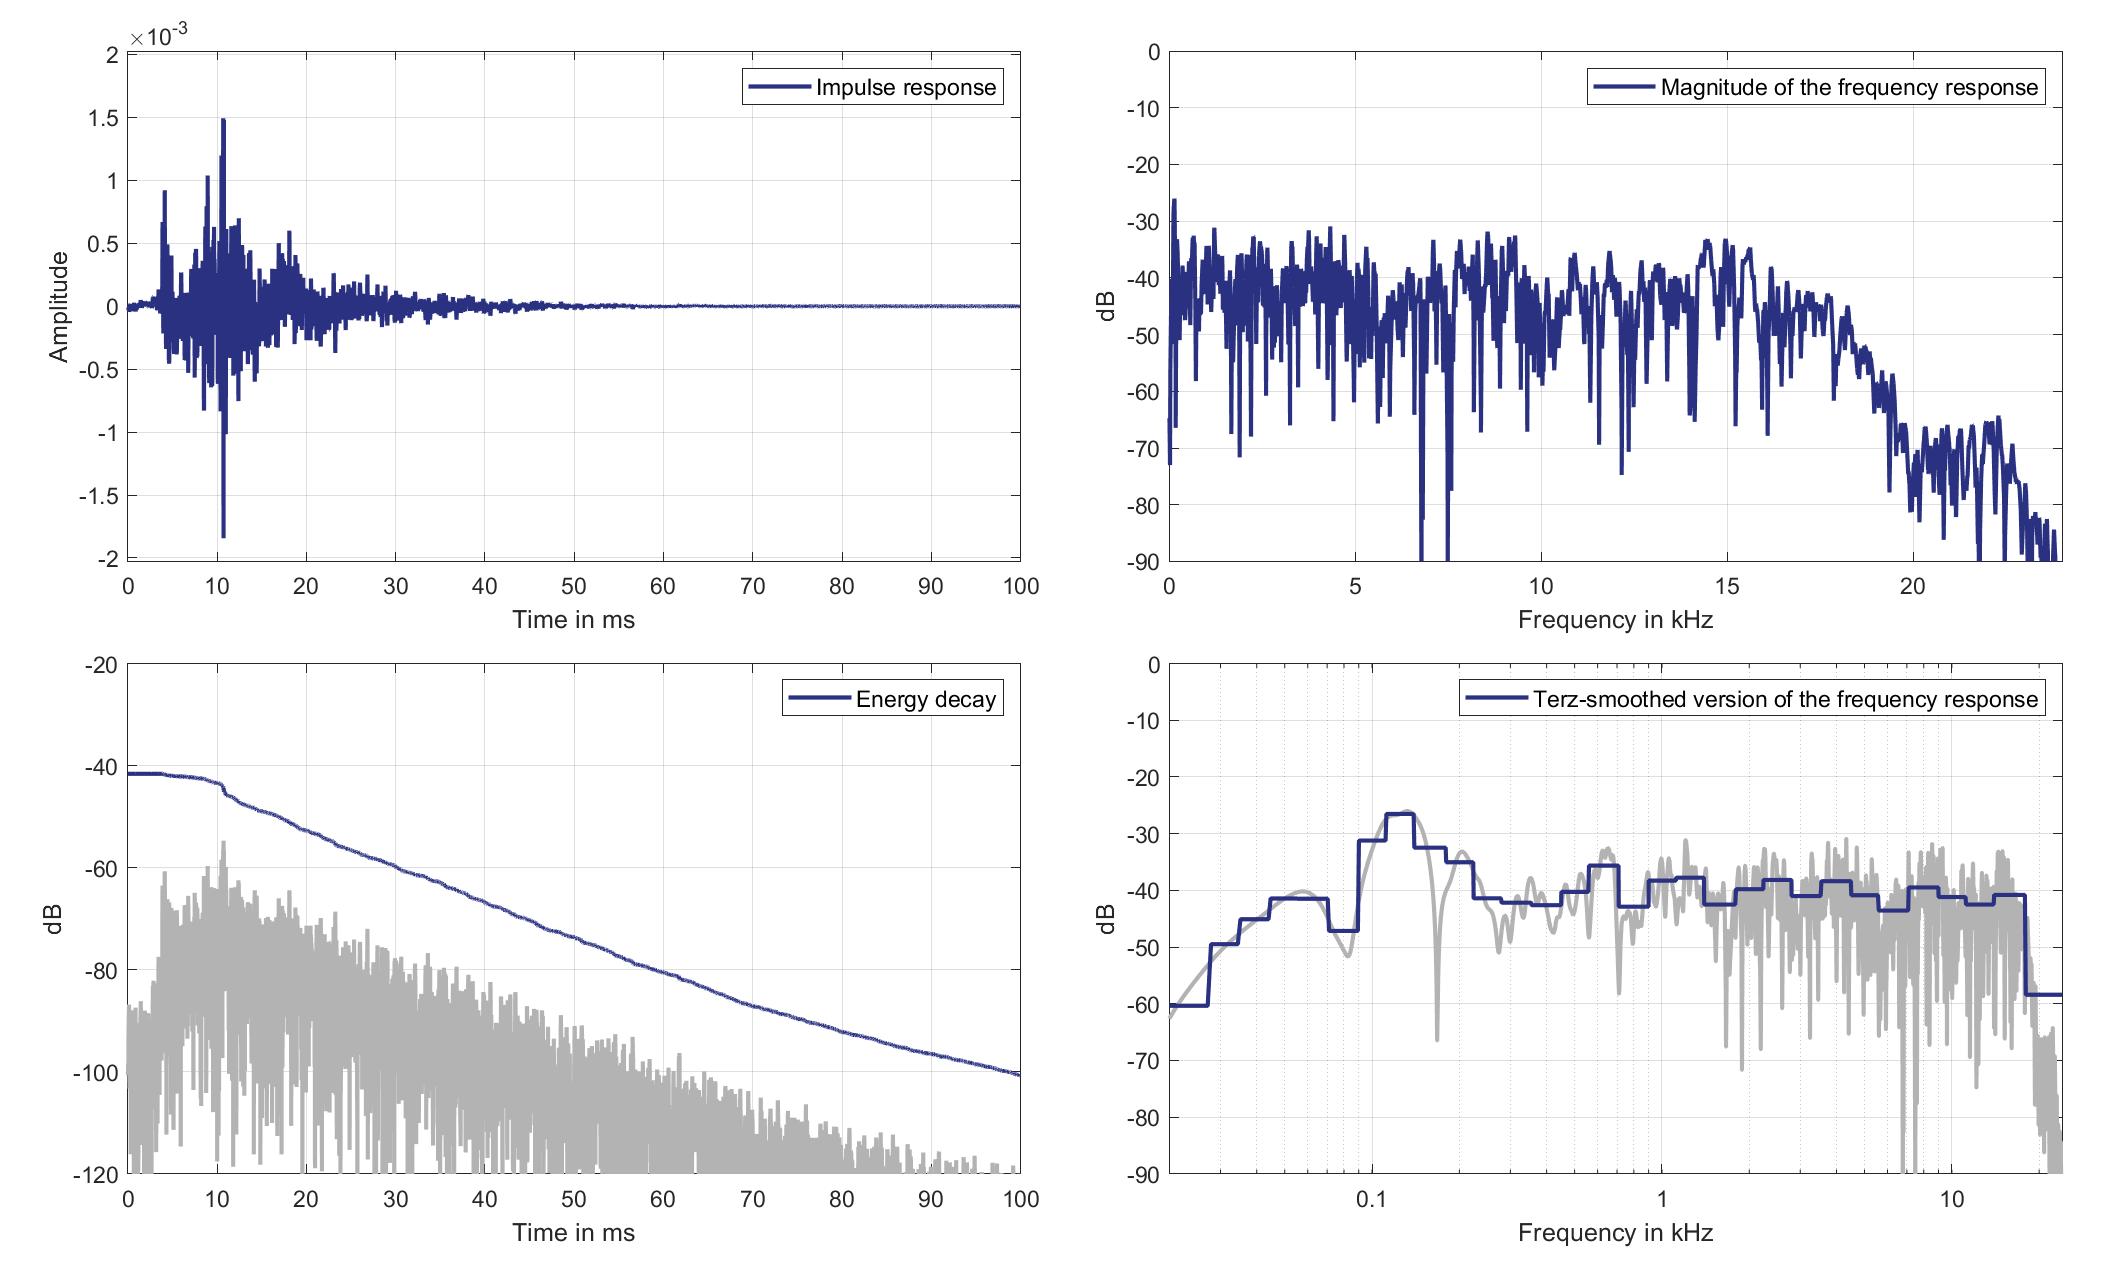
Download impulse response (in ".fir" format).
In the download section you can download all impulse response files as well as format explanation and Matlab as well as Python code examples for loading fir files.
Mics. 25/26
Left Ear Microphone
Mouth Loudspeaker of Zone 2 (Lsp. 13) to Left Ear Microphone of Zone 5 (Mic. 25)
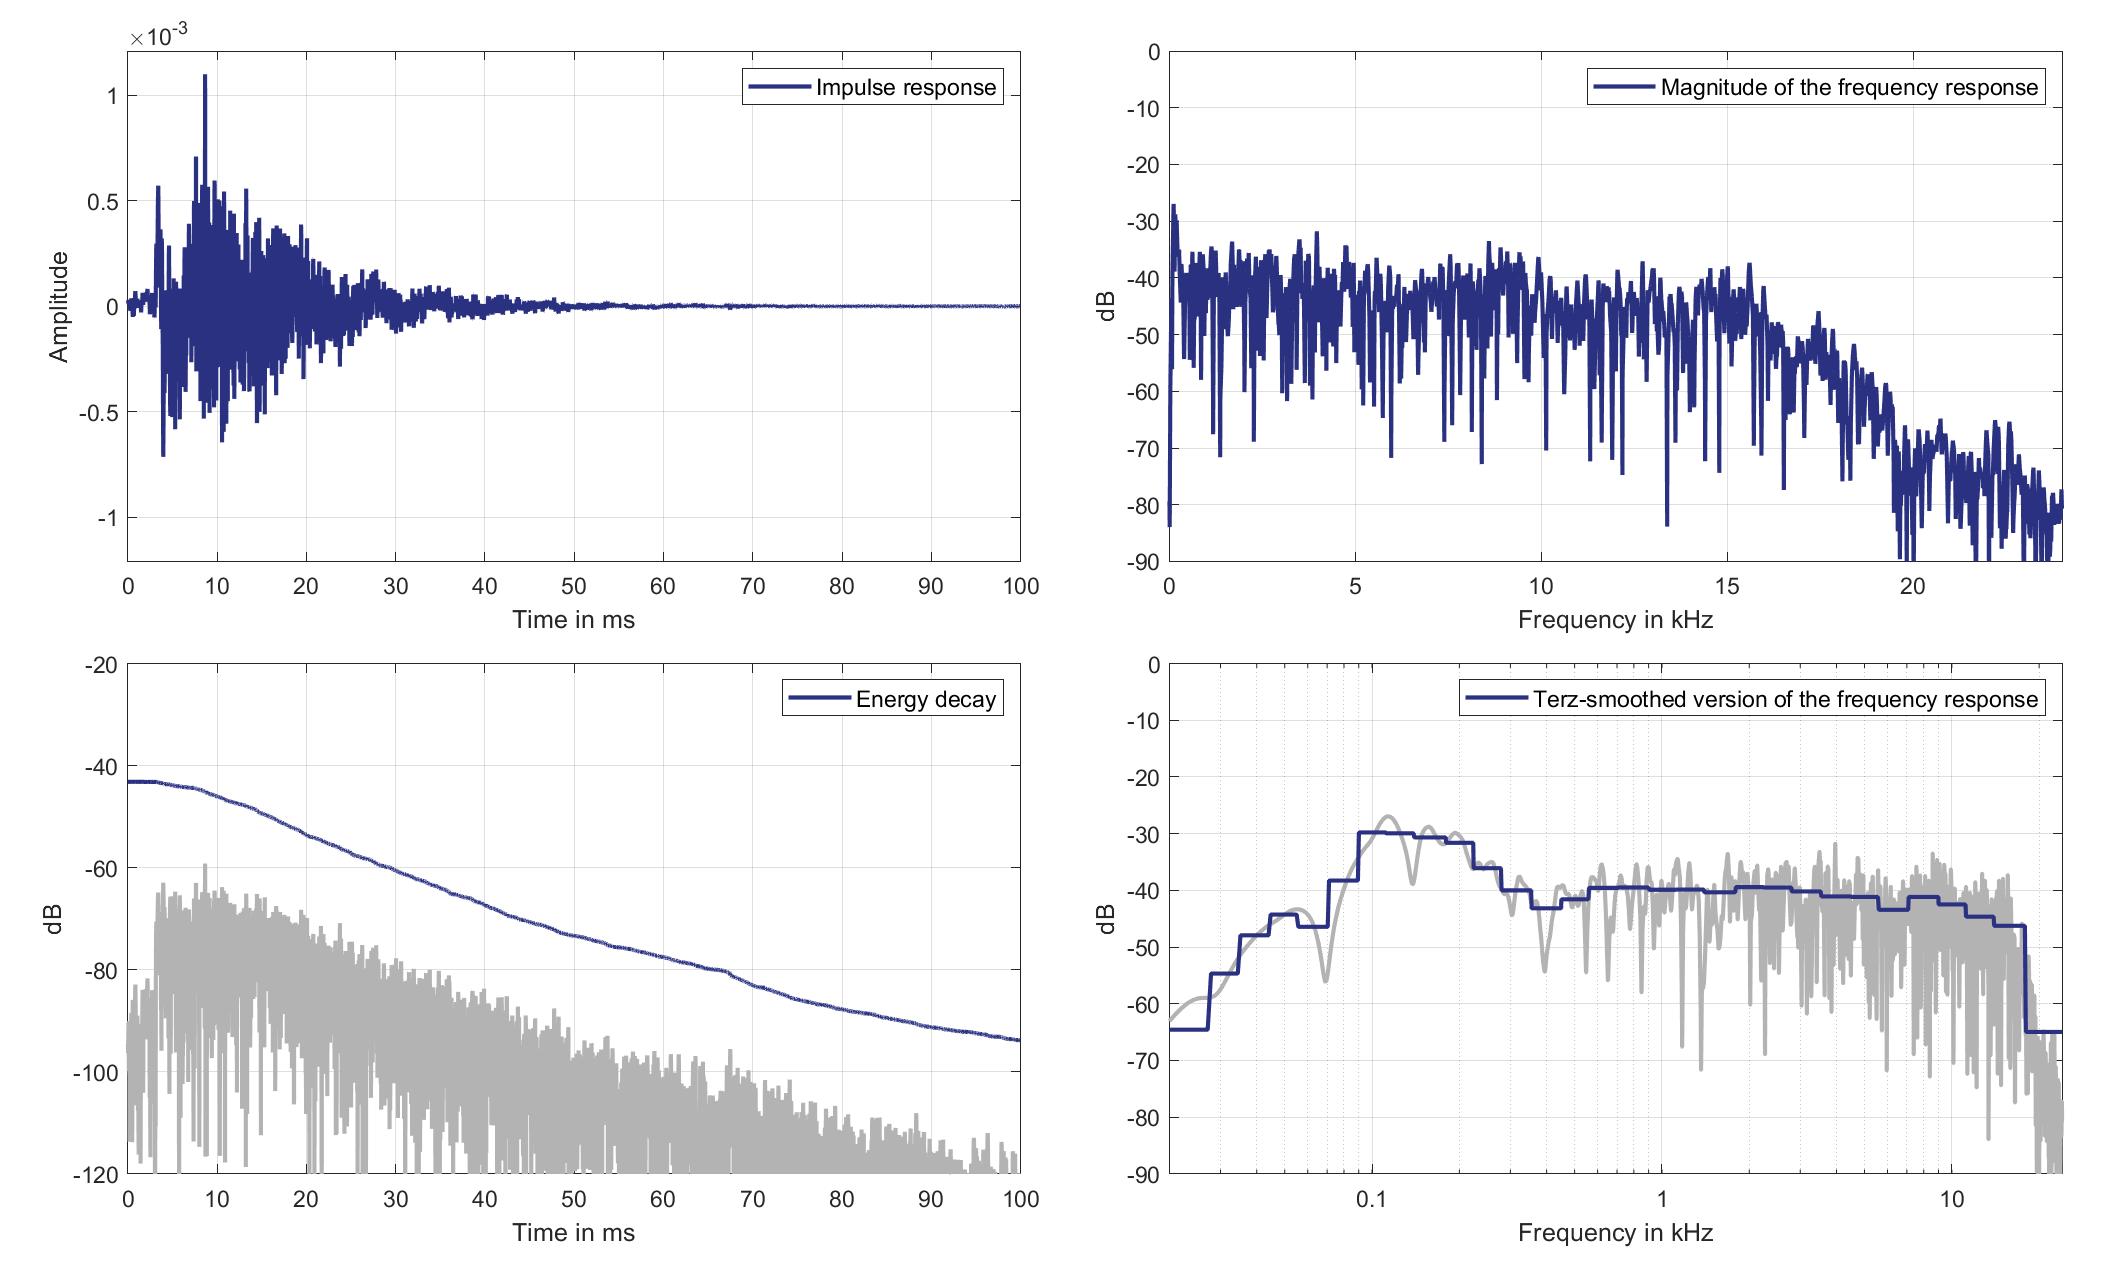
Download impulse response (in ".fir" format).
In the download section you can download all impulse response files as well as format explanation and Matlab as well as Python code examples for loading fir files.
Right Ear Microphone
Mouth Loudspeaker of Zone 2 (Lsp. 13) to Right Ear Microphone of Zone 5 (Mic. 26)
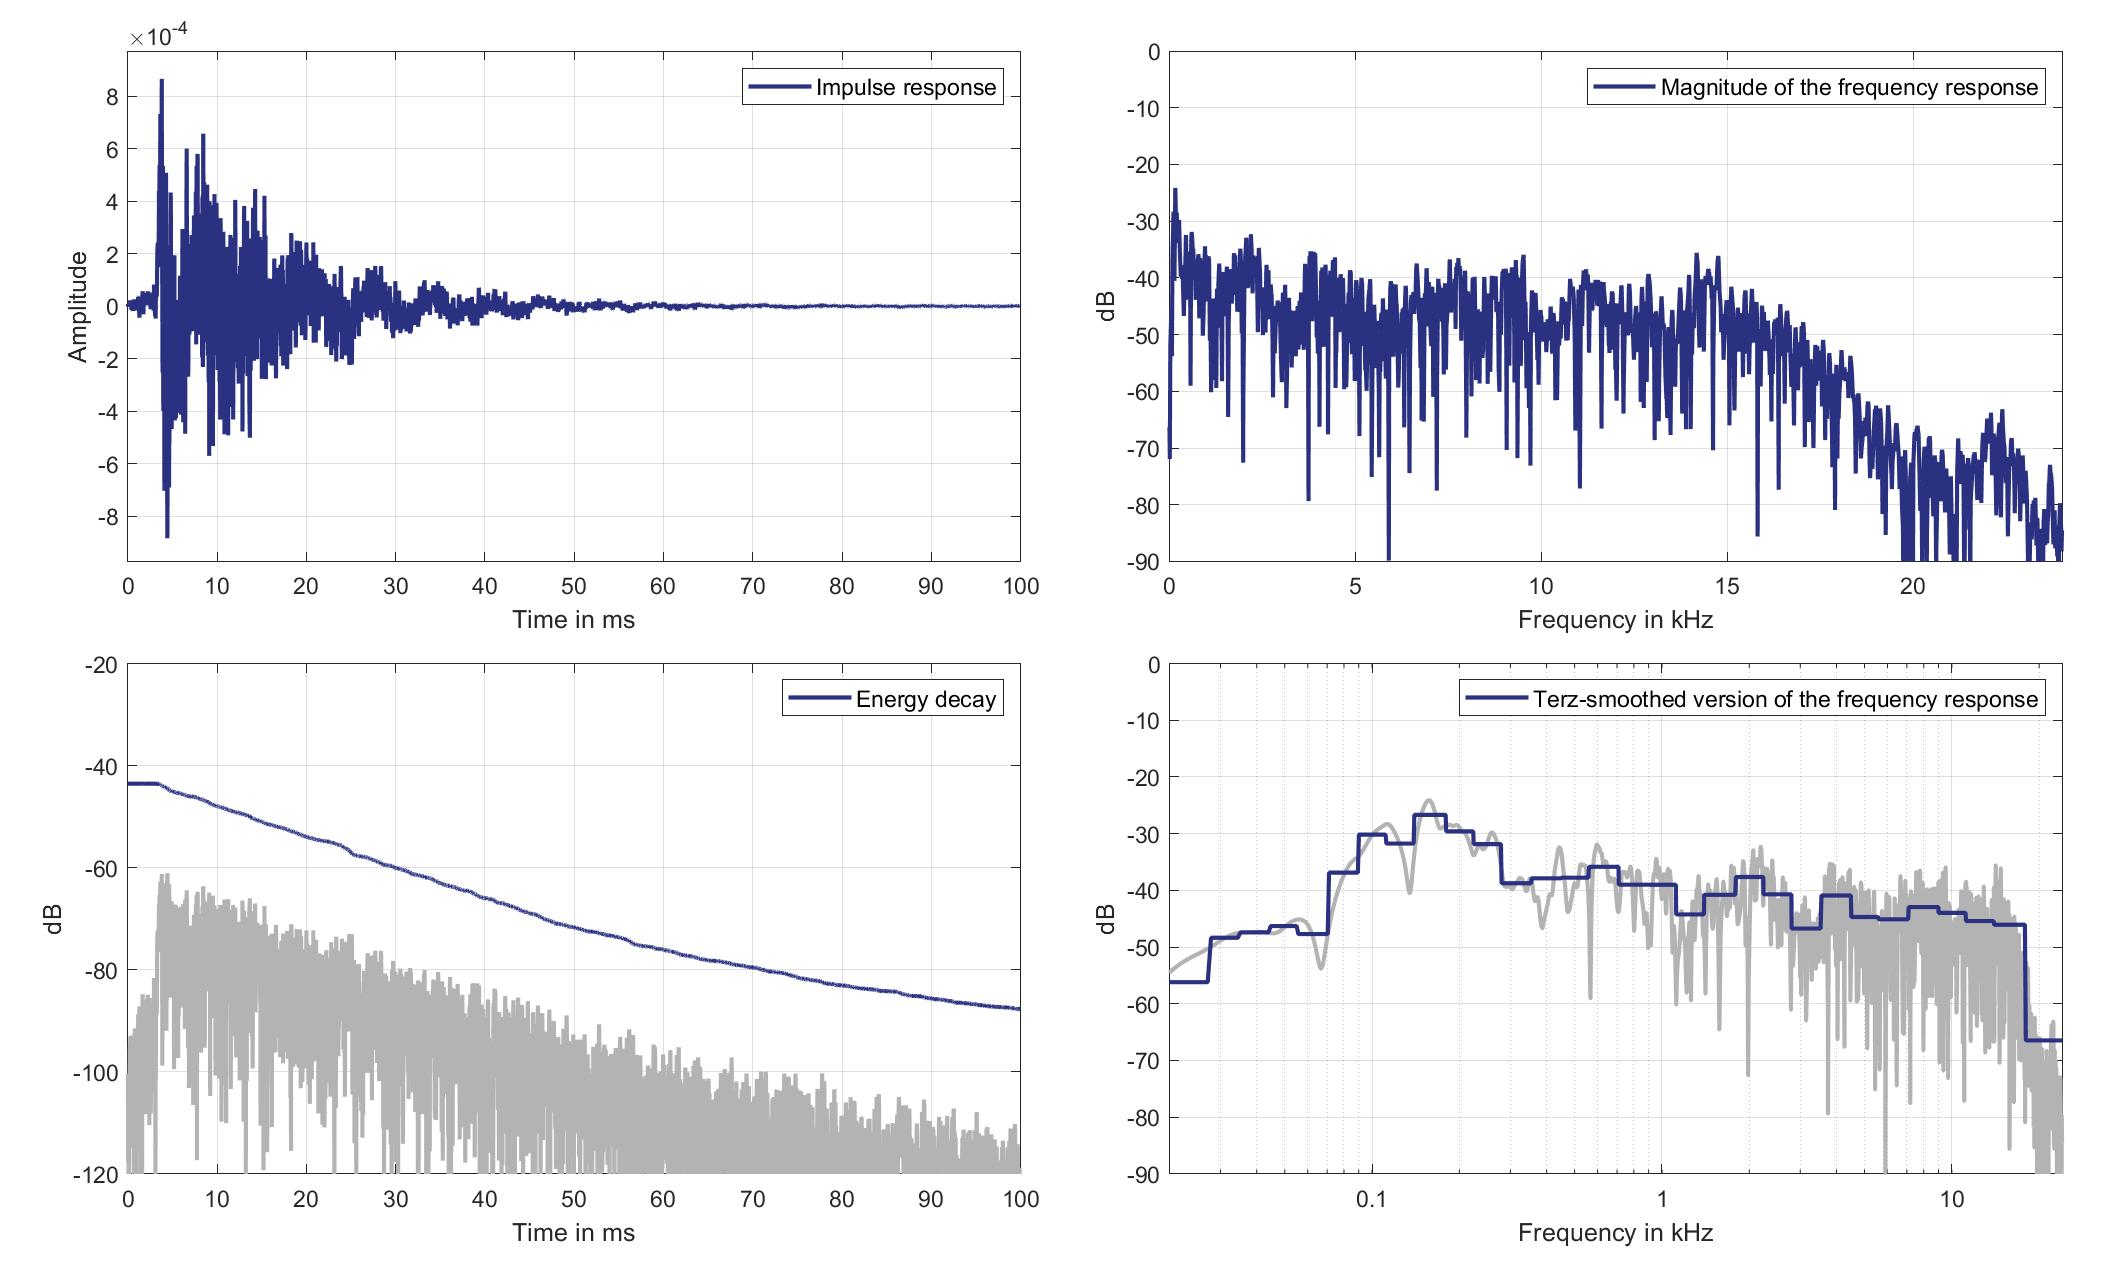
Download impulse response (in ".fir" format).
In the download section you can download all impulse response files as well as format explanation and Matlab as well as Python code examples for loading fir files.
Mics. 27/28
Left Ear Microphone
Mouth Loudspeaker of Zone 2 (Lsp. 13) to Left Ear Microphone of Zone 6 (Mic. 27)
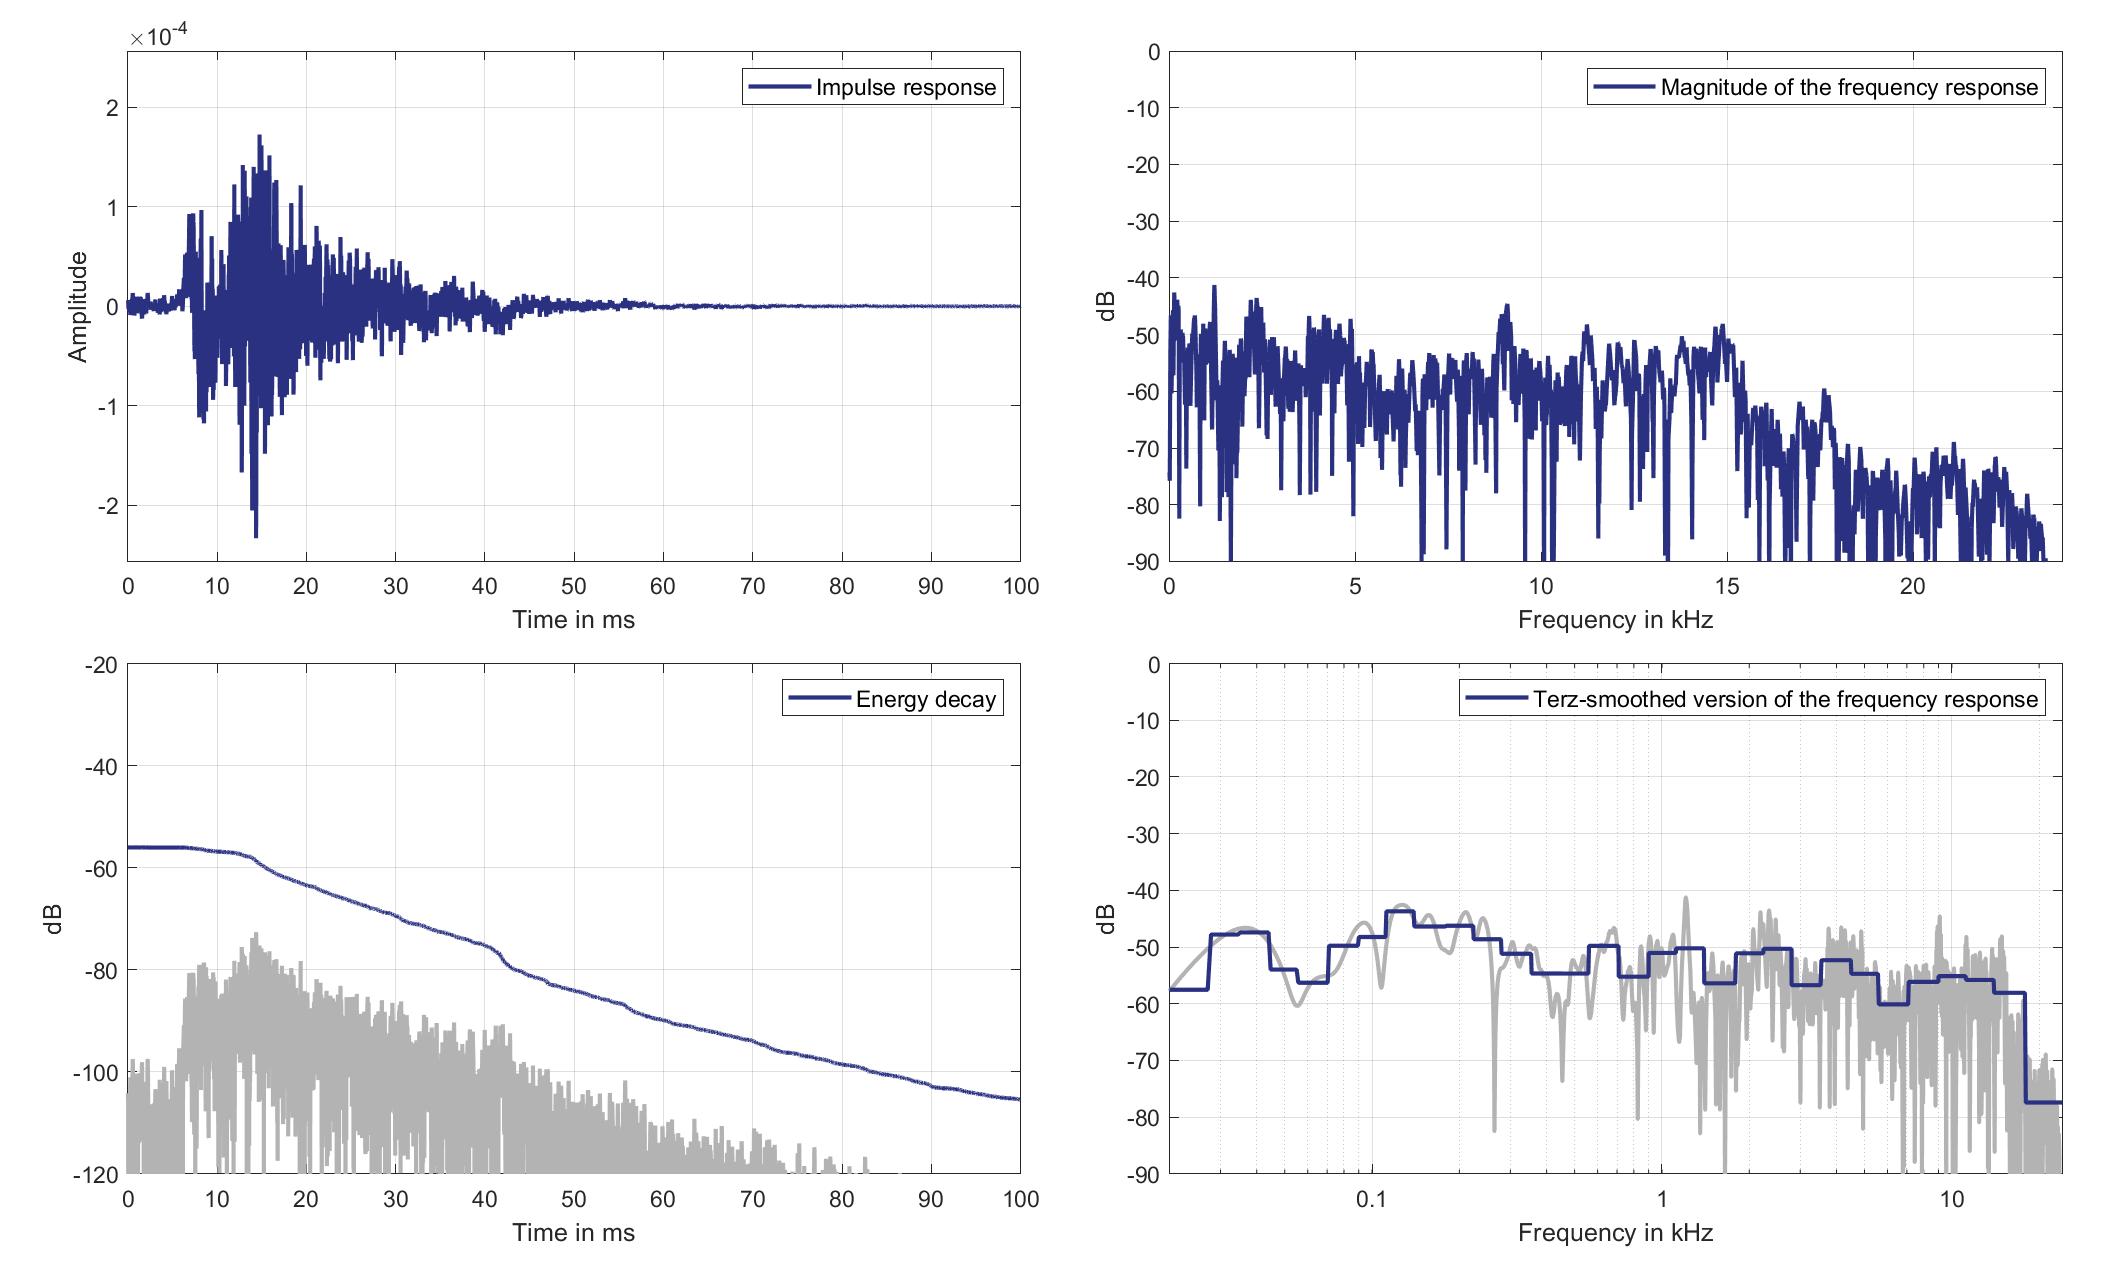
Download impulse response (in ".fir" format).
In the download section you can download all impulse response files as well as format explanation and Matlab as well as Python code examples for loading fir files.
Right Ear Microphone
Mouth Loudspeaker of Zone 2 (Lsp. 13) to Right Ear Microphone of Zone 6 (Mic. 28)
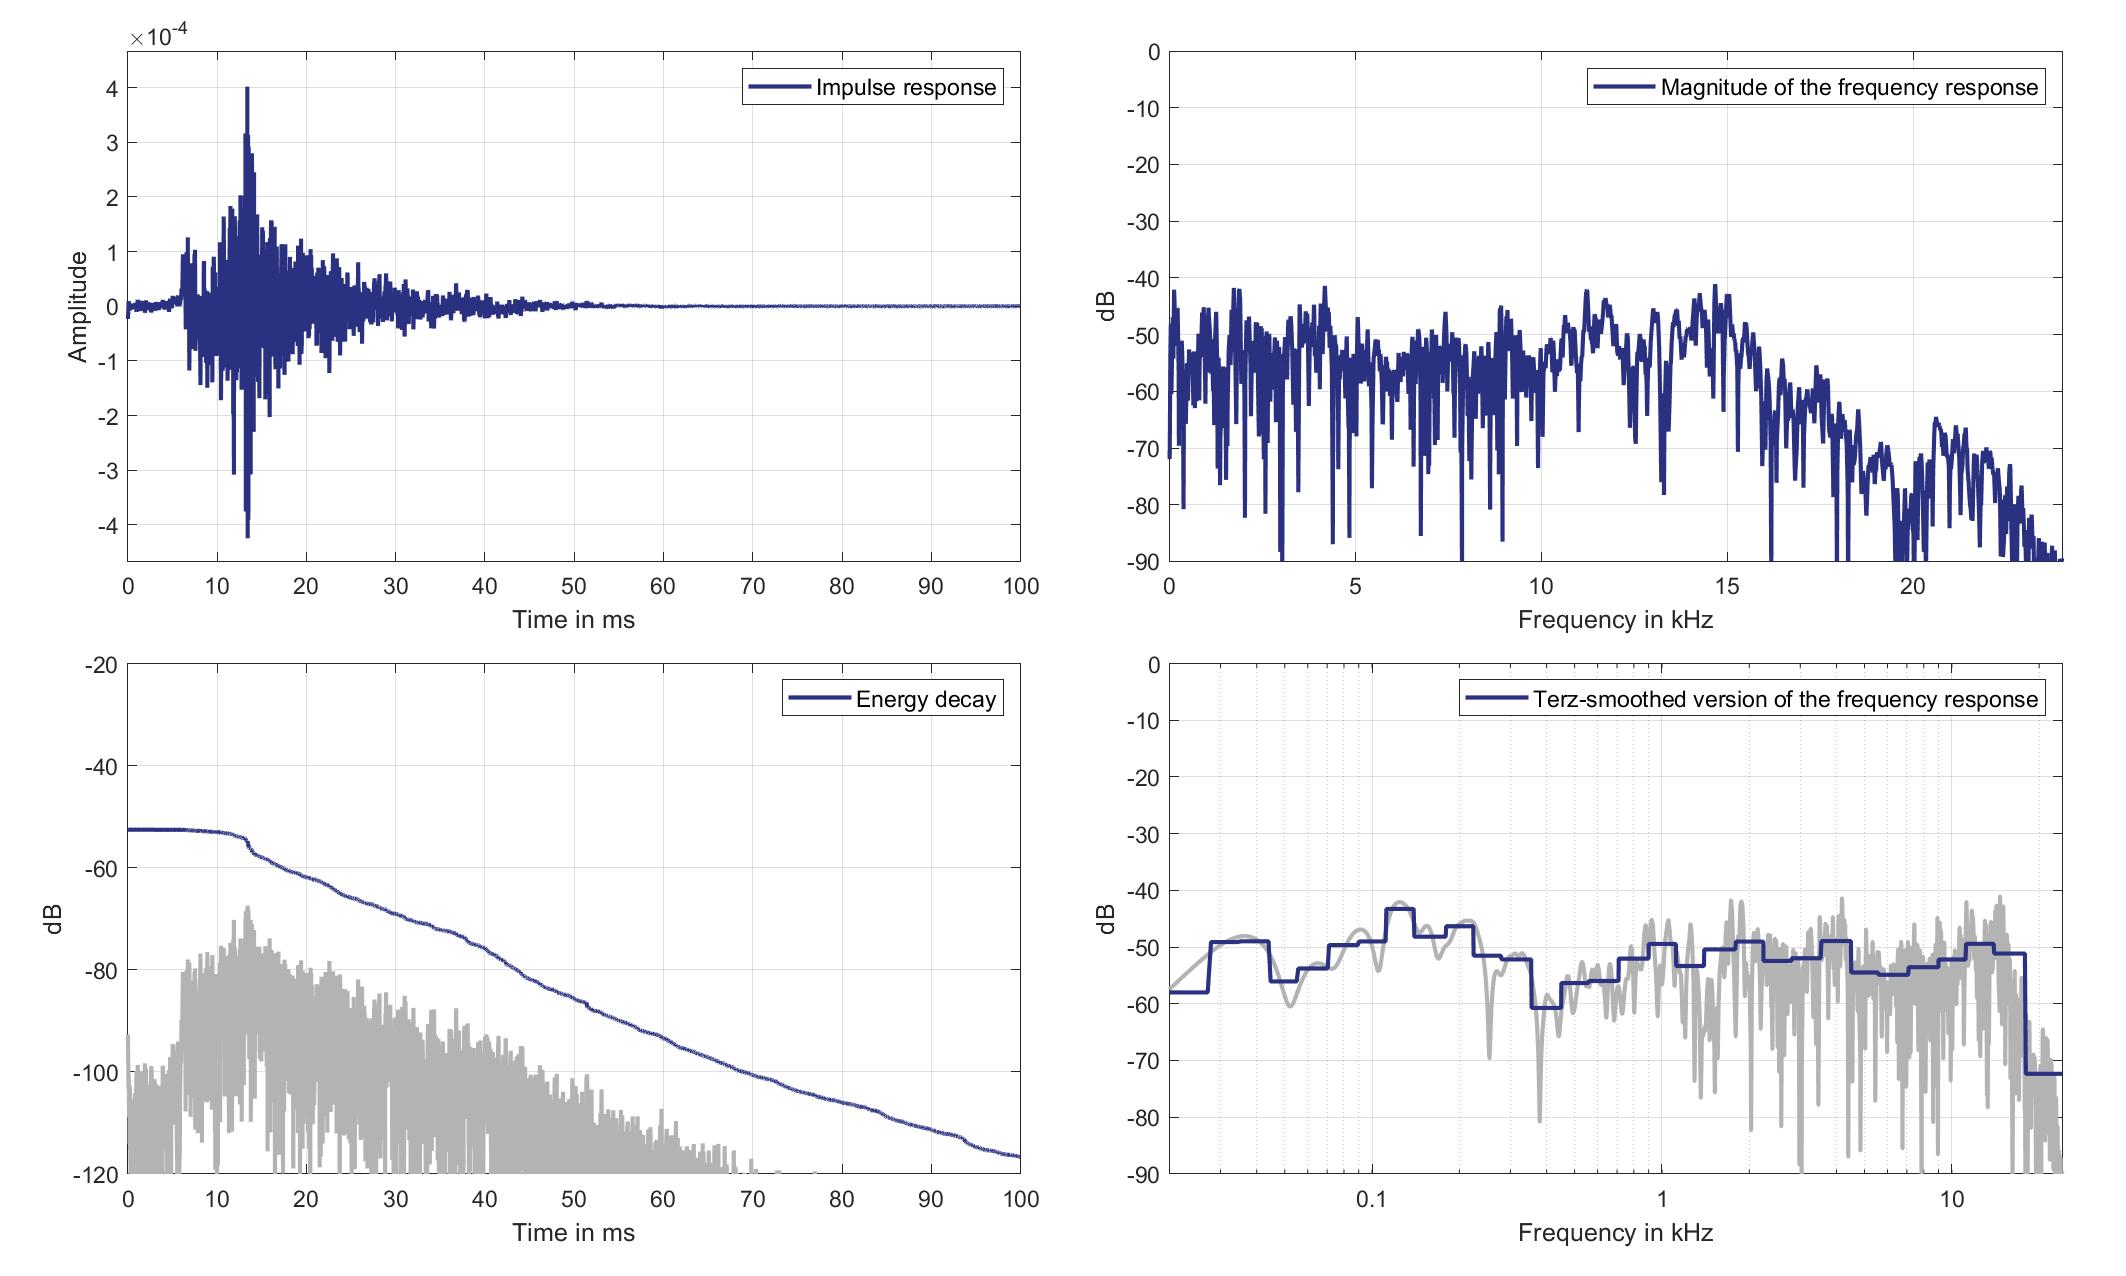
Download impulse response (in ".fir" format).
In the download section you can download all impulse response files as well as format explanation and Matlab as well as Python code examples for loading fir files.
Mics. 29/30
Left Ear Microphone
Mouth Loudspeaker of Zone 2 (Lsp. 13) to Left Ear Microphone of Zone 8 (Mic. 29)
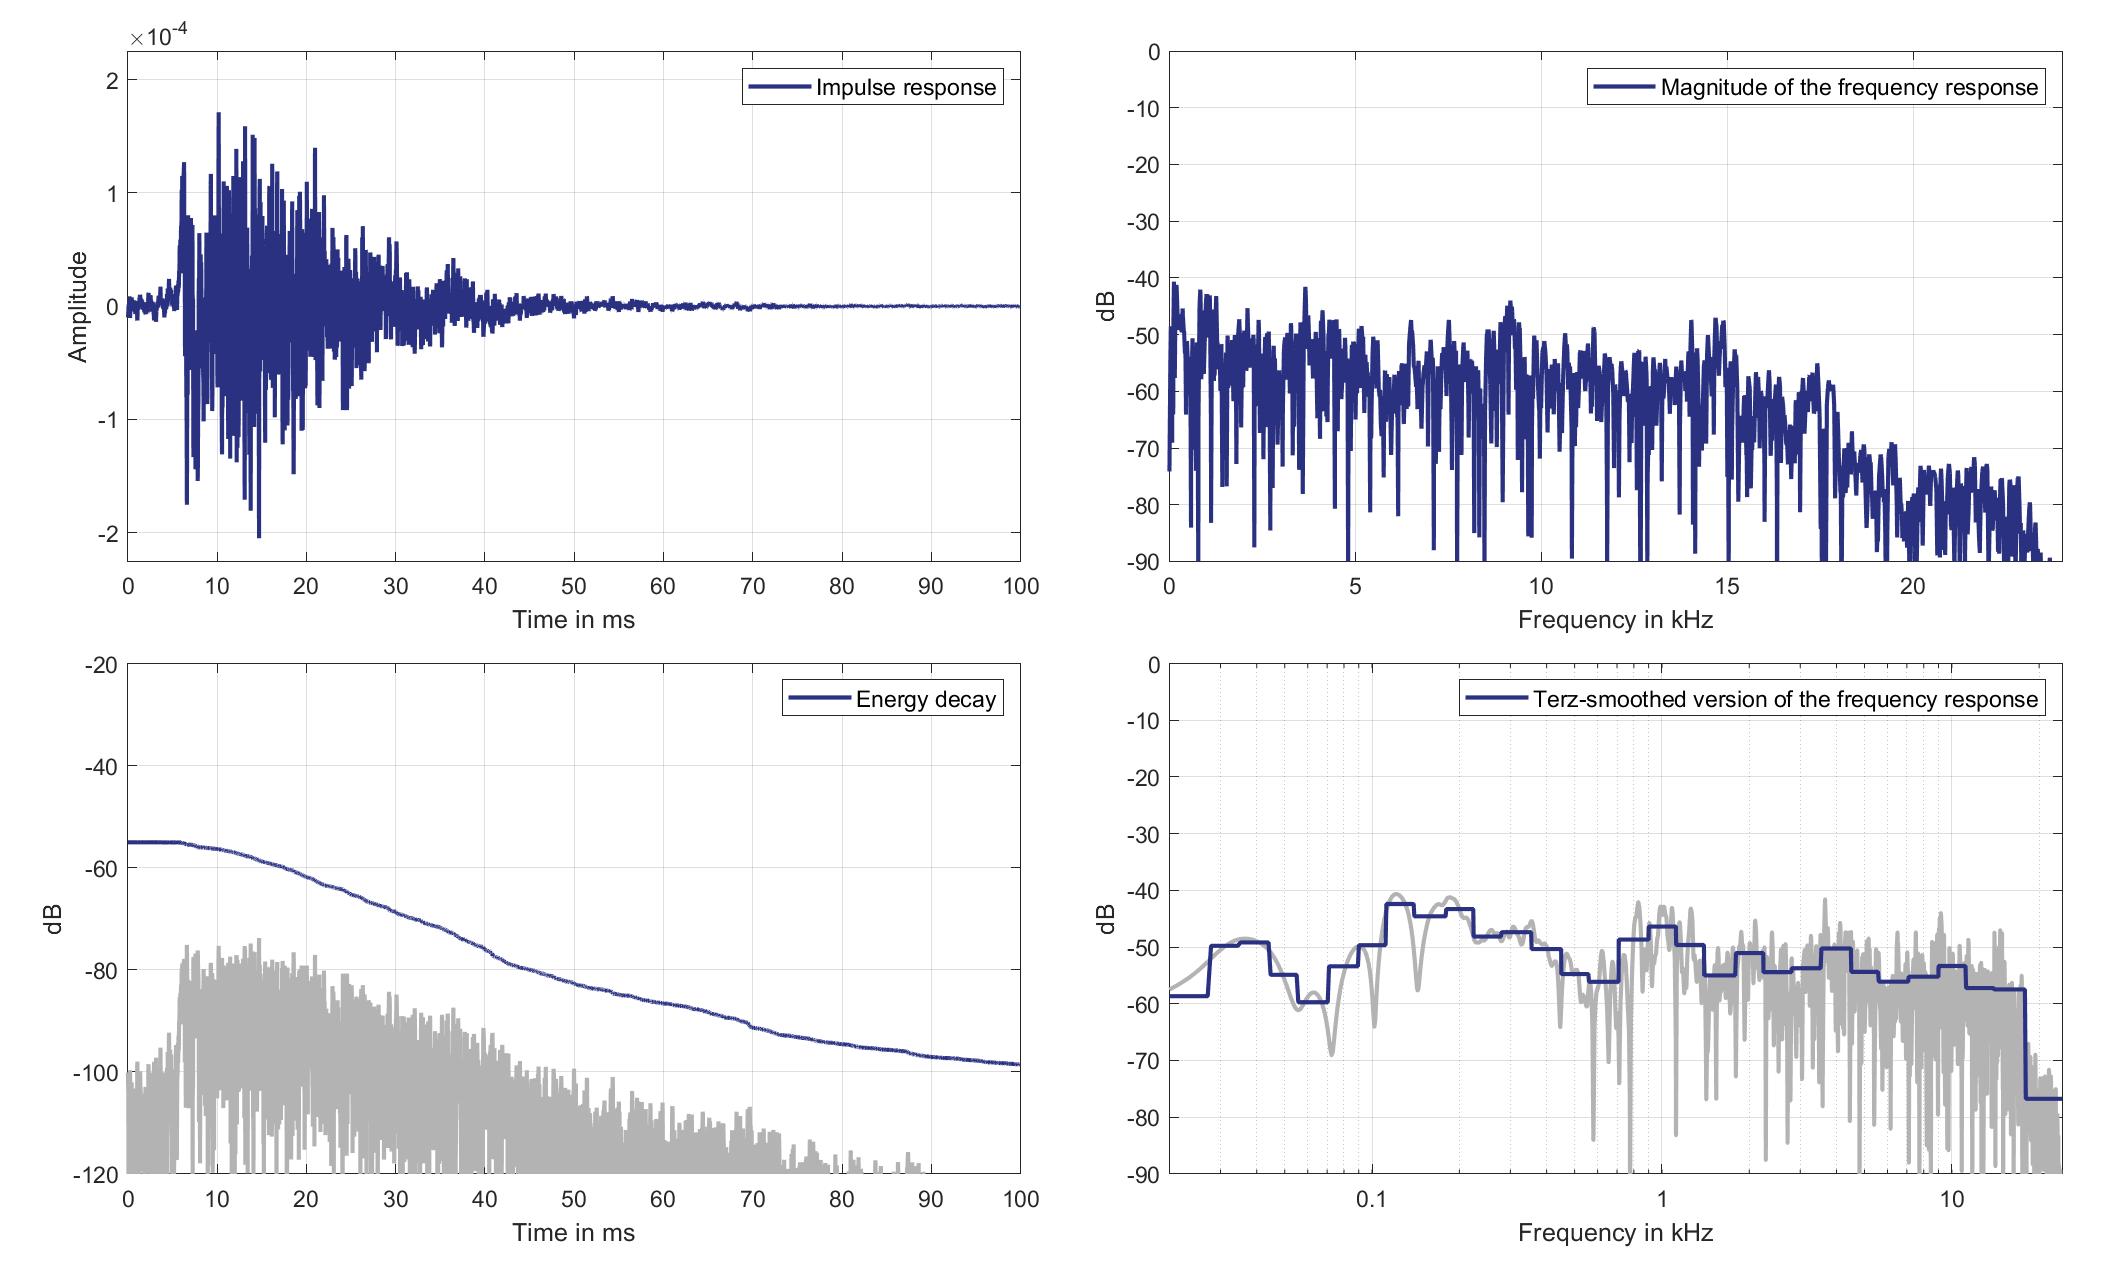
Download impulse response (in ".fir" format).
In the download section you can download all impulse response files as well as format explanation and Matlab as well as Python code examples for loading fir files.
Right Ear Microphone
Mouth Loudspeaker of Zone 2 (Lsp. 13) to Right Ear Microphone of Zone 8 (Mic. 30)
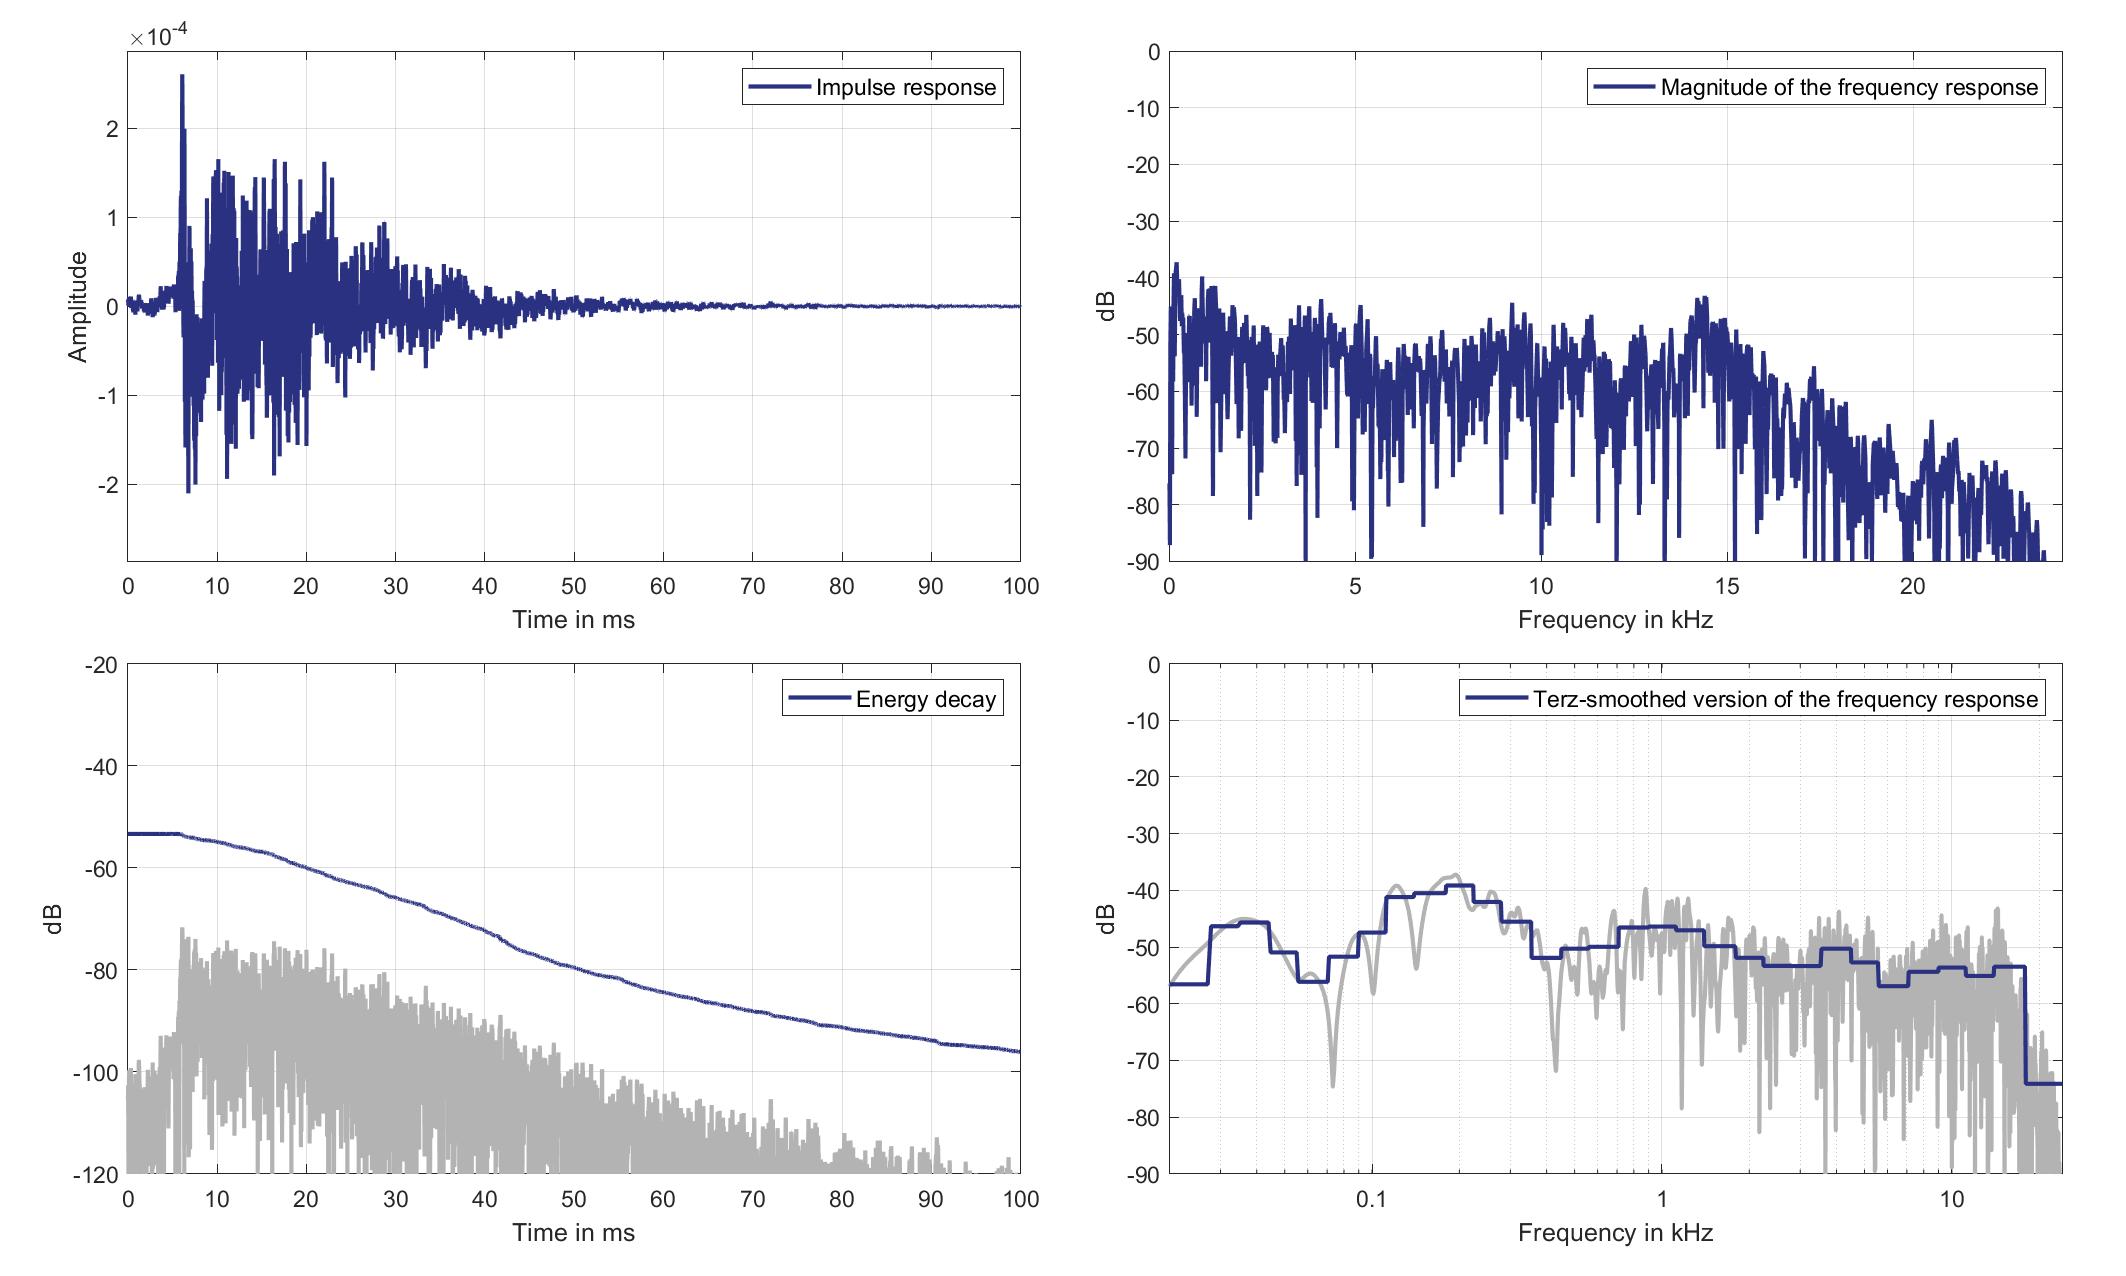
Download impulse response (in ".fir" format).
In the download section you can download all impulse response files as well as format explanation and Matlab as well as Python code examples for loading fir files.
Lsp. 14
Mics. 19/20
Left Ear Microphone
Mouth Loudspeaker of Zone 3 (Lsp. 14) to Left Ear Microphone of Zone 1 (Mic. 19)
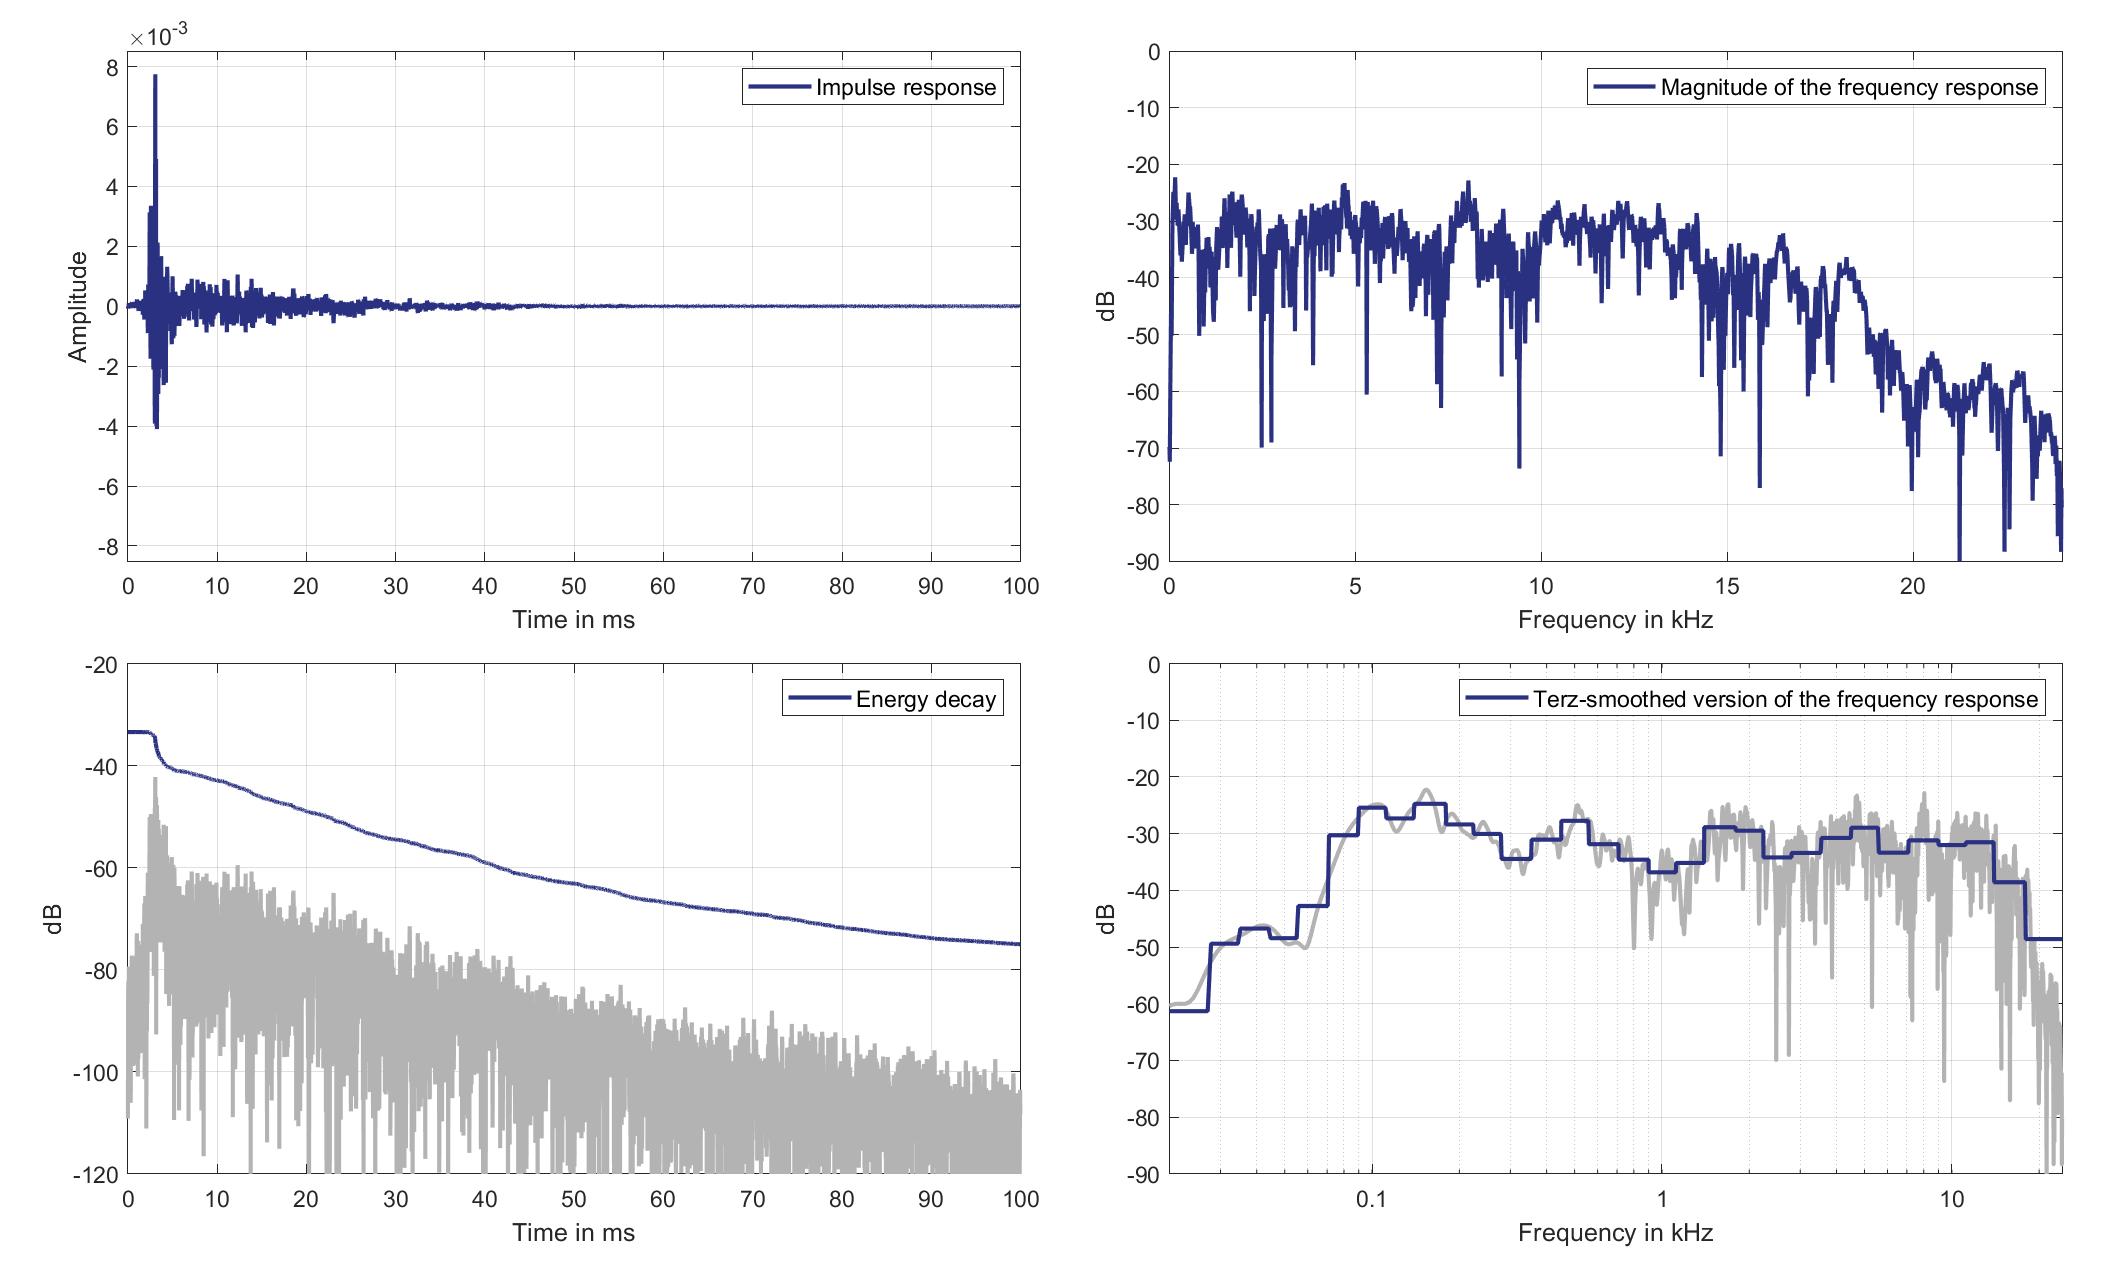
Download impulse response (in ".fir" format).
In the download section you can download all impulse response files as well as format explanation and Matlab as well as Python code examples for loading fir files.
Right Ear Microphone
Mouth Loudspeaker of Zone 3 (Lsp. 14) to Right Ear Microphone of Zone 1 (Mic. 20)
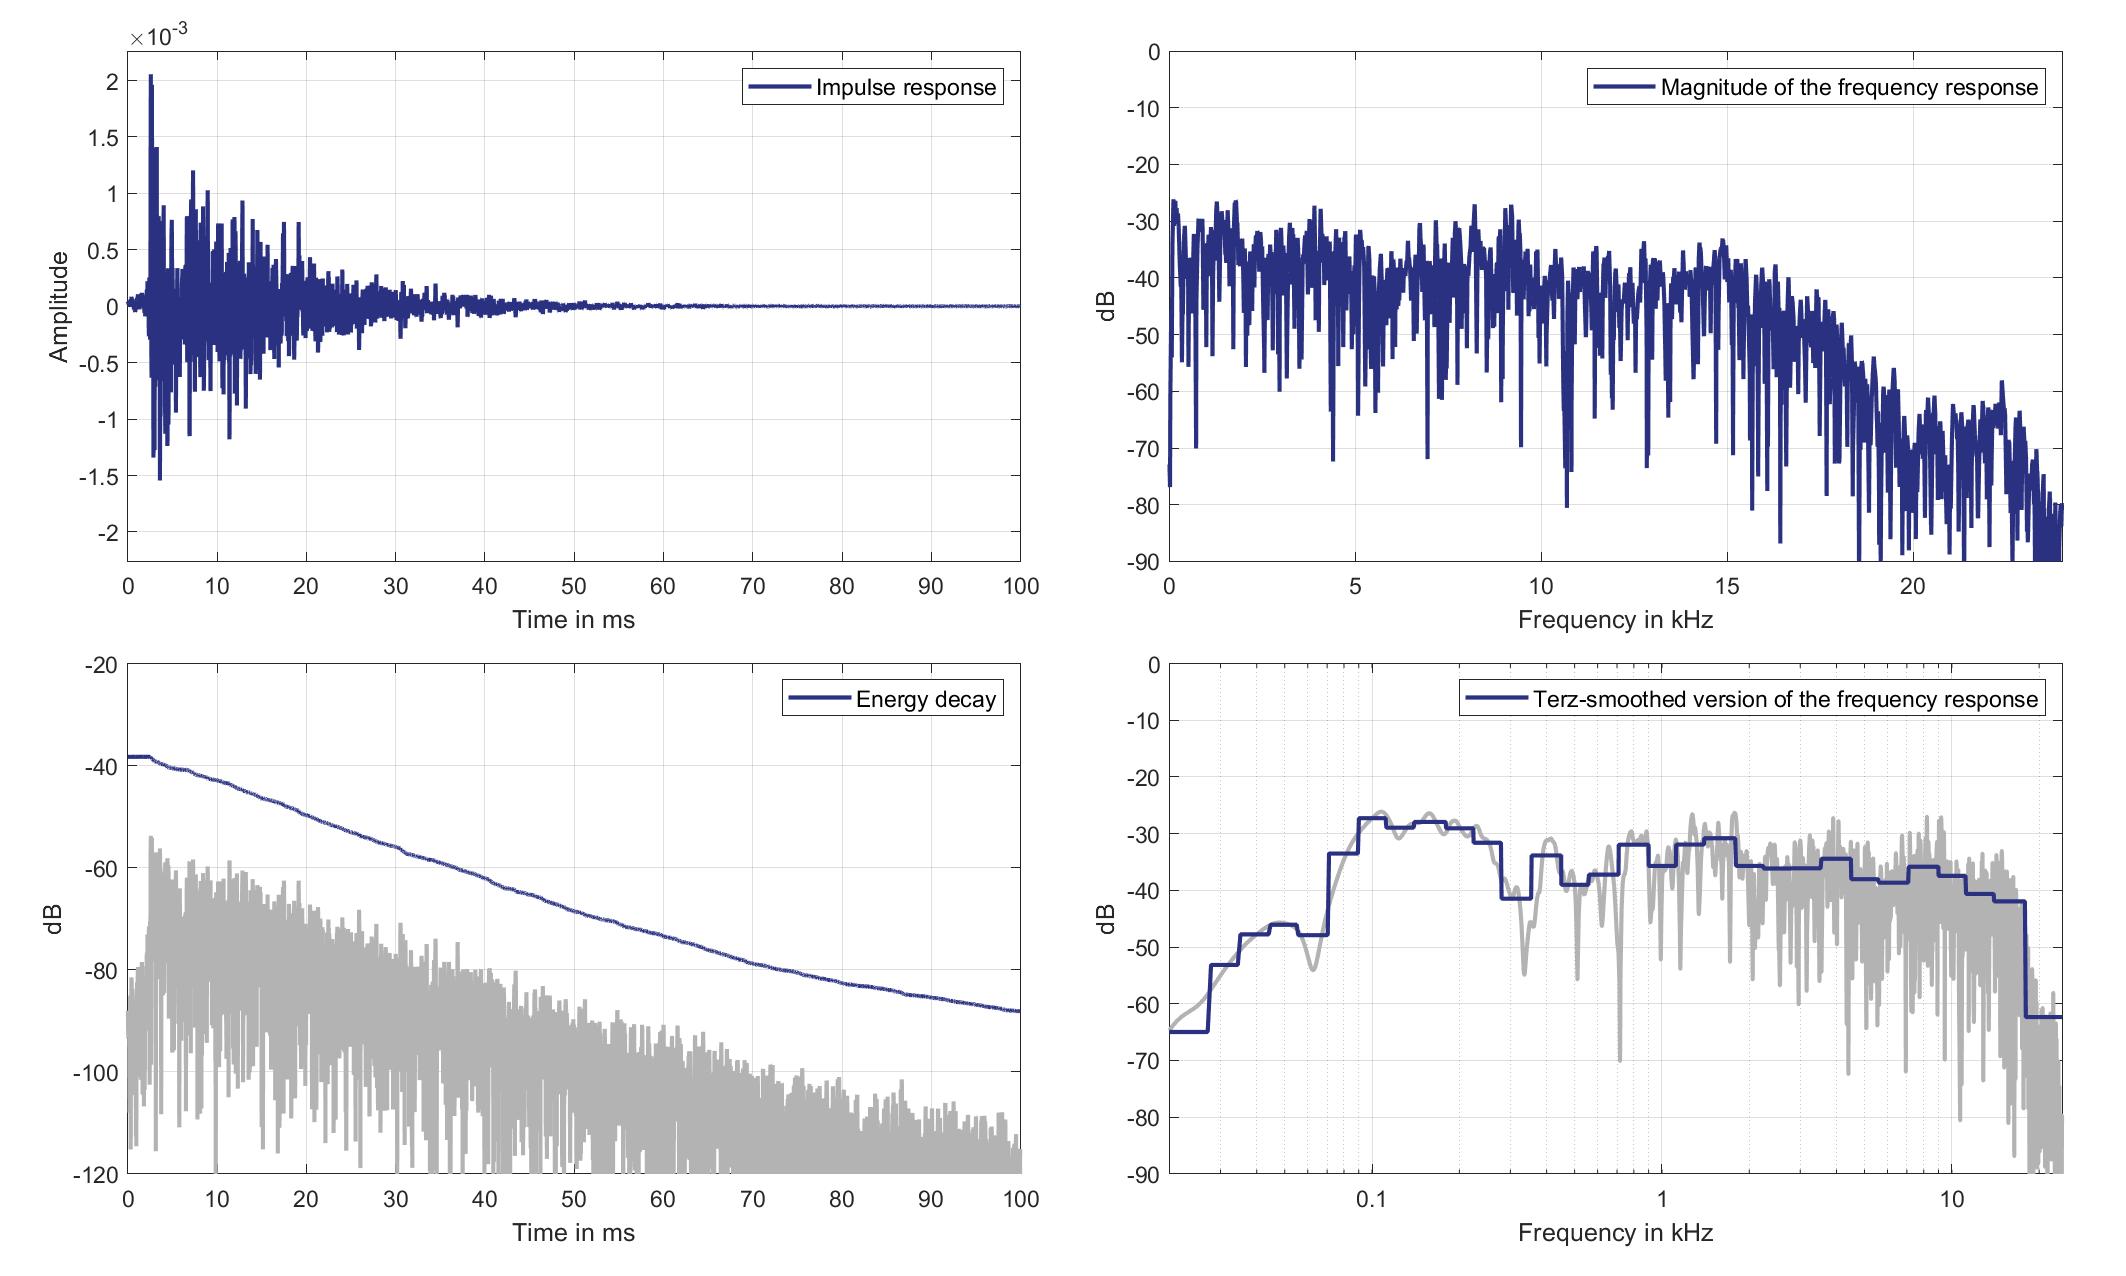
Download impulse response (in ".fir" format).
In the download section you can download all impulse response files as well as format explanation and Matlab as well as Python code examples for loading fir files.
Mics. 21/22
Left Ear Microphone
Mouth Loudspeaker of Zone 3 (Lsp. 14) to Left Ear Microphone of Zone 2 (Mic. 21)
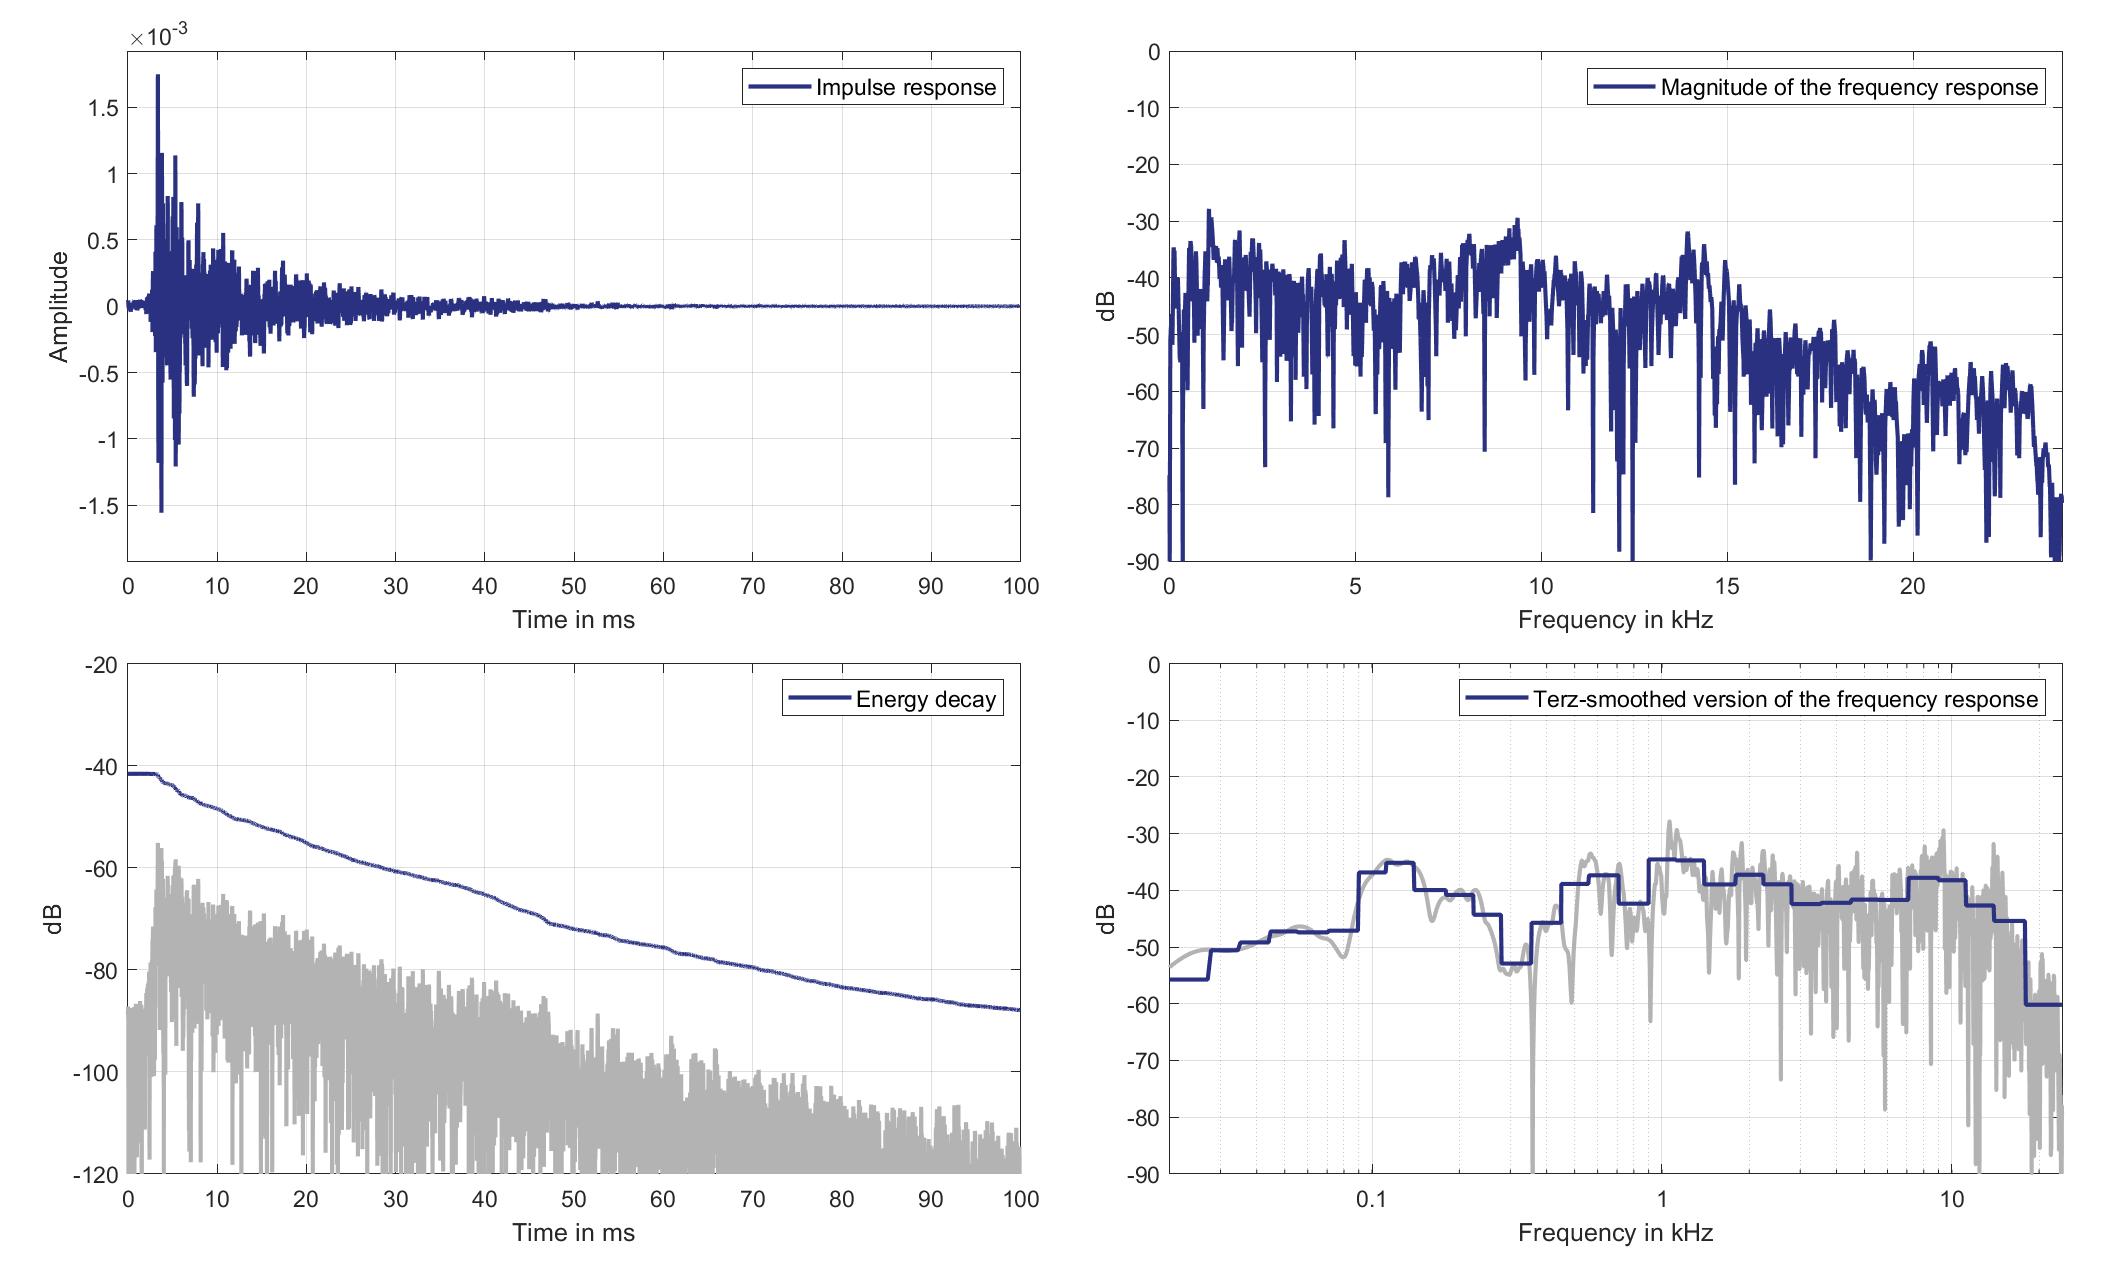
Download impulse response (in ".fir" format).
In the download section you can download all impulse response files as well as format explanation and Matlab as well as Python code examples for loading fir files.
Right Ear Microphone
Mouth Loudspeaker of Zone 3 (Lsp. 14) to Right Ear Microphone of Zone 2 (Mic. 22)
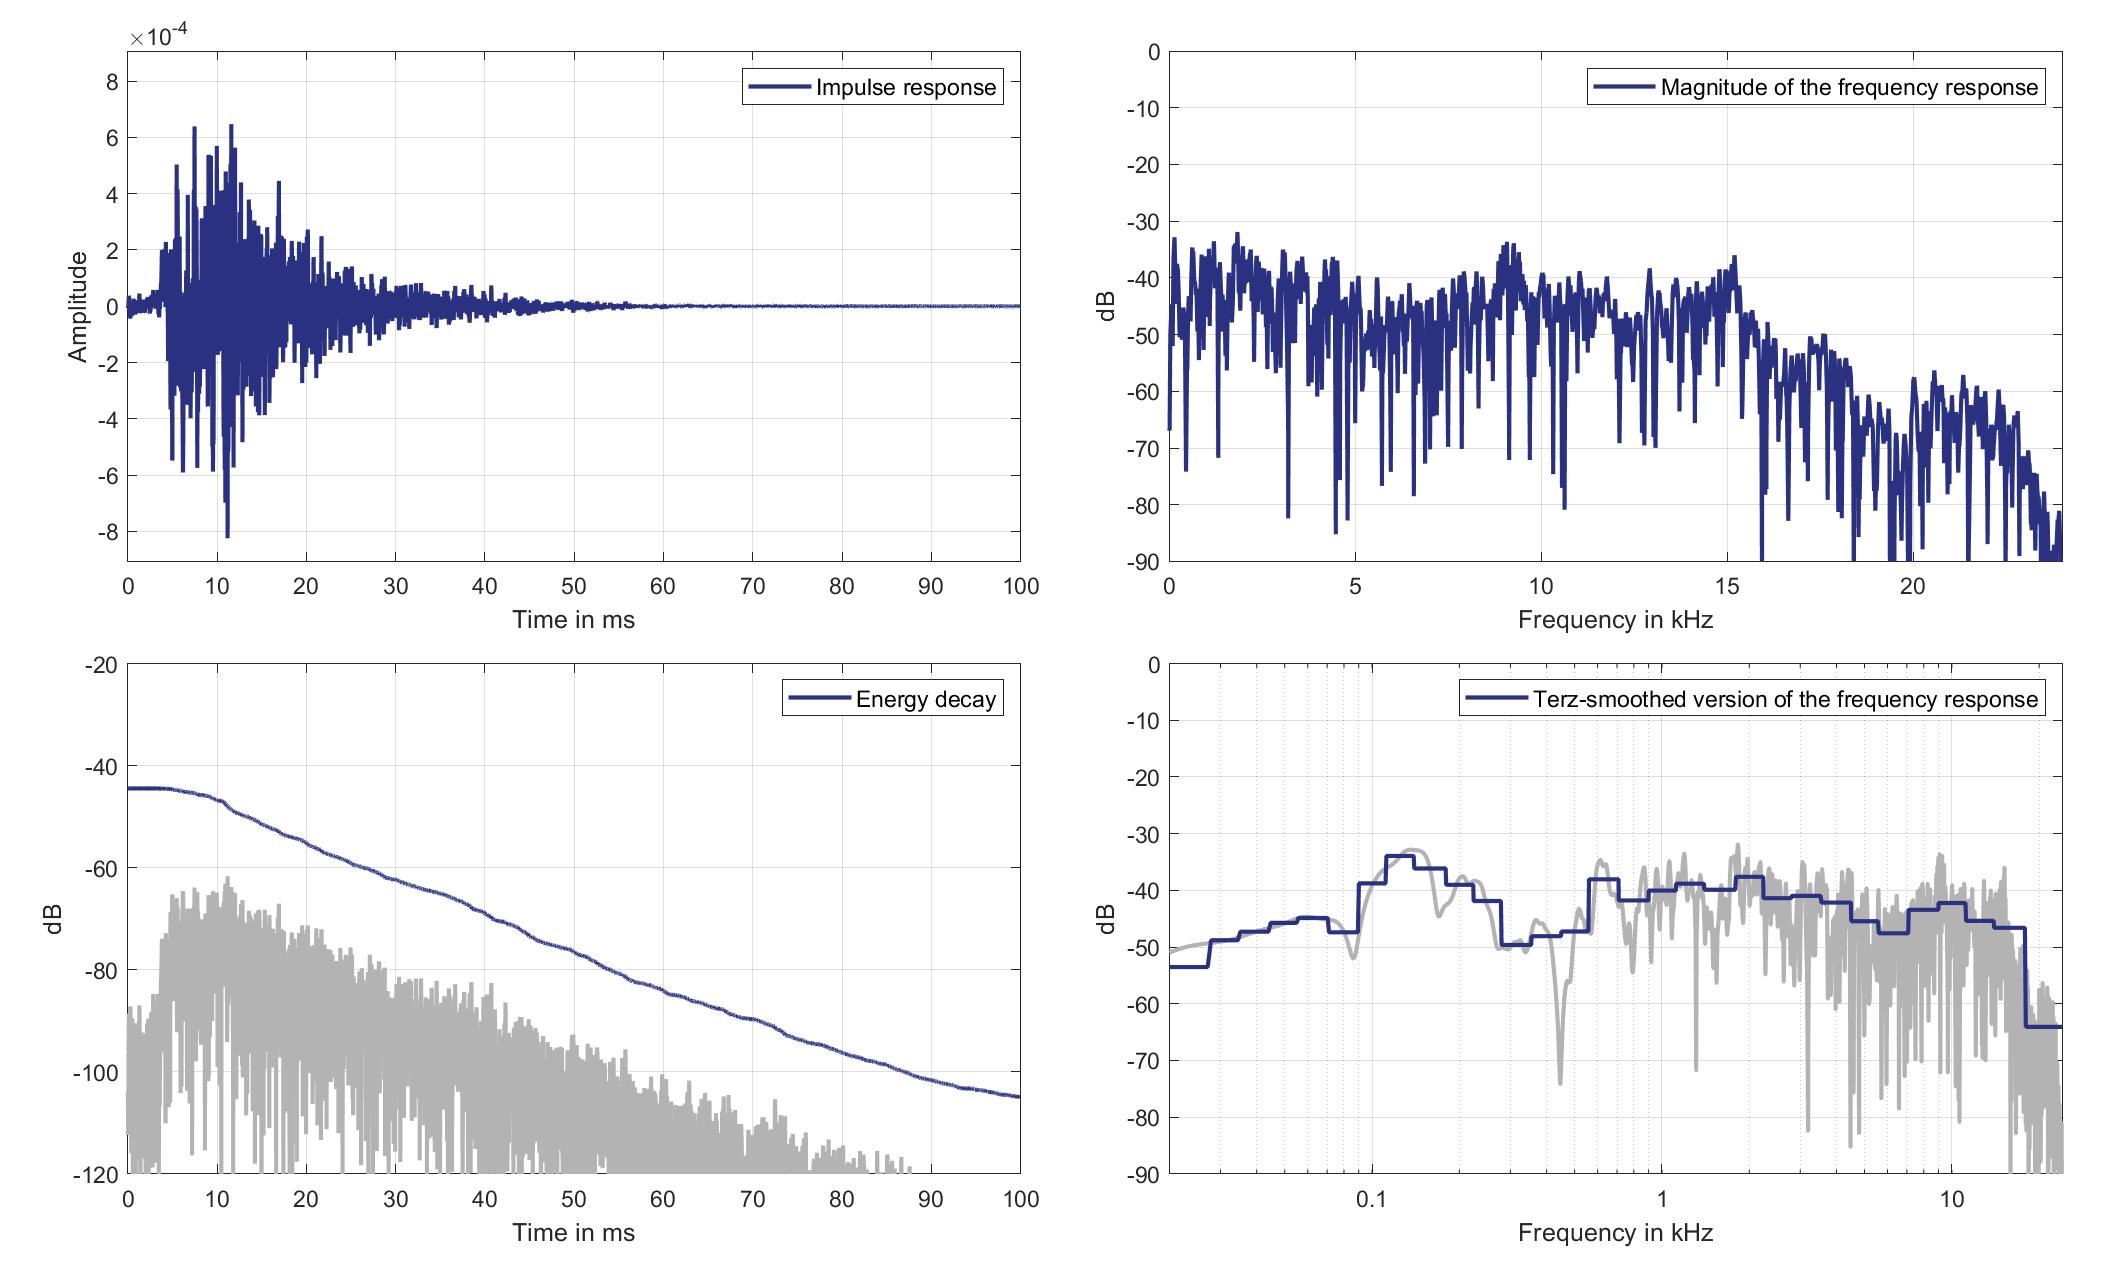
Download impulse response (in ".fir" format).
In the download section you can download all impulse response files as well as format explanation and Matlab as well as Python code examples for loading fir files.
Mics. 23/24
Left Ear Microphone
Mouth Loudspeaker of Zone 3 (Lsp. 14) to Left Ear Microphone of Zone 3 (Mic. 23)
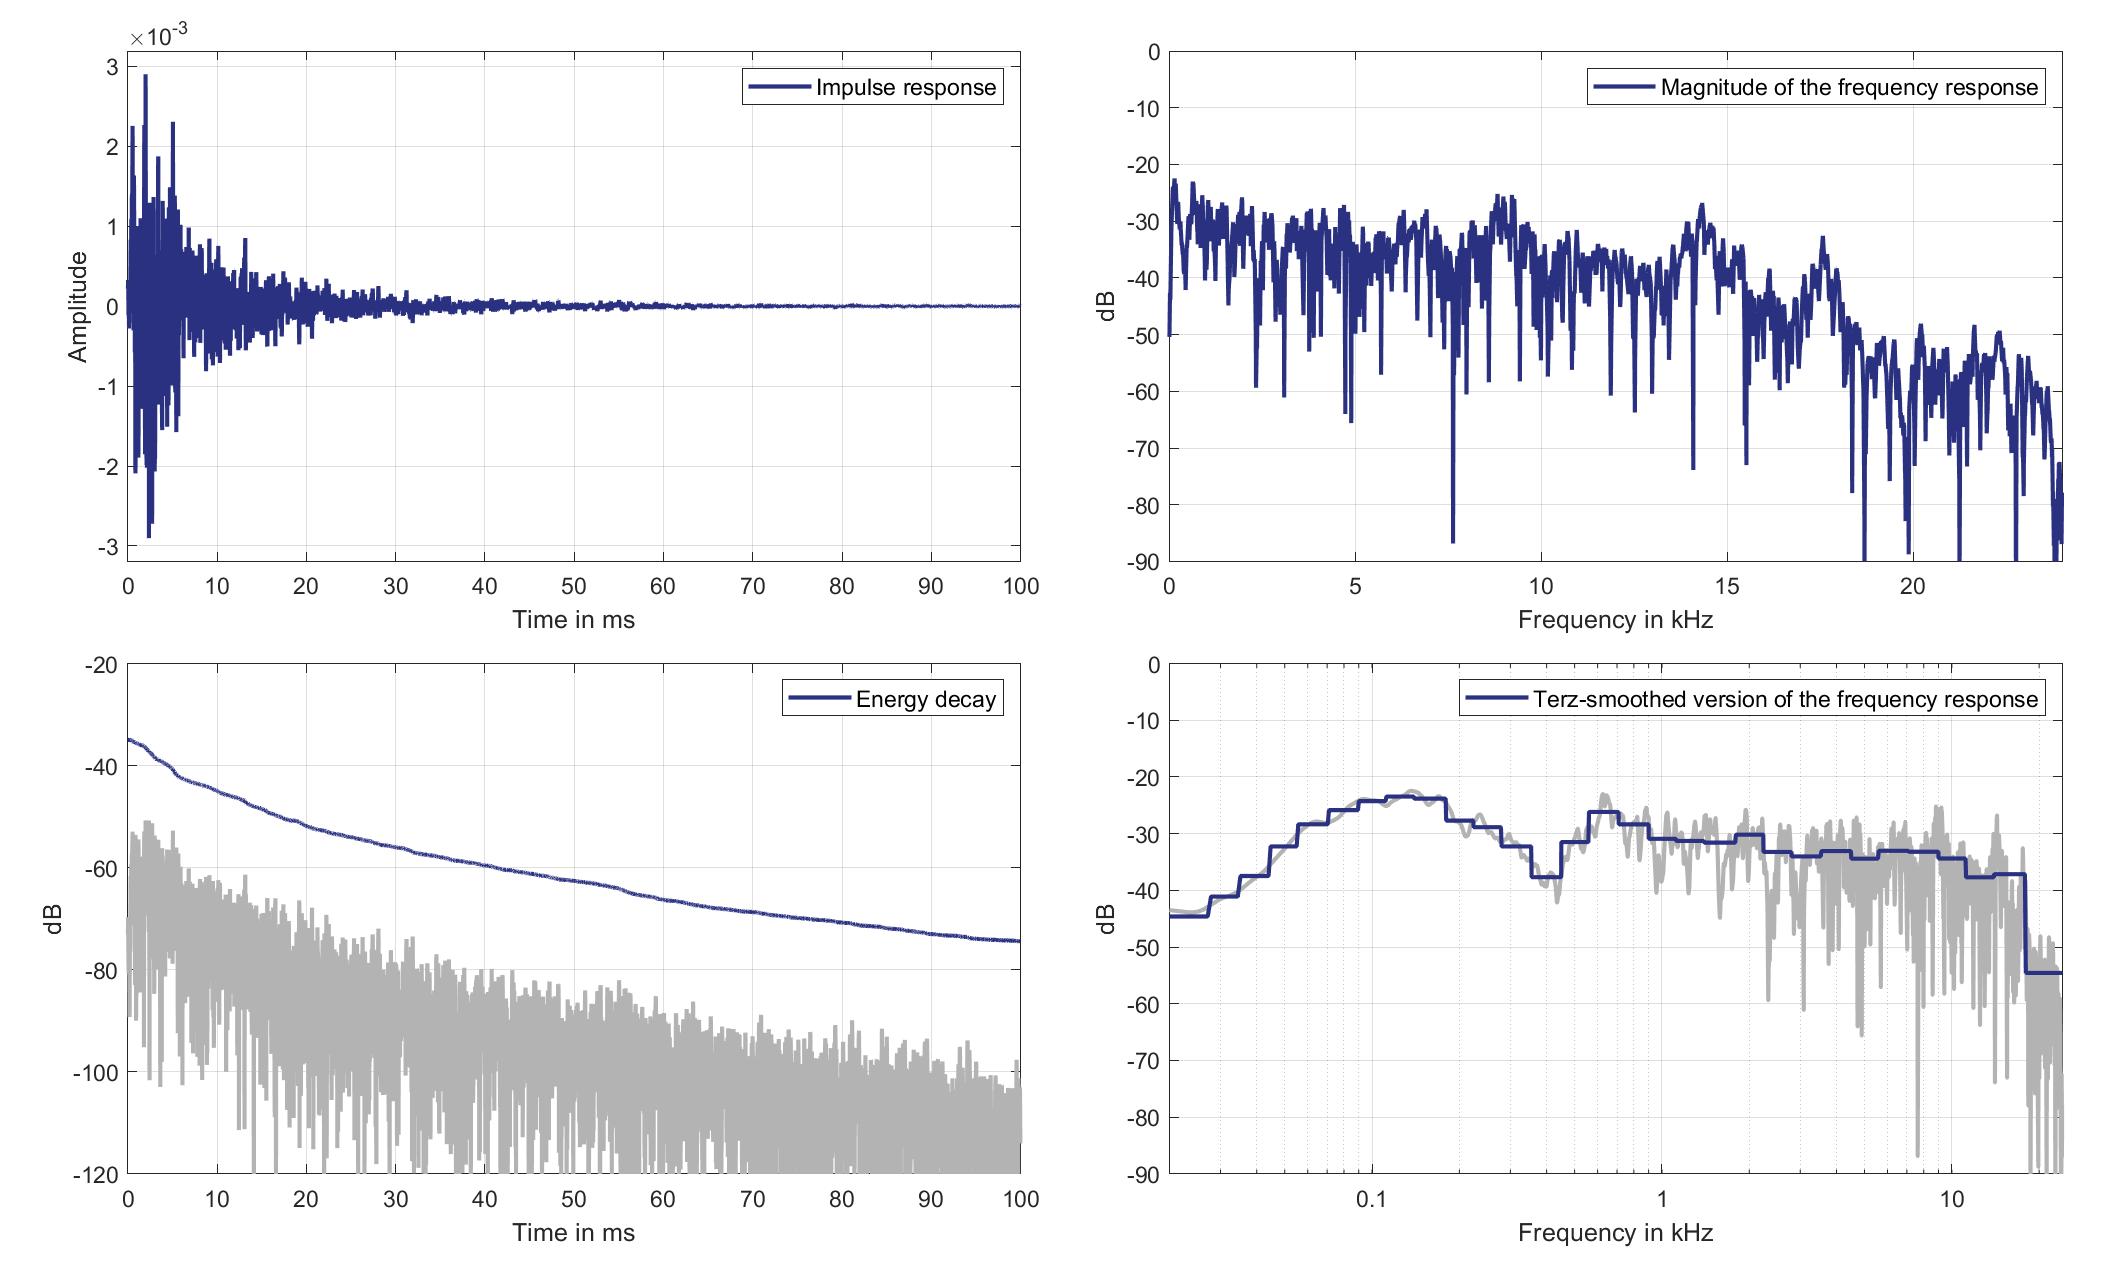
Download impulse response (in ".fir" format).
In the download section you can download all impulse response files as well as format explanation and Matlab as well as Python code examples for loading fir files.
Right Ear Microphone
Mouth Loudspeaker of Zone 3 (Lsp. 14) to Right Ear Microphone of Zone 3 (Mic. 24)
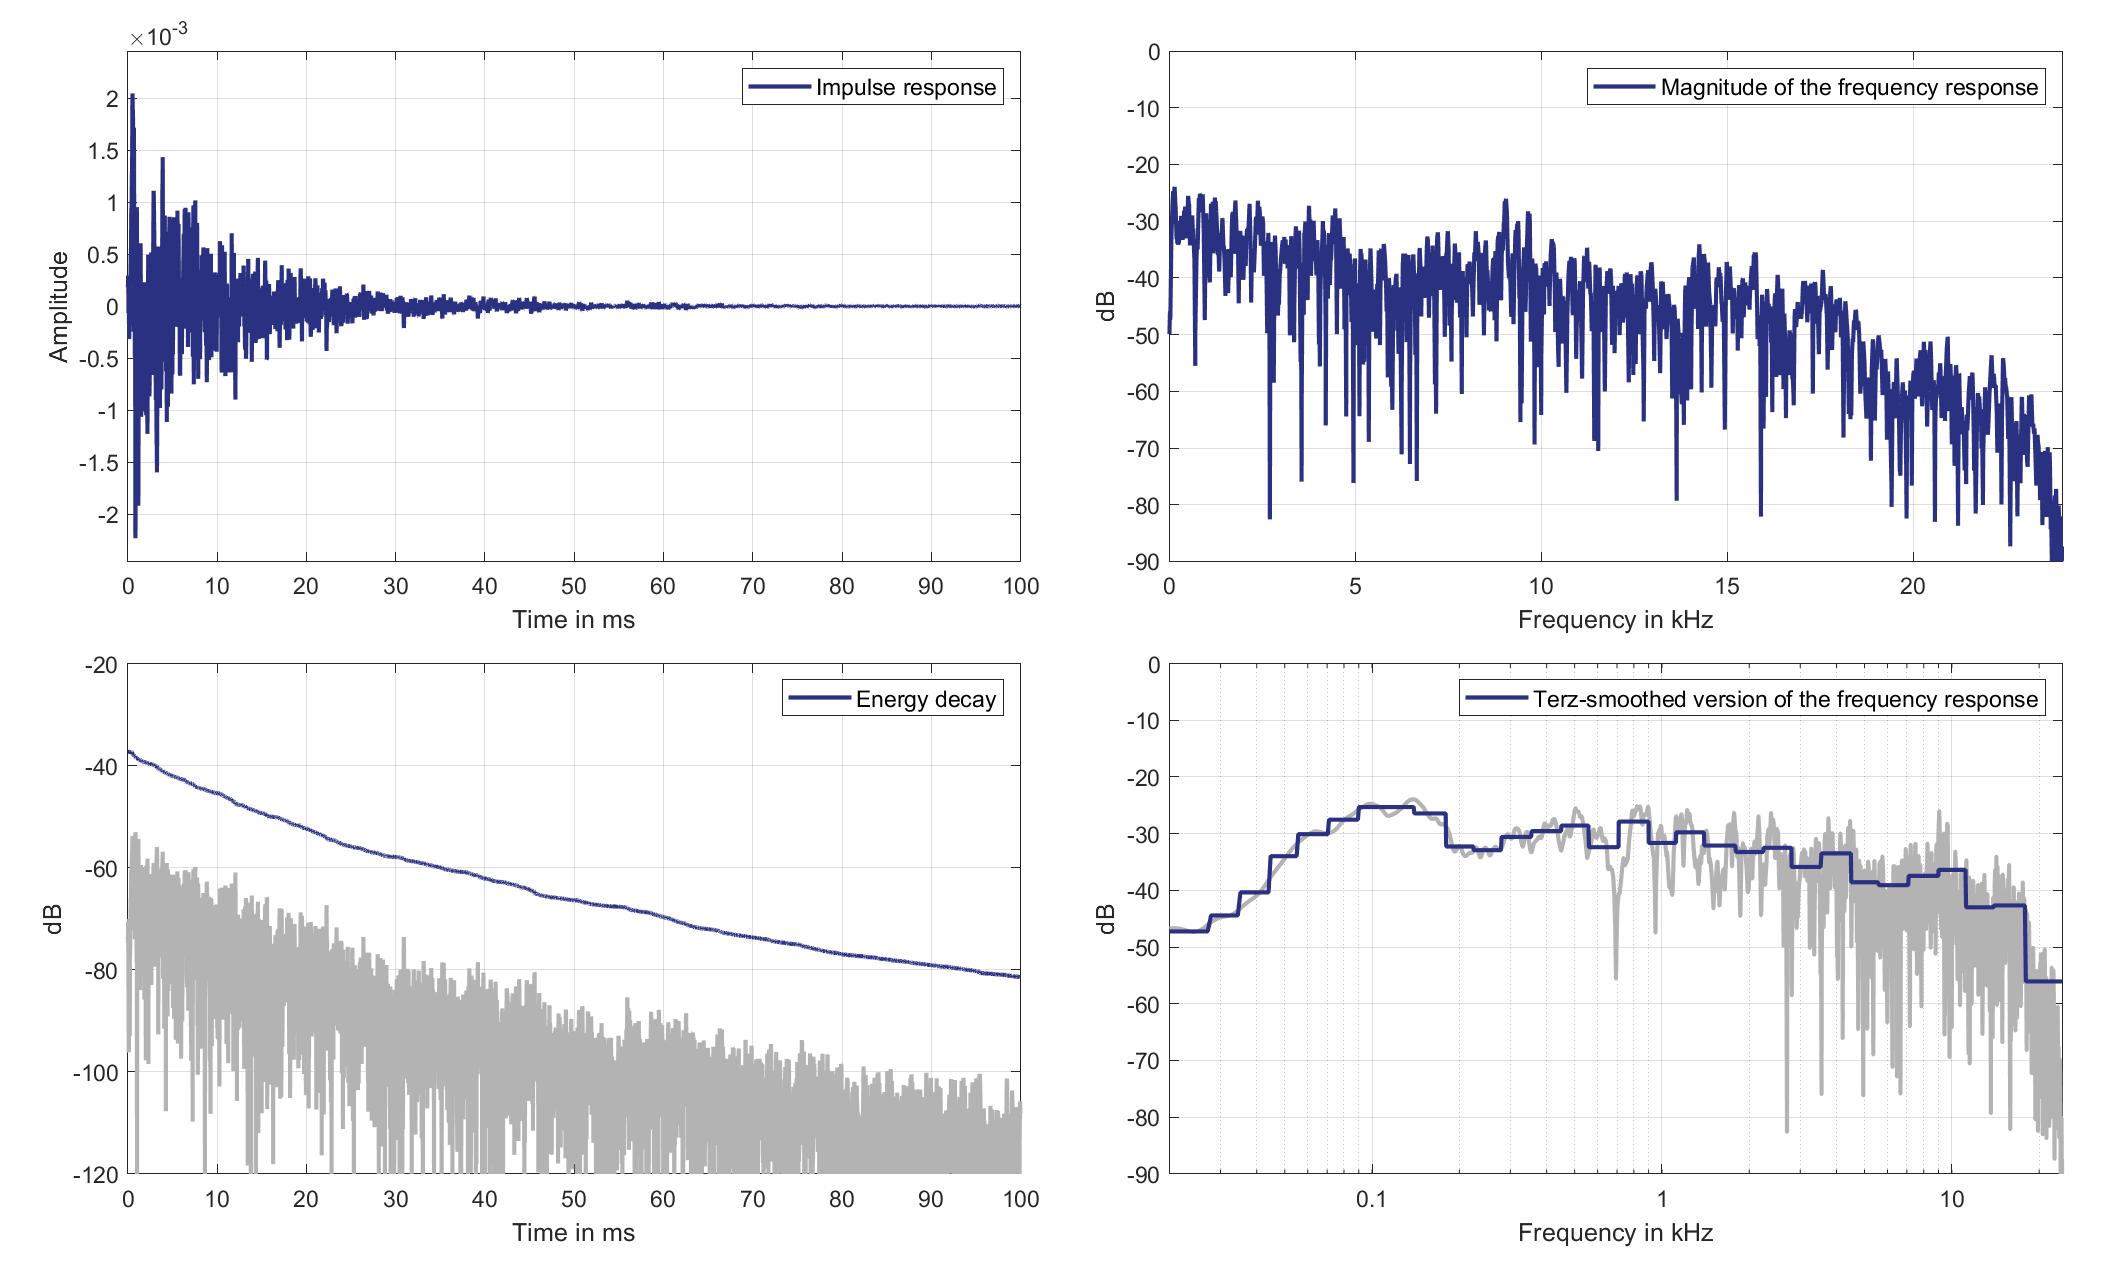
Download impulse response (in ".fir" format).
In the download section you can download all impulse response files as well as format explanation and Matlab as well as Python code examples for loading fir files.
Mics. 25/26
Left Ear Microphone
Mouth Loudspeaker of Zone 3 (Lsp. 14) to Left Ear Microphone of Zone 5 (Mic. 25)
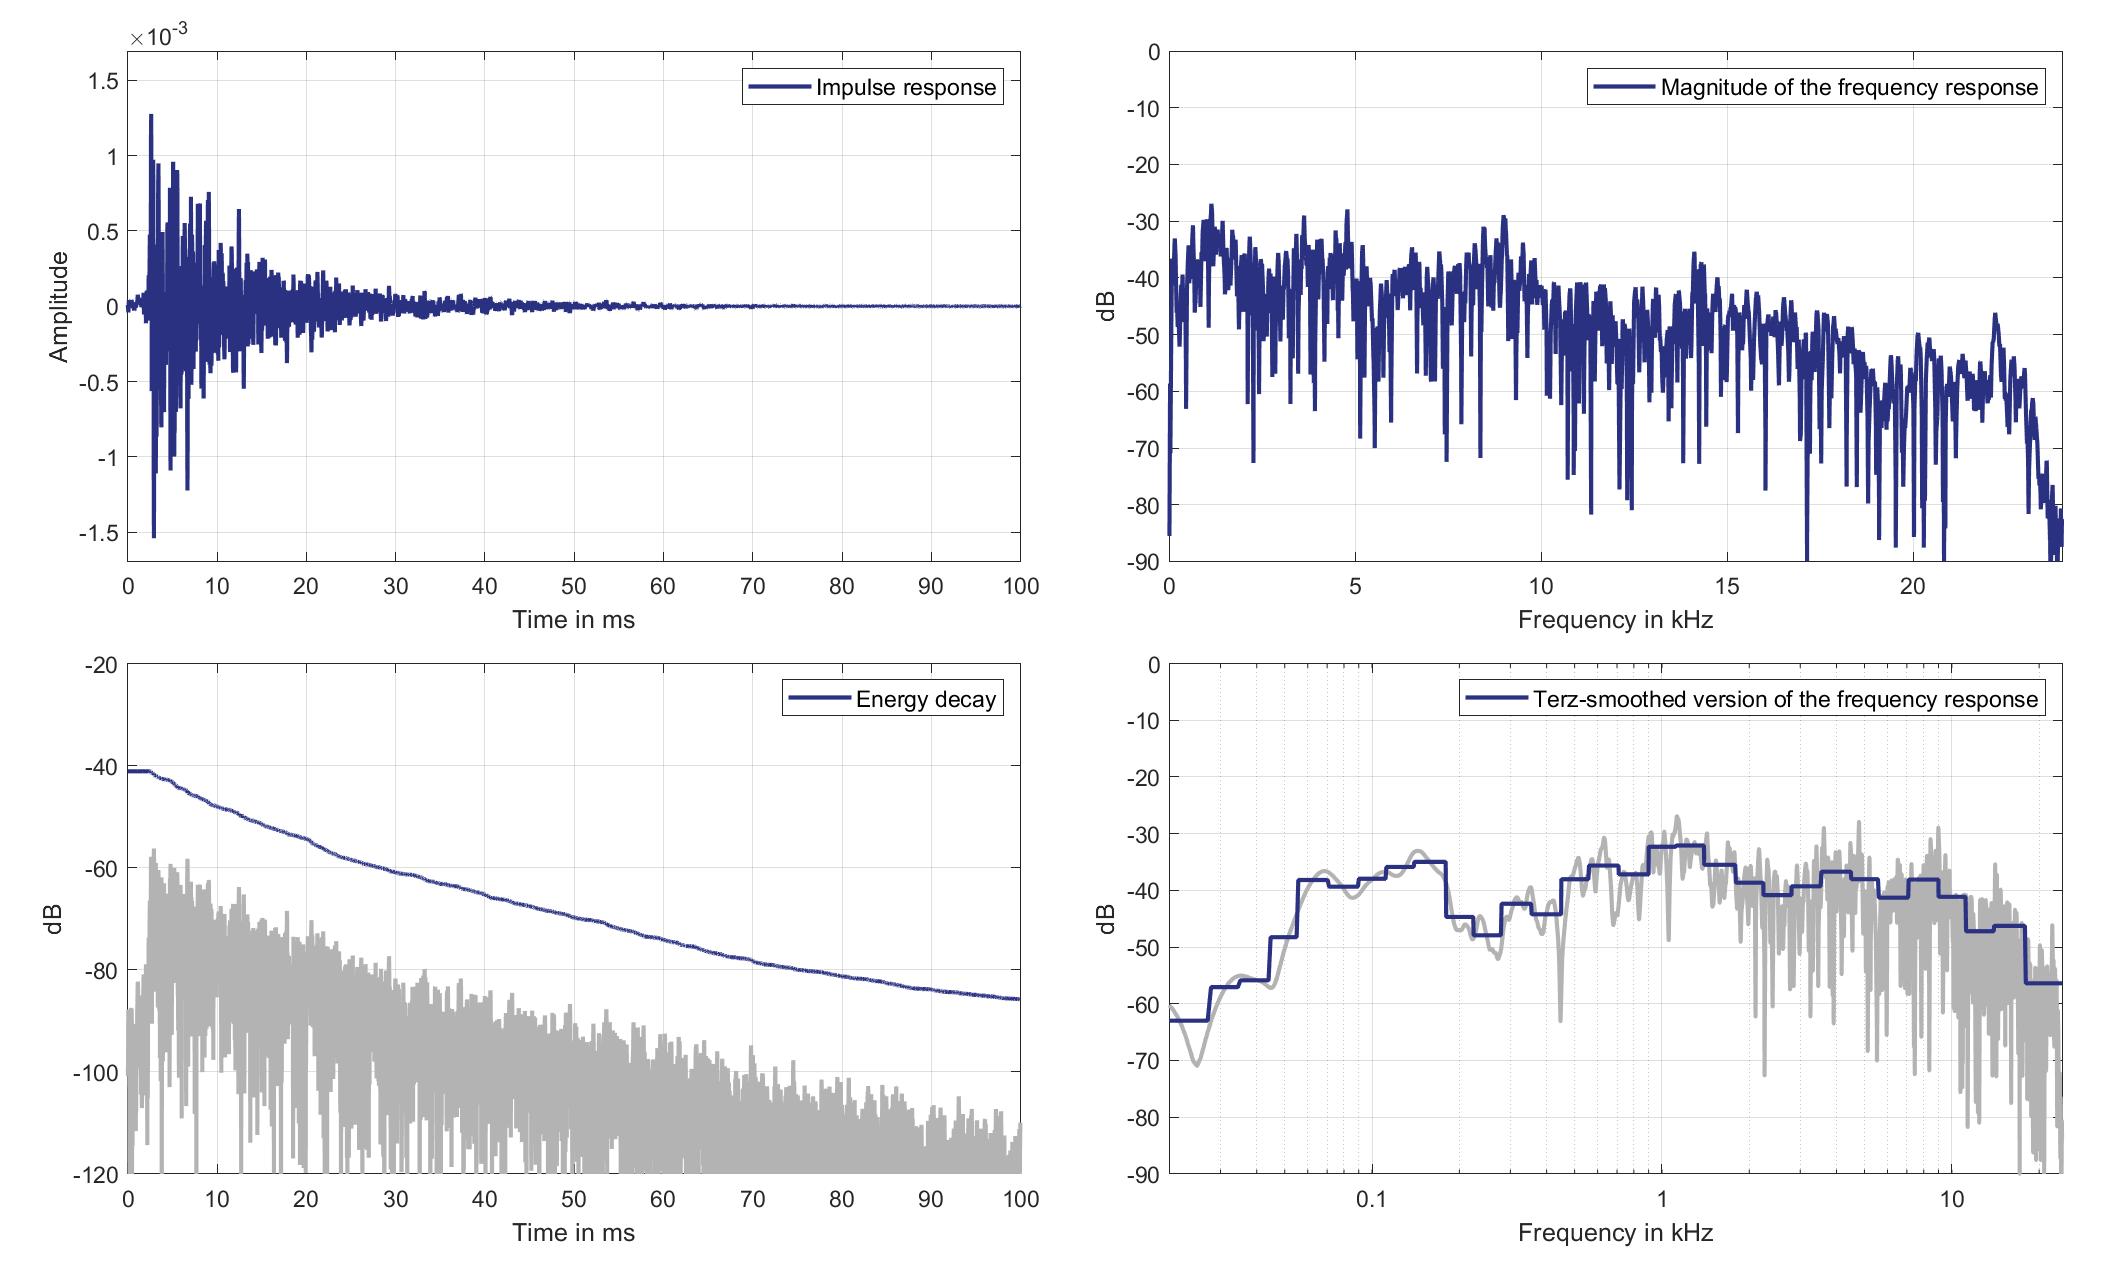
Download impulse response (in ".fir" format).
In the download section you can download all impulse response files as well as format explanation and Matlab as well as Python code examples for loading fir files.
Right Ear Microphone
Mouth Loudspeaker of Zone 3 (Lsp. 14) to Right Ear Microphone of Zone 5 (Mic. 26)
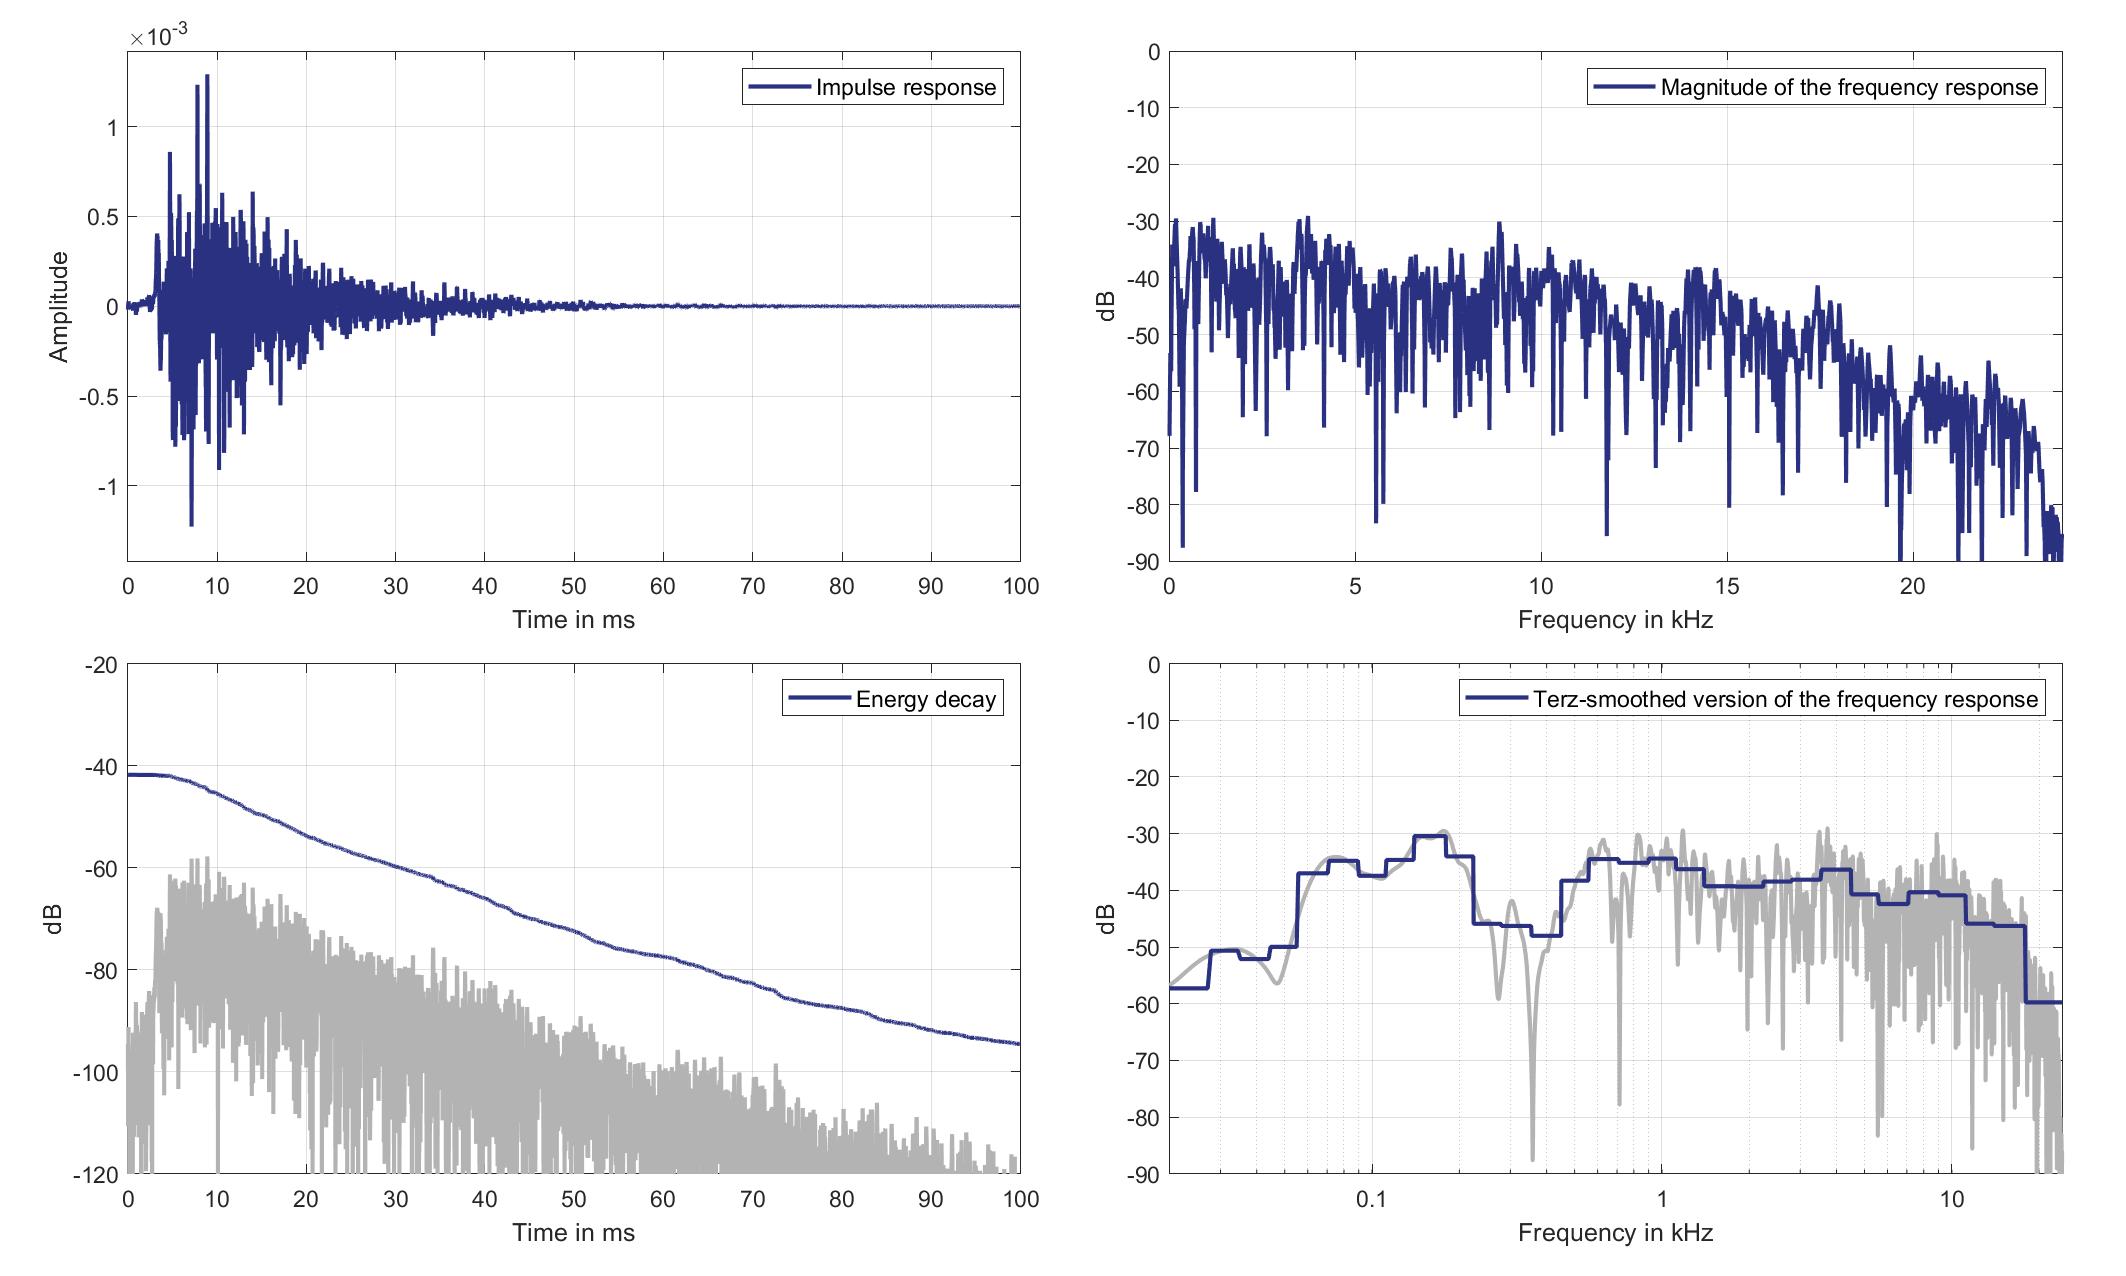
Download impulse response (in ".fir" format).
In the download section you can download all impulse response files as well as format explanation and Matlab as well as Python code examples for loading fir files.
Mics. 27/28
Left Ear Microphone
Mouth Loudspeaker of Zone 3 (Lsp. 14) to Left Ear Microphone of Zone 6 (Mic. 27)
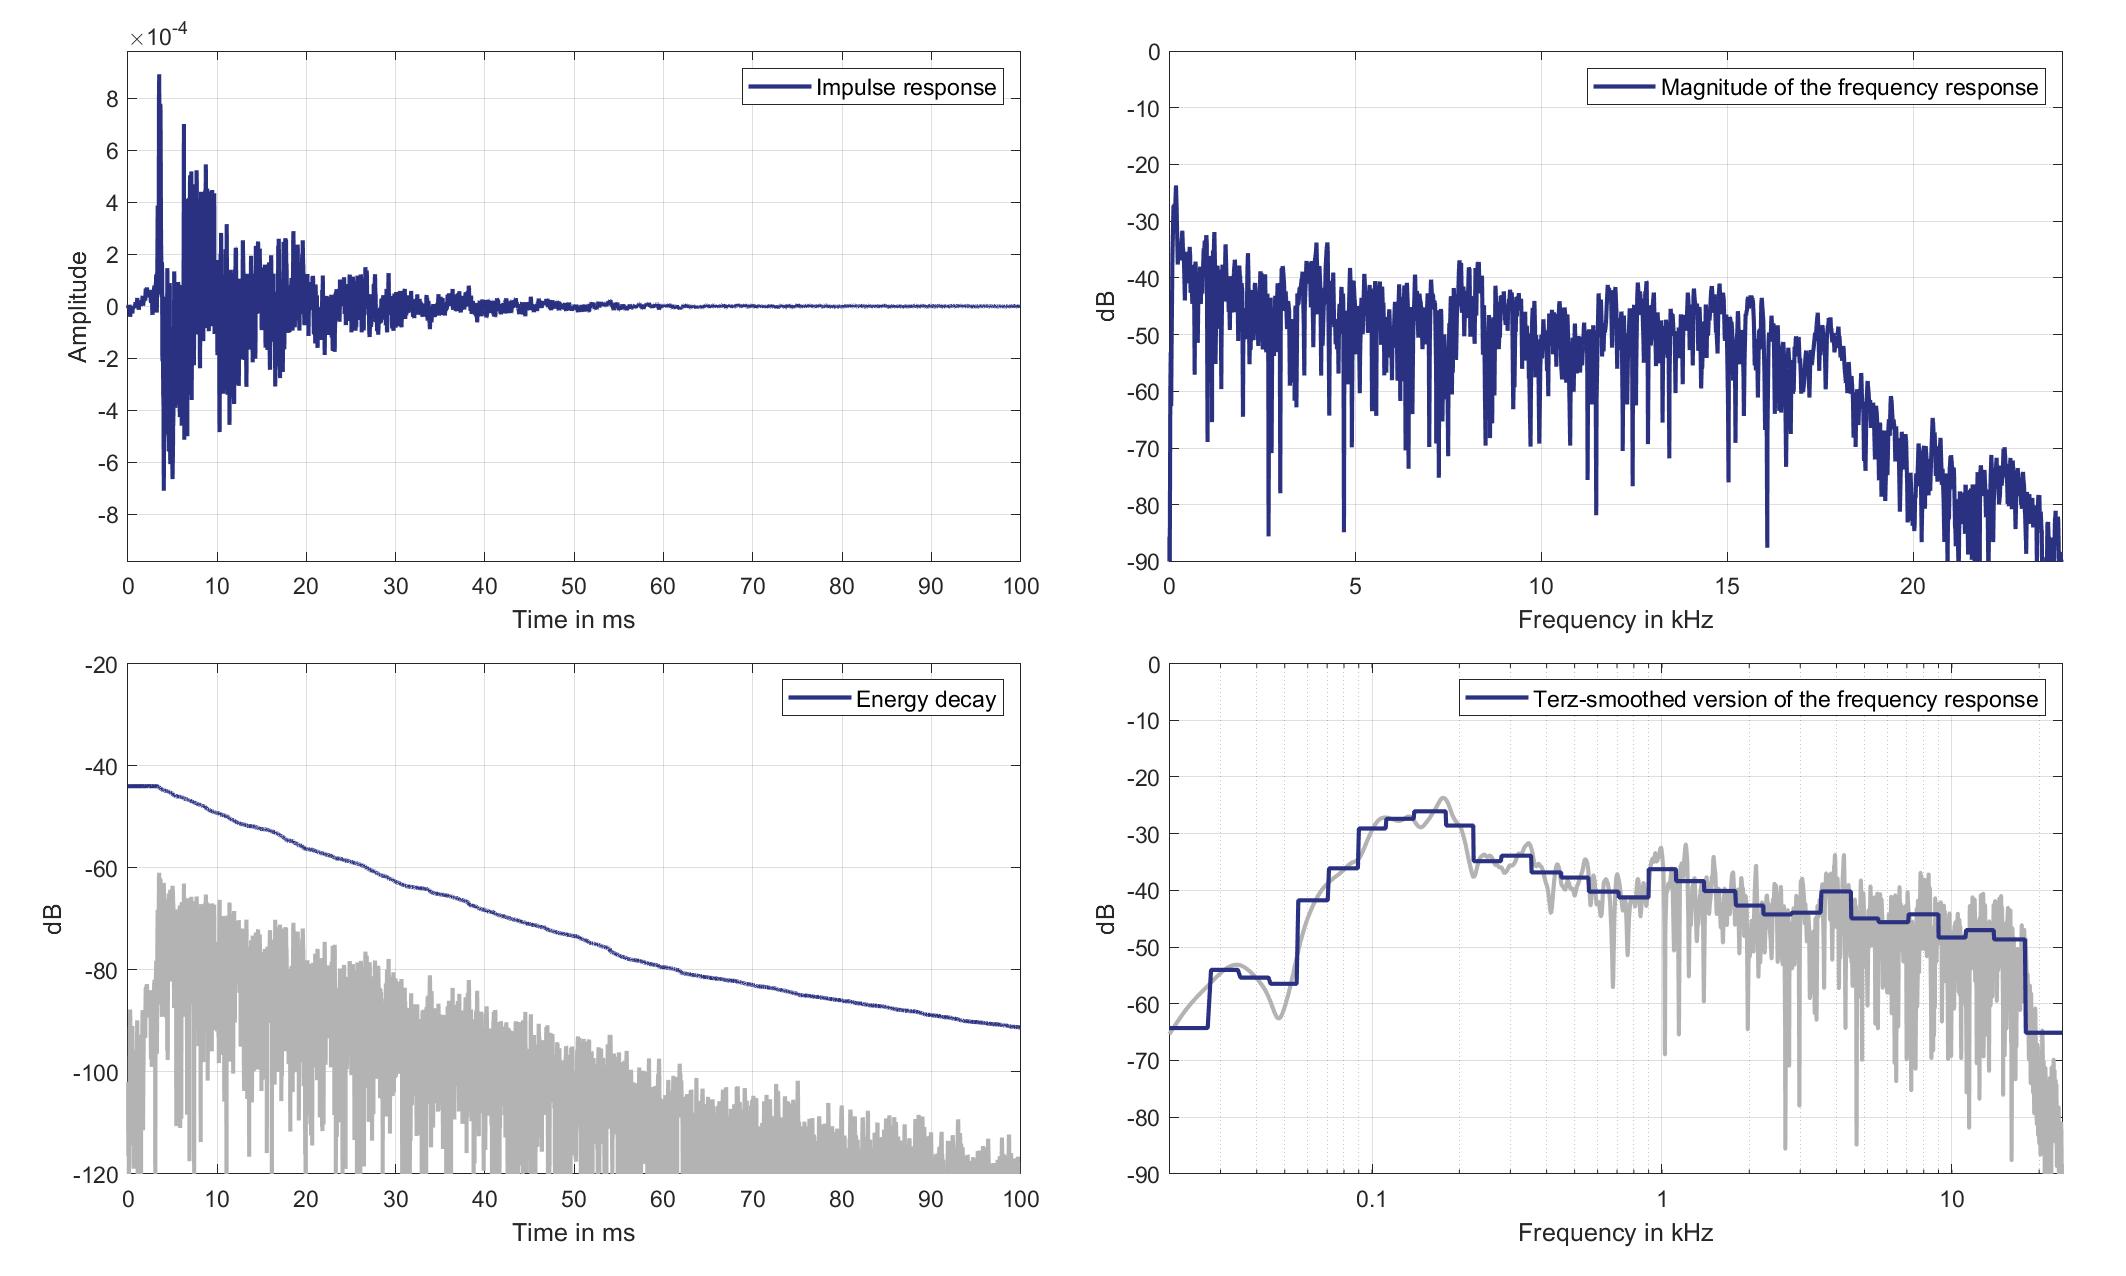
Download impulse response (in ".fir" format).
In the download section you can download all impulse response files as well as format explanation and Matlab as well as Python code examples for loading fir files.
Right Ear Microphone
Mouth Loudspeaker of Zone 3 (Lsp. 14) to Right Ear Microphone of Zone 6 (Mic. 28)
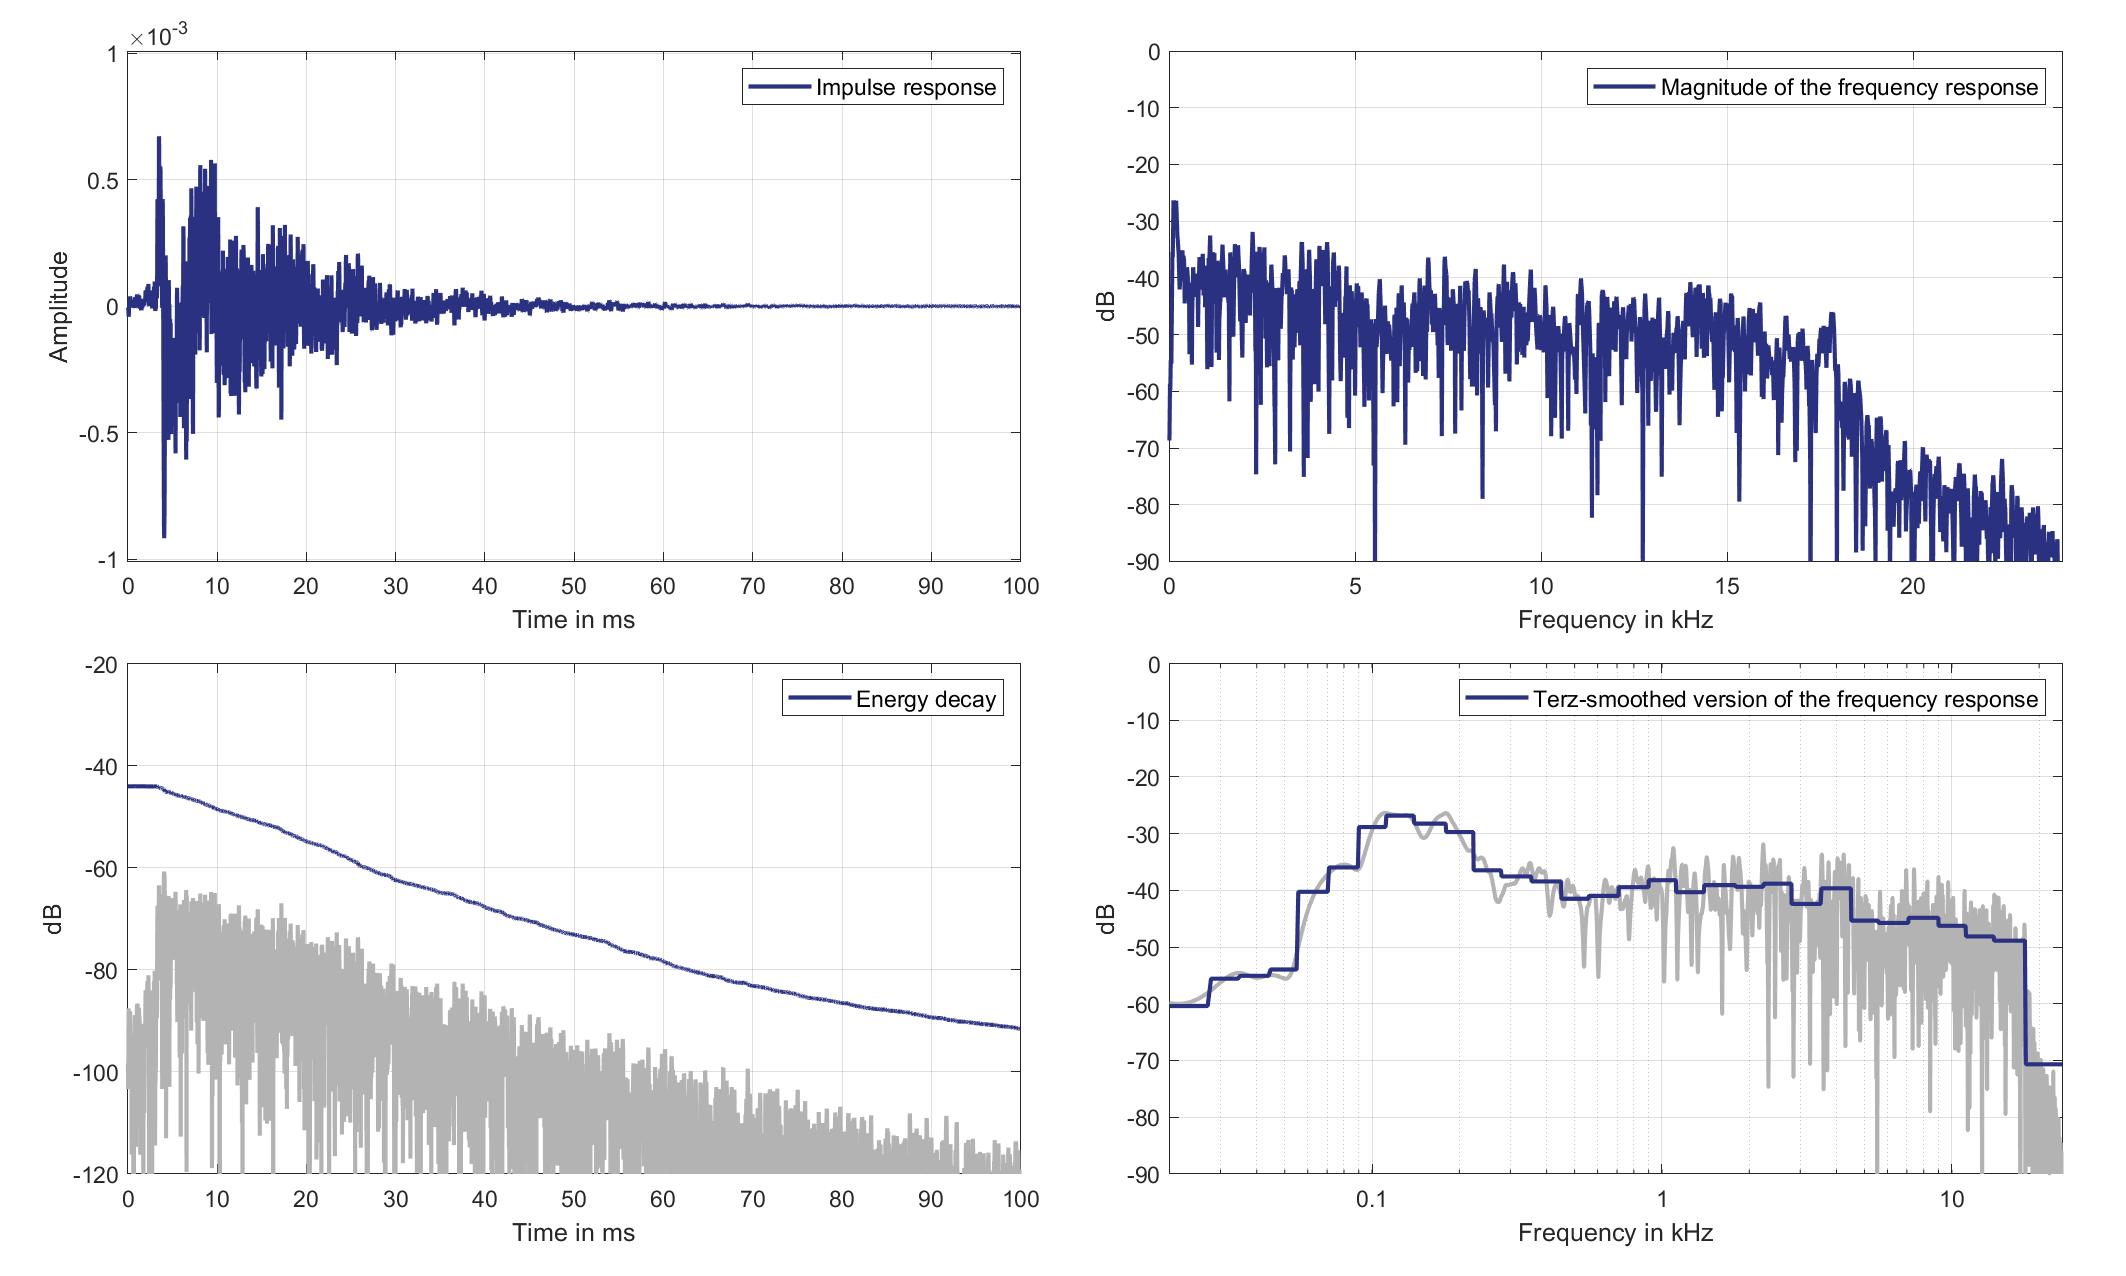
Download impulse response (in ".fir" format).
In the download section you can download all impulse response files as well as format explanation and Matlab as well as Python code examples for loading fir files.
Mics. 29/30
Left Ear Microphone
Mouth Loudspeaker of Zone 3 (Lsp. 14) to Left Ear Microphone of Zone 8 (Mic. 29)
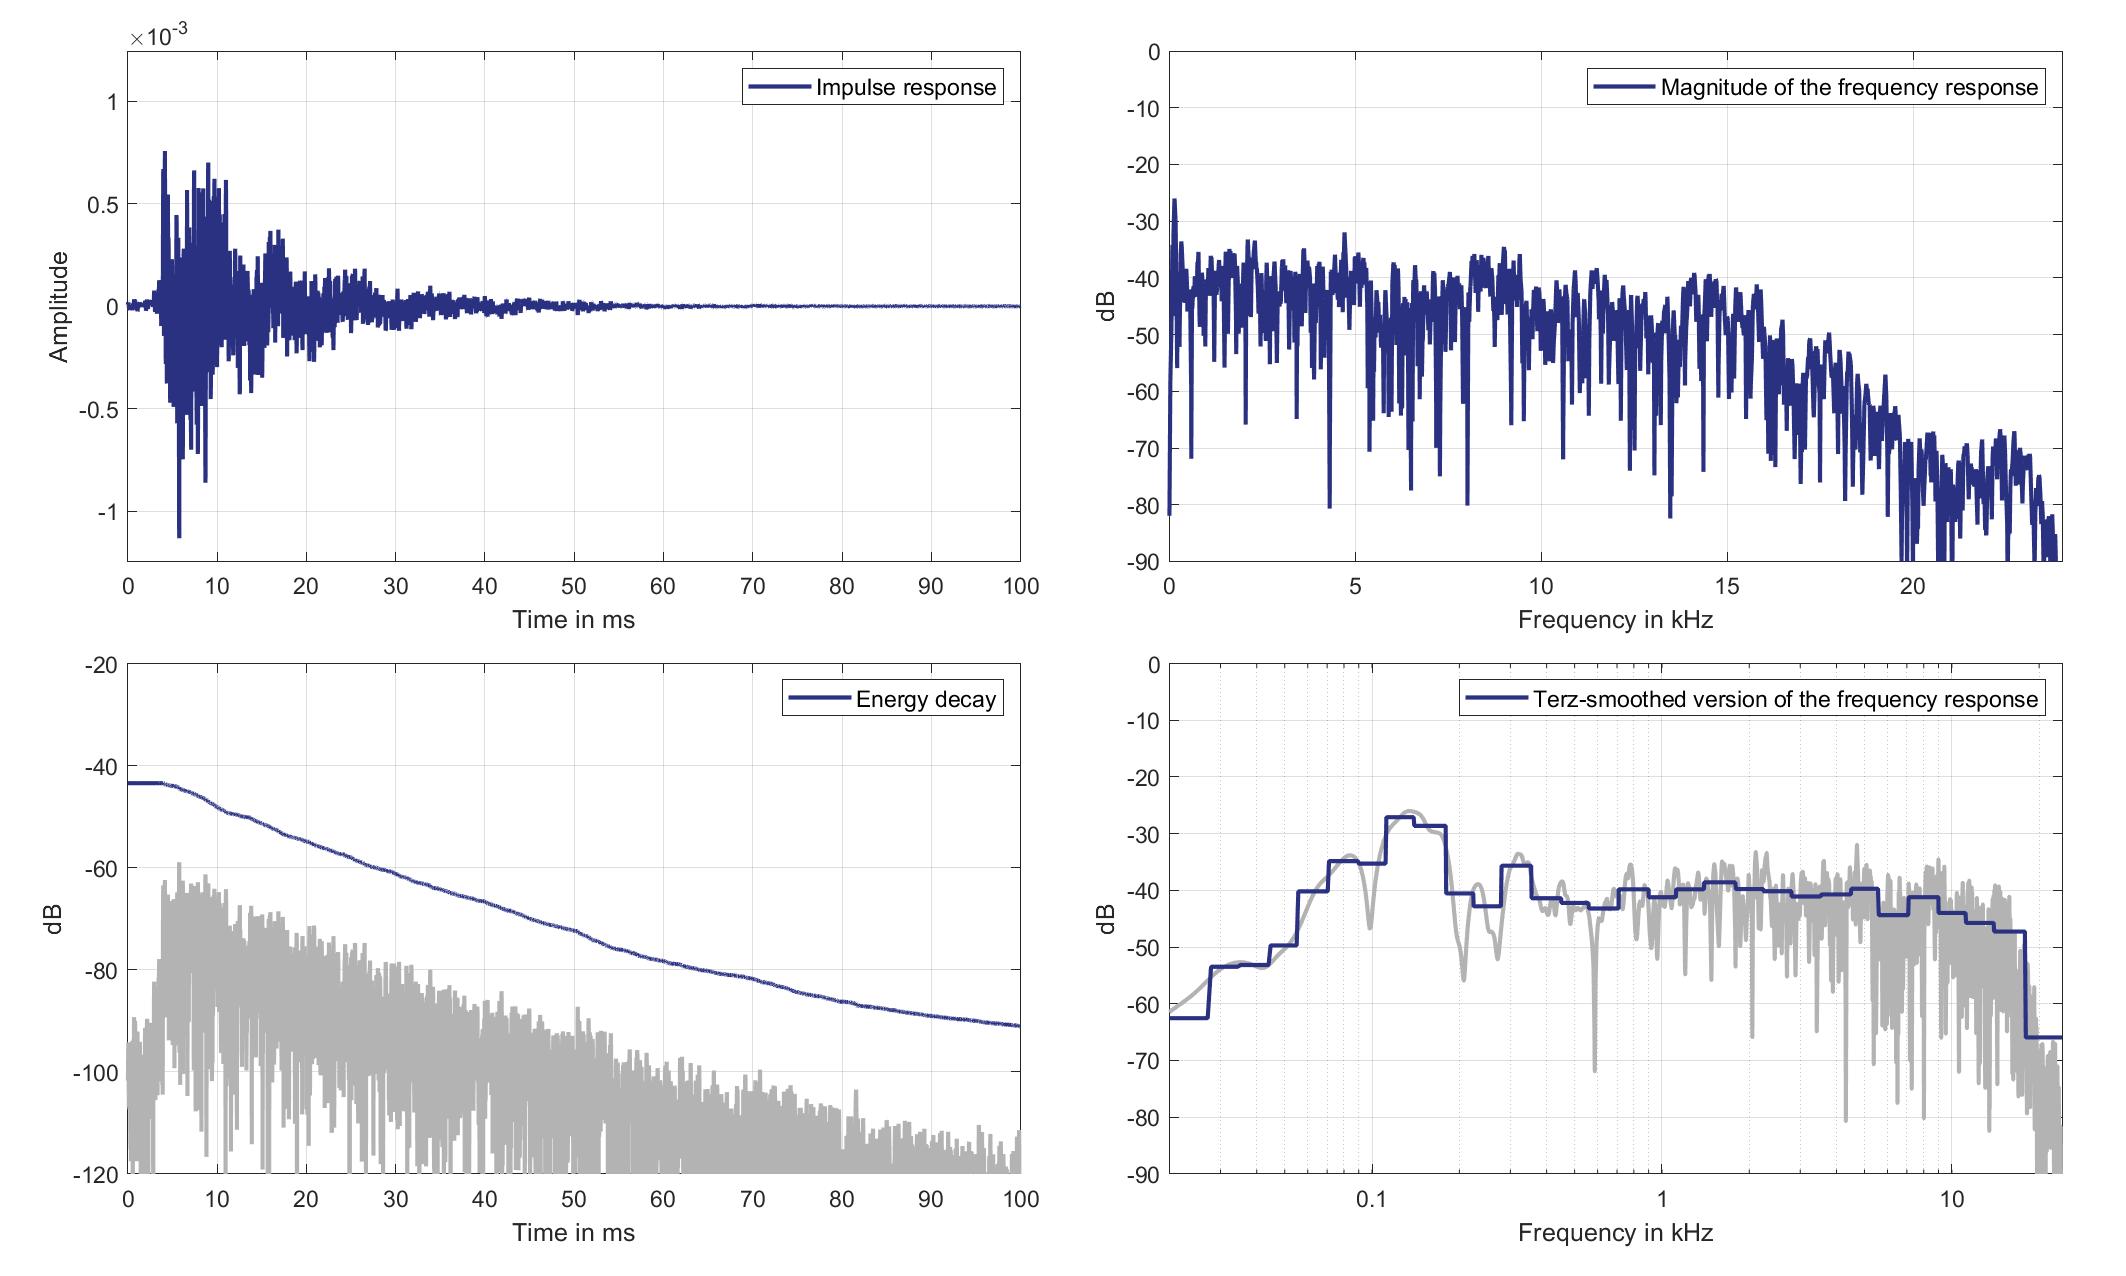
Download impulse response (in ".fir" format).
In the download section you can download all impulse response files as well as format explanation and Matlab as well as Python code examples for loading fir files.
Right Ear Microphone
Mouth Loudspeaker of Zone 3 (Lsp. 14) to Right Ear Microphone of Zone 8 (Mic. 30)
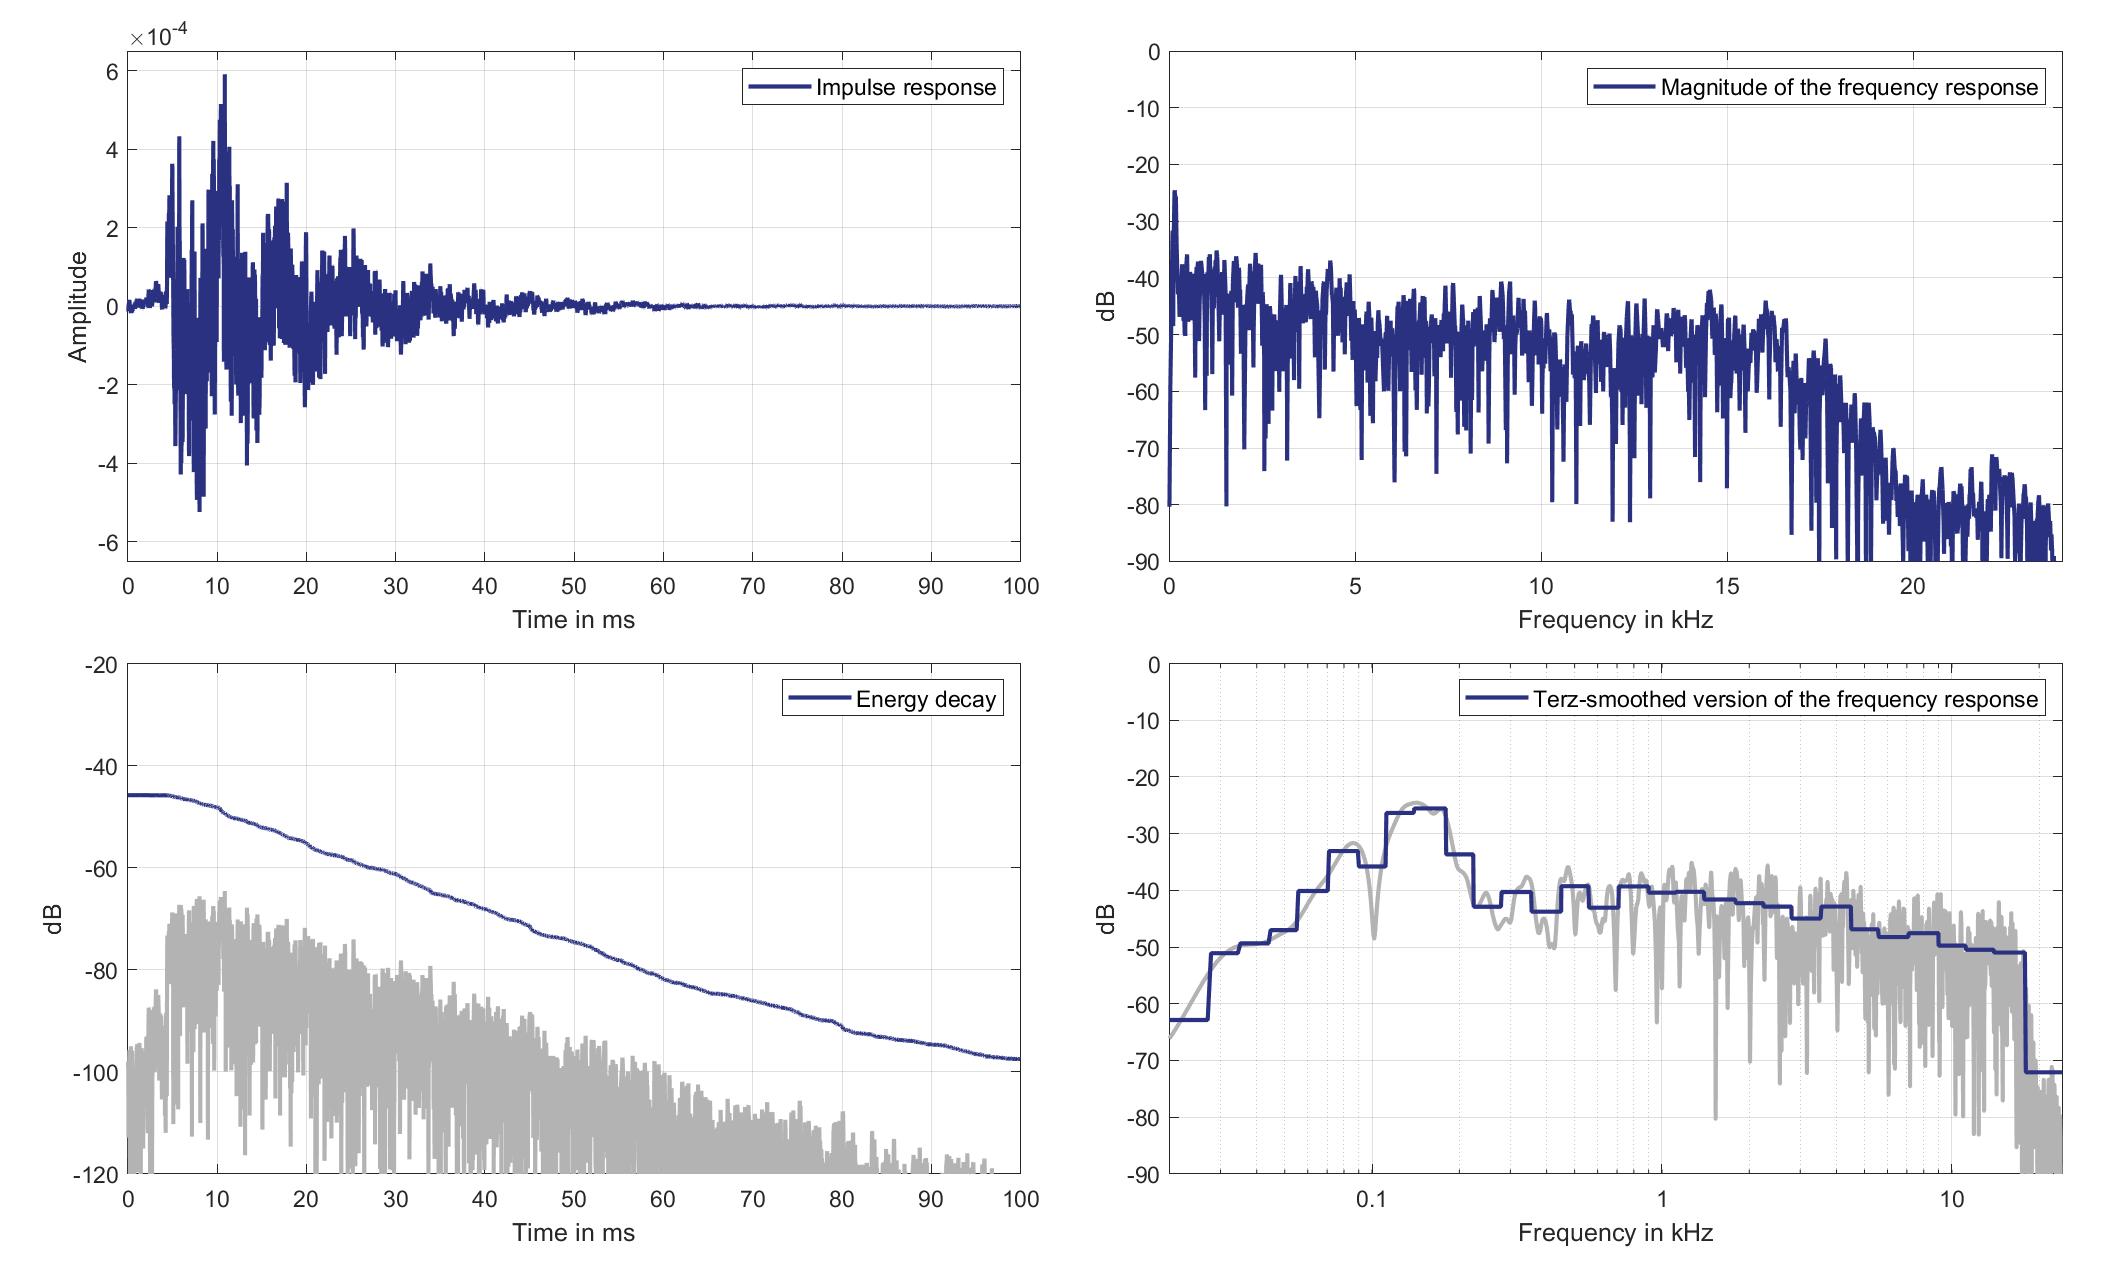
Download impulse response (in ".fir" format).
In the download section you can download all impulse response files as well as format explanation and Matlab as well as Python code examples for loading fir files.
Lsp. 15
Mics. 19/20
Left Ear Microphone
Mouth Loudspeaker of Zone 5 (Lsp. 15) to Left Ear Microphone of Zone 1 (Mic. 19)
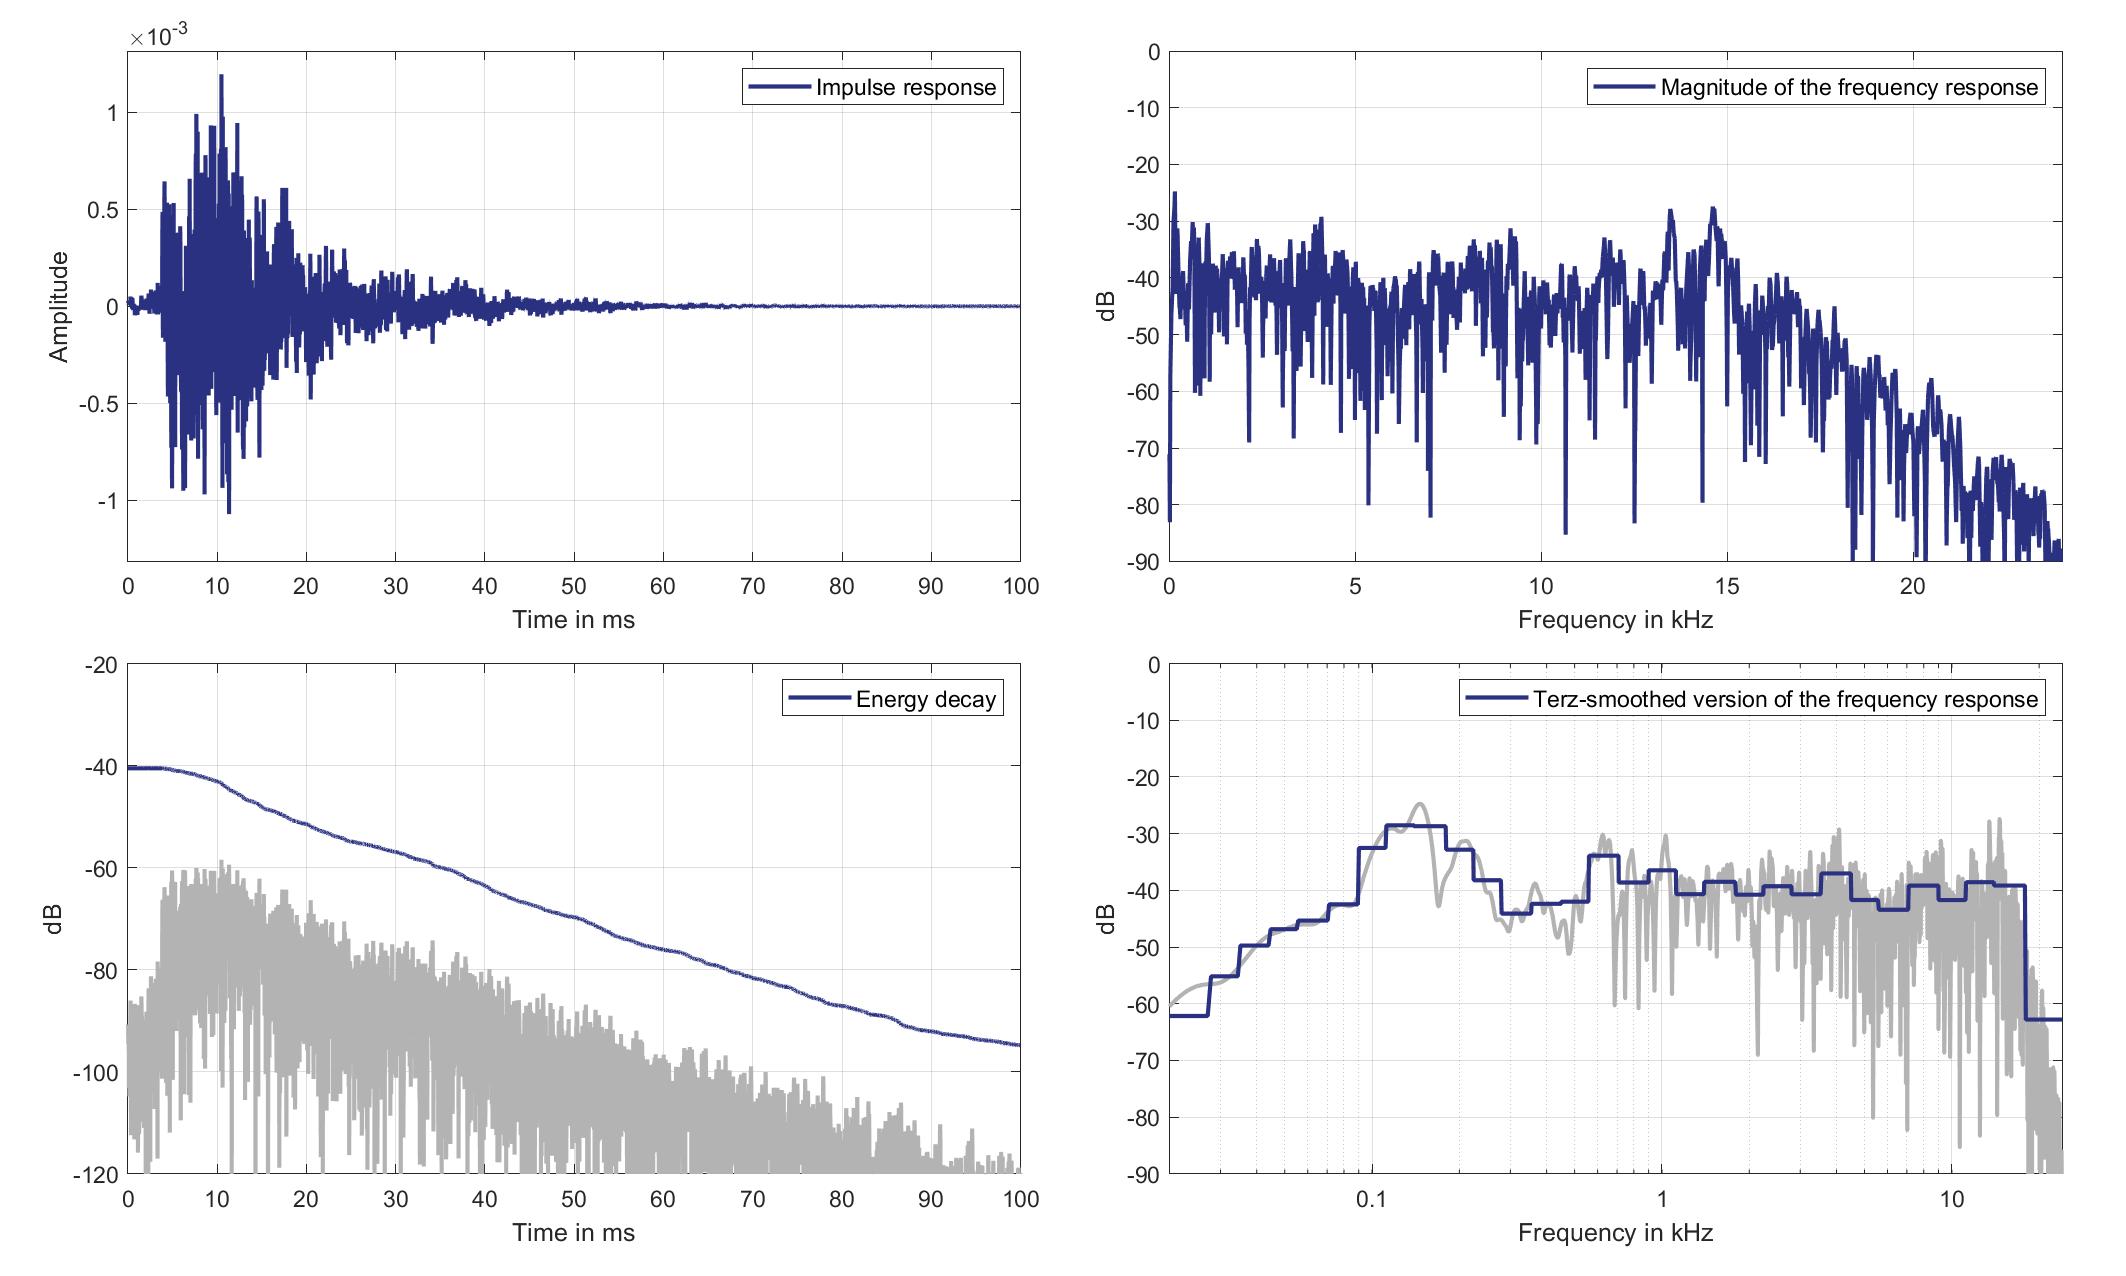
Download impulse response (in ".fir" format).
In the download section you can download all impulse response files as well as format explanation and Matlab as well as Python code examples for loading fir files.
Right Ear Microphone
Mouth Loudspeaker of Zone 5 (Lsp. 15) to Right Ear Microphone of Zone 1 (Mic. 20)
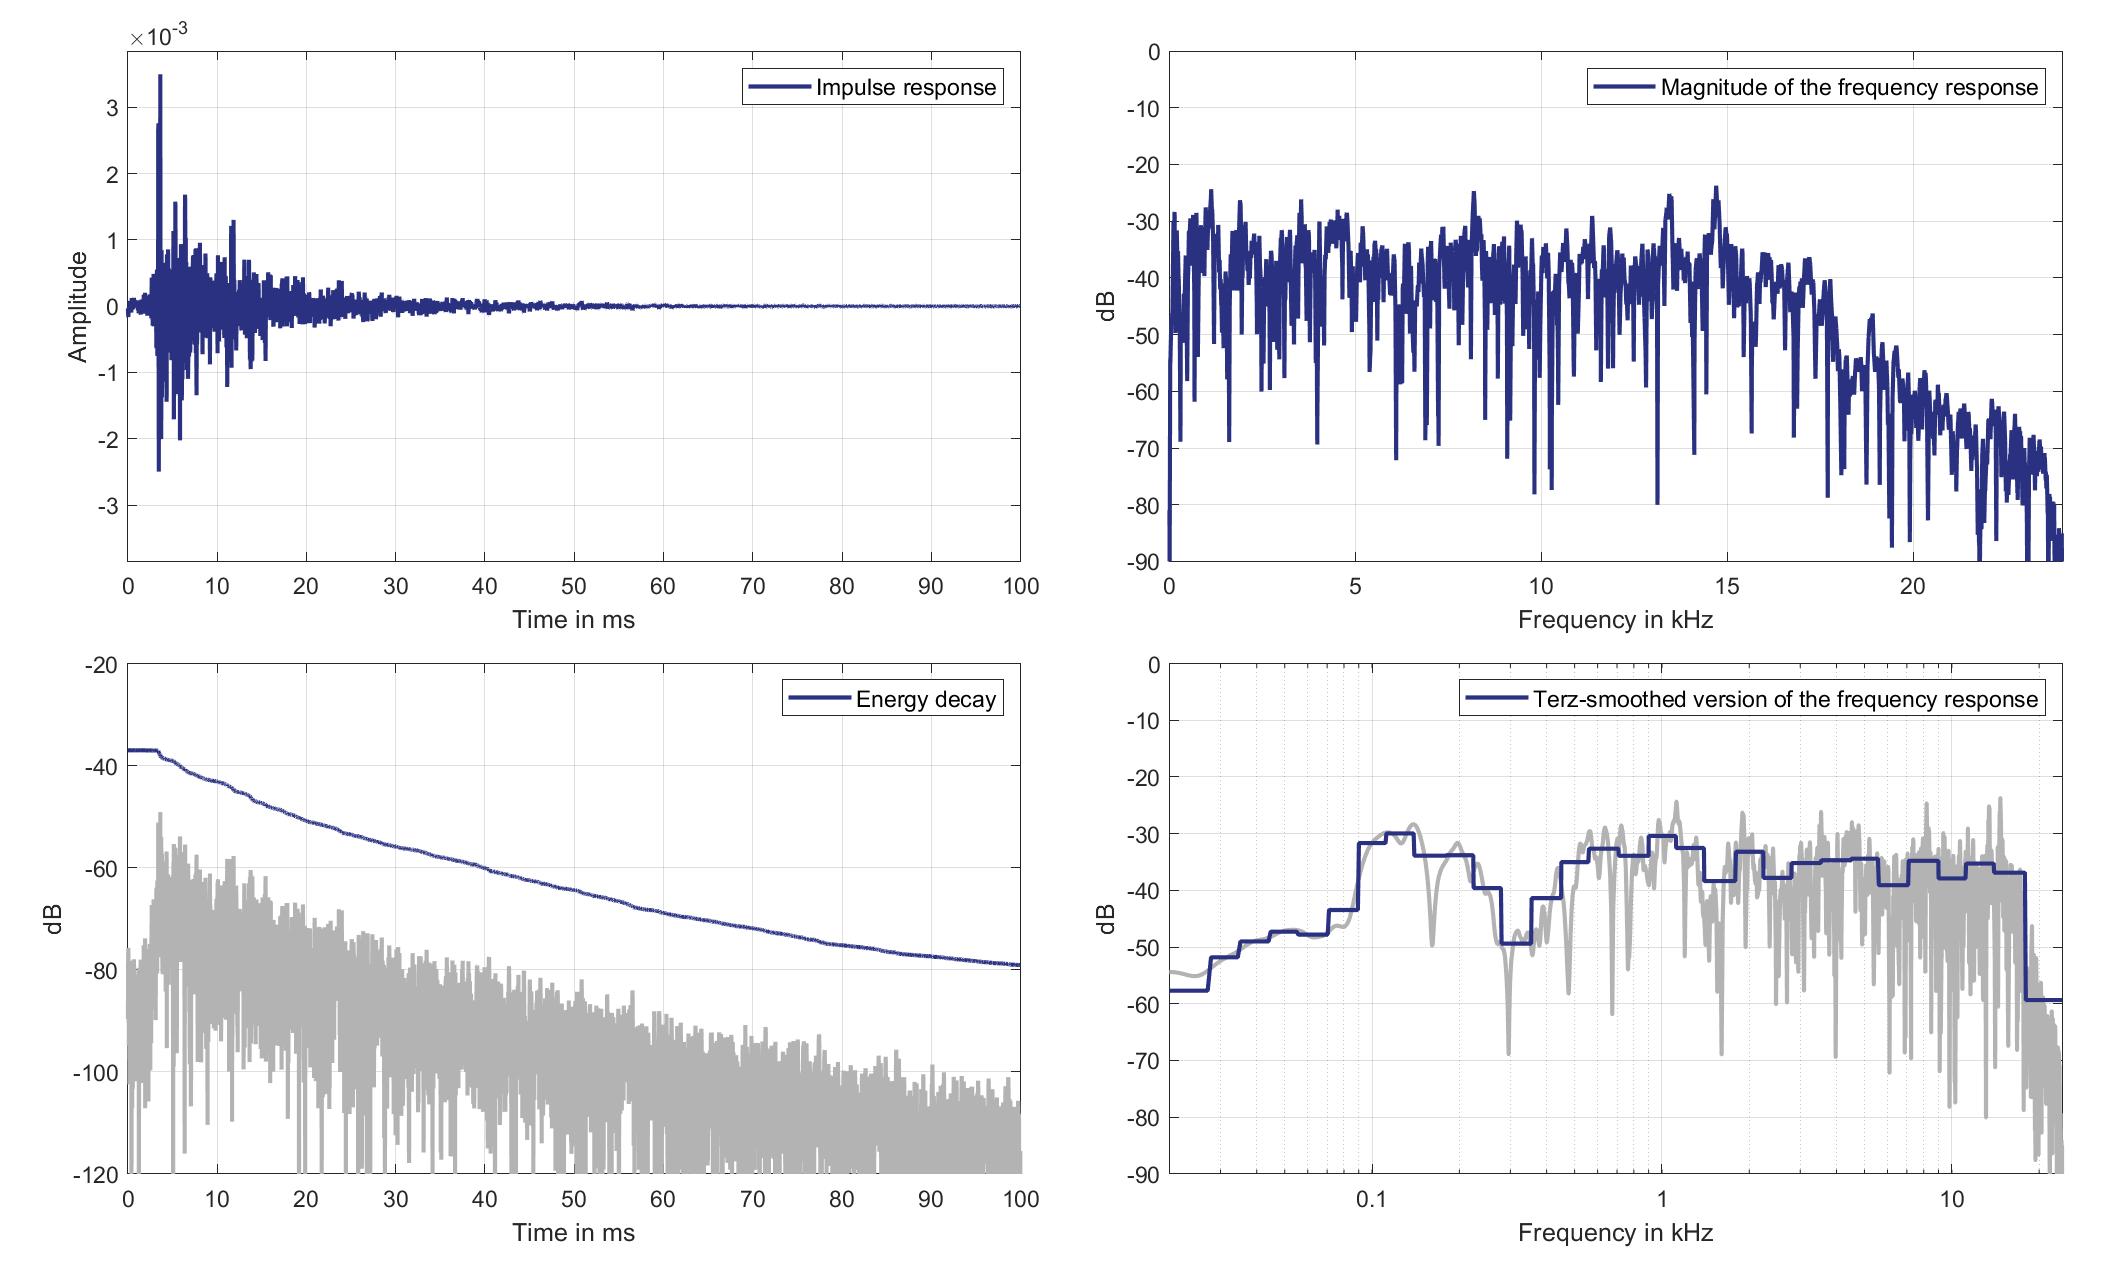
Download impulse response (in ".fir" format).
In the download section you can download all impulse response files as well as format explanation and Matlab as well as Python code examples for loading fir files.
Mics. 21/22
Left Ear Microphone
Mouth Loudspeaker of Zone 5 (Lsp. 15) to Left Ear Microphone of Zone 2 (Mic. 21)
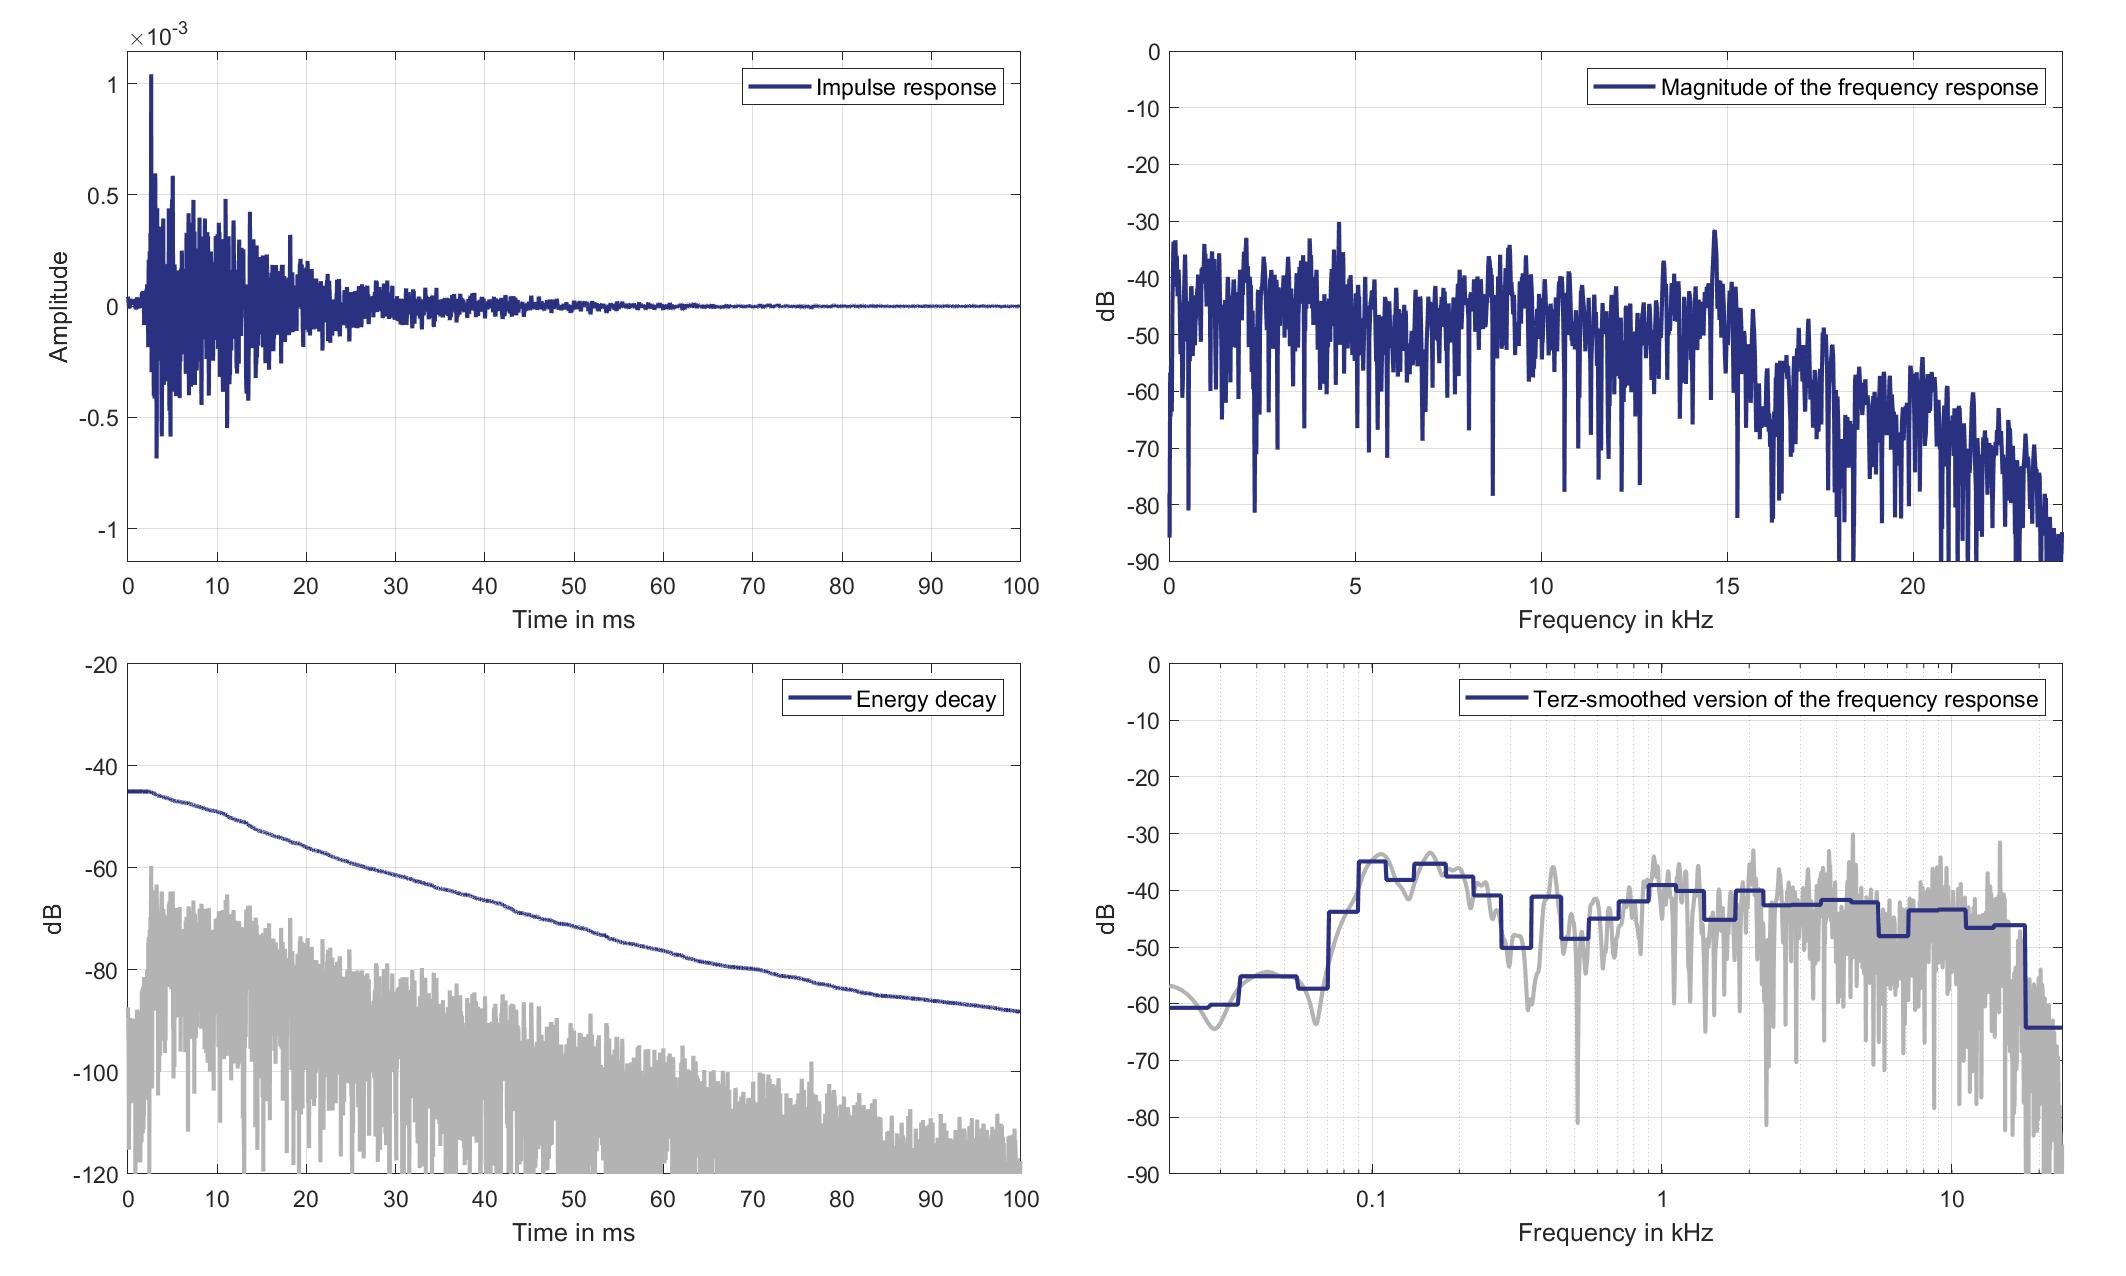
Download impulse response (in ".fir" format).
In the download section you can download all impulse response files as well as format explanation and Matlab as well as Python code examples for loading fir files.
Right Ear Microphone
Mouth Loudspeaker of Zone 5 (Lsp. 15) to Right Ear Microphone of Zone 2 (Mic. 22)
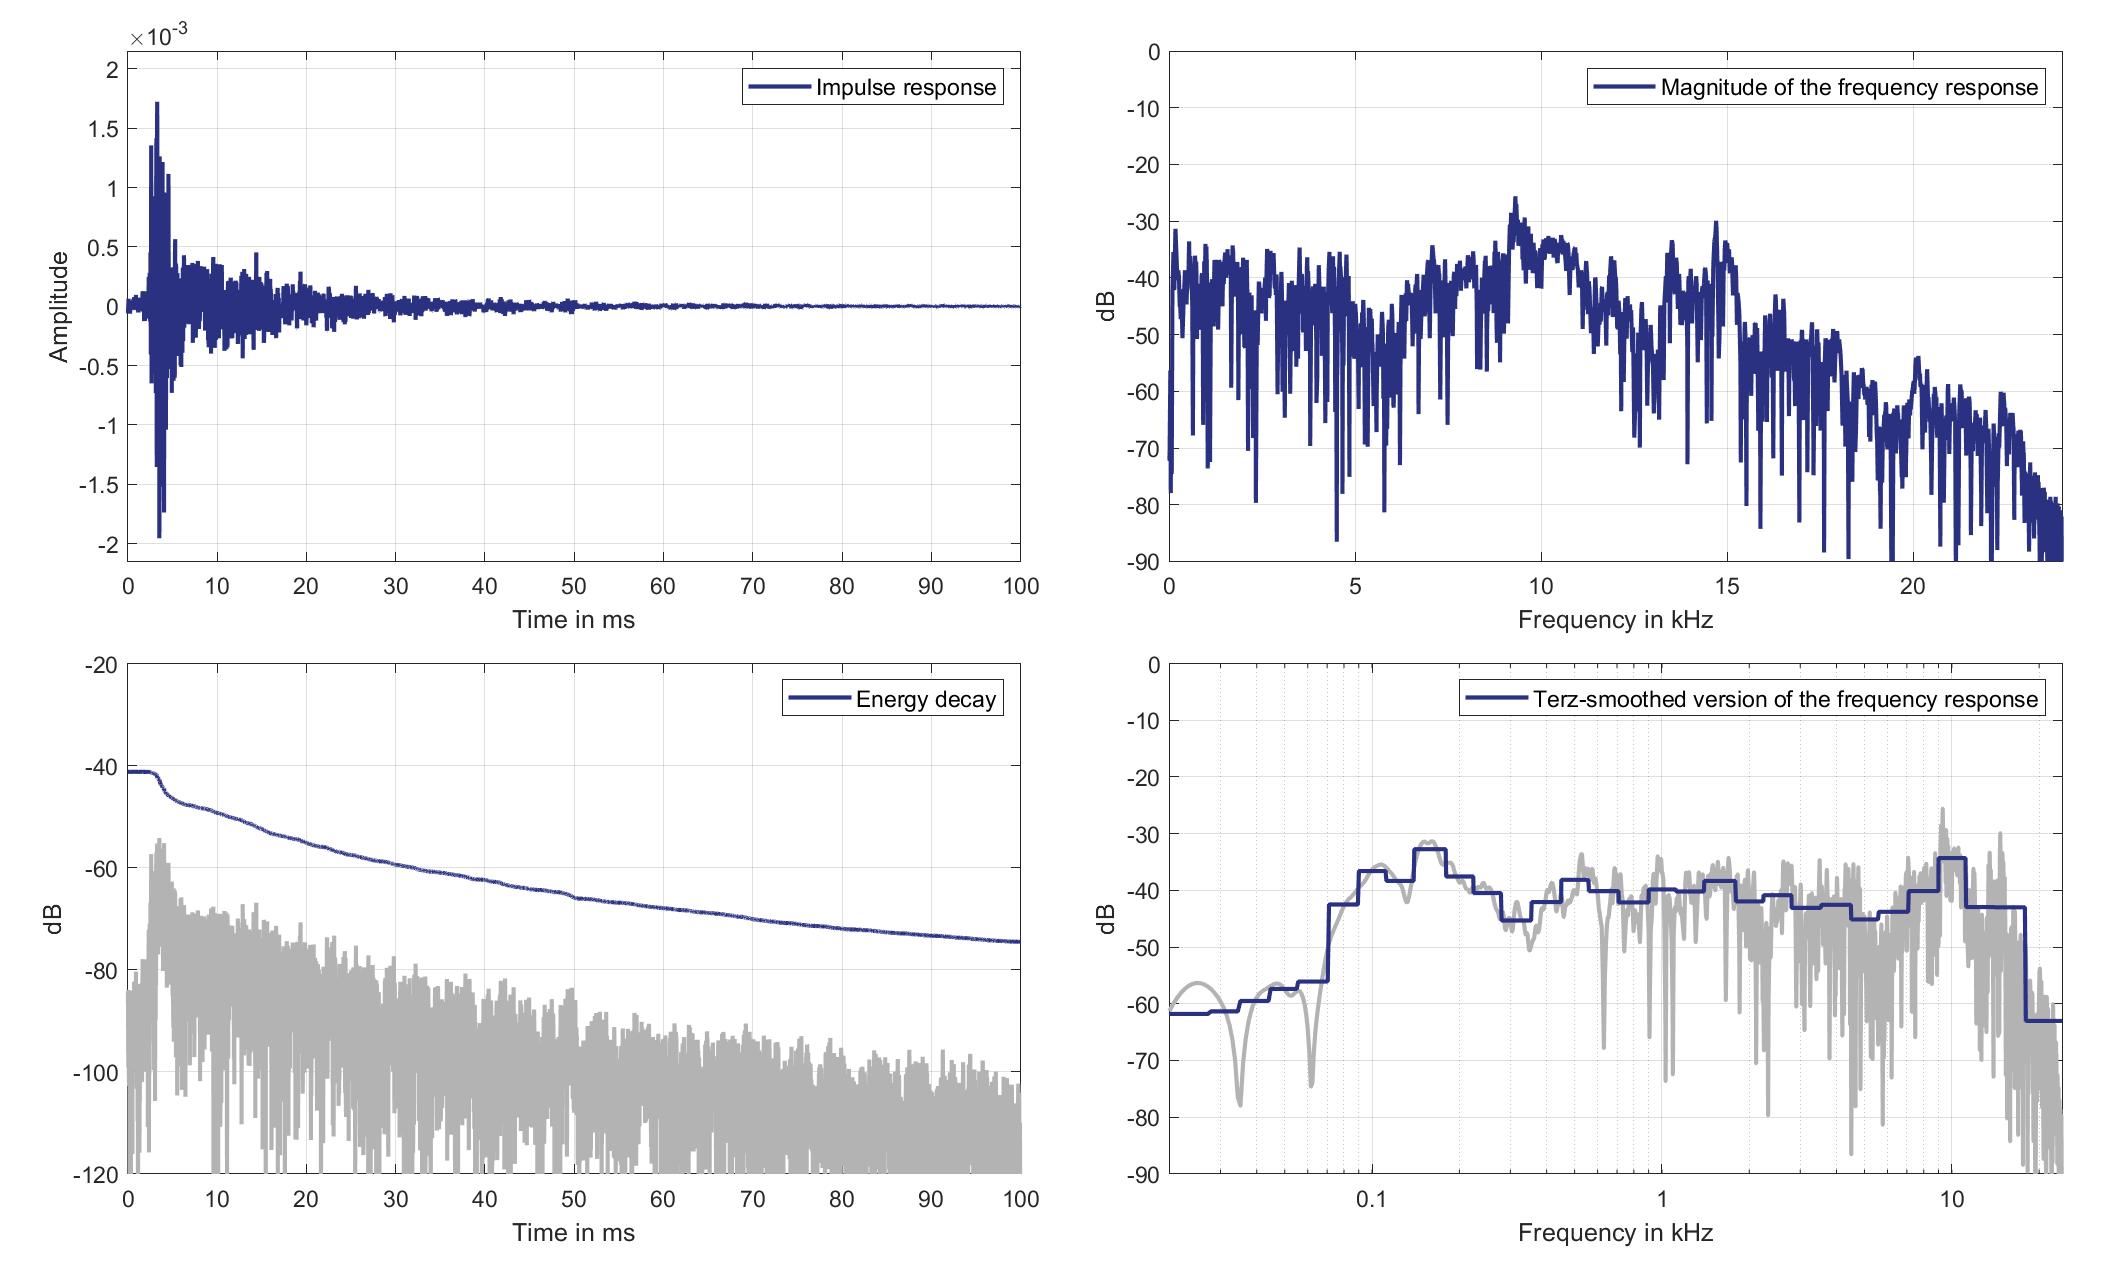
Download impulse response (in ".fir" format).
In the download section you can download all impulse response files as well as format explanation and Matlab as well as Python code examples for loading fir files.
Mics. 23/24
Left Ear Microphone
Mouth Loudspeaker of Zone 5 (Lsp. 15) to Left Ear Microphone of Zone 3 (Mic. 23)
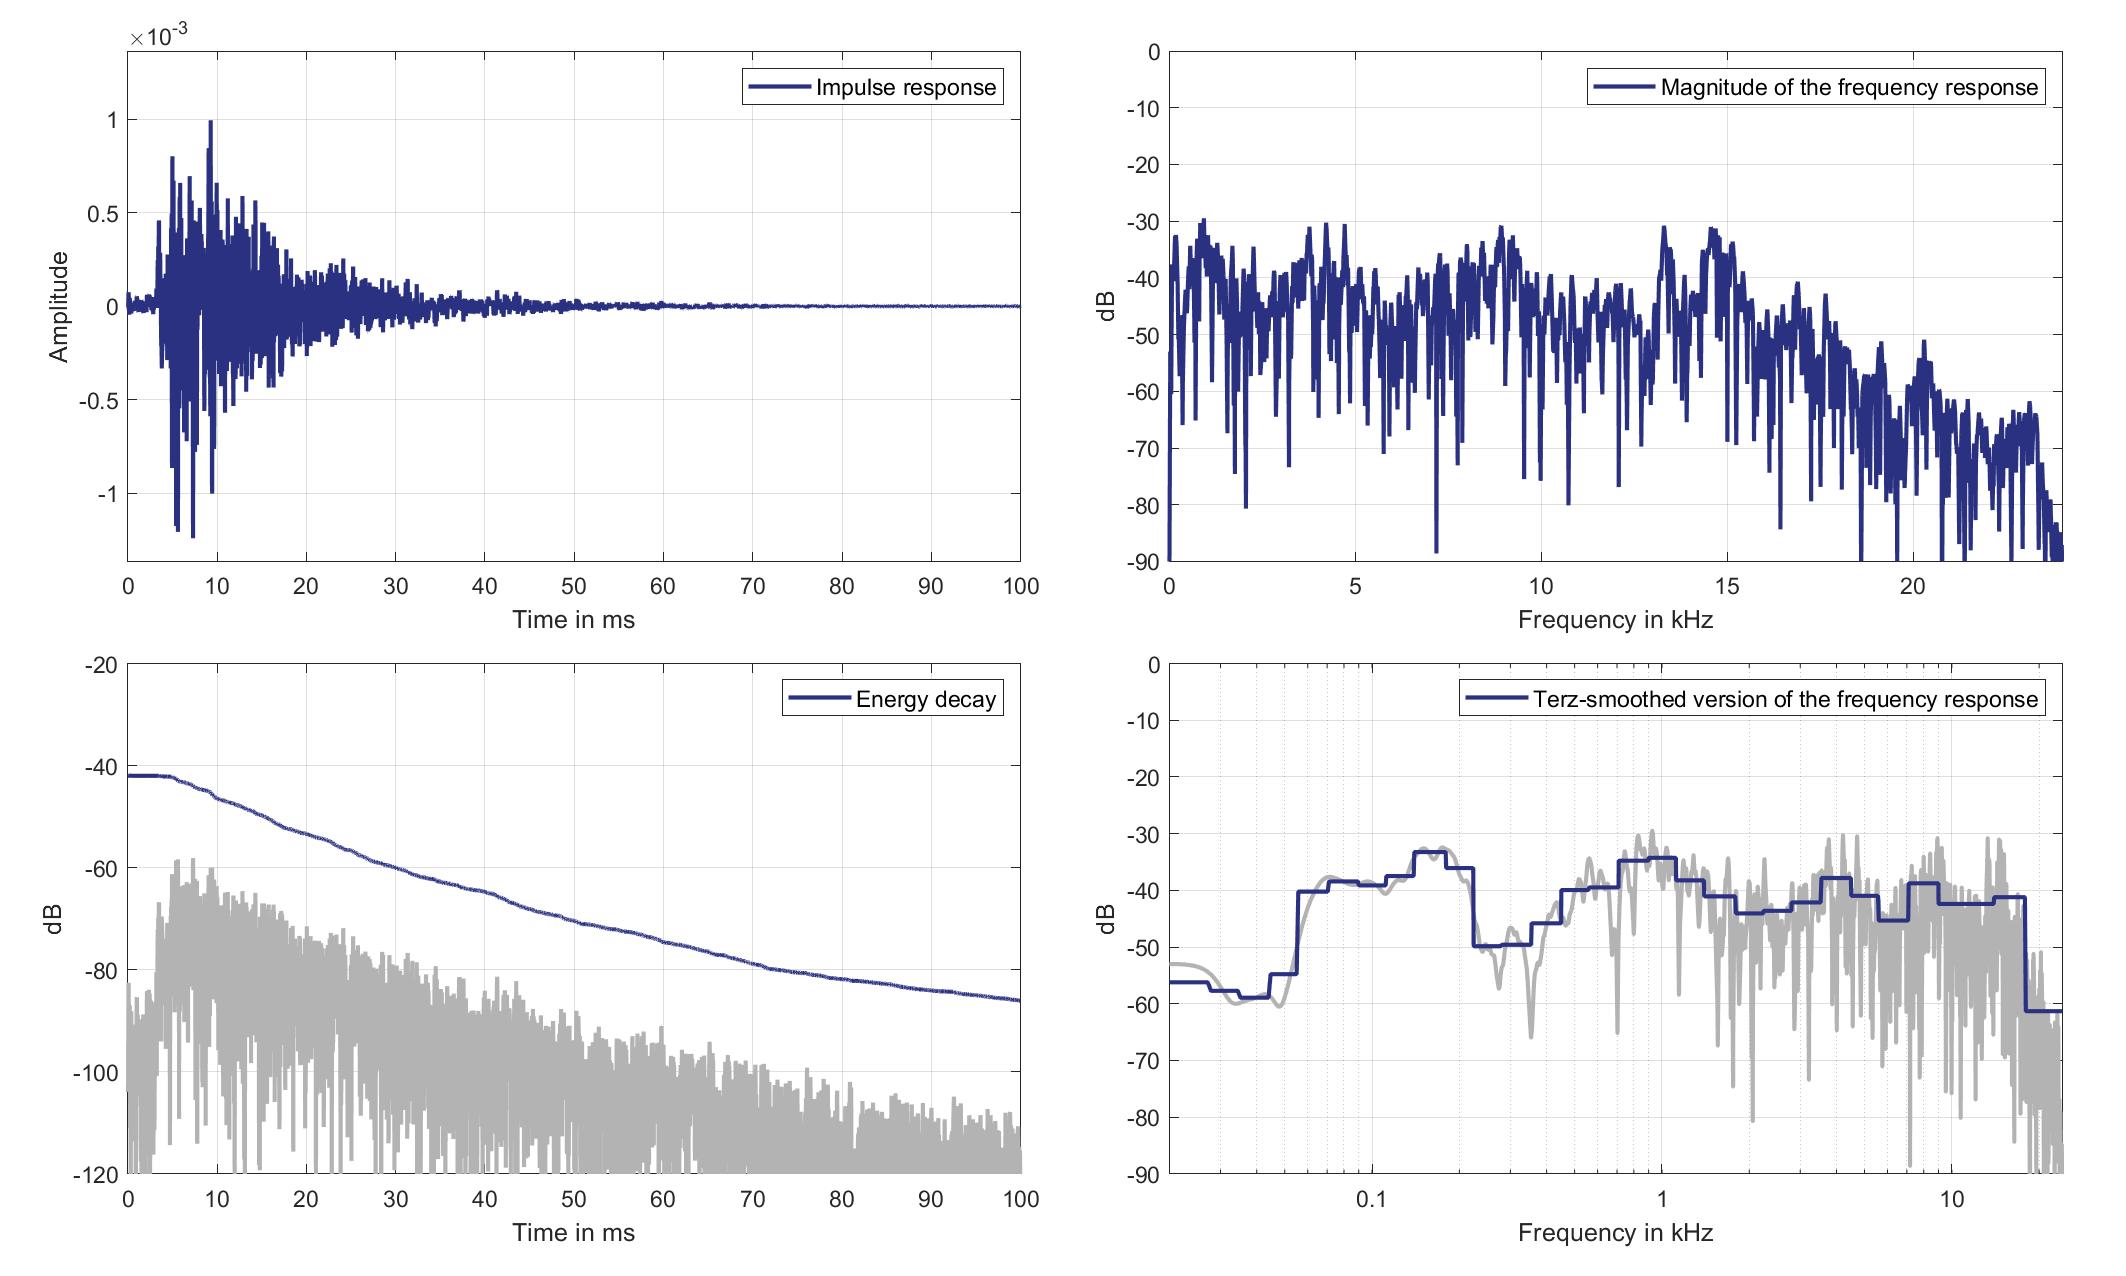
Download impulse response (in ".fir" format).
In the download section you can download all impulse response files as well as format explanation and Matlab as well as Python code examples for loading fir files.
Right Ear Microphone
Mouth Loudspeaker of Zone 5 (Lsp. 15) to Right Ear Microphone of Zone 3 (Mic. 24)
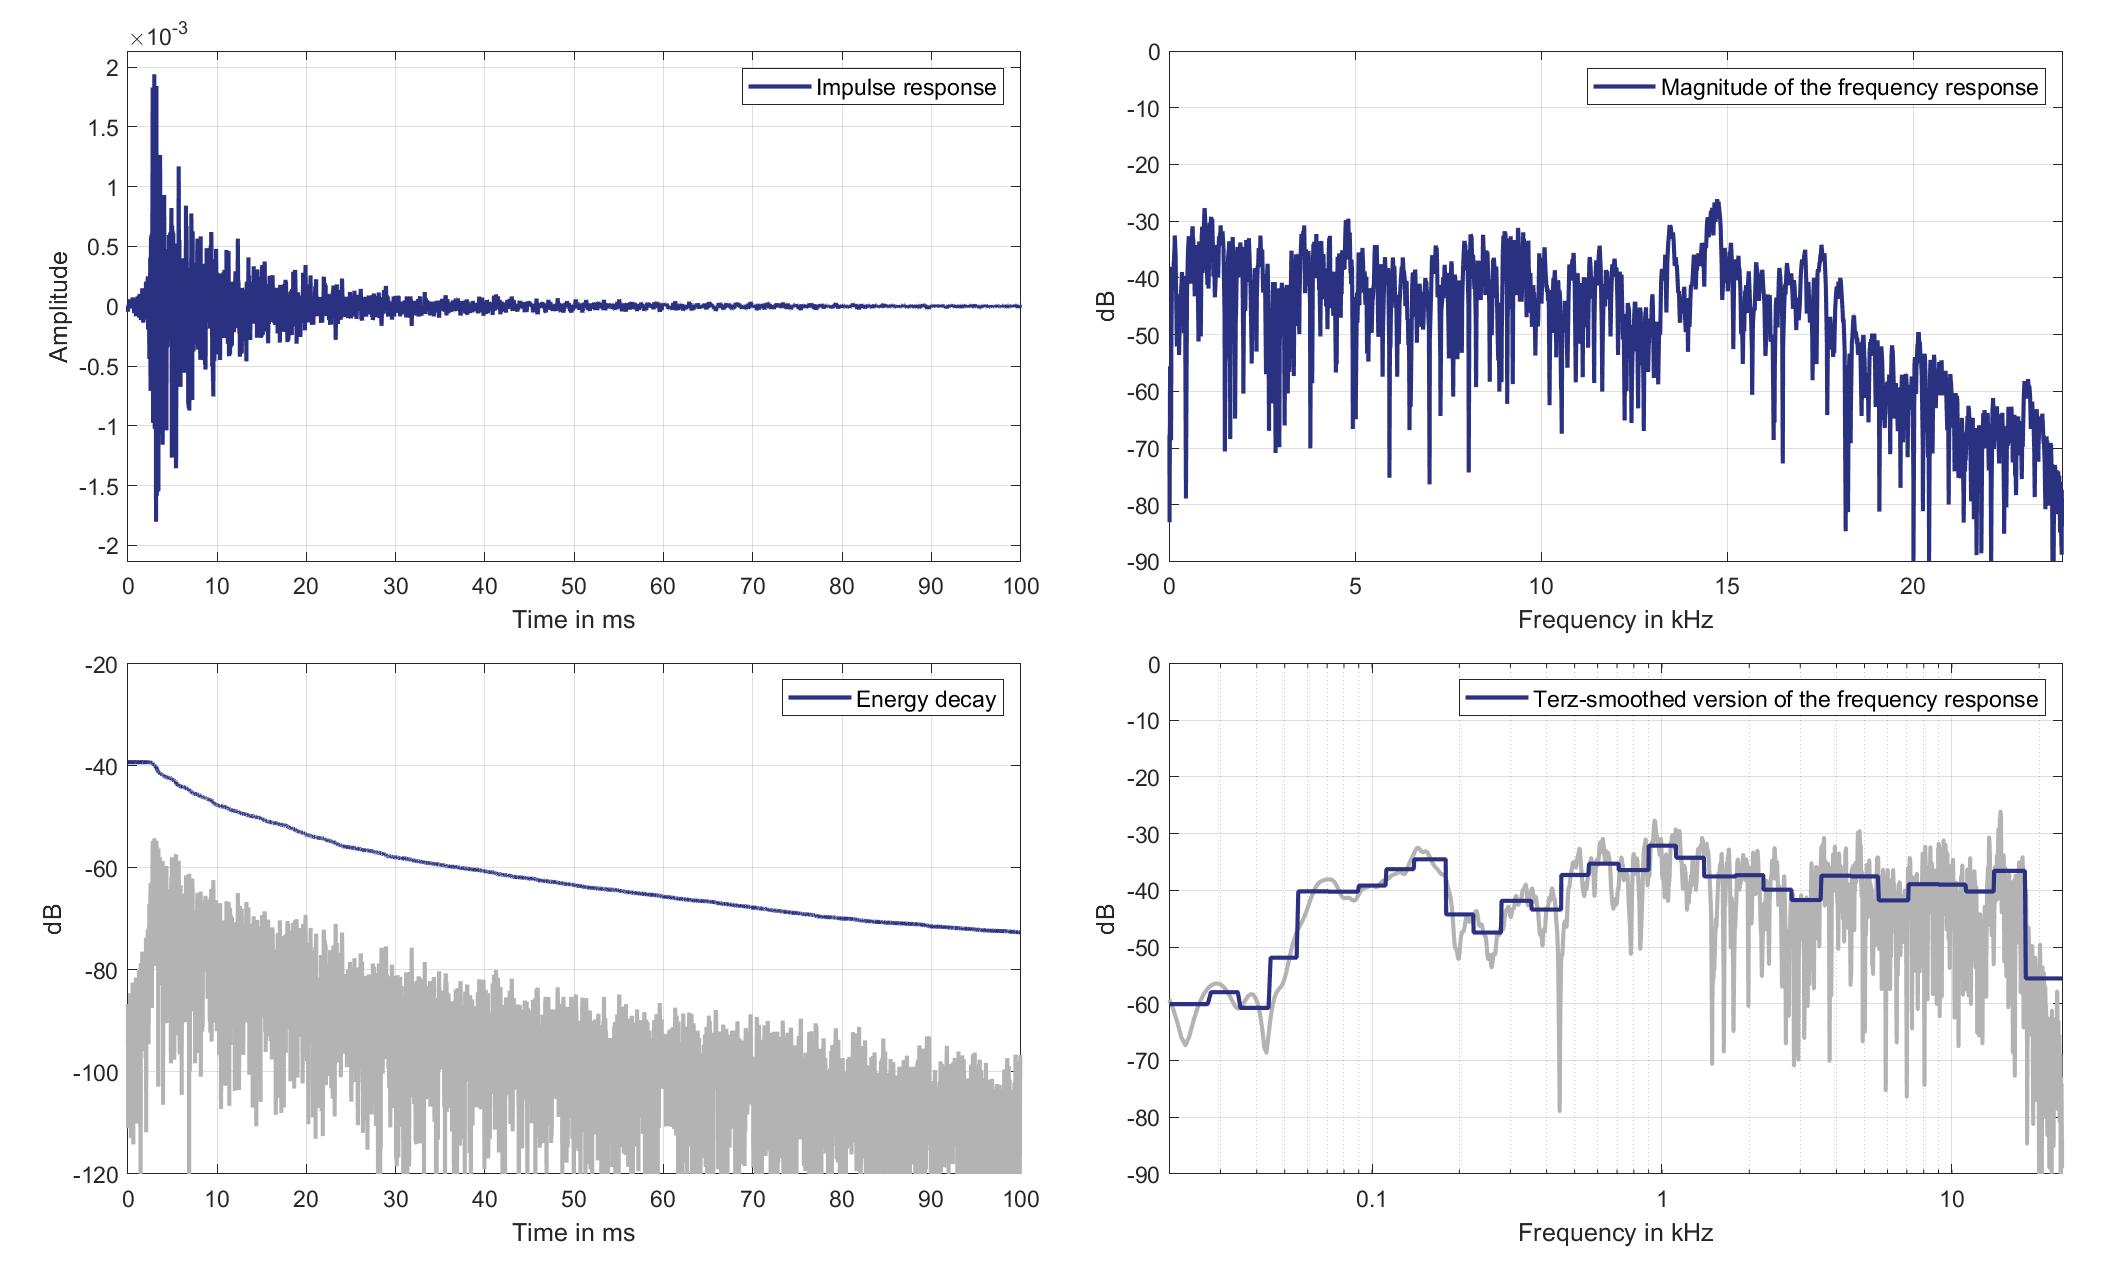
Download impulse response (in ".fir" format).
In the download section you can download all impulse response files as well as format explanation and Matlab as well as Python code examples for loading fir files.
Mics. 25/26
Left Ear Microphone
Mouth Loudspeaker of Zone 5 (Lsp. 15) to Left Ear Microphone of Zone 5 (Mic. 25)
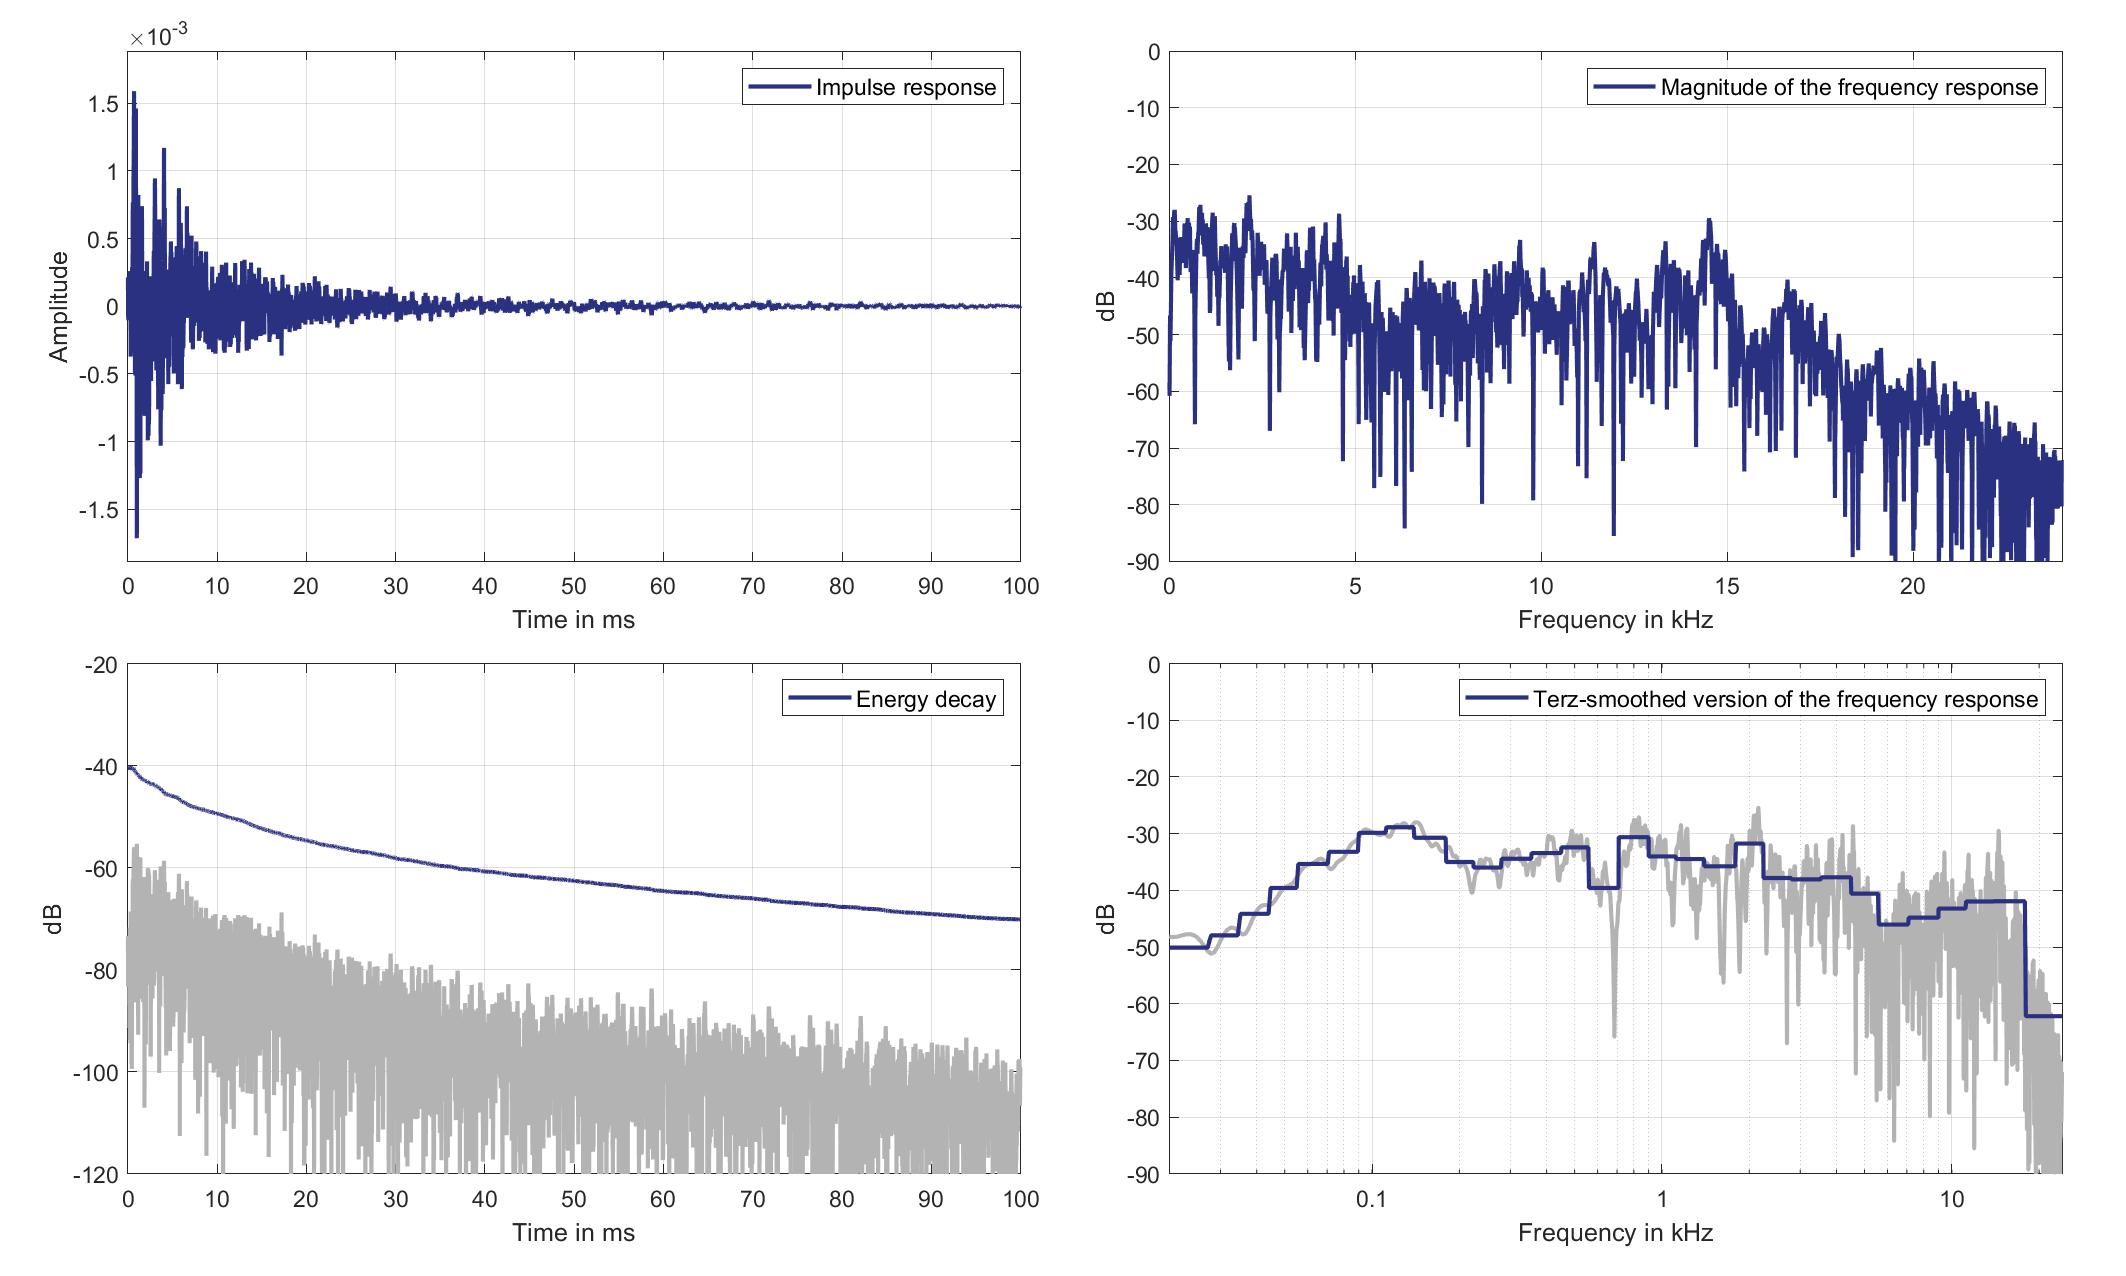
Download impulse response (in ".fir" format).
In the download section you can download all impulse response files as well as format explanation and Matlab as well as Python code examples for loading fir files.
Right Ear Microphone
Mouth Loudspeaker of Zone 5 (Lsp. 15) to Right Ear Microphone of Zone 5 (Mic. 26)
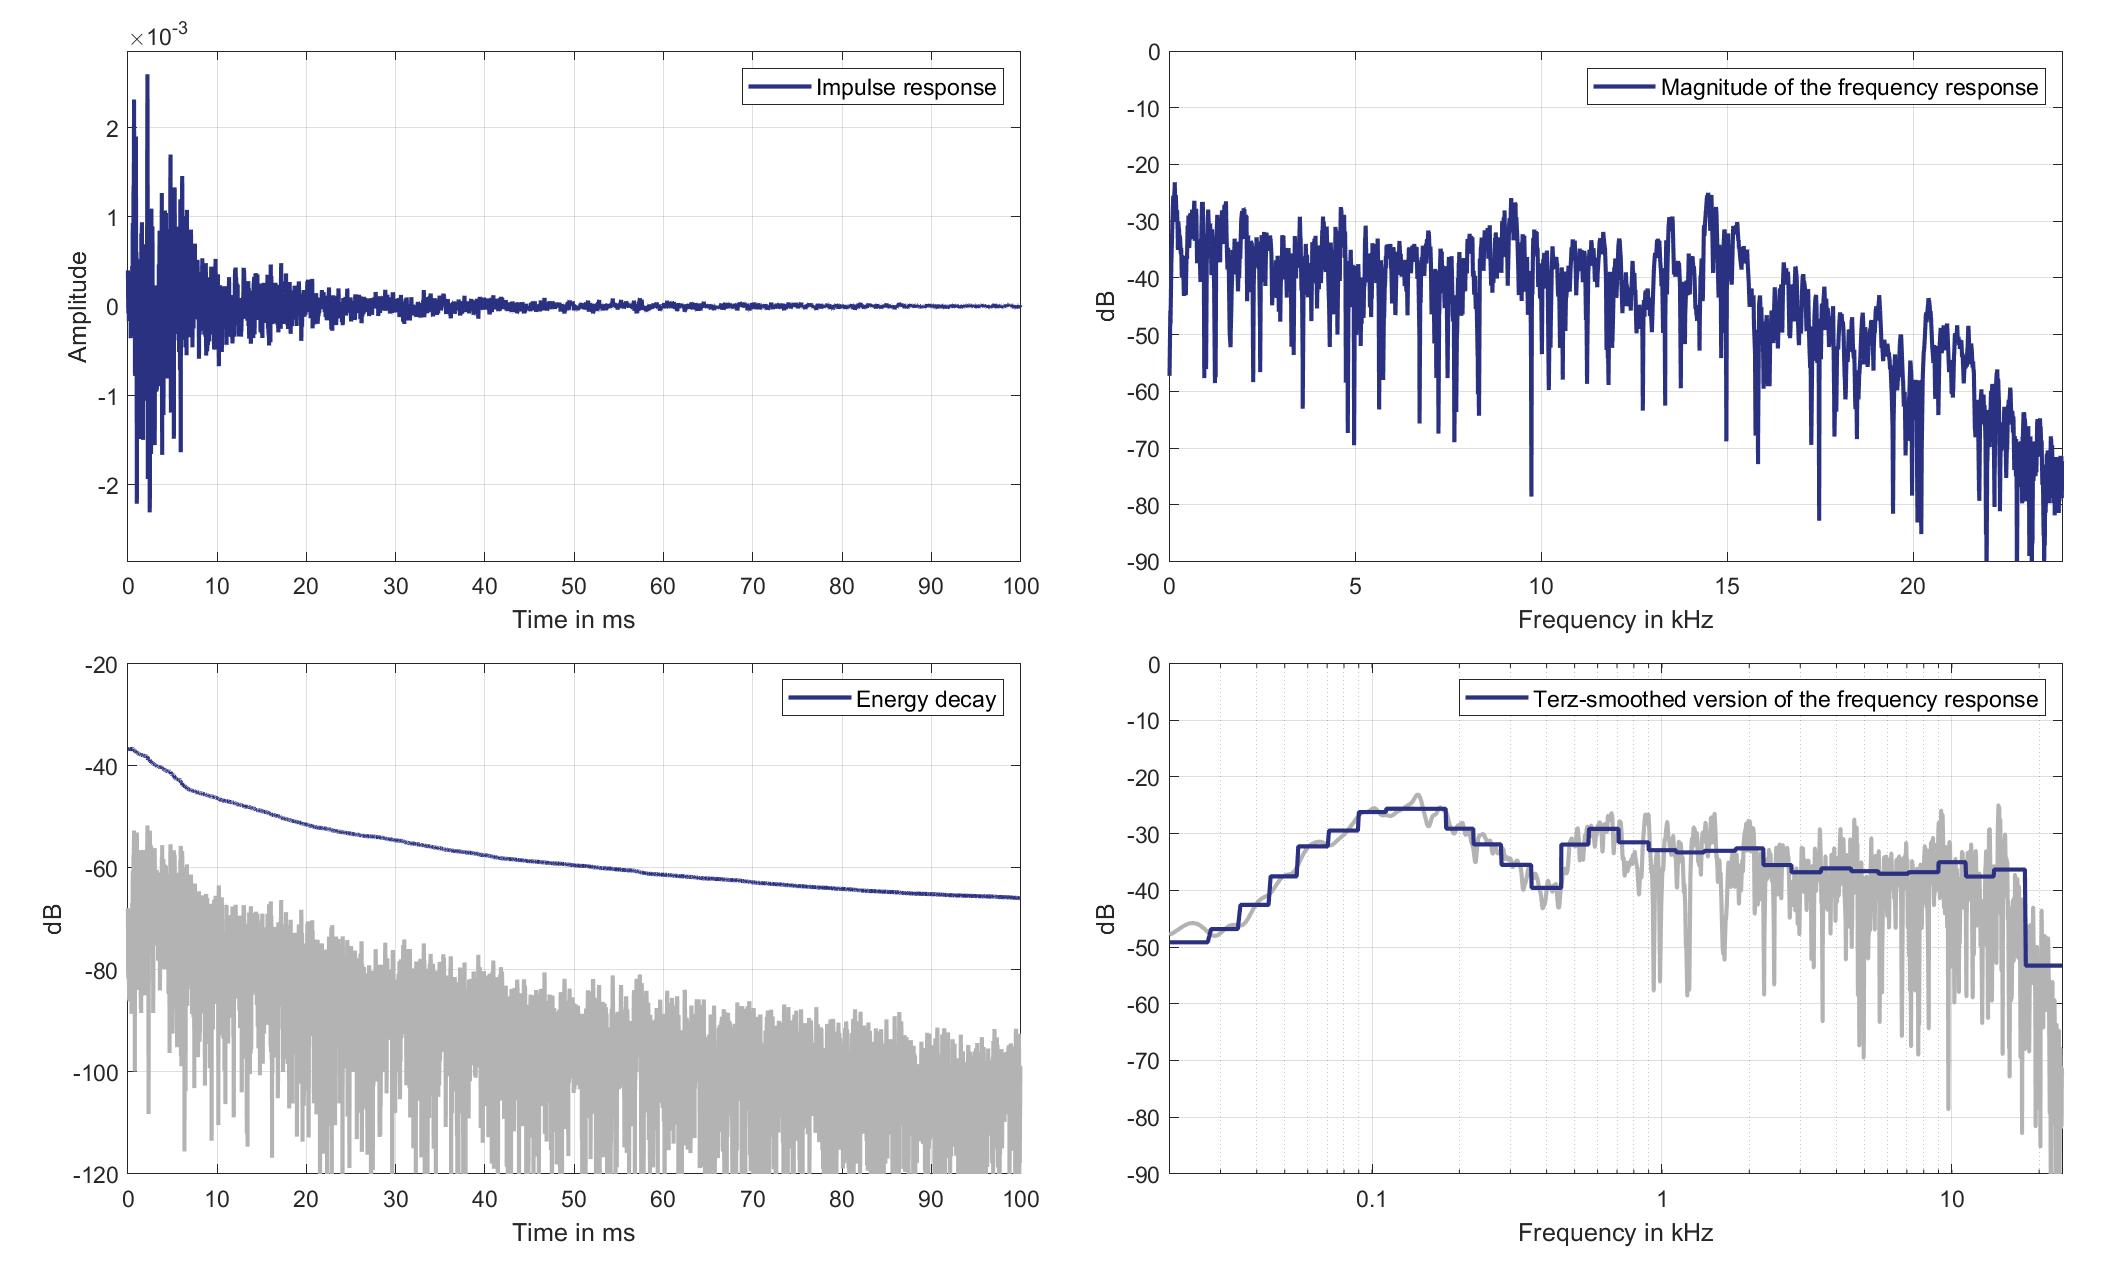
Download impulse response (in ".fir" format).
In the download section you can download all impulse response files as well as format explanation and Matlab as well as Python code examples for loading fir files.
Mics. 27/28
Left Ear Microphone
Mouth Loudspeaker of Zone 5 (Lsp. 15) to Left Ear Microphone of Zone 6 (Mic. 27)
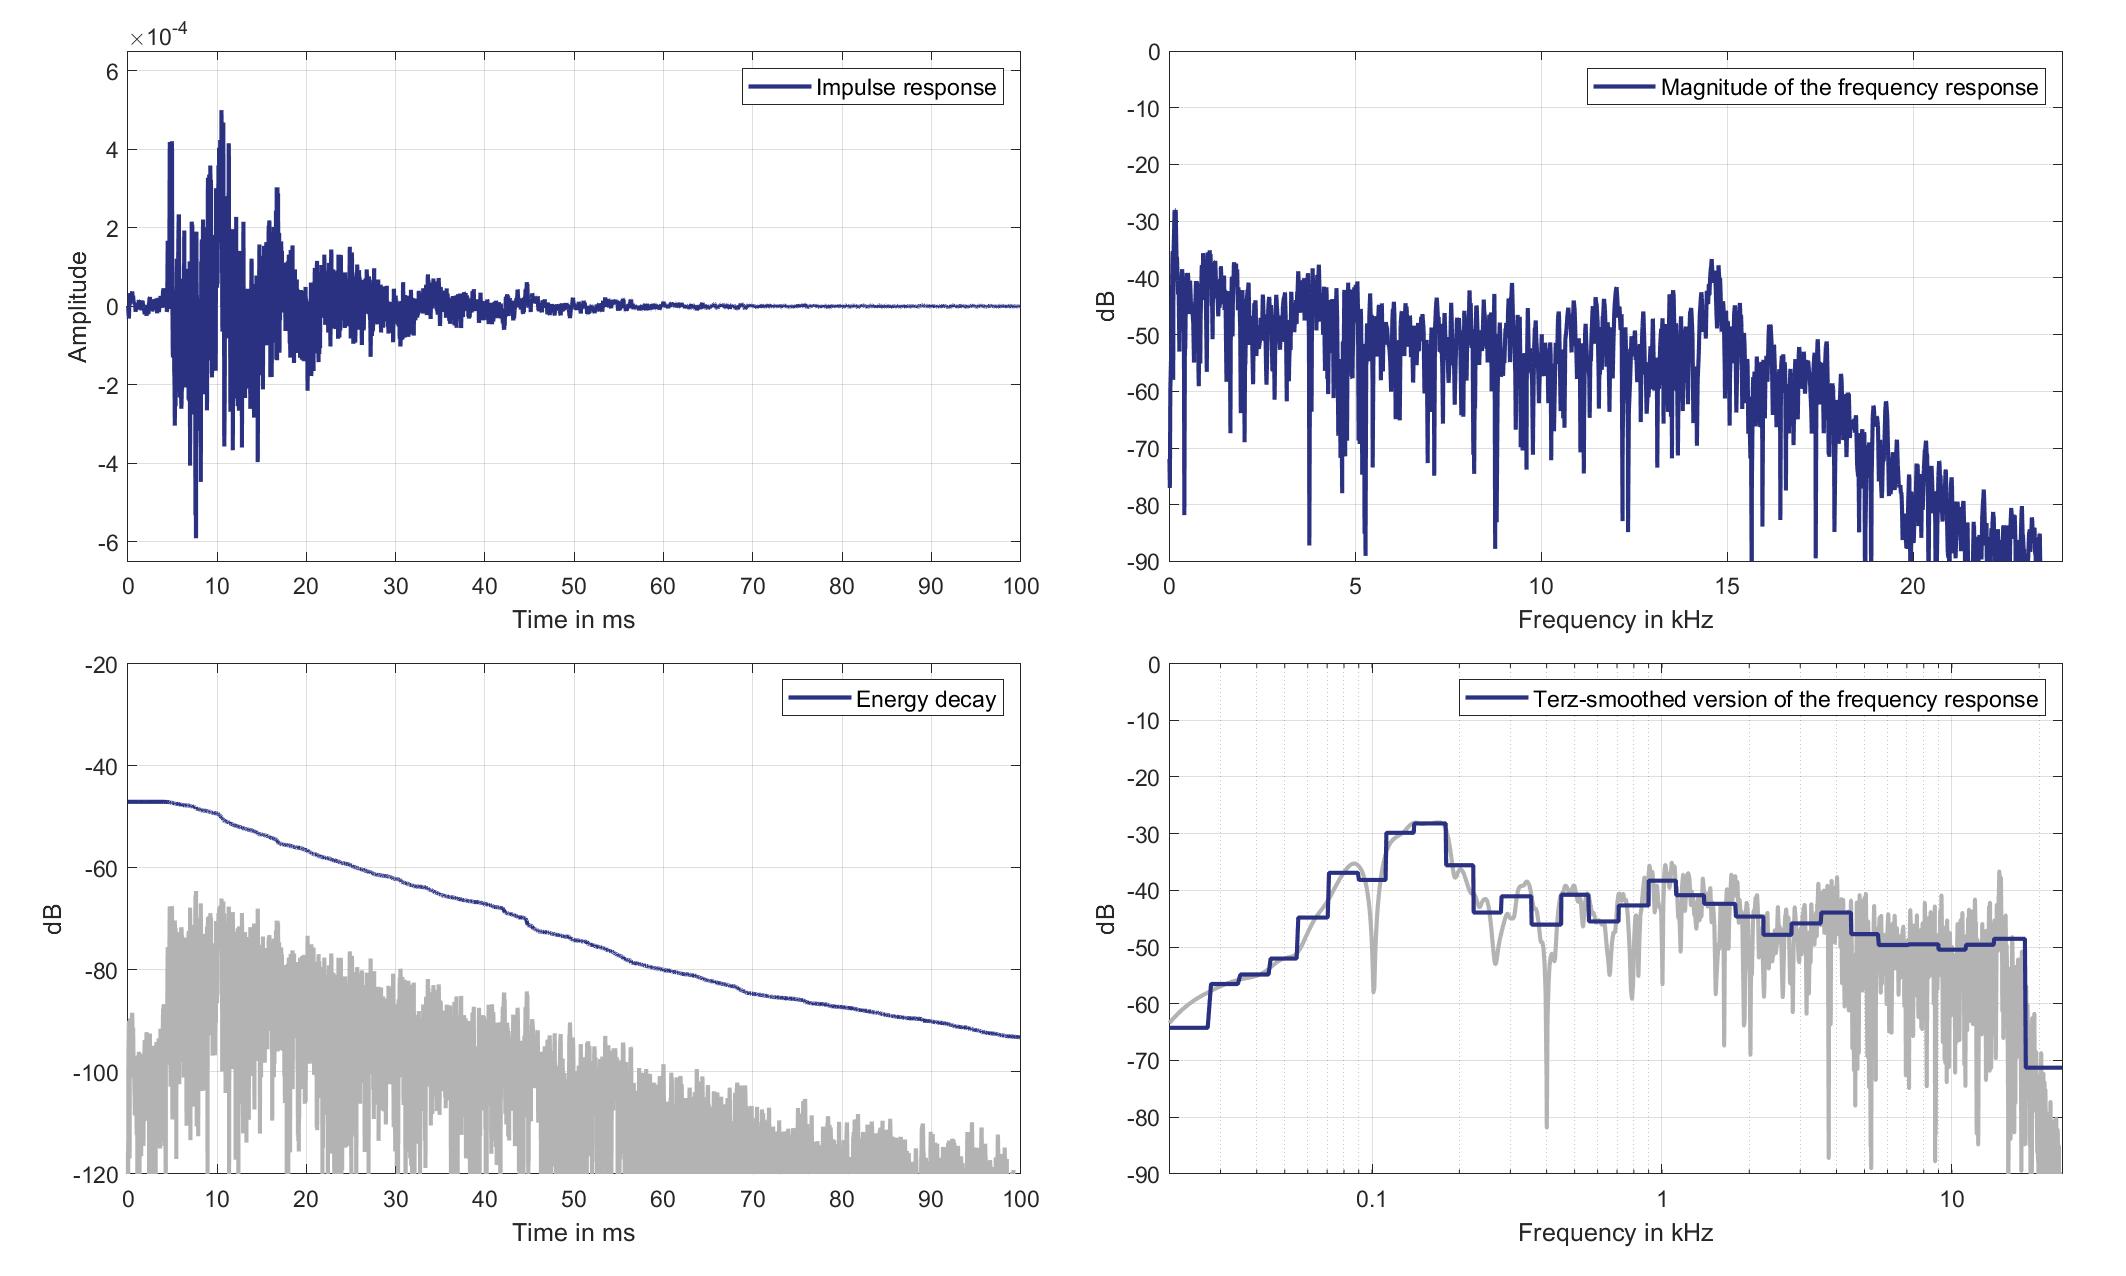
Download impulse response (in ".fir" format).
In the download section you can download all impulse response files as well as format explanation and Matlab as well as Python code examples for loading fir files.
Right Ear Microphone
Mouth Loudspeaker of Zone 5 (Lsp. 15) to Right Ear Microphone of Zone 6 (Mic. 28)
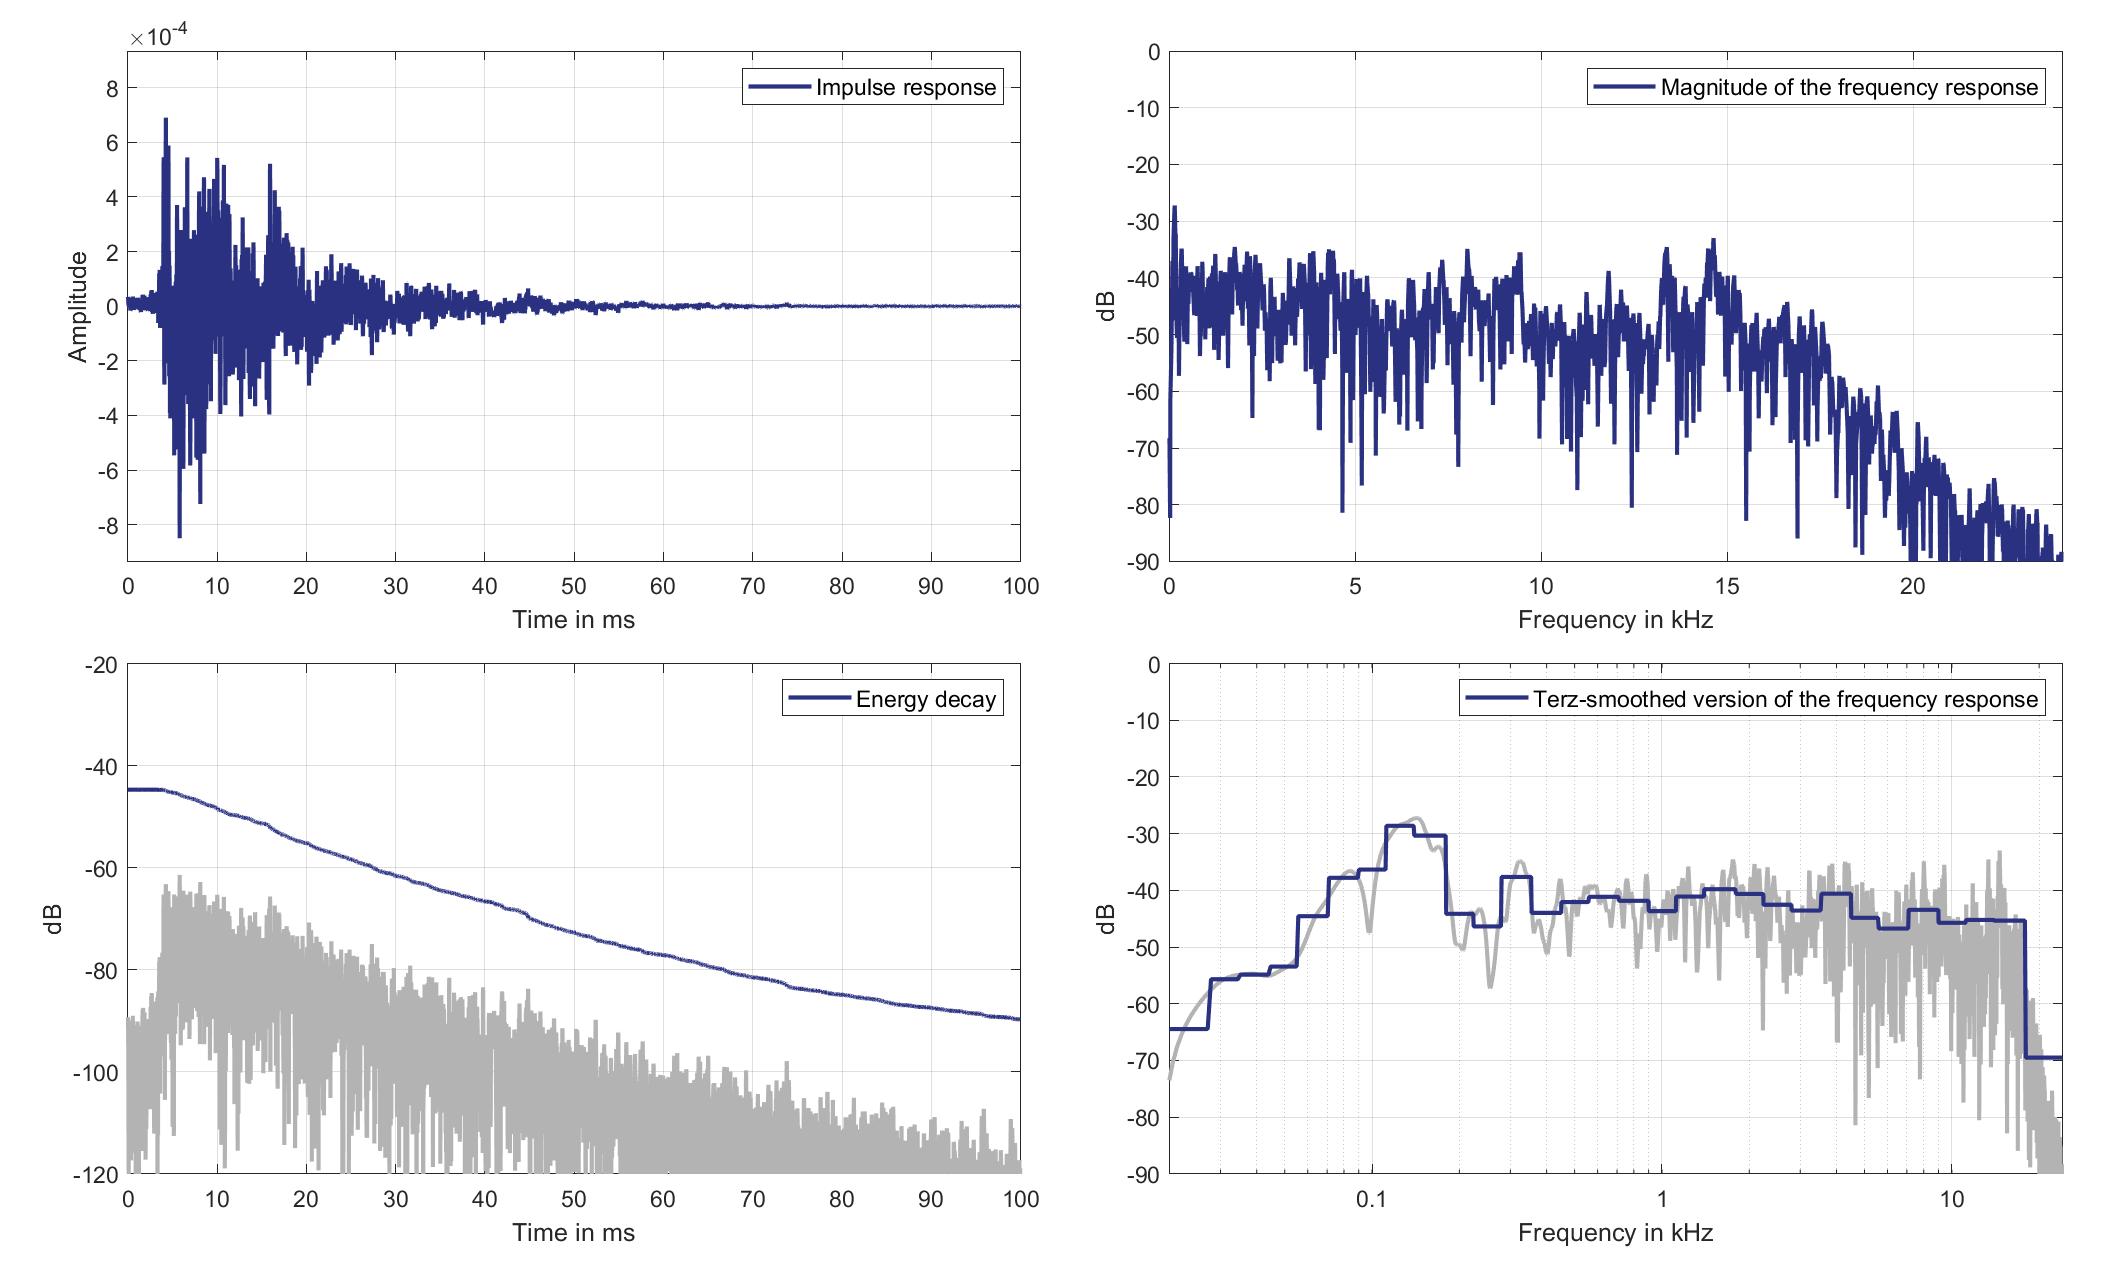
Download impulse response (in ".fir" format).
In the download section you can download all impulse response files as well as format explanation and Matlab as well as Python code examples for loading fir files.
Mics. 29/30
Left Ear Microphone
Mouth Loudspeaker of Zone 5 (Lsp. 15) to Left Ear Microphone of Zone 8 (Mic. 29)
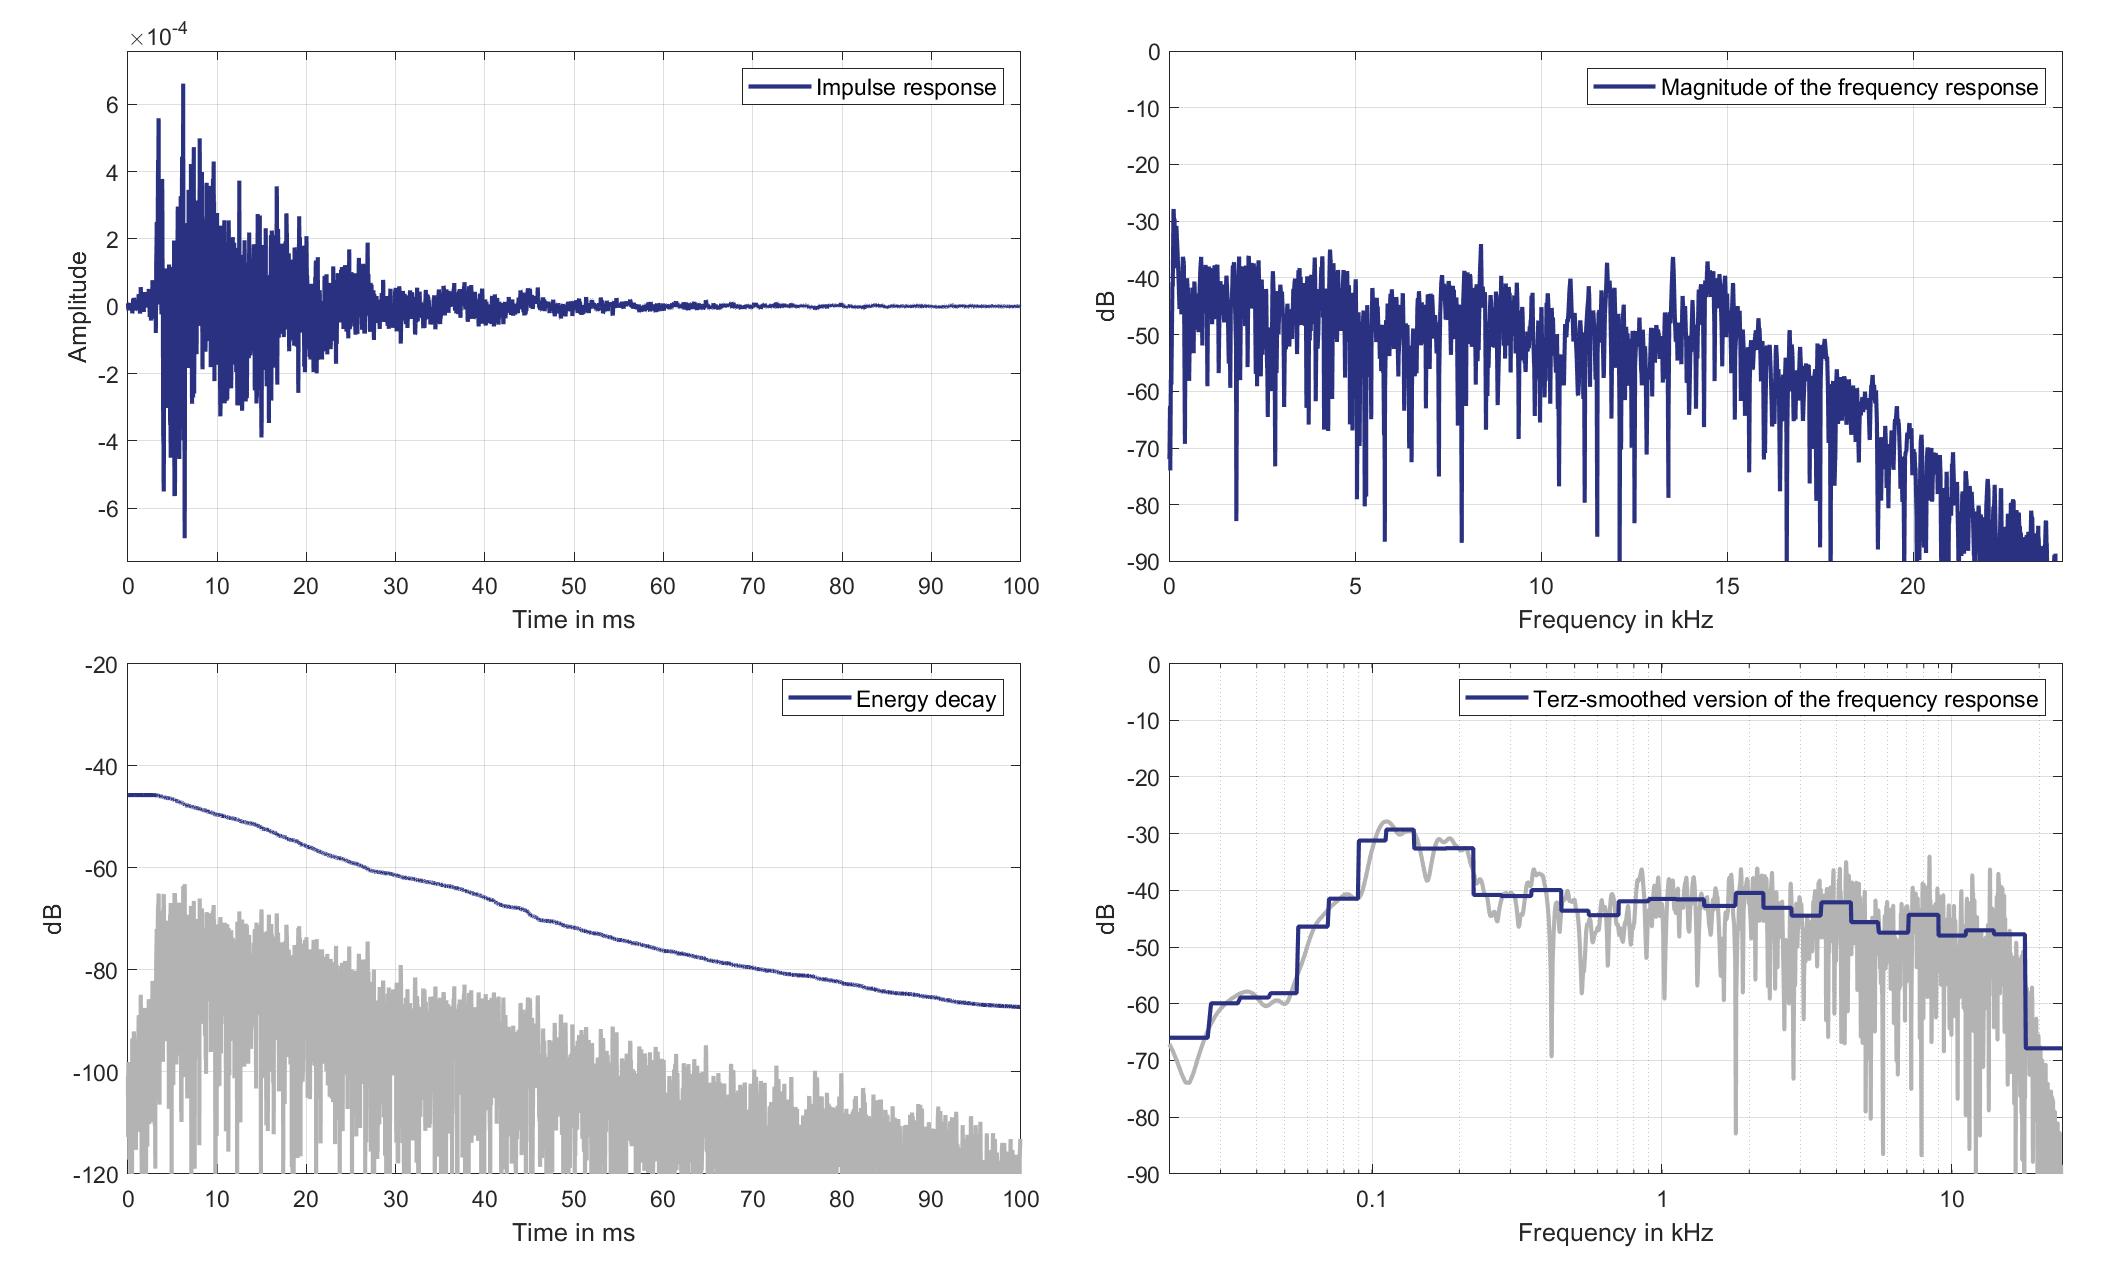
Download impulse response (in ".fir" format).
In the download section you can download all impulse response files as well as format explanation and Matlab as well as Python code examples for loading fir files.
Right Ear Microphone
Mouth Loudspeaker of Zone 5 (Lsp. 15) to Right Ear Microphone of Zone 8 (Mic. 30)
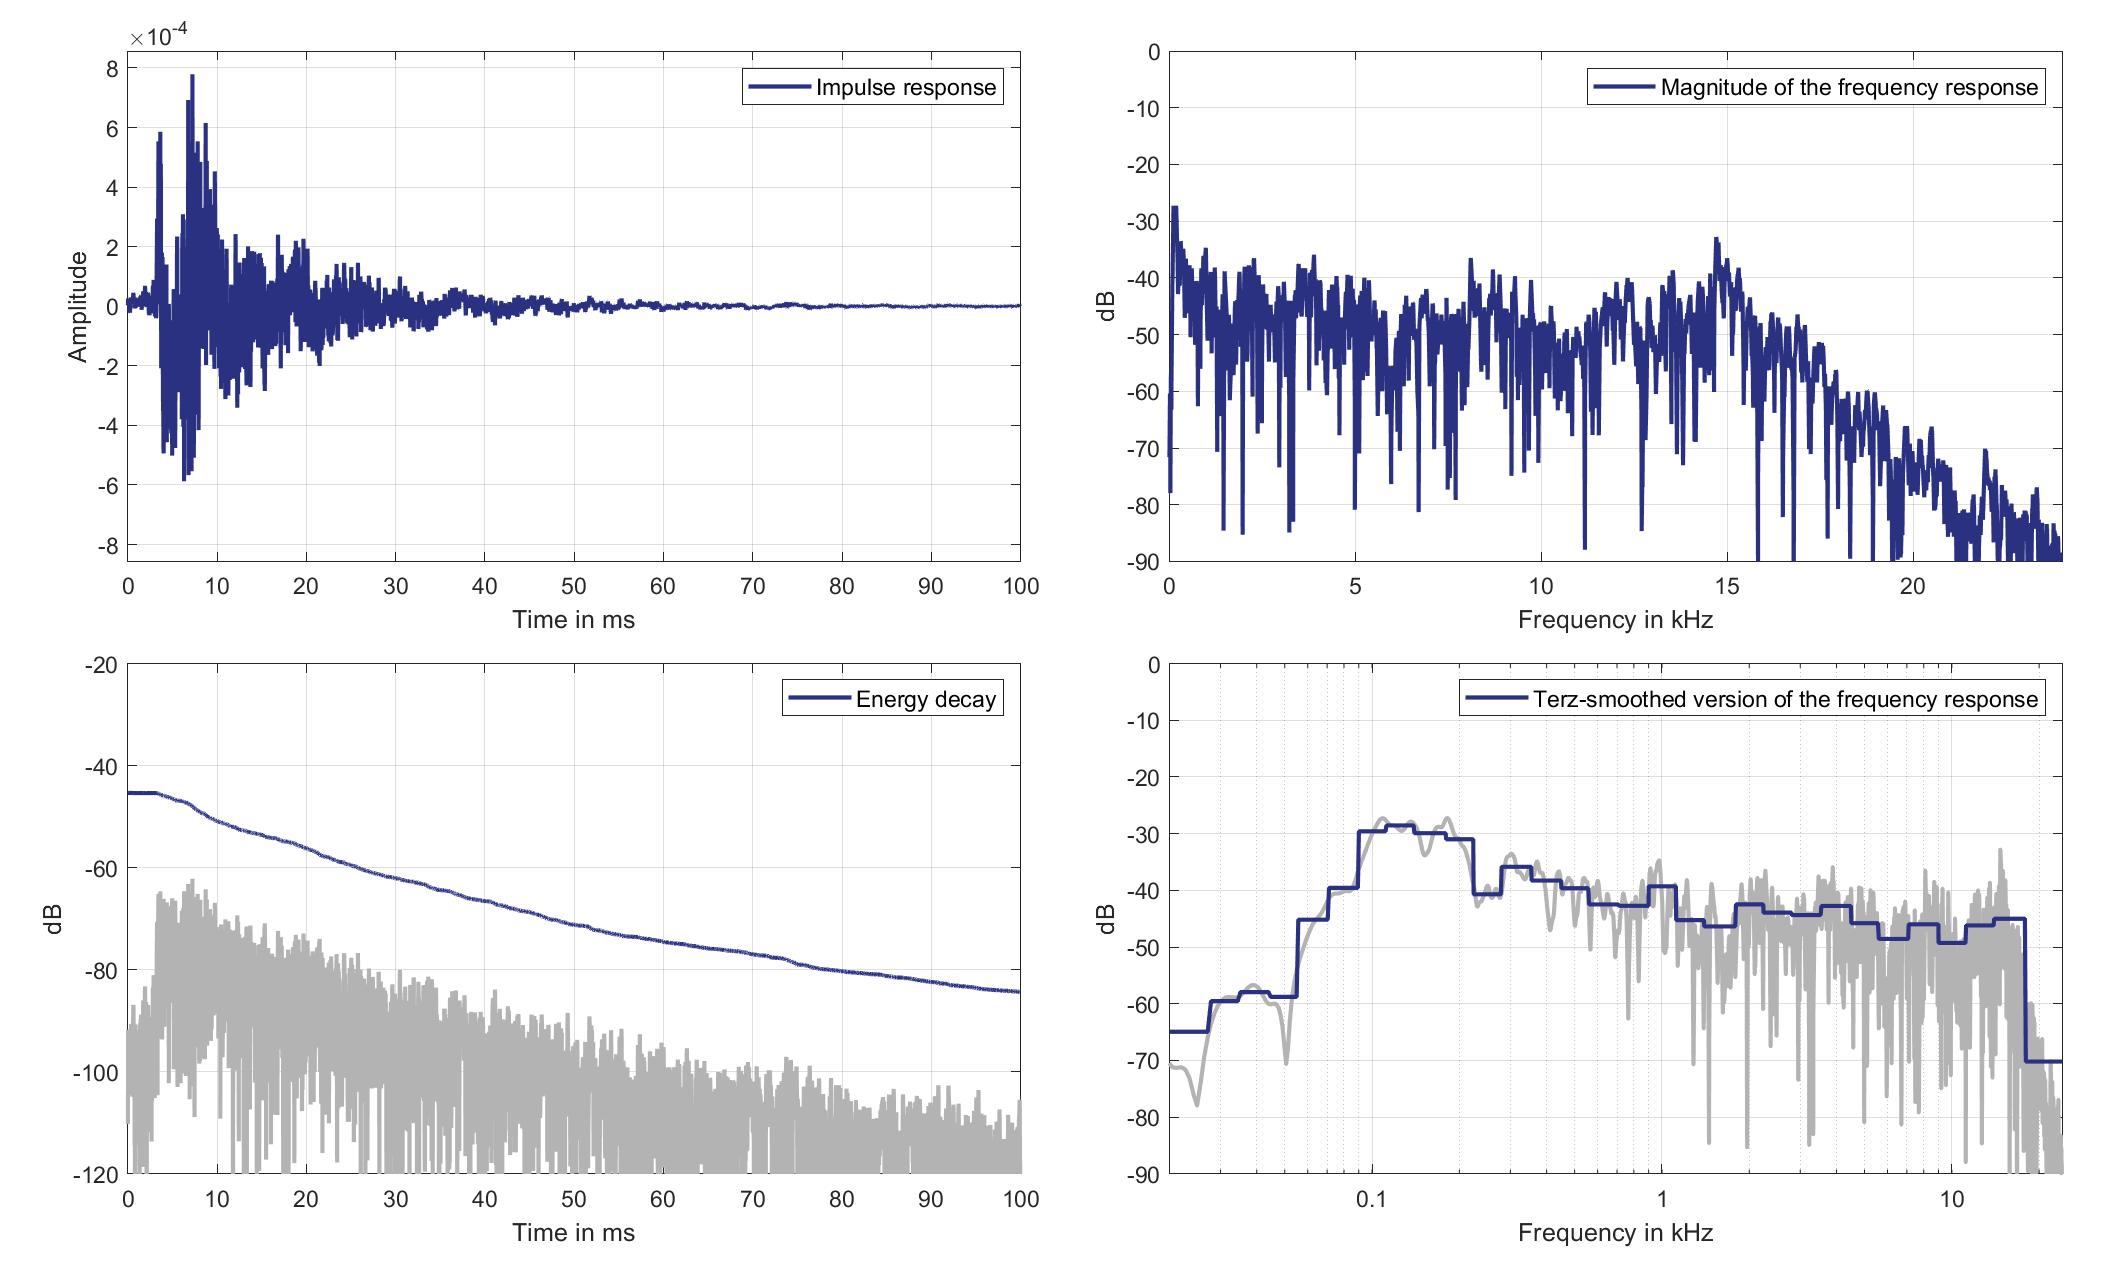
Download impulse response (in ".fir" format).
In the download section you can download all impulse response files as well as format explanation and Matlab as well as Python code examples for loading fir files.
Lsp. 16
Mics. 19/20
Left Ear Microphone
Mouth Loudspeaker of Zone 6 (Lsp. 16) to Left Ear Microphone of Zone 1 (Mic. 19)
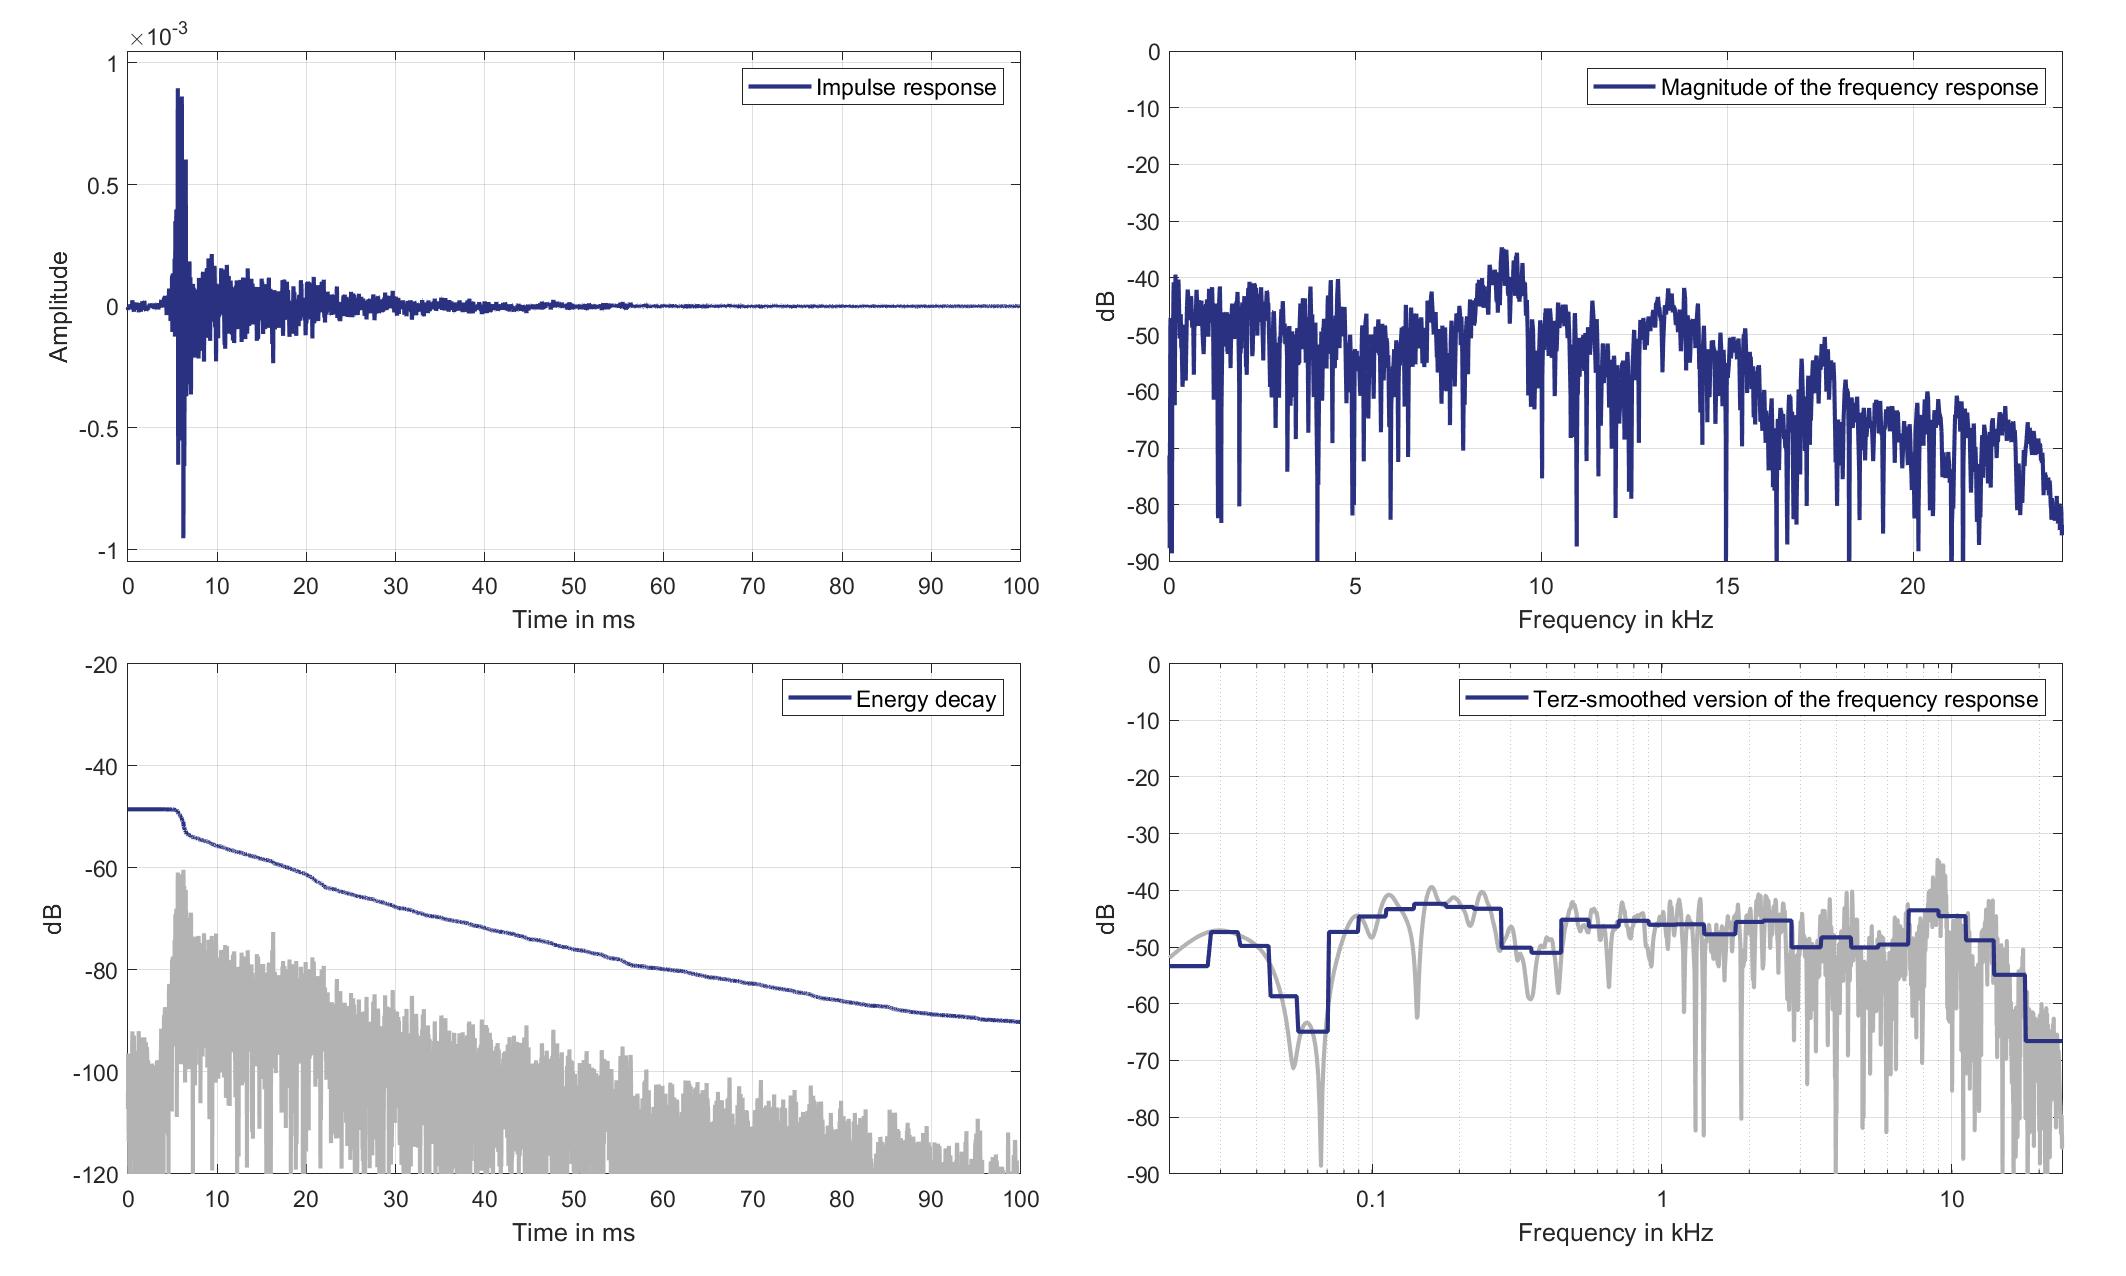
Download impulse response (in ".fir" format).
In the download section you can download all impulse response files as well as format explanation and Matlab as well as Python code examples for loading fir files.
Right Ear Microphone
Mouth Loudspeaker of Zone 6 (Lsp. 16) to Right Ear Microphone of Zone 1 (Mic. 20)
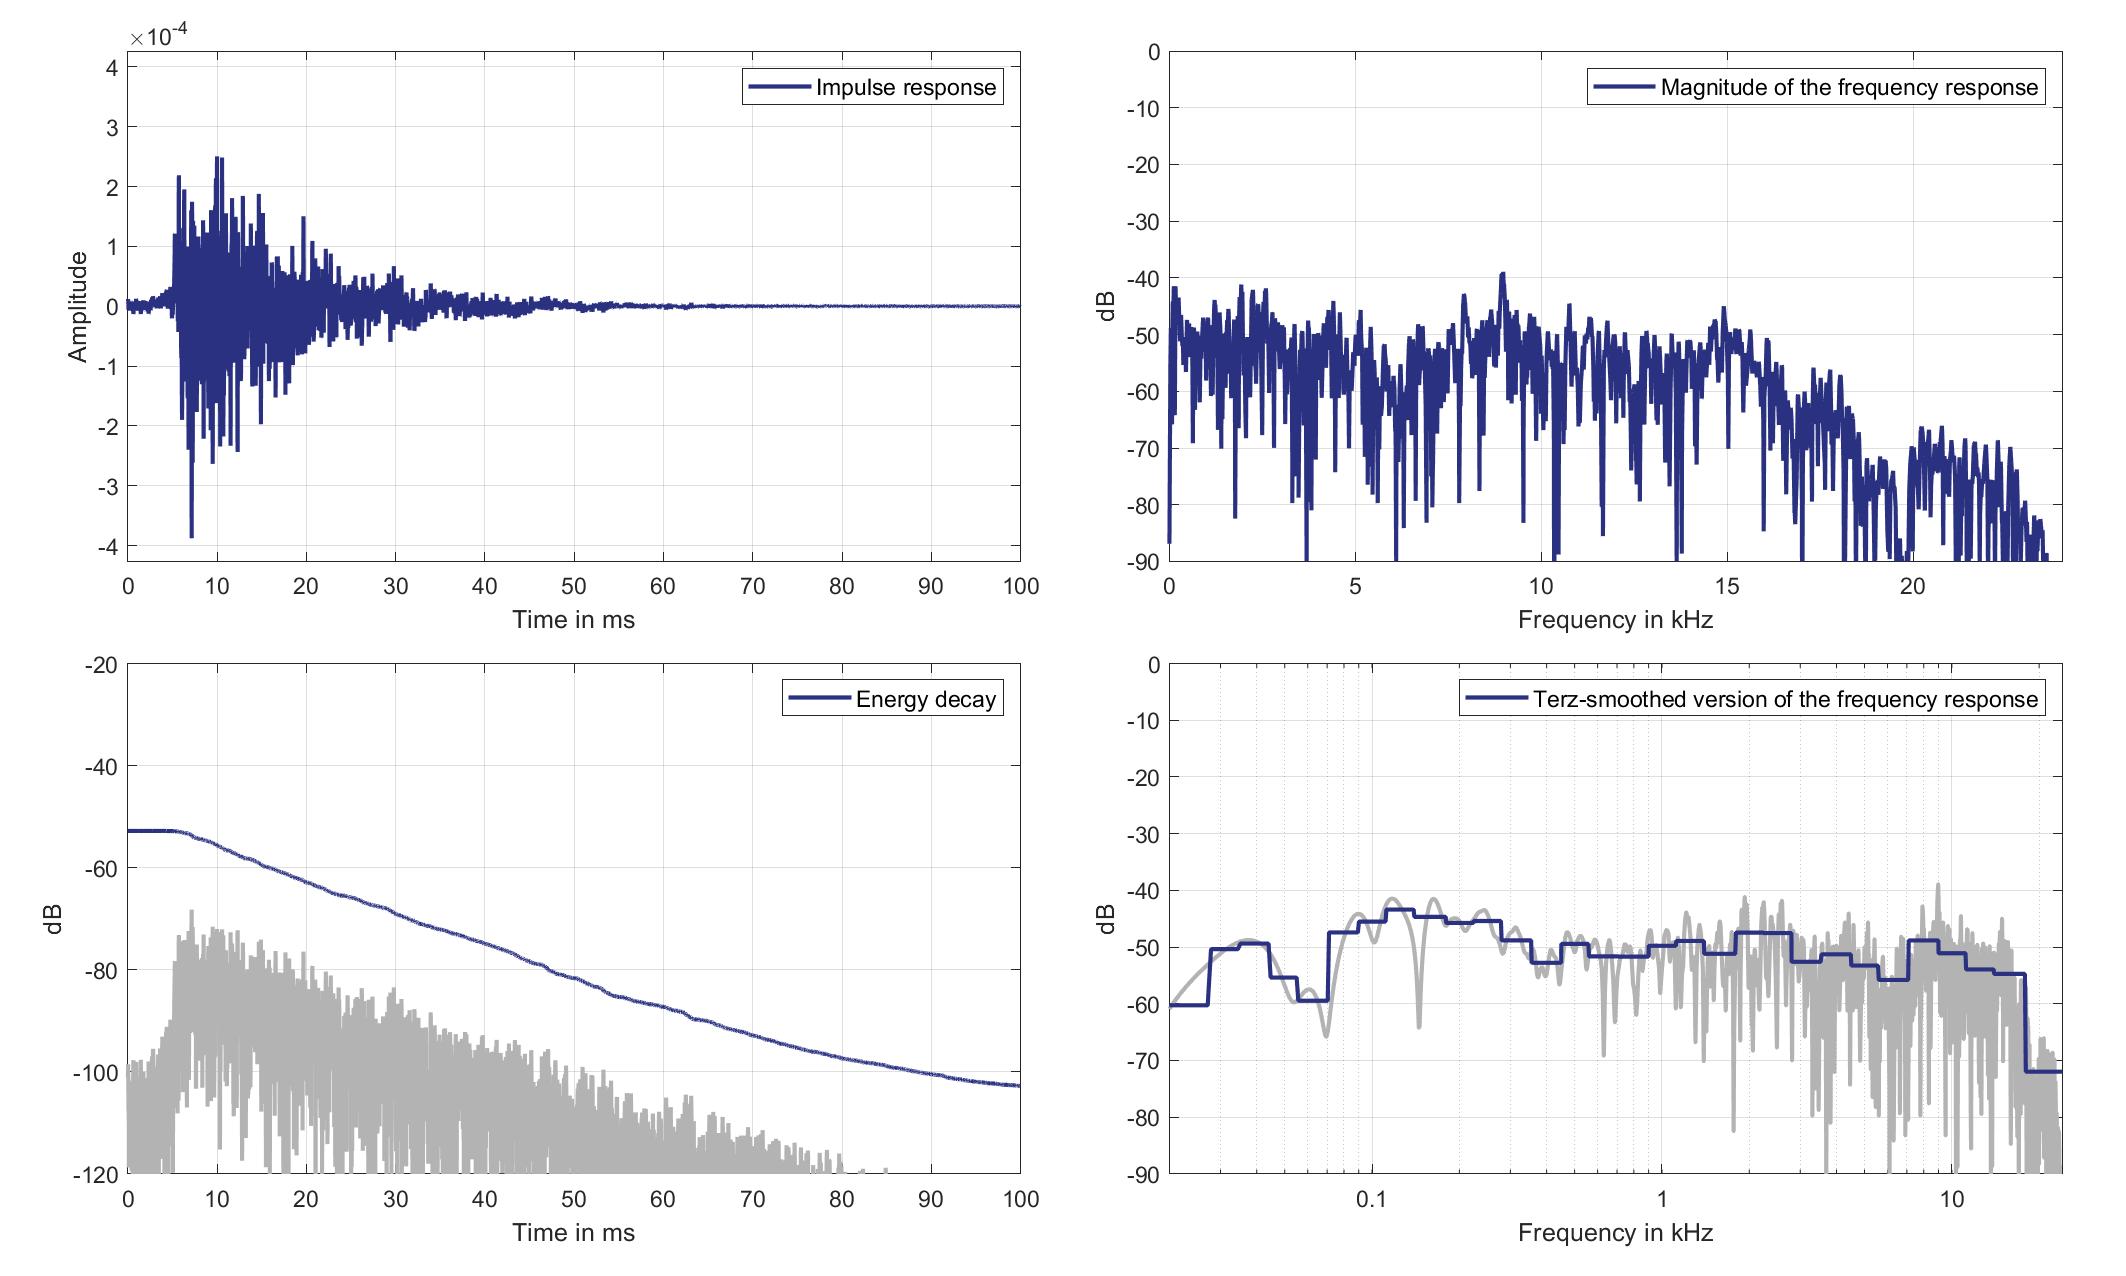
Download impulse response (in ".fir" format).
In the download section you can download all impulse response files as well as format explanation and Matlab as well as Python code examples for loading fir files.
Mics. 21/22
Left Ear Microphone
Mouth Loudspeaker of Zone 6 (Lsp. 16) to Left Ear Microphone of Zone 2 (Mic. 21)
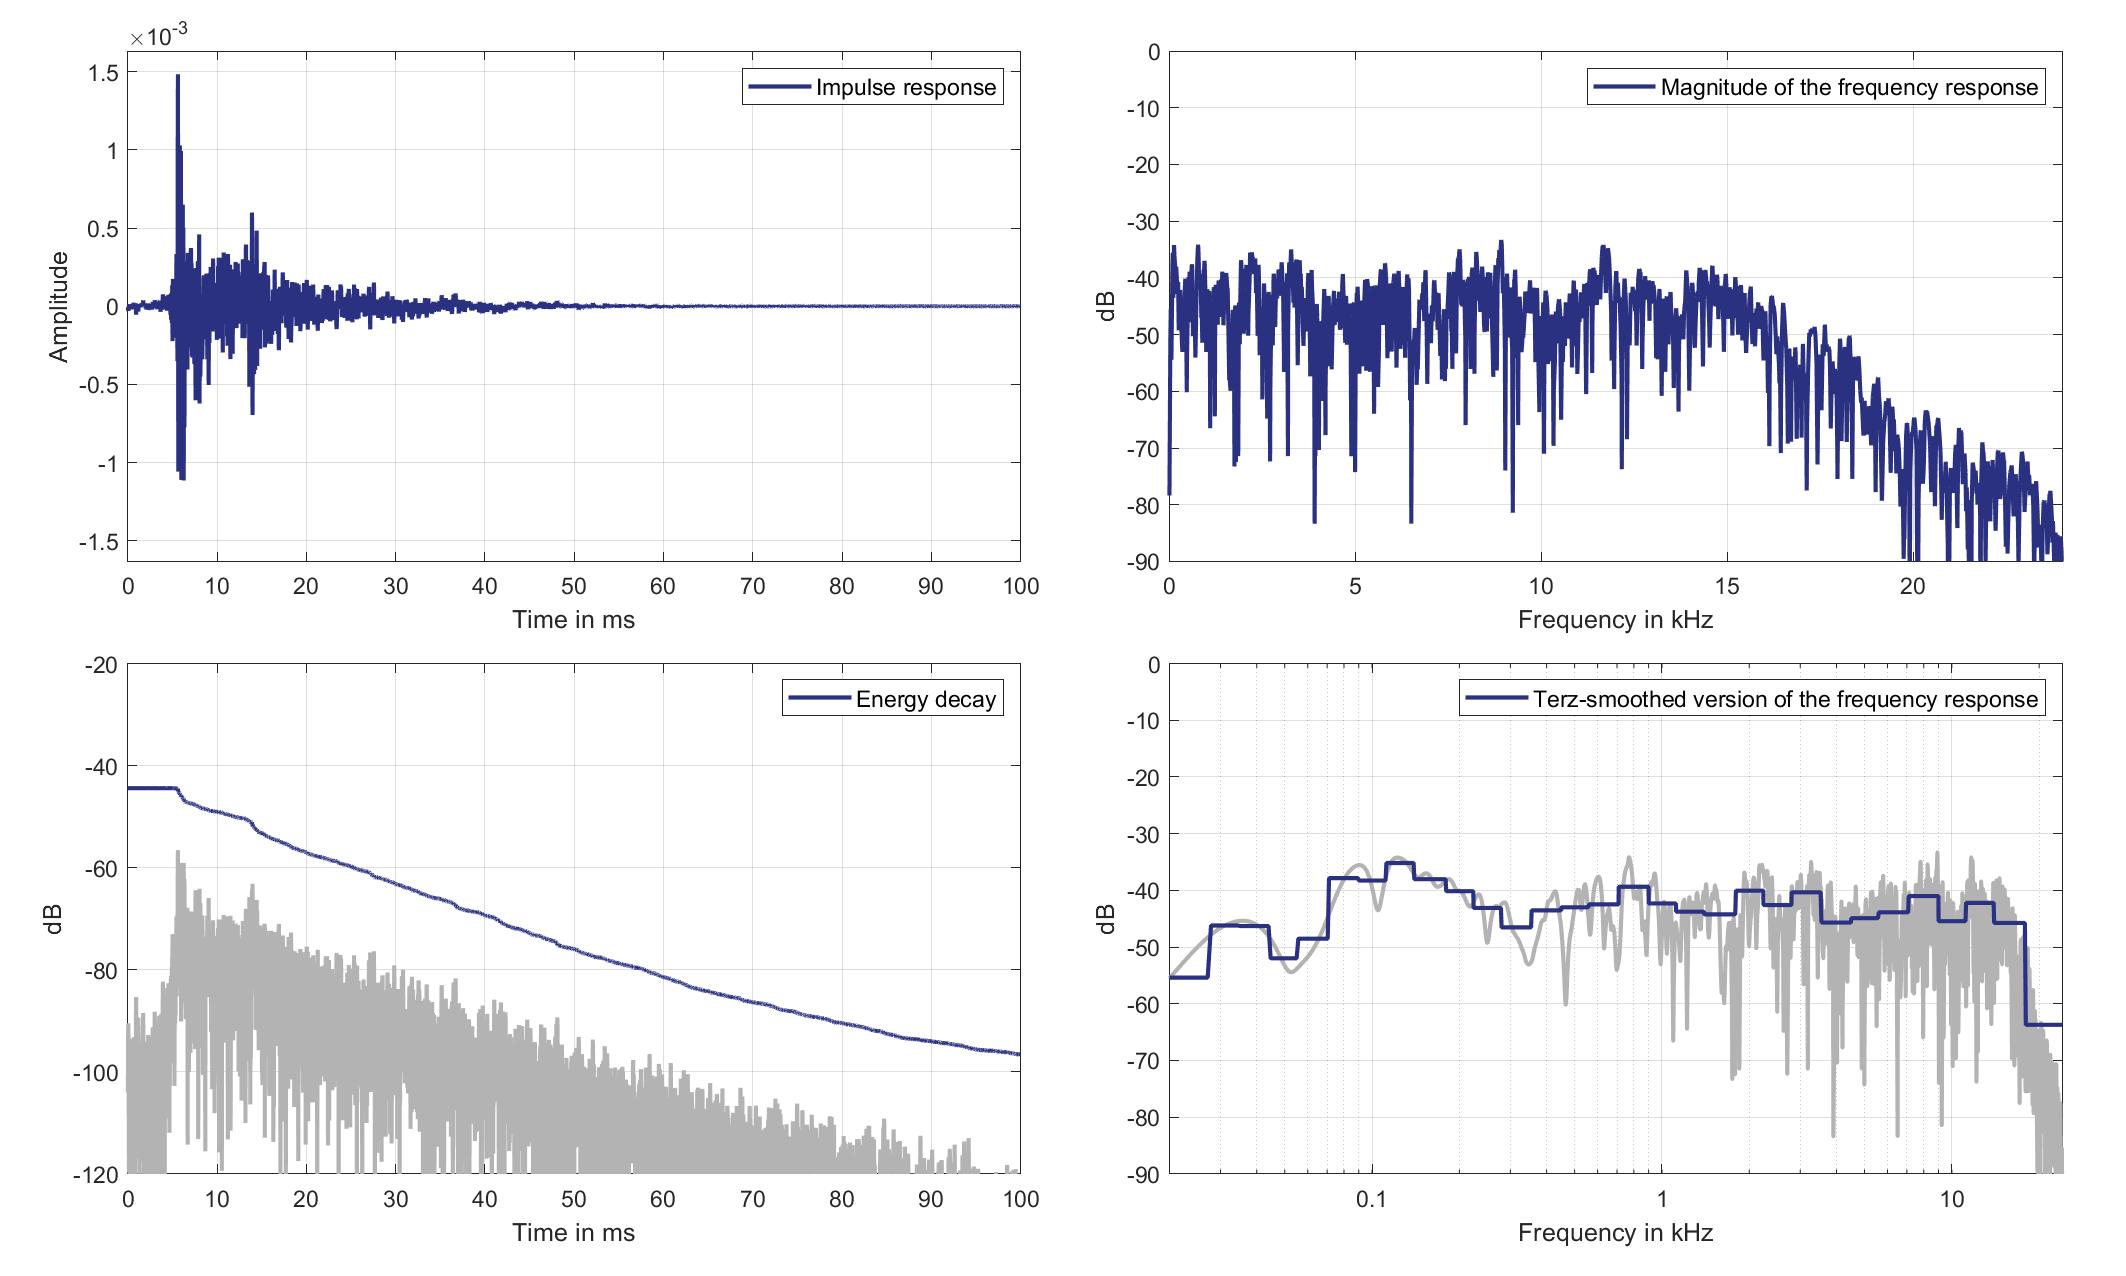
Download impulse response (in ".fir" format).
In the download section you can download all impulse response files as well as format explanation and Matlab as well as Python code examples for loading fir files.
Right Ear Microphone
Mouth Loudspeaker of Zone 6 (Lsp. 16) to Right Ear Microphone of Zone 2 (Mic. 22)
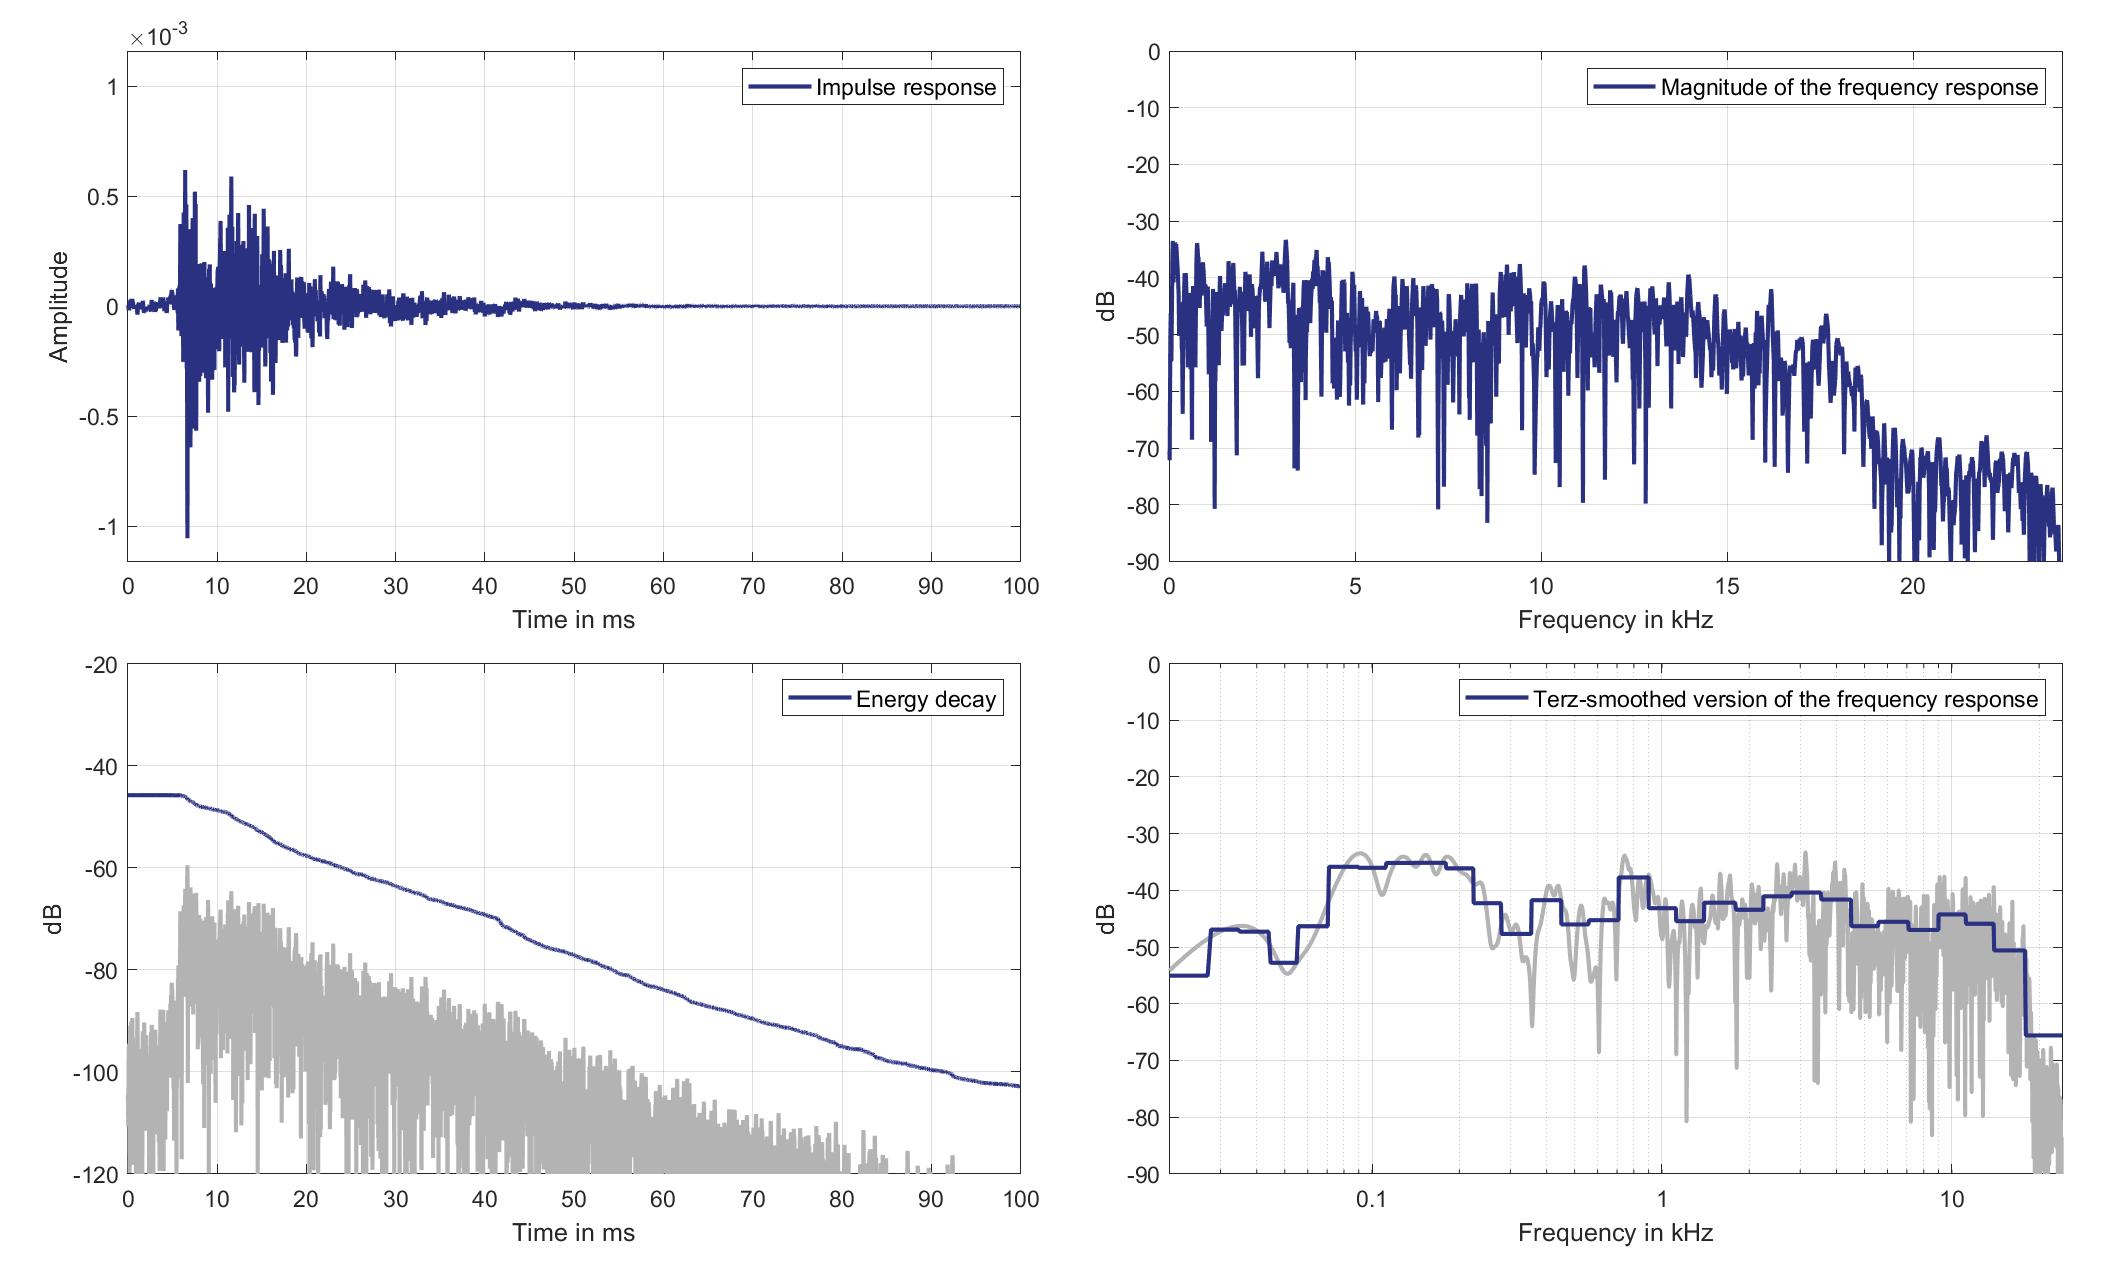
Download impulse response (in ".fir" format).
In the download section you can download all impulse response files as well as format explanation and Matlab as well as Python code examples for loading fir files.
Mics. 23/24
Left Ear Microphone
Mouth Loudspeaker of Zone 6 (Lsp. 16) to Left Ear Microphone of Zone 3 (Mic. 23)
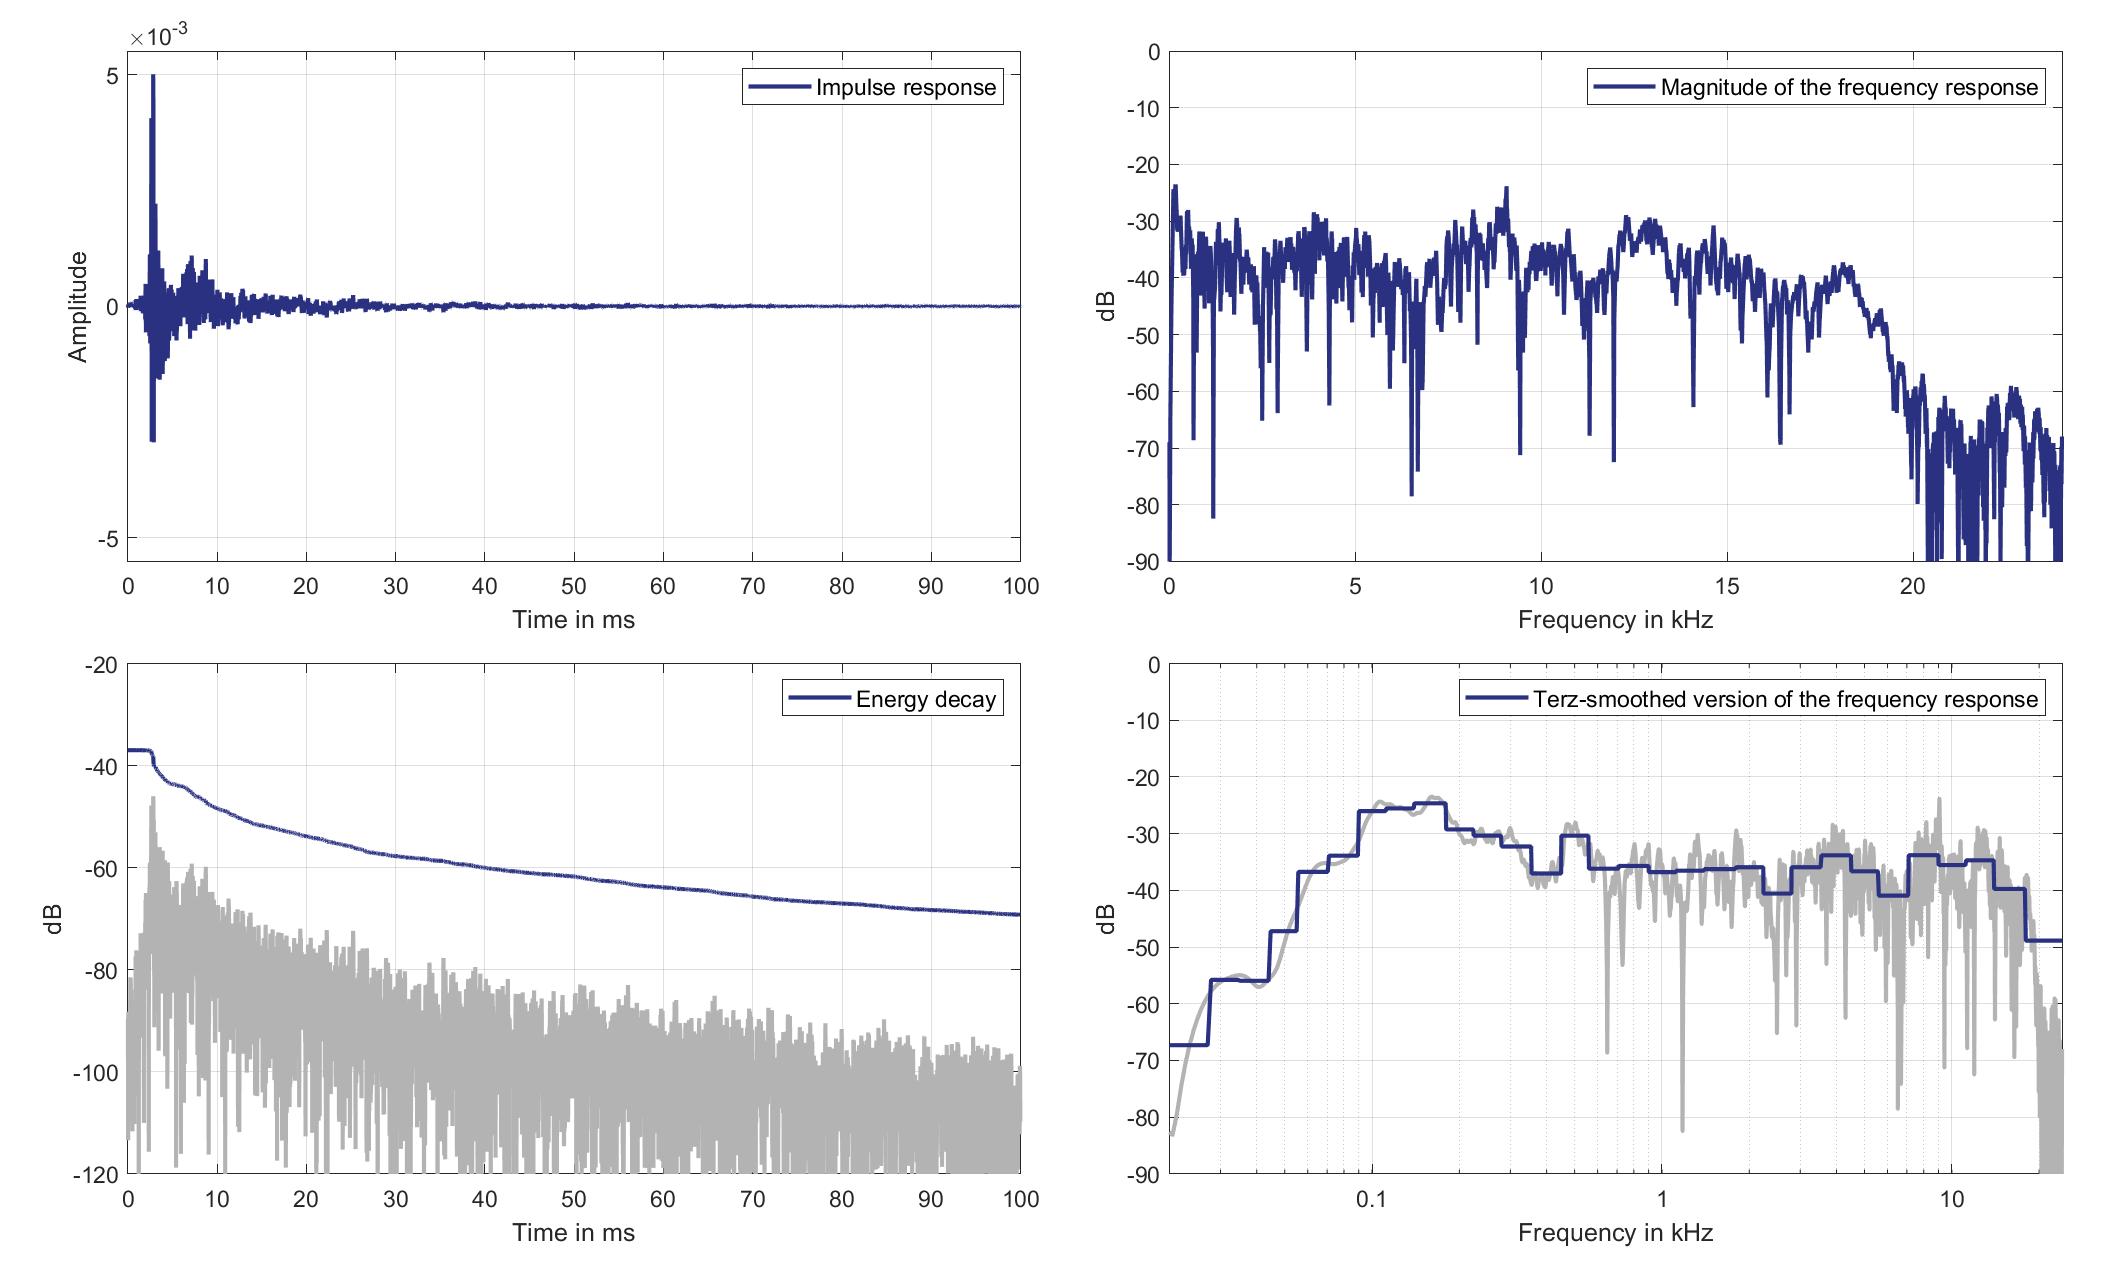
Download impulse response (in ".fir" format).
In the download section you can download all impulse response files as well as format explanation and Matlab as well as Python code examples for loading fir files.
Right Ear Microphone
Mouth Loudspeaker of Zone 6 (Lsp. 16) to Right Ear Microphone of Zone 3 (Mic. 24)
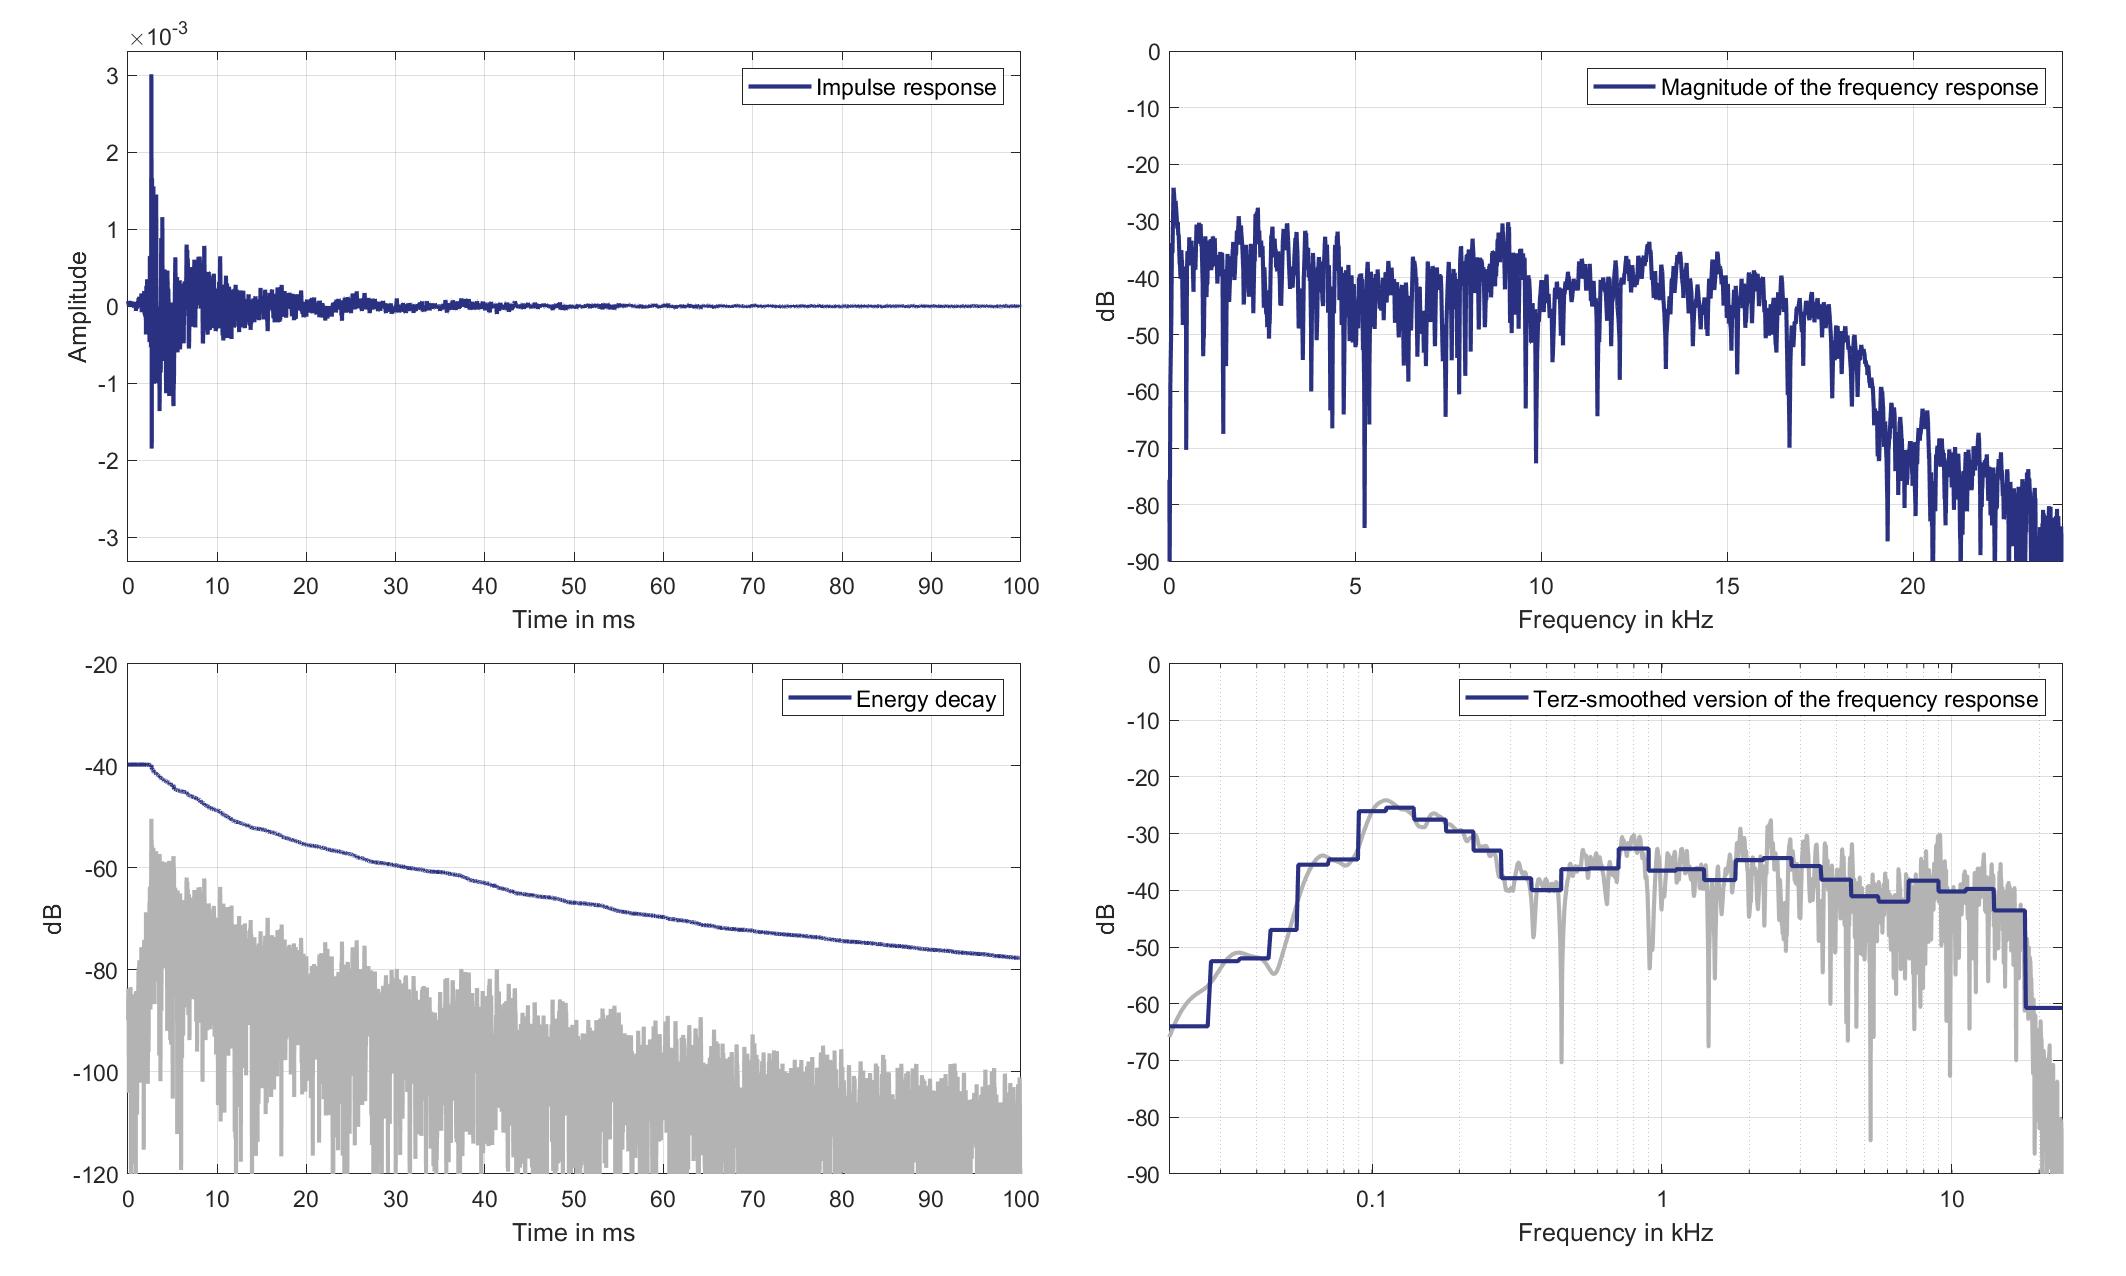
Download impulse response (in ".fir" format).
In the download section you can download all impulse response files as well as format explanation and Matlab as well as Python code examples for loading fir files.
Mics. 25/26
Left Ear Microphone
Mouth Loudspeaker of Zone 6 (Lsp. 16) to Left Ear Microphone of Zone 5 (Mic. 25)
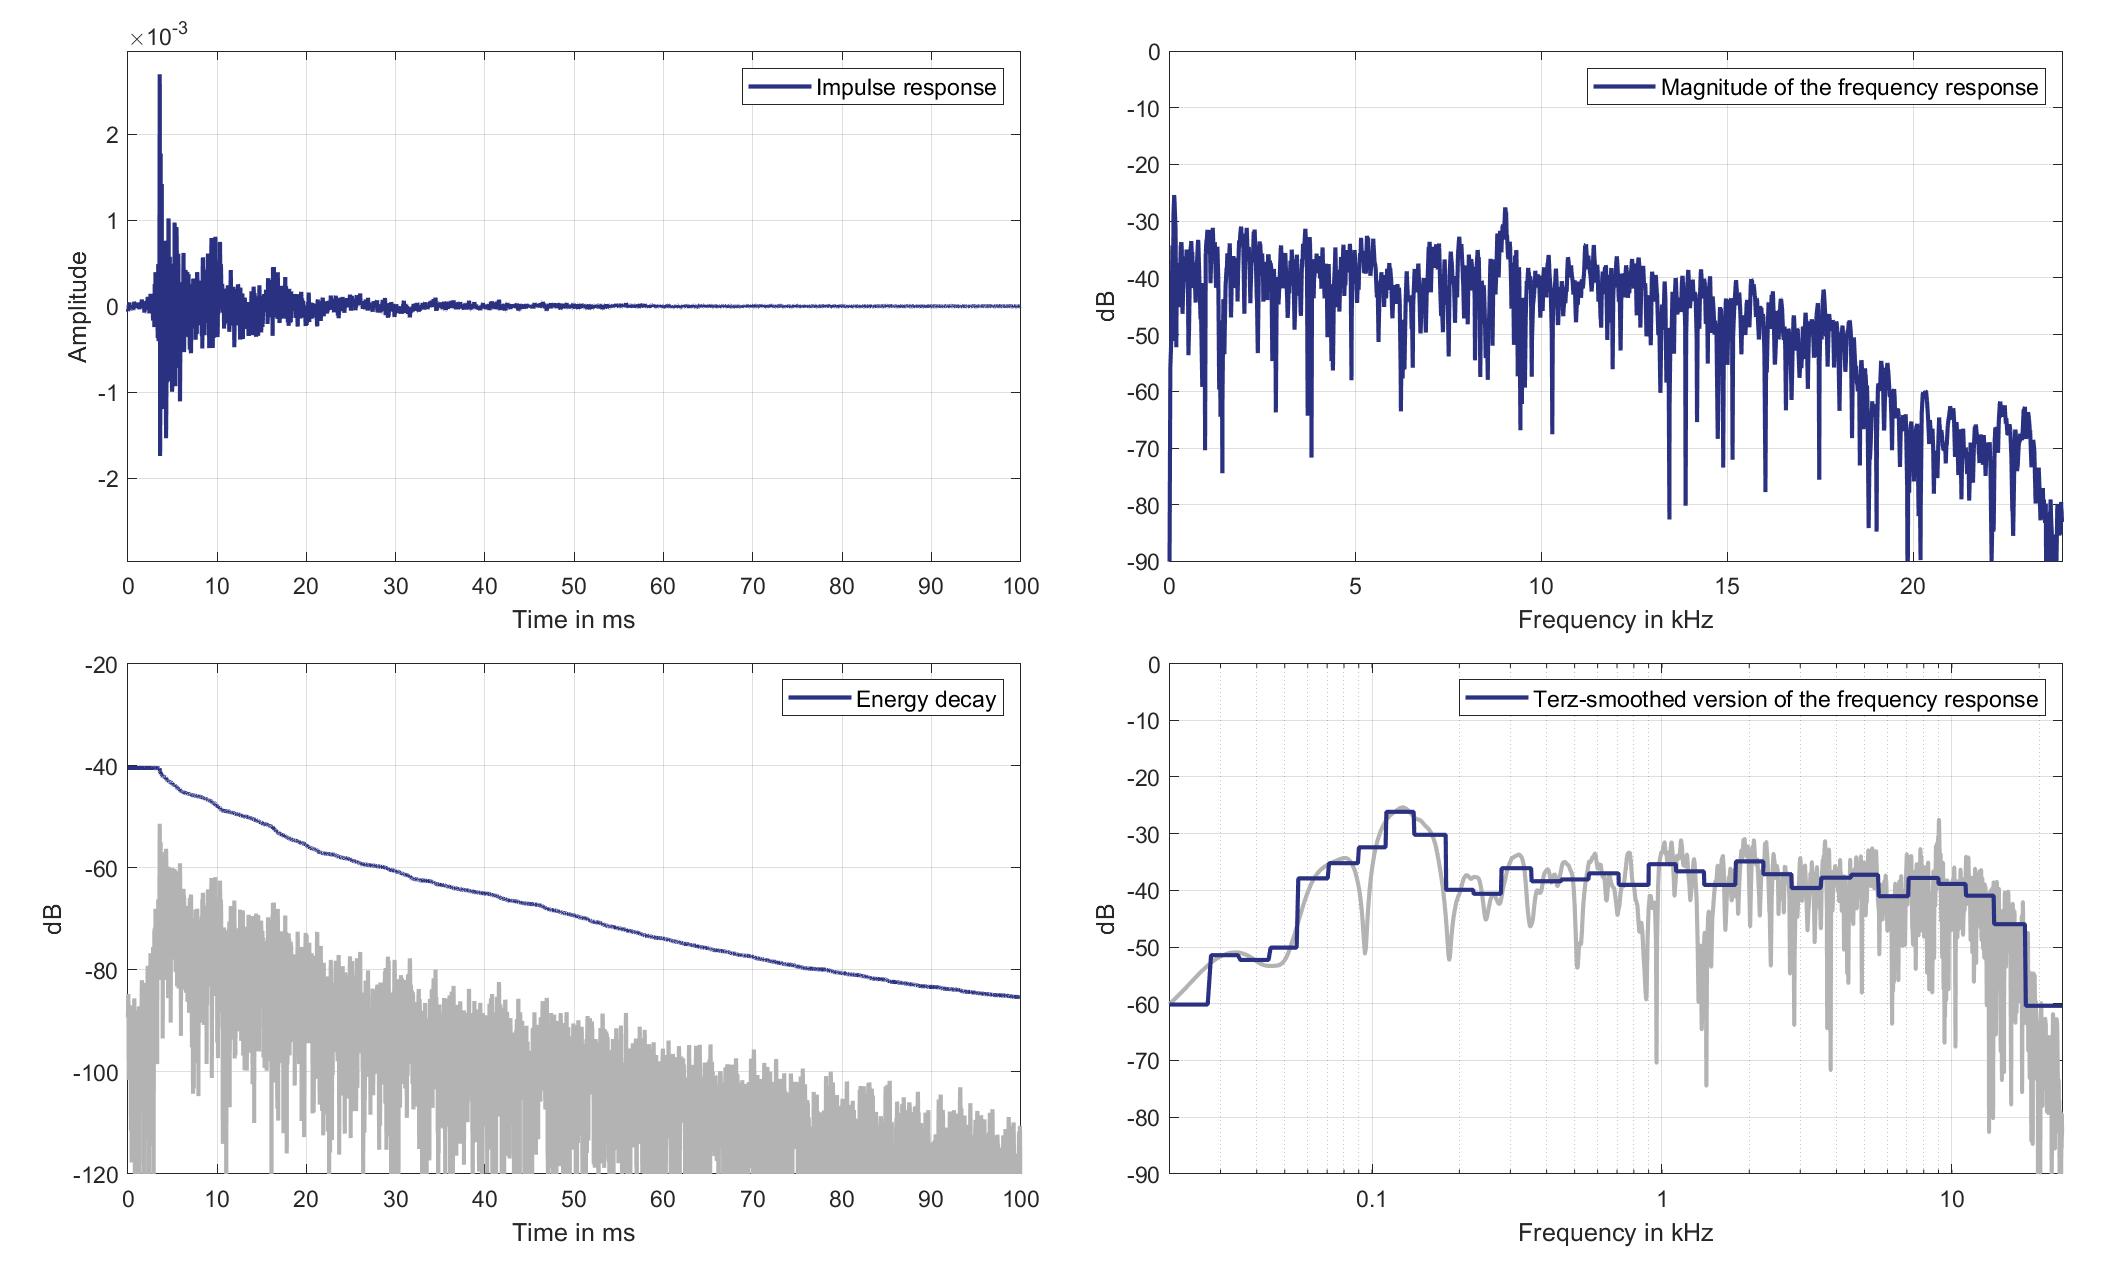
Download impulse response (in ".fir" format).
In the download section you can download all impulse response files as well as format explanation and Matlab as well as Python code examples for loading fir files.
Right Ear Microphone
Mouth Loudspeaker of Zone 6 (Lsp. 16) to Right Ear Microphone of Zone 5 (Mic. 26)
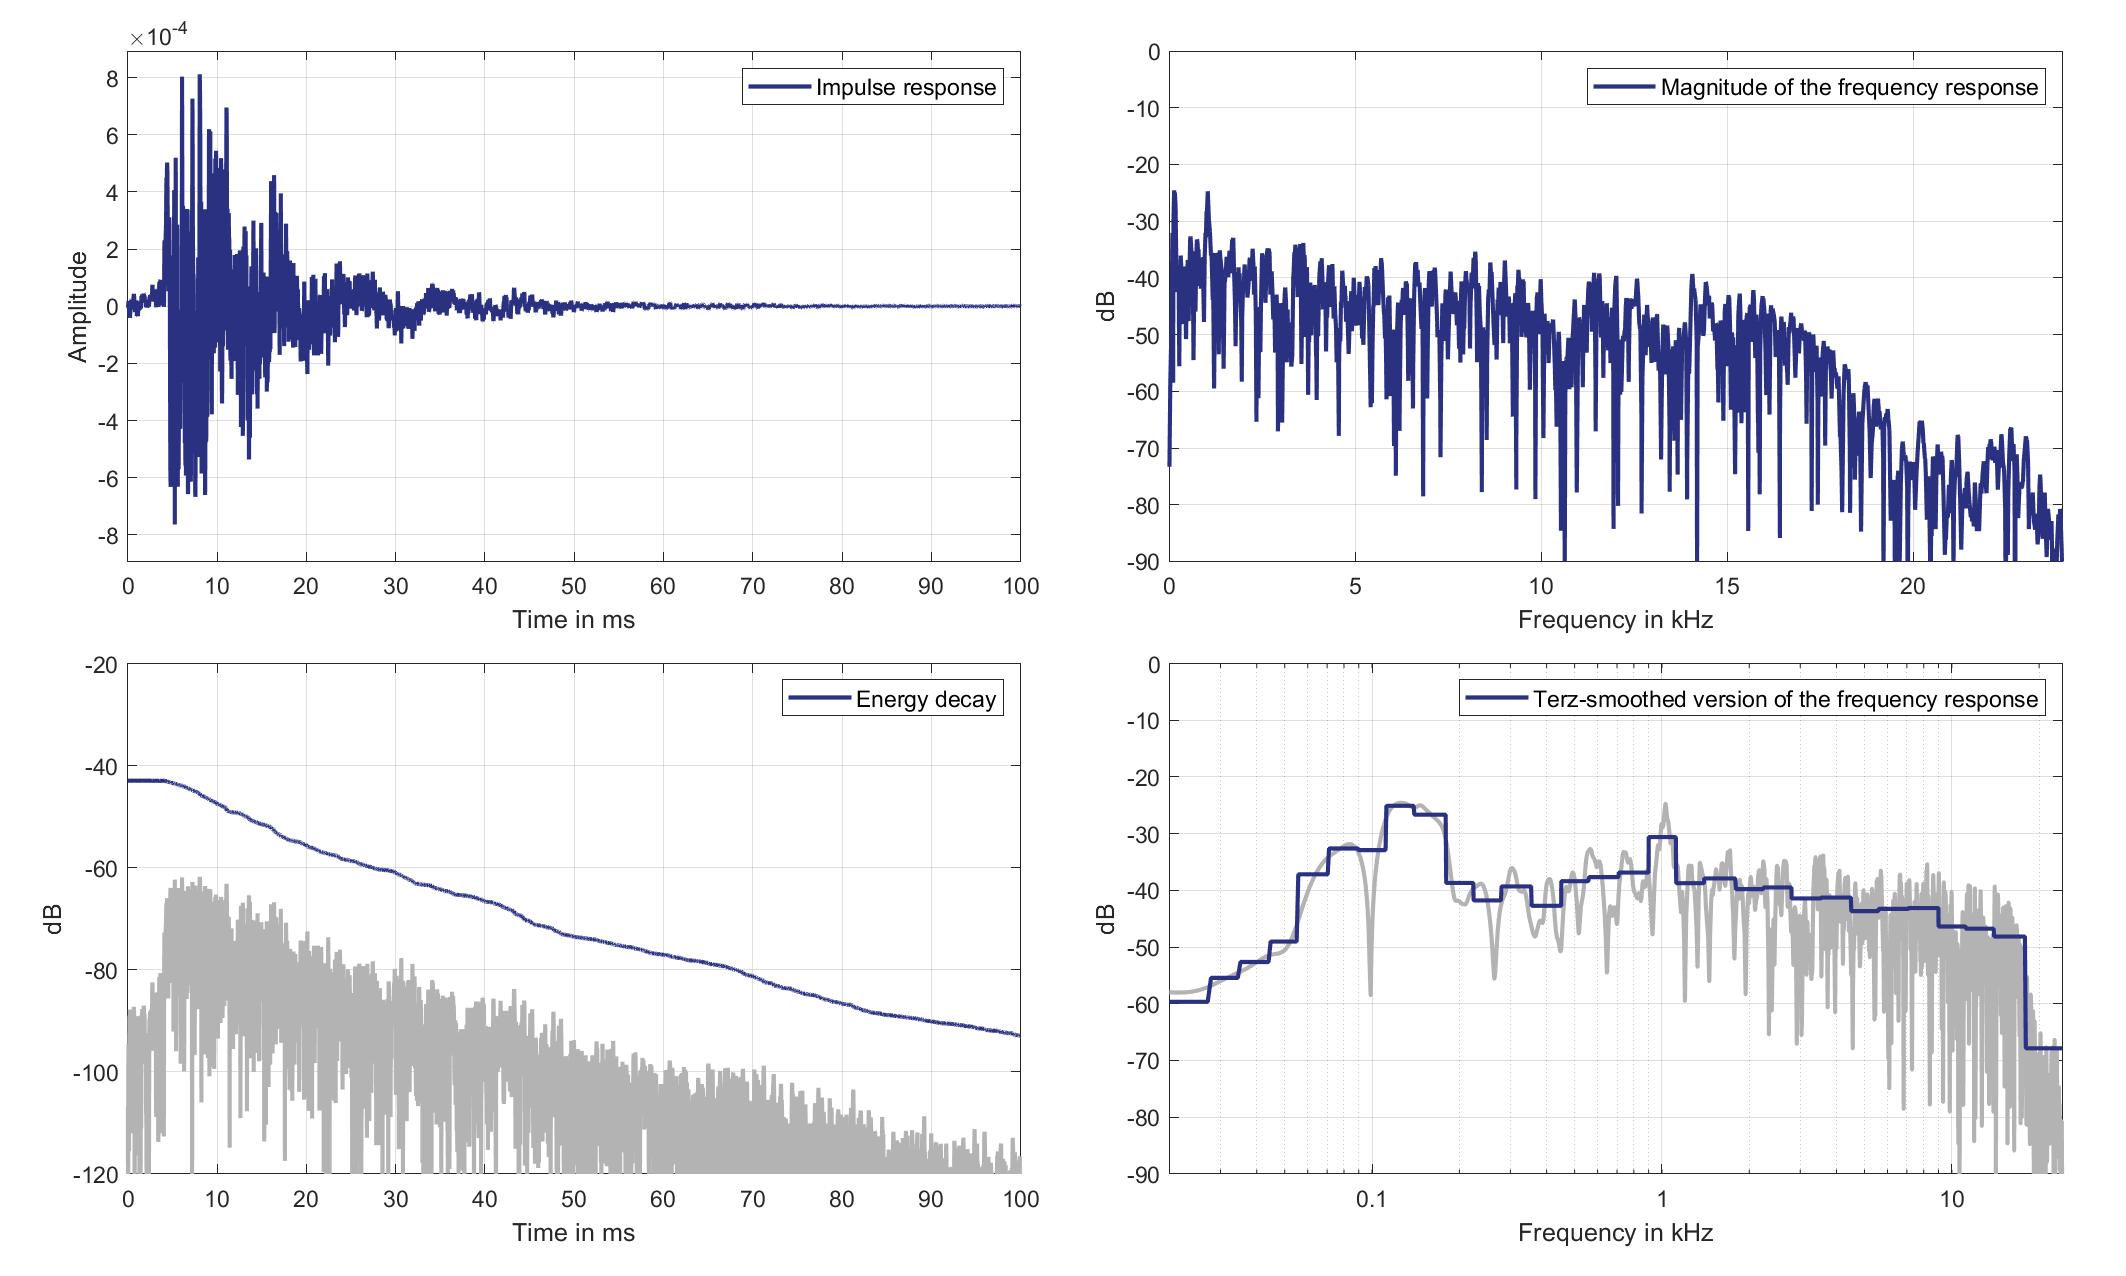
Download impulse response (in ".fir" format).
In the download section you can download all impulse response files as well as format explanation and Matlab as well as Python code examples for loading fir files.
Mics. 27/28
Left Ear Microphone
Mouth Loudspeaker of Zone 6 (Lsp. 16) to Left Ear Microphone of Zone 6 (Mic. 27)
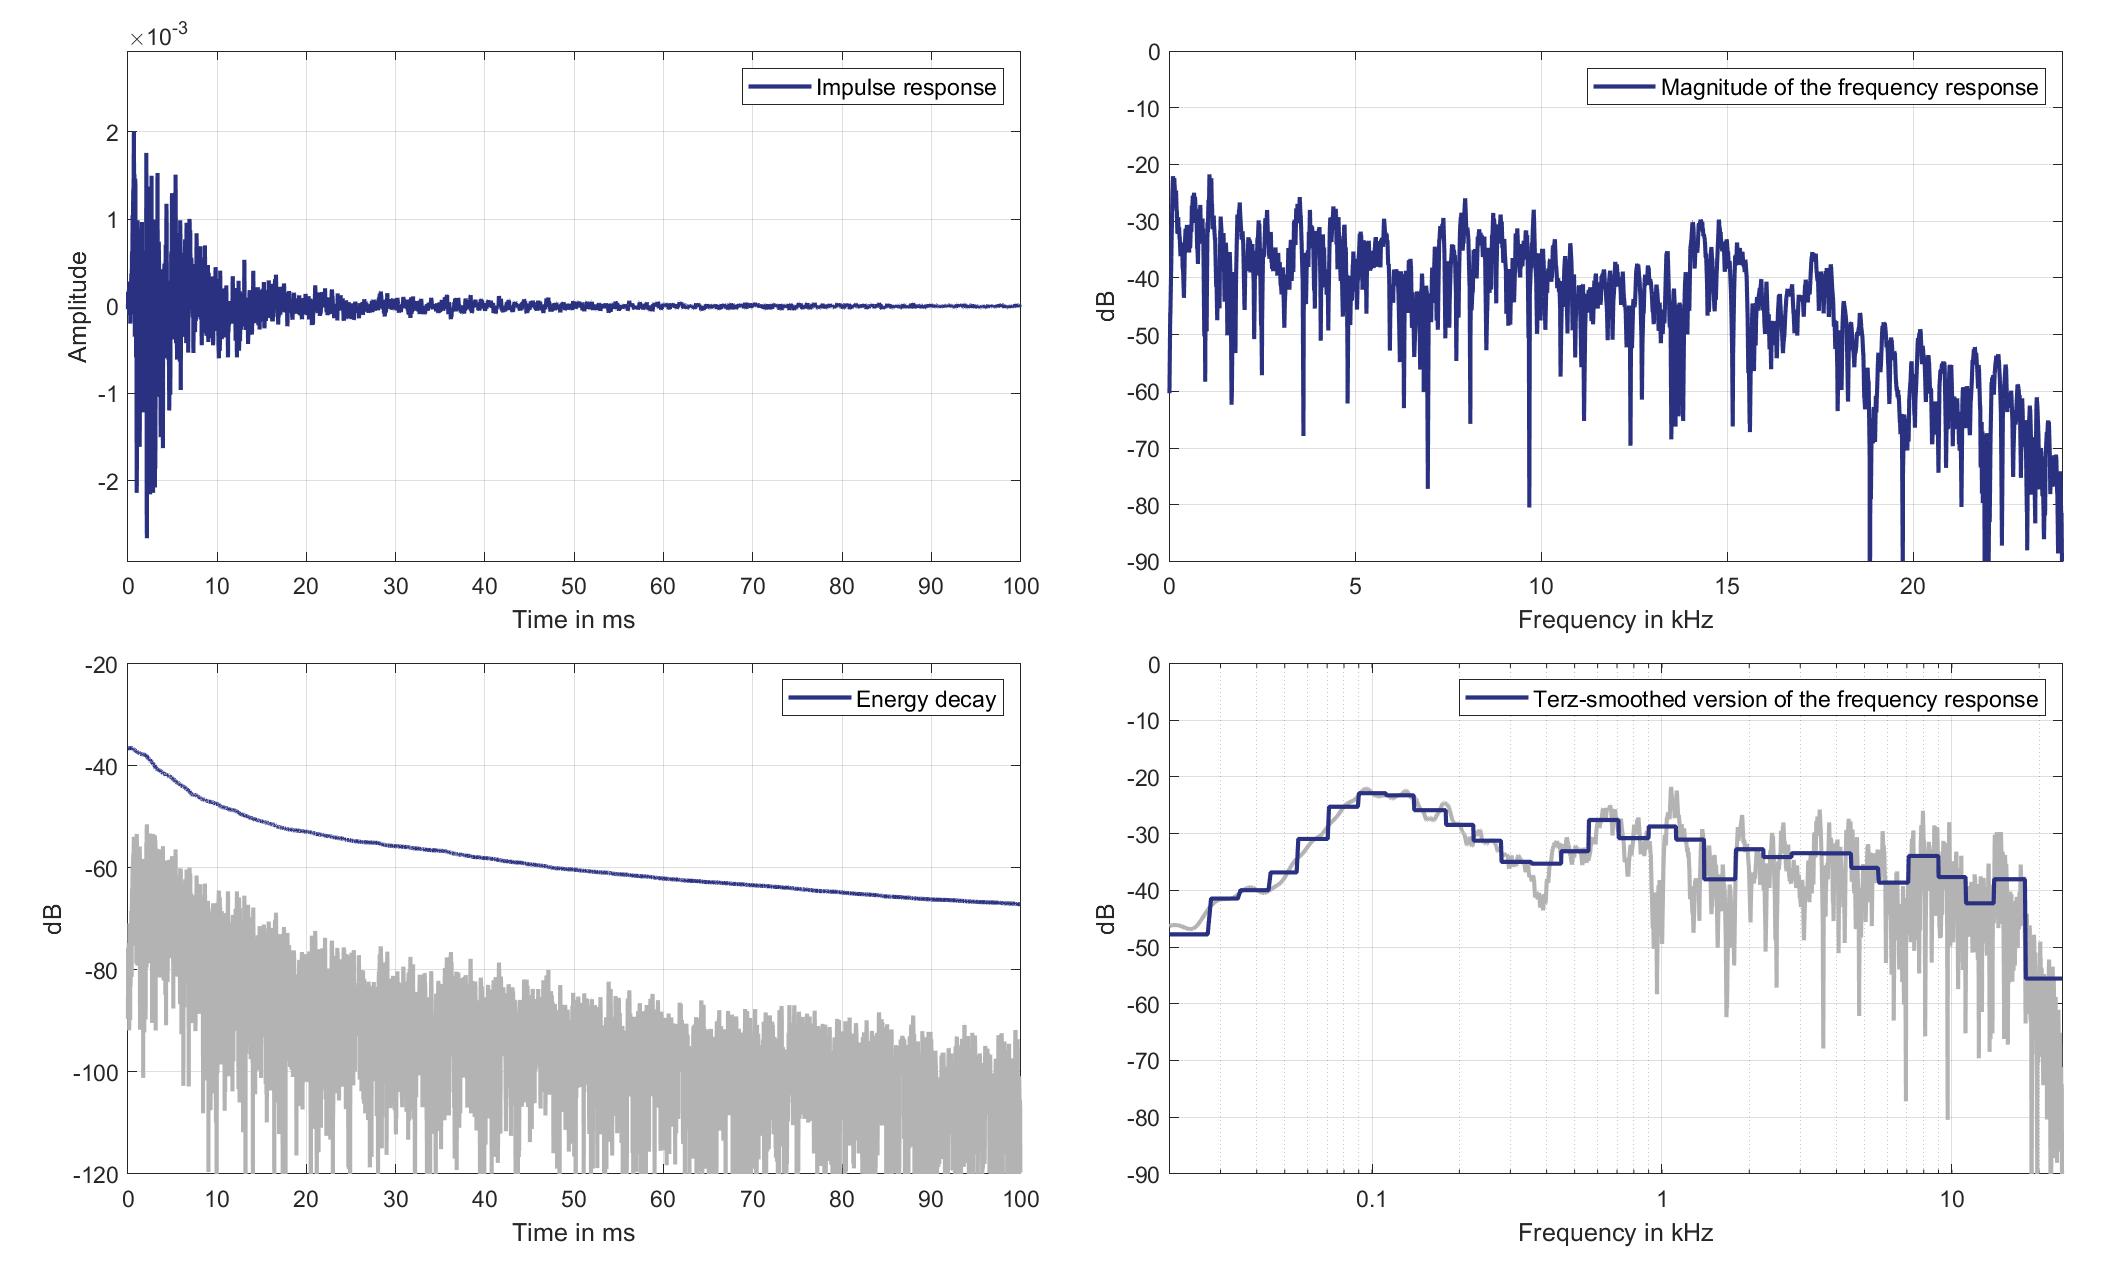
Download impulse response (in ".fir" format).
In the download section you can download all impulse response files as well as format explanation and Matlab as well as Python code examples for loading fir files.
Right Ear Microphone
Mouth Loudspeaker of Zone 6 (Lsp. 16) to Right Ear Microphone of Zone 6 (Mic. 28)
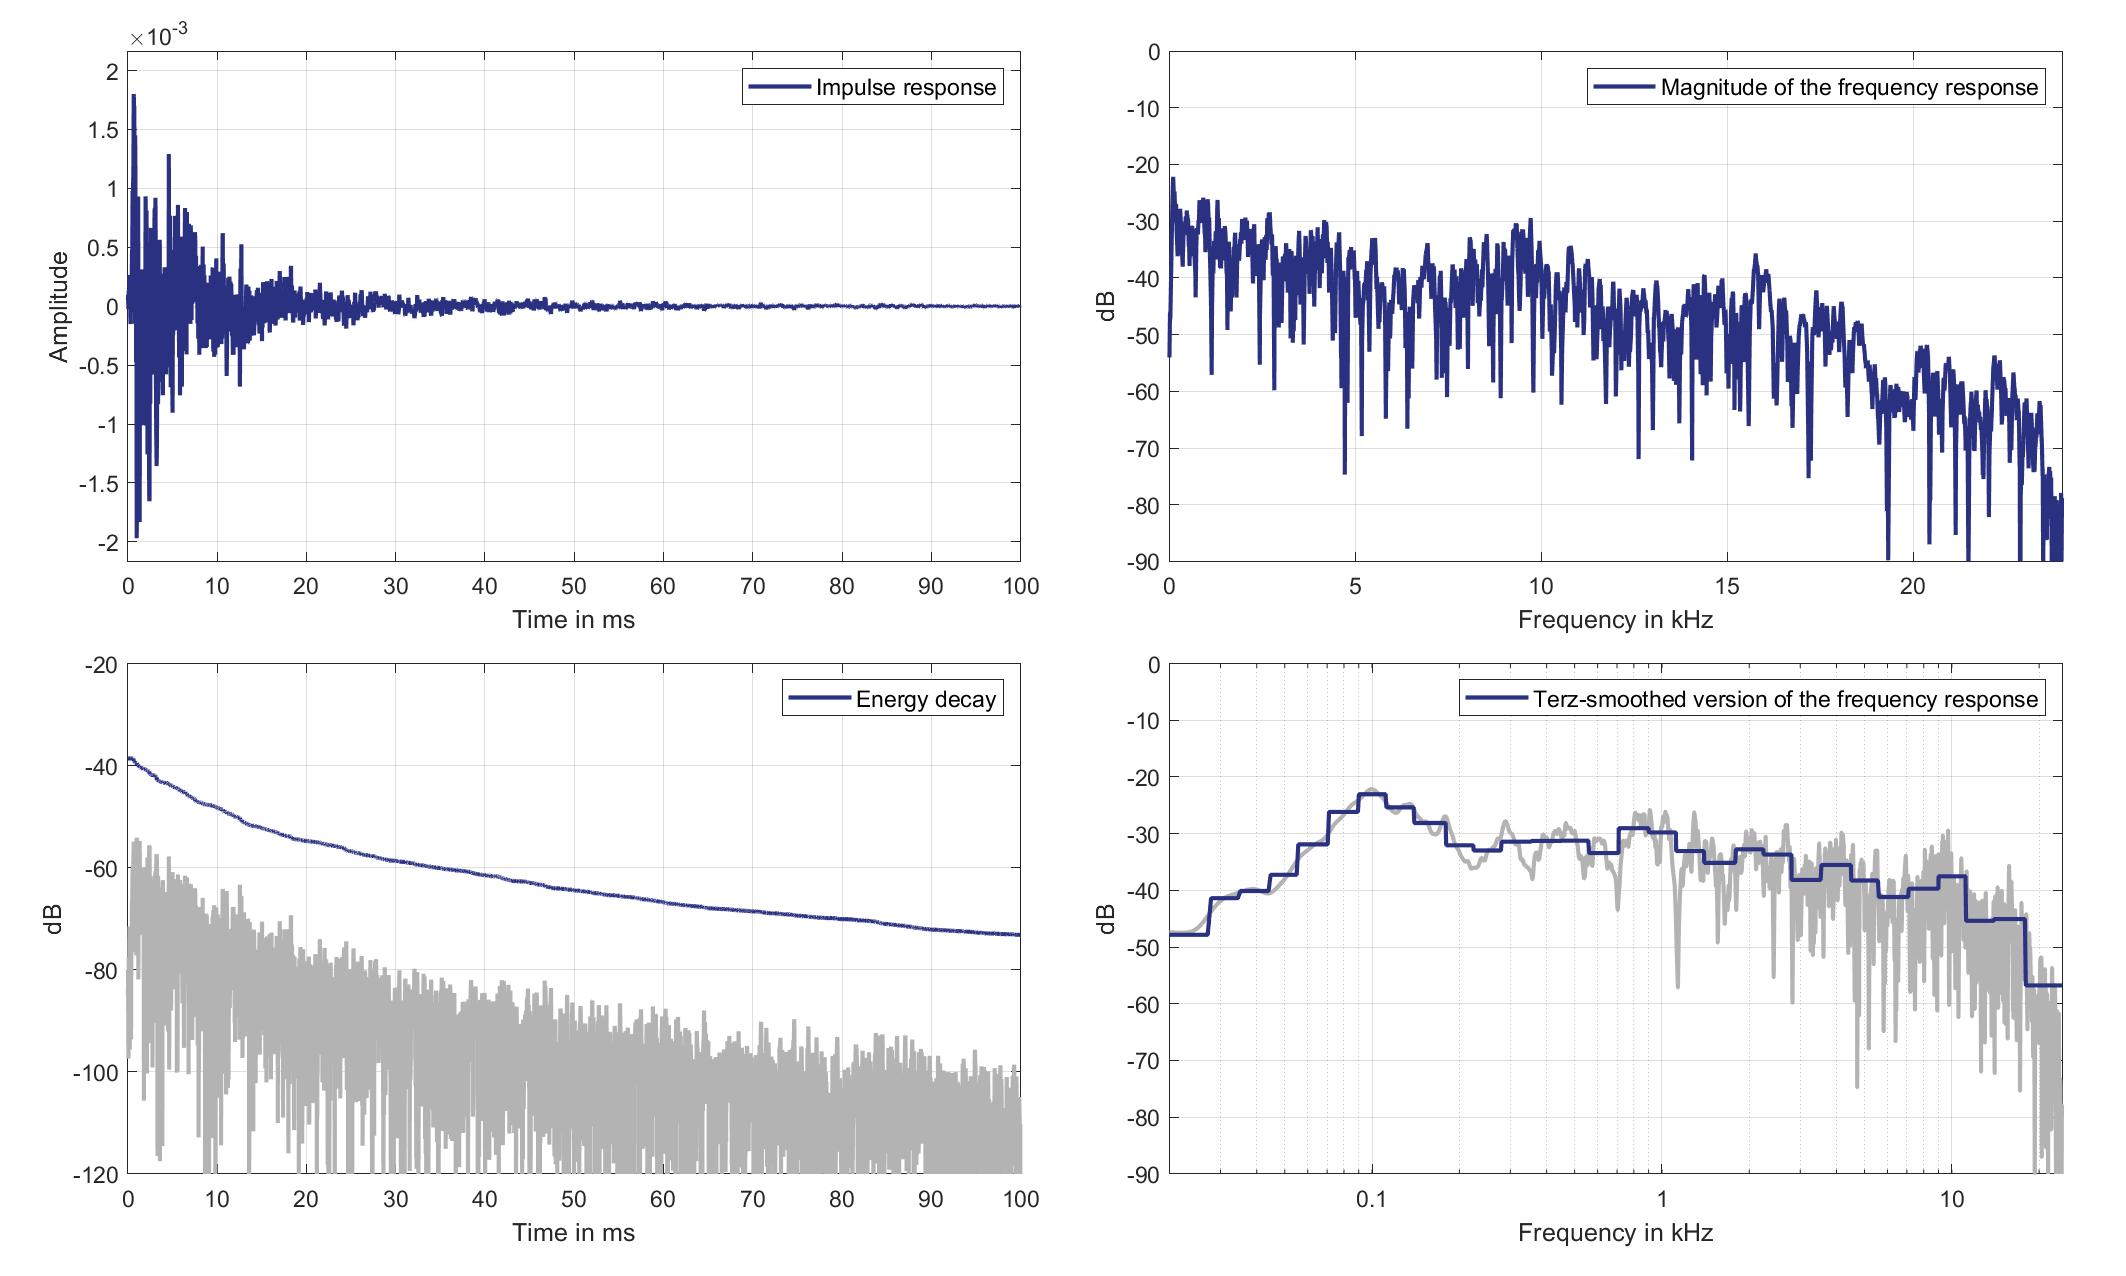
Download impulse response (in ".fir" format).
In the download section you can download all impulse response files as well as format explanation and Matlab as well as Python code examples for loading fir files.
Mics. 29/30
Left Ear Microphone
Mouth Loudspeaker of Zone 6 (Lsp. 16) to Left Ear Microphone of Zone 8 (Mic. 29)
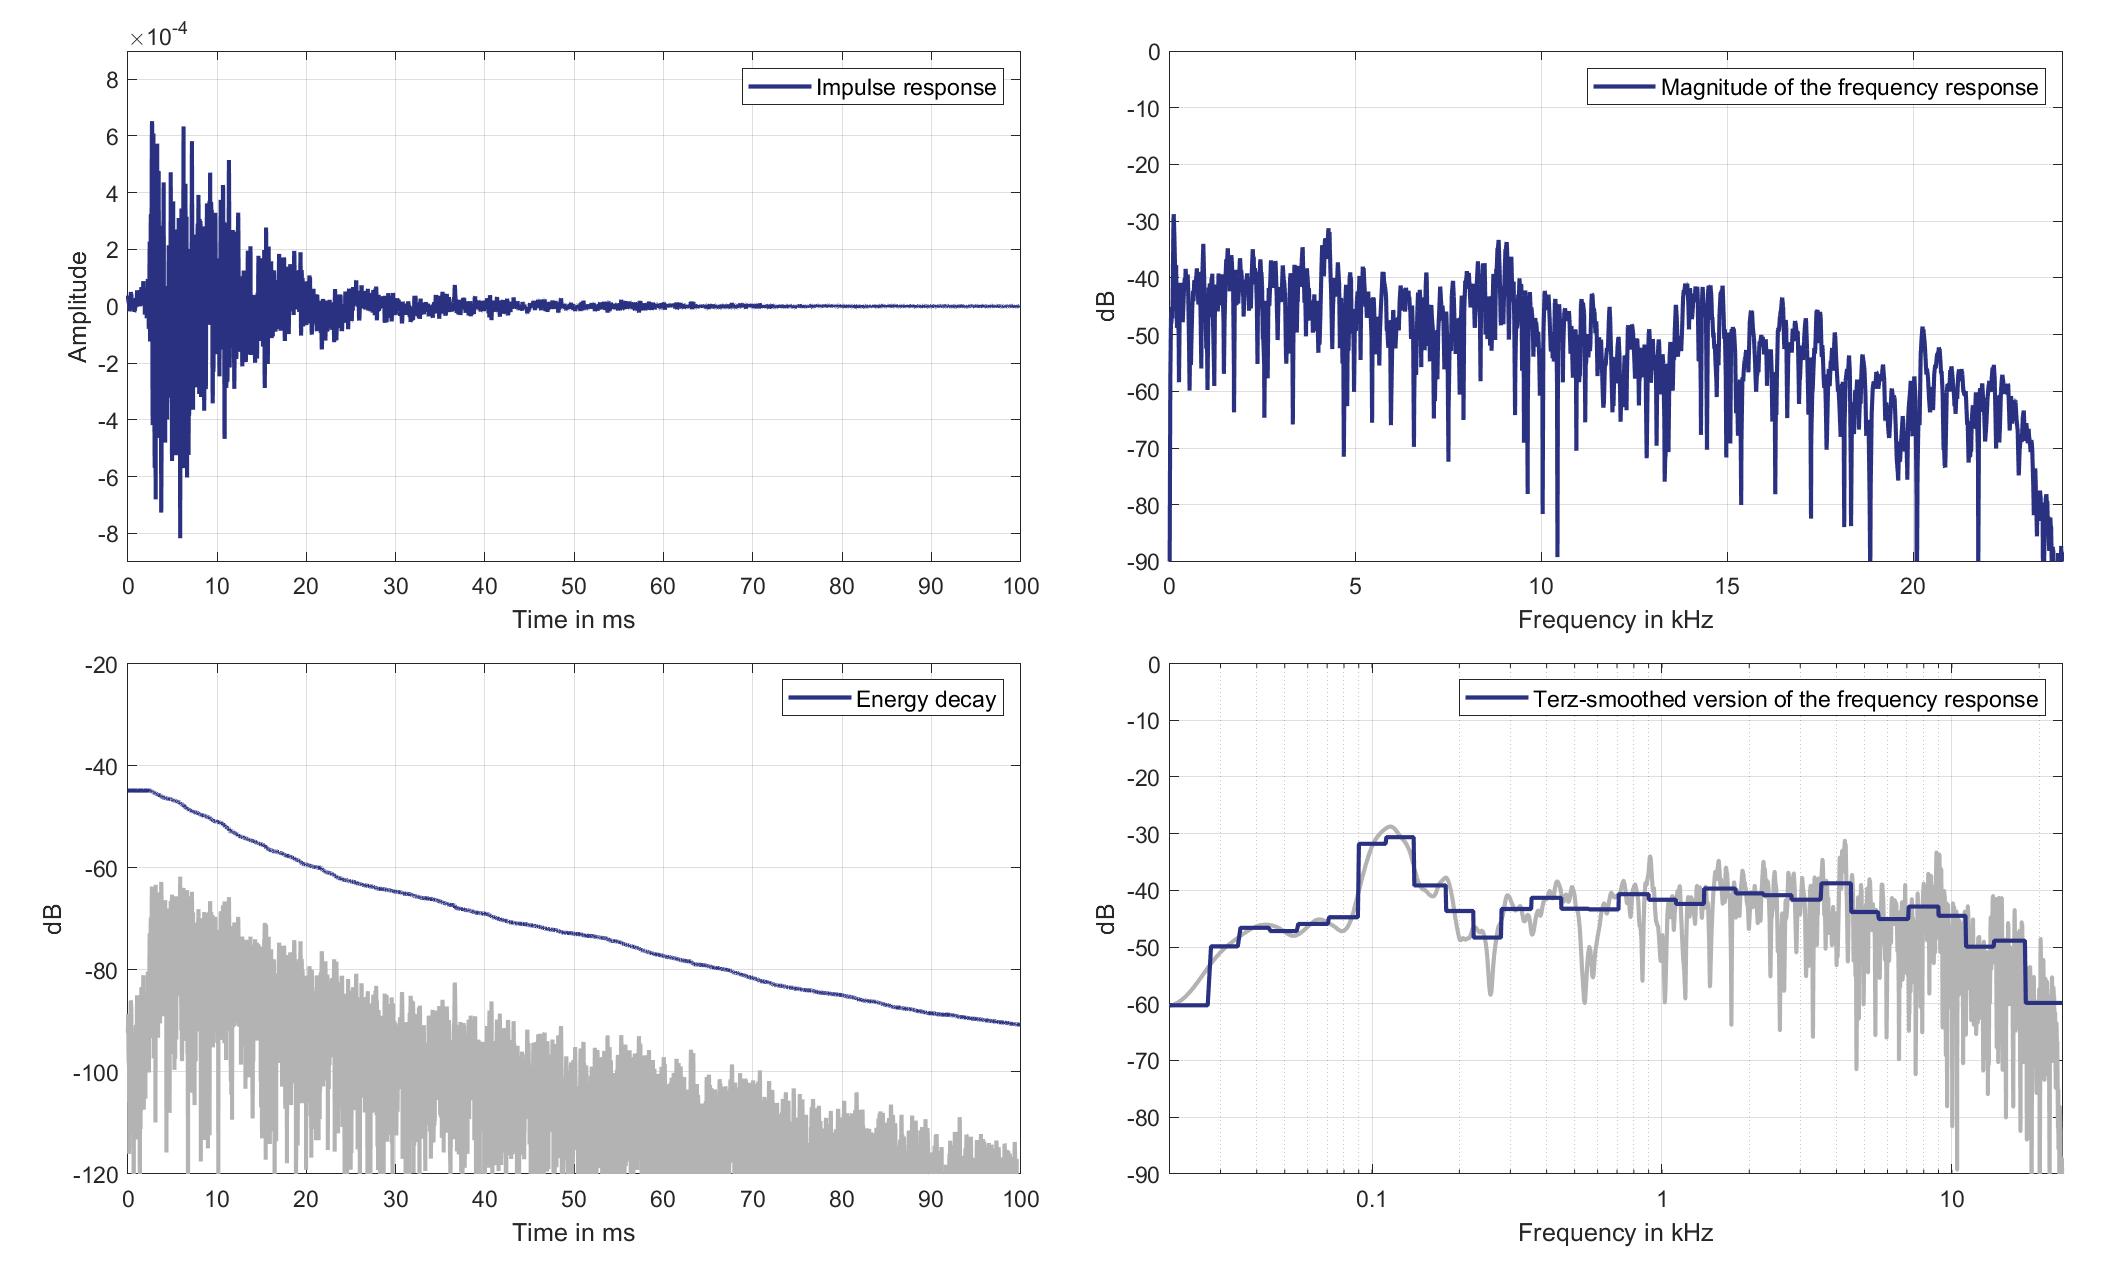
Download impulse response (in ".fir" format).
In the download section you can download all impulse response files as well as format explanation and Matlab as well as Python code examples for loading fir files.
Right Ear Microphone
Mouth Loudspeaker of Zone 6 (Lsp. 16) to Right Ear Microphone of Zone 8 (Mic. 30)
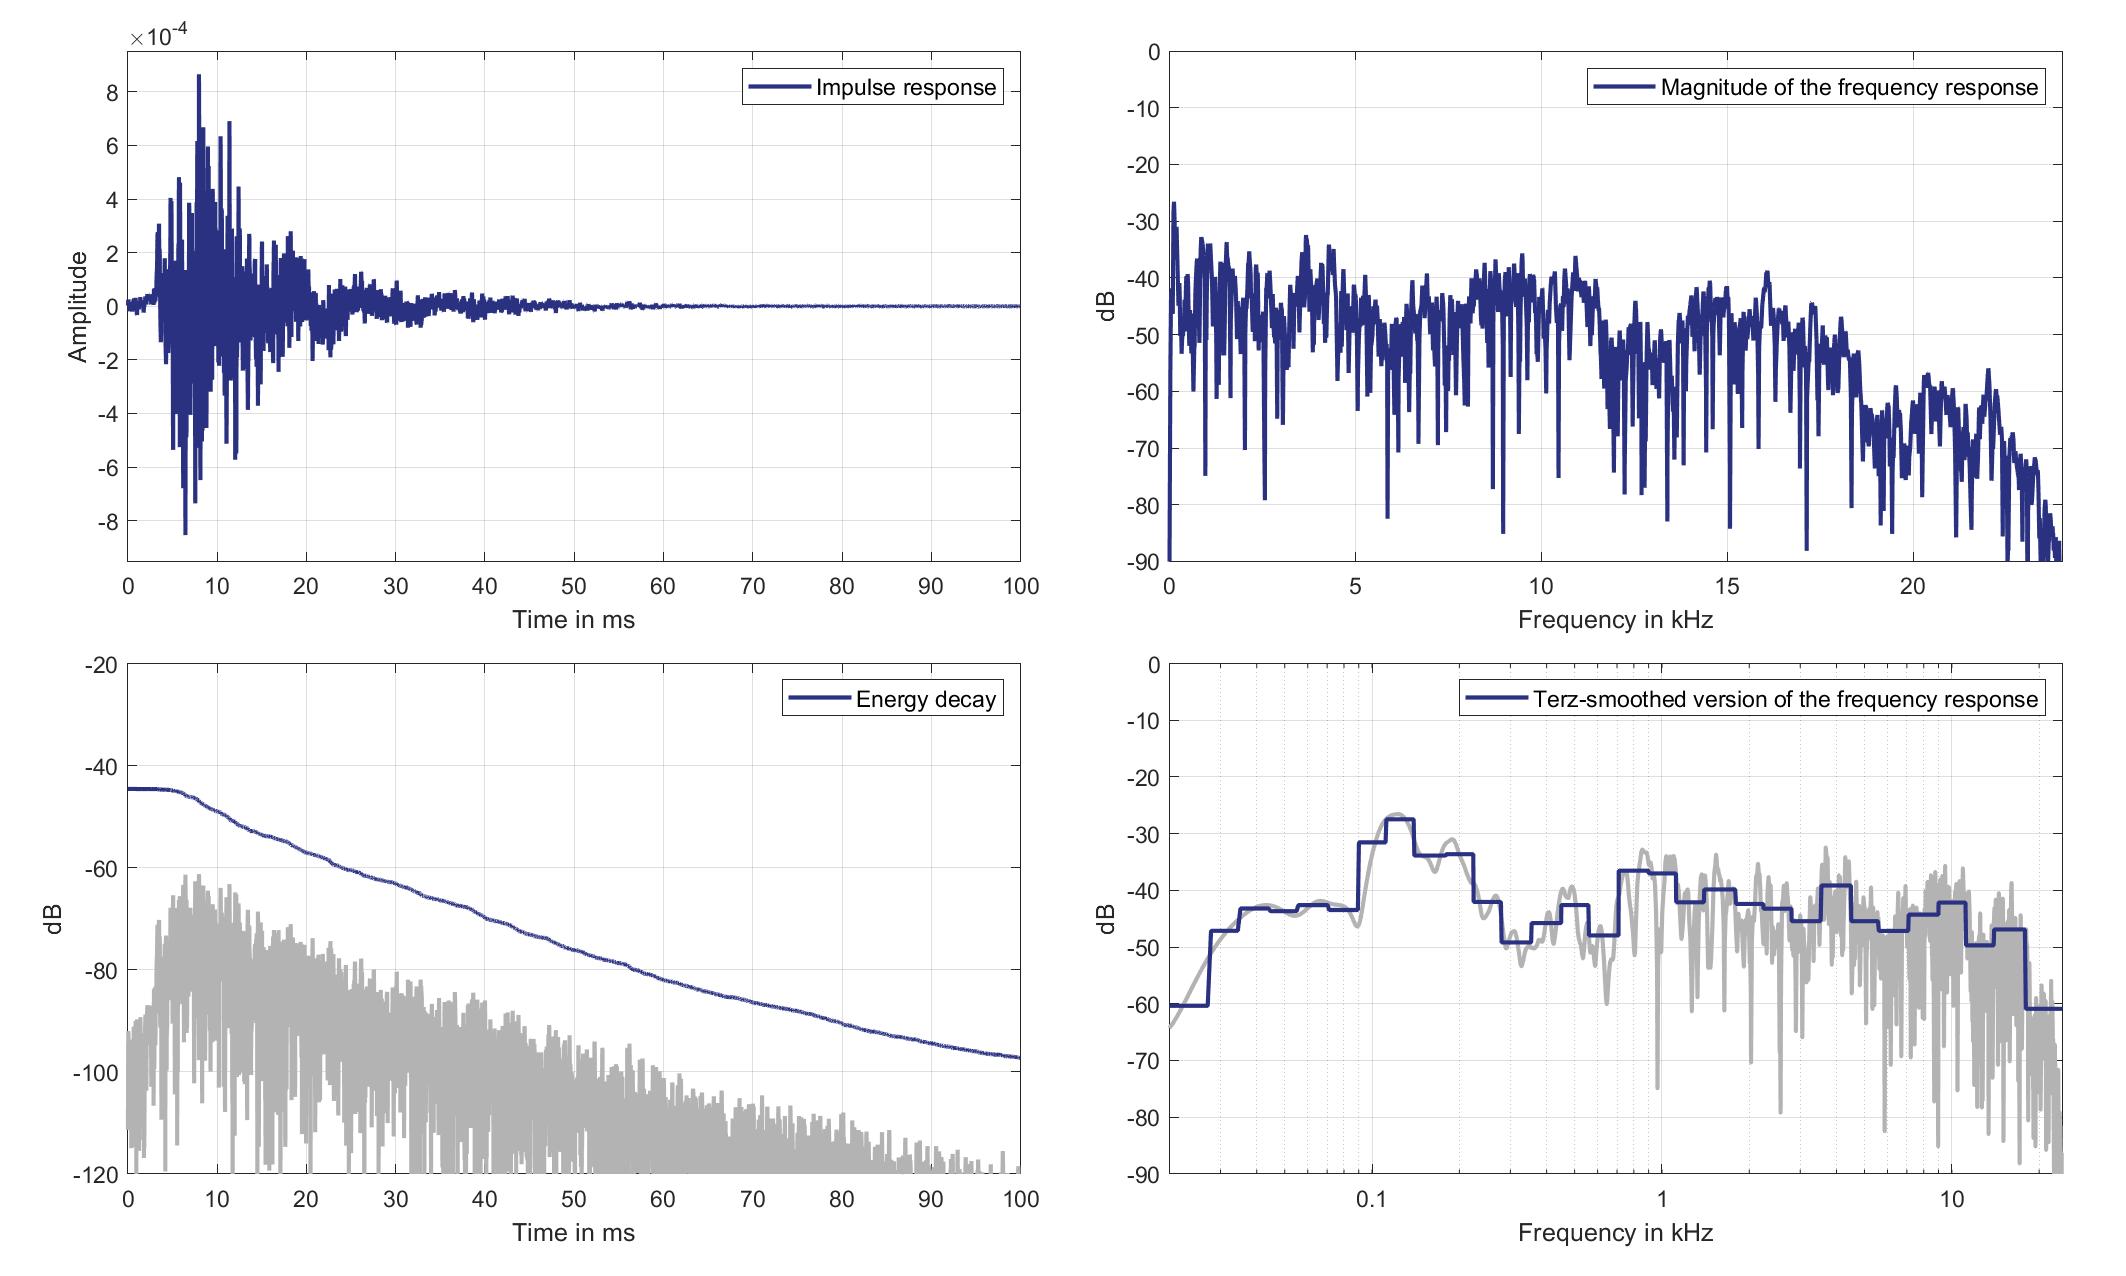
Download impulse response (in ".fir" format).
In the download section you can download all impulse response files as well as format explanation and Matlab as well as Python code examples for loading fir files.
Lsp. 17
Mics. 19/20
Left Ear Microphone
Mouth Loudspeaker of Zone 8 (Lsp. 17) to Left Ear Microphone of Zone 1 (Mic. 19)
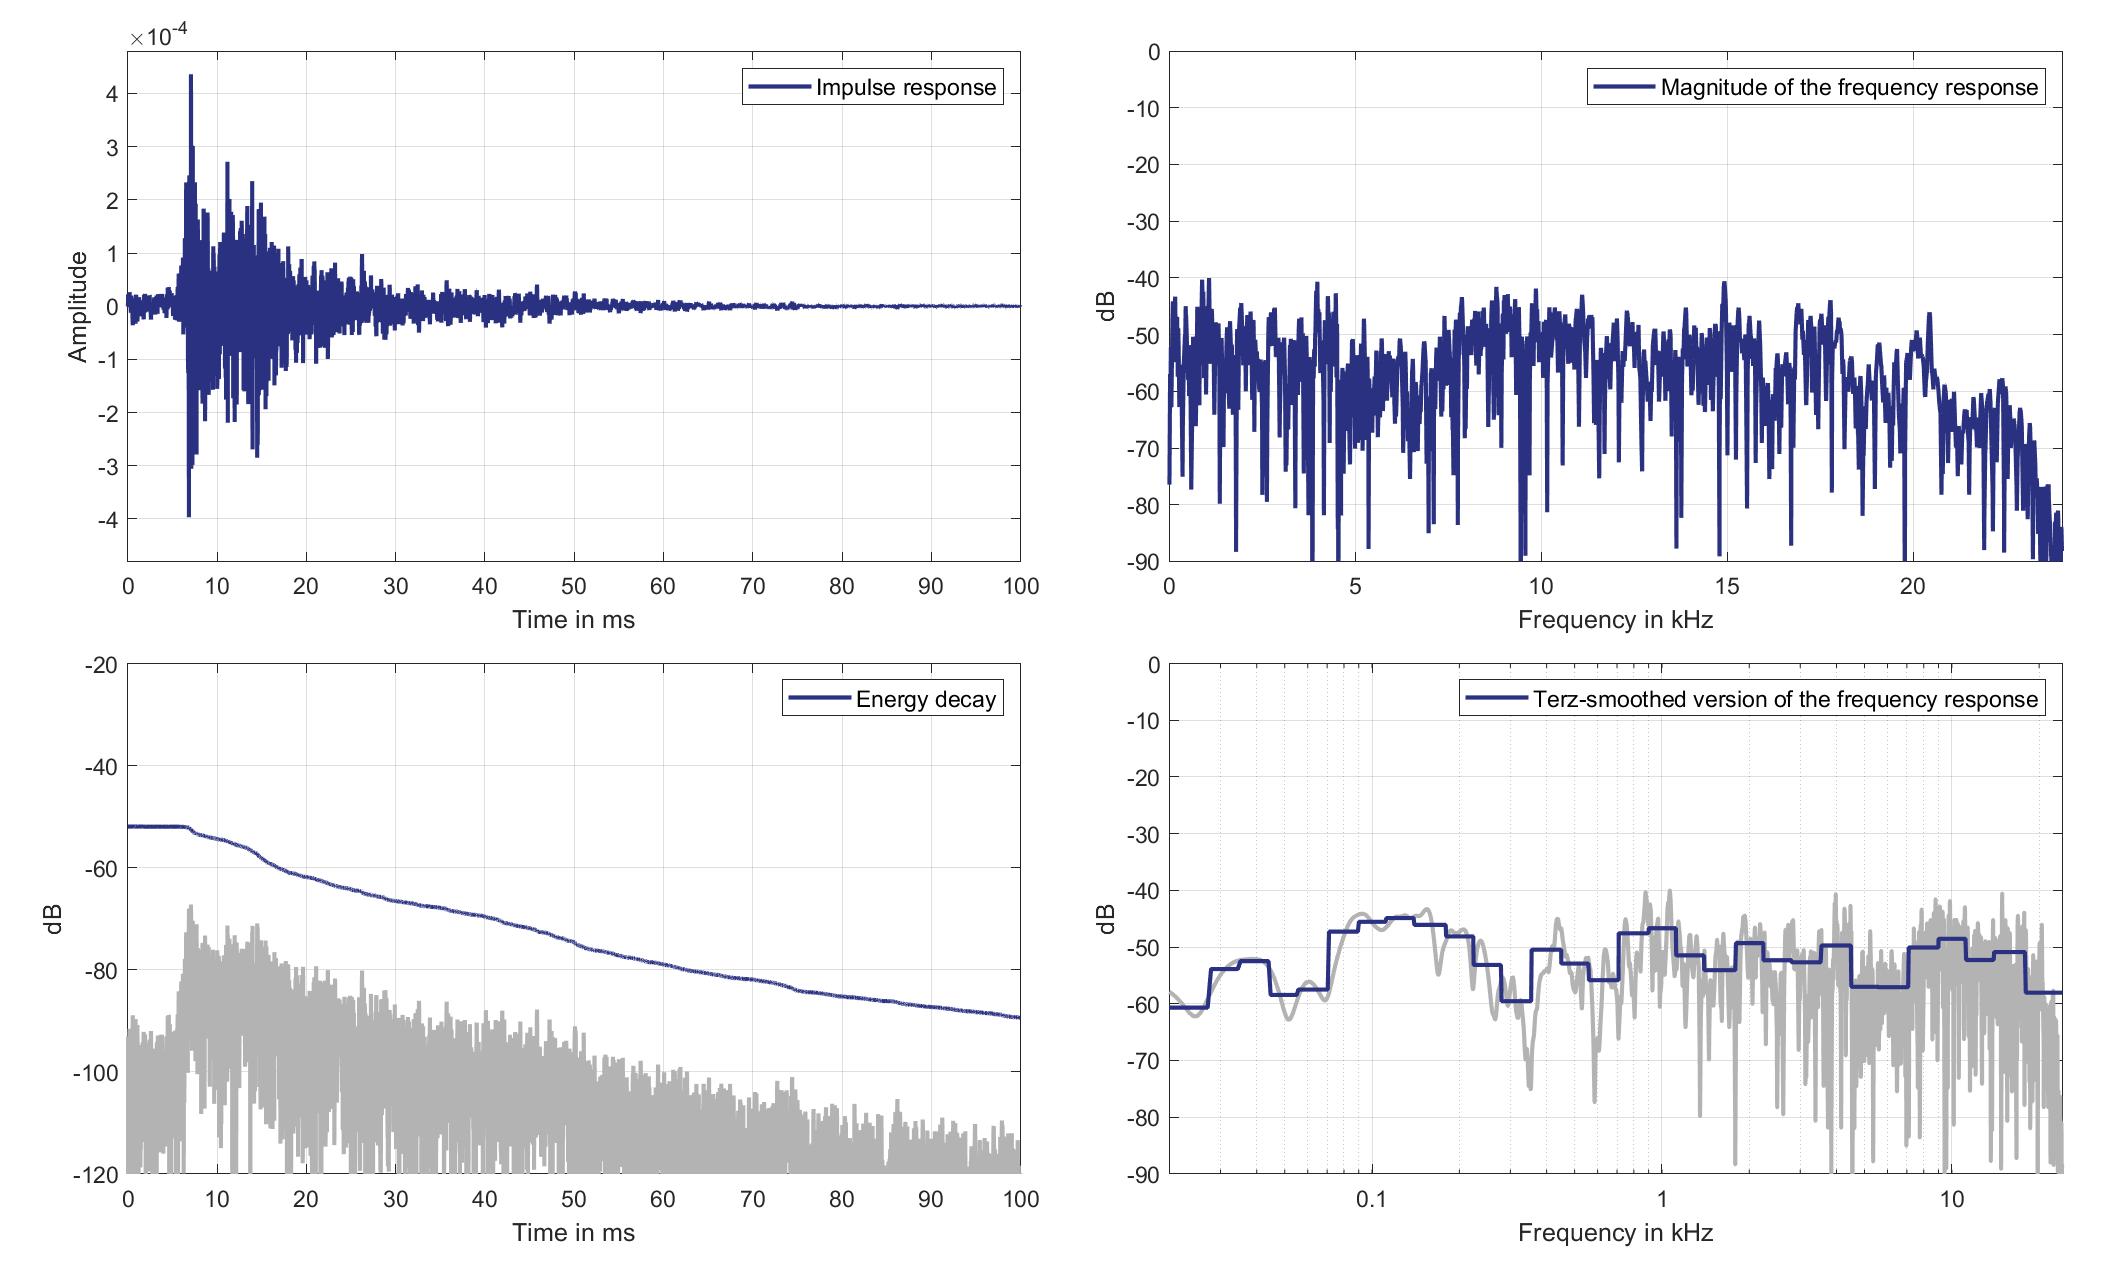
Download impulse response (in ".fir" format).
In the download section you can download all impulse response files as well as format explanation and Matlab as well as Python code examples for loading fir files.
Right Ear Microphone
Mouth Loudspeaker of Zone 8 (Lsp. 17) to Right Ear Microphone of Zone 1 (Mic. 20)
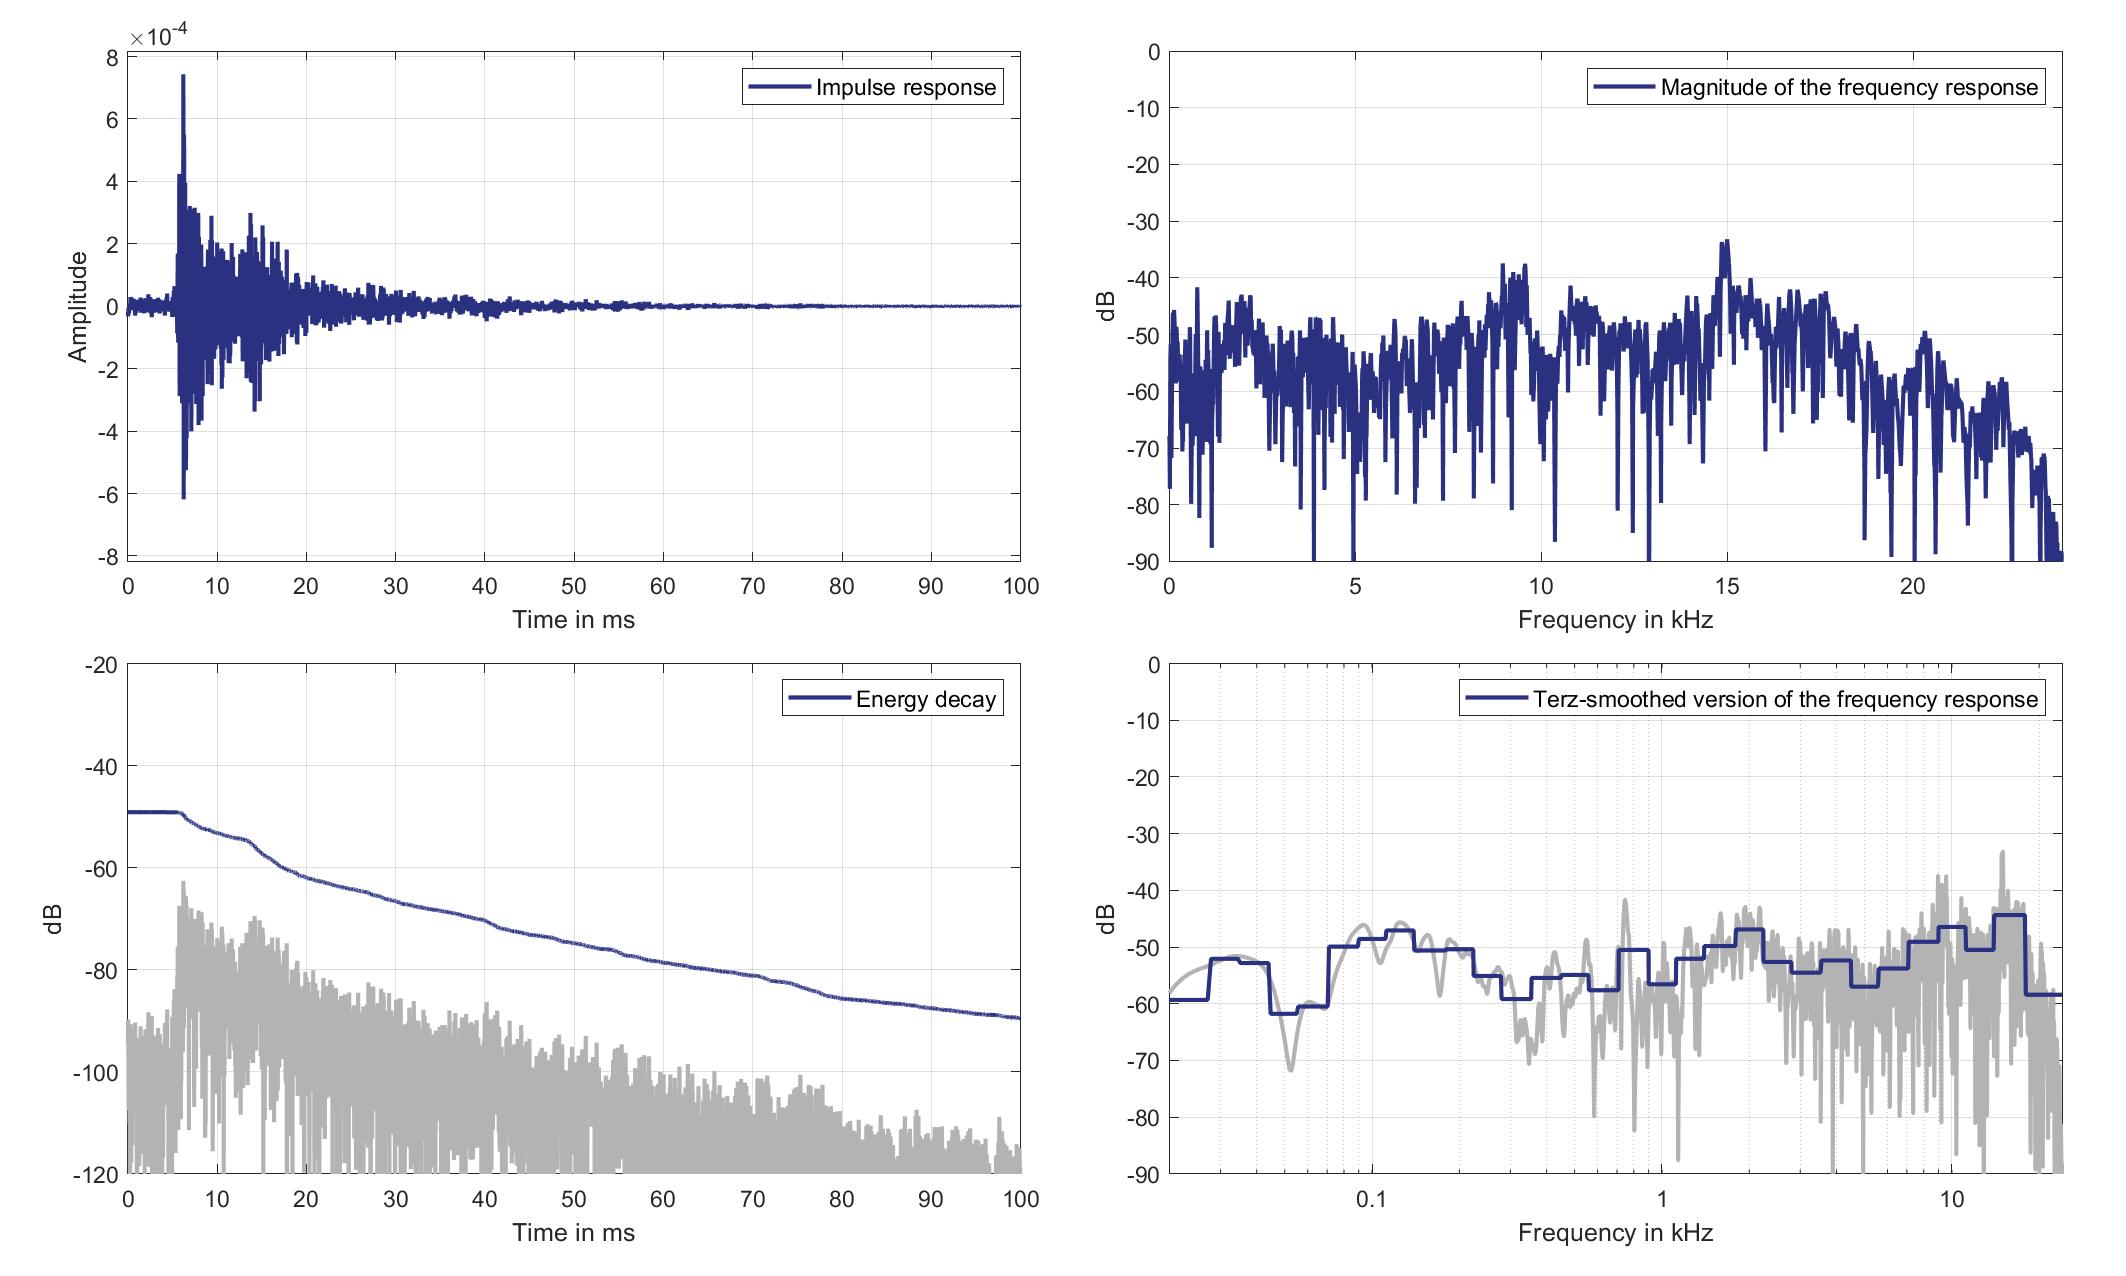
Download impulse response (in ".fir" format).
In the download section you can download all impulse response files as well as format explanation and Matlab as well as Python code examples for loading fir files.
Mics. 21/22
Left Ear Microphone
Mouth Loudspeaker of Zone 8 (Lsp. 17) to Left Ear Microphone of Zone 2 (Mic. 21)
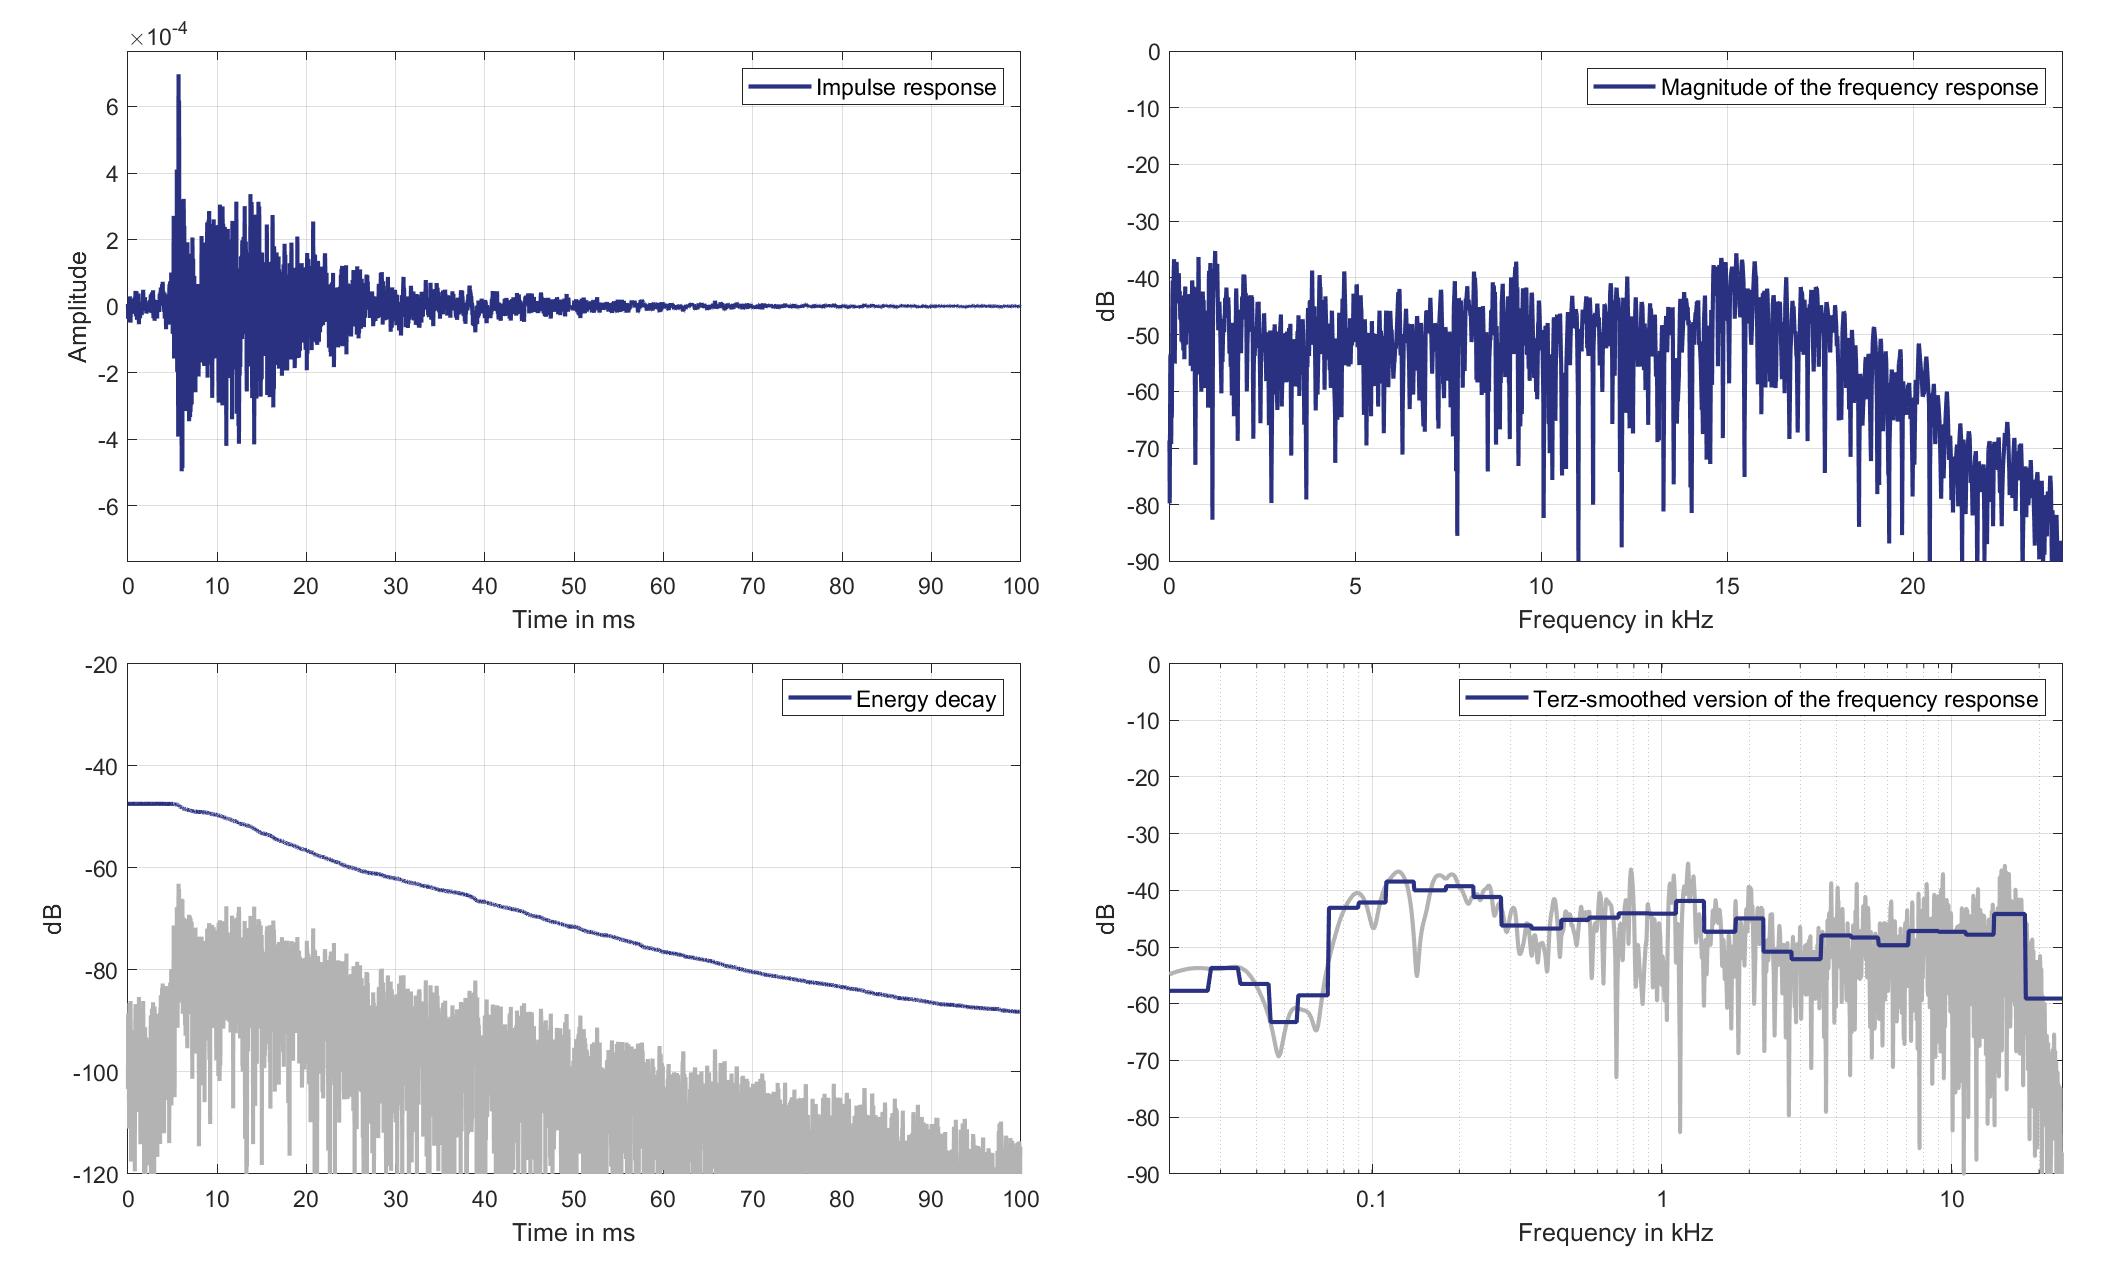
Download impulse response (in ".fir" format).
In the download section you can download all impulse response files as well as format explanation and Matlab as well as Python code examples for loading fir files.
Right Ear Microphone
Mouth Loudspeaker of Zone 8 (Lsp. 17) to Right Ear Microphone of Zone 2 (Mic. 22)
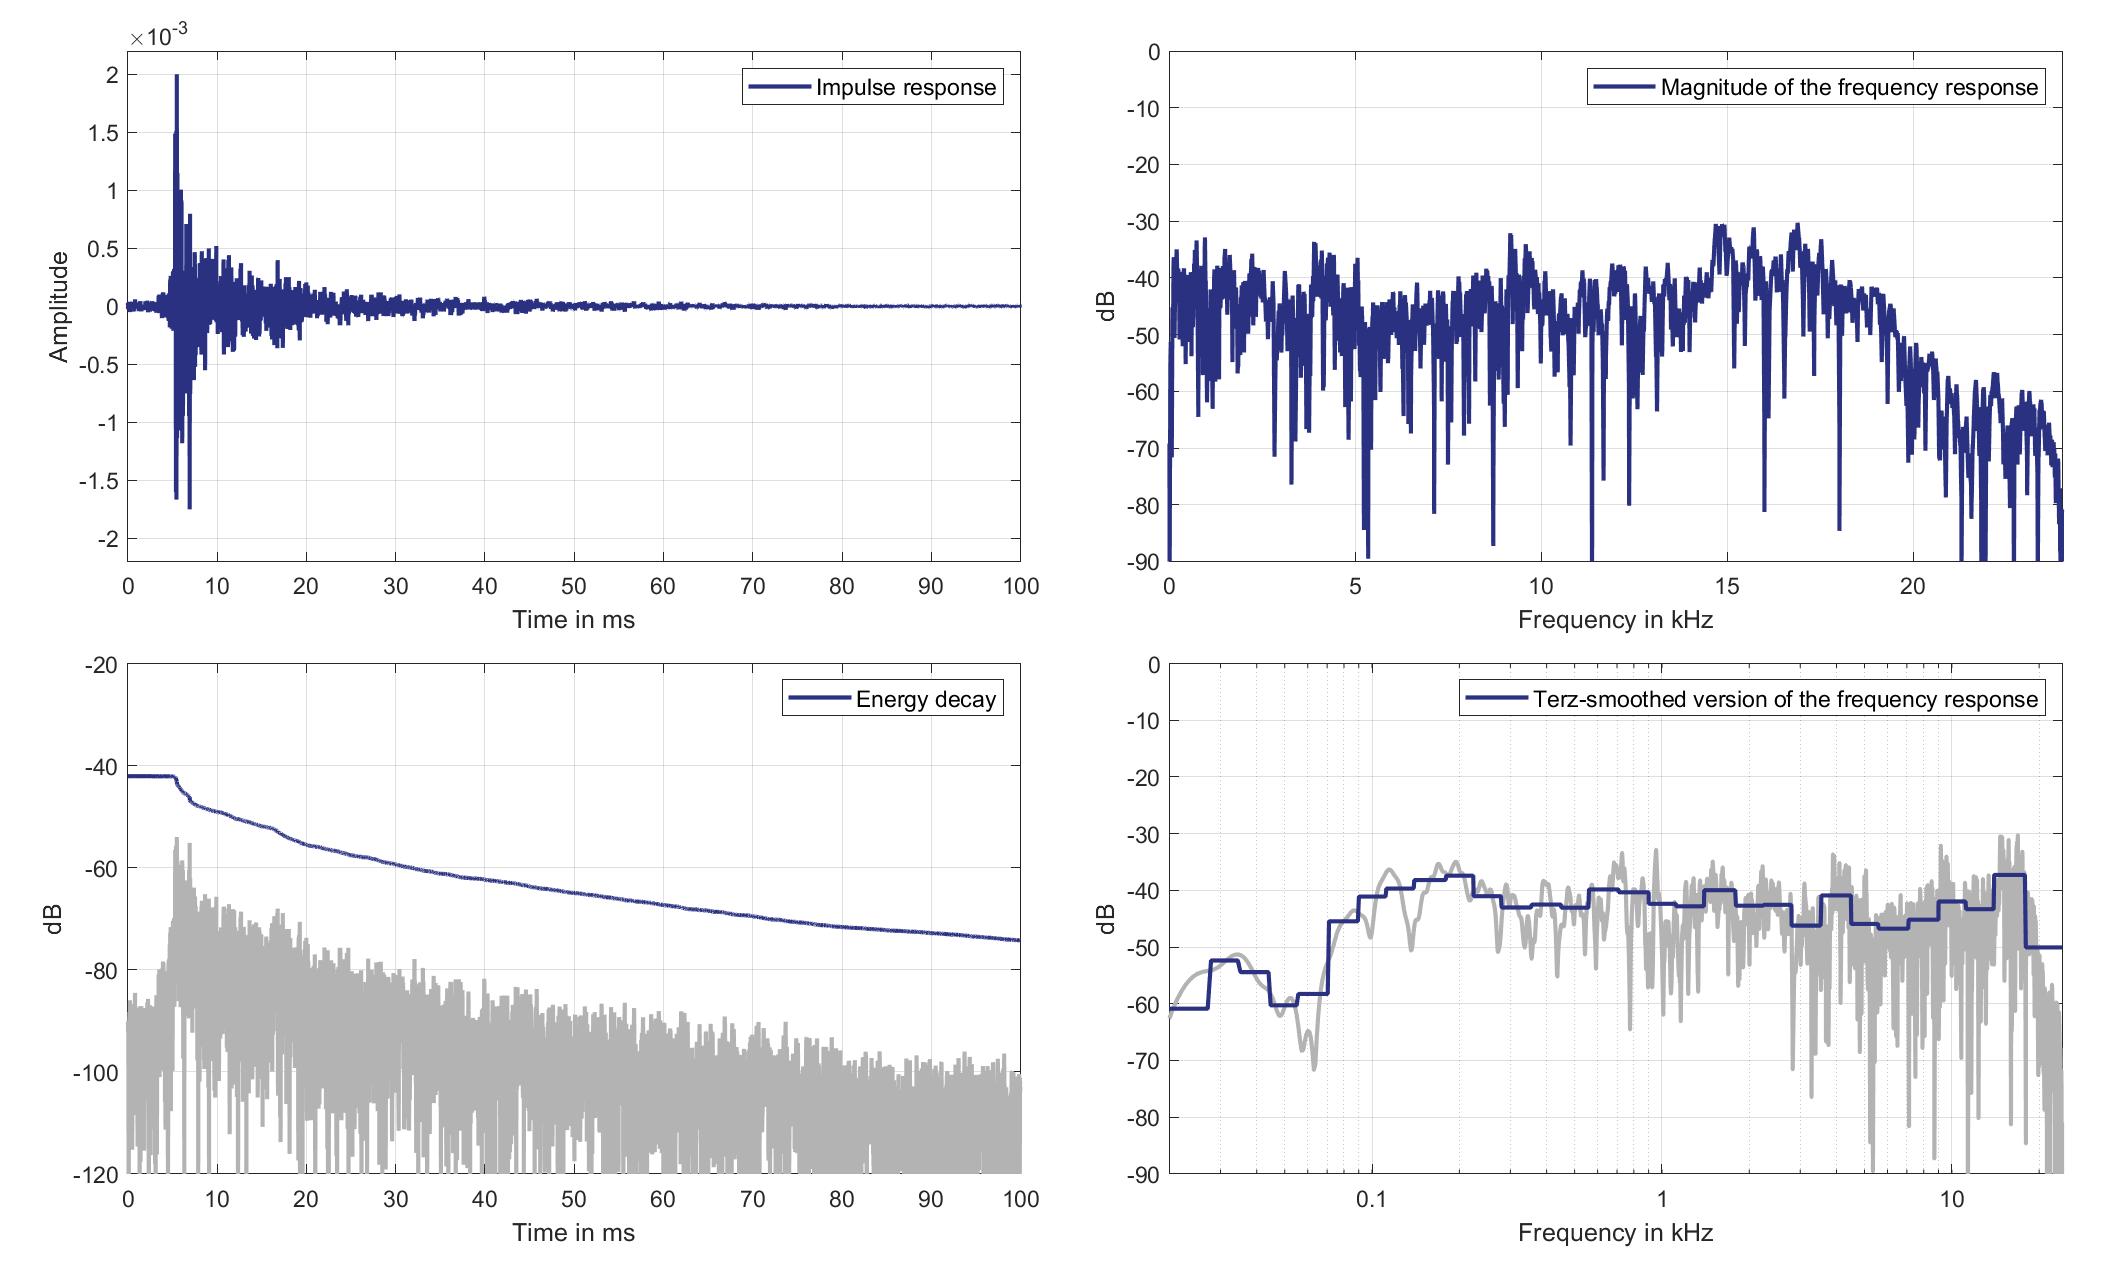
Download impulse response (in ".fir" format).
In the download section you can download all impulse response files as well as format explanation and Matlab as well as Python code examples for loading fir files.
Mics. 23/24
Left Ear Microphone
Mouth Loudspeaker of Zone 8 (Lsp. 17) to Left Ear Microphone of Zone 3 (Mic. 23)
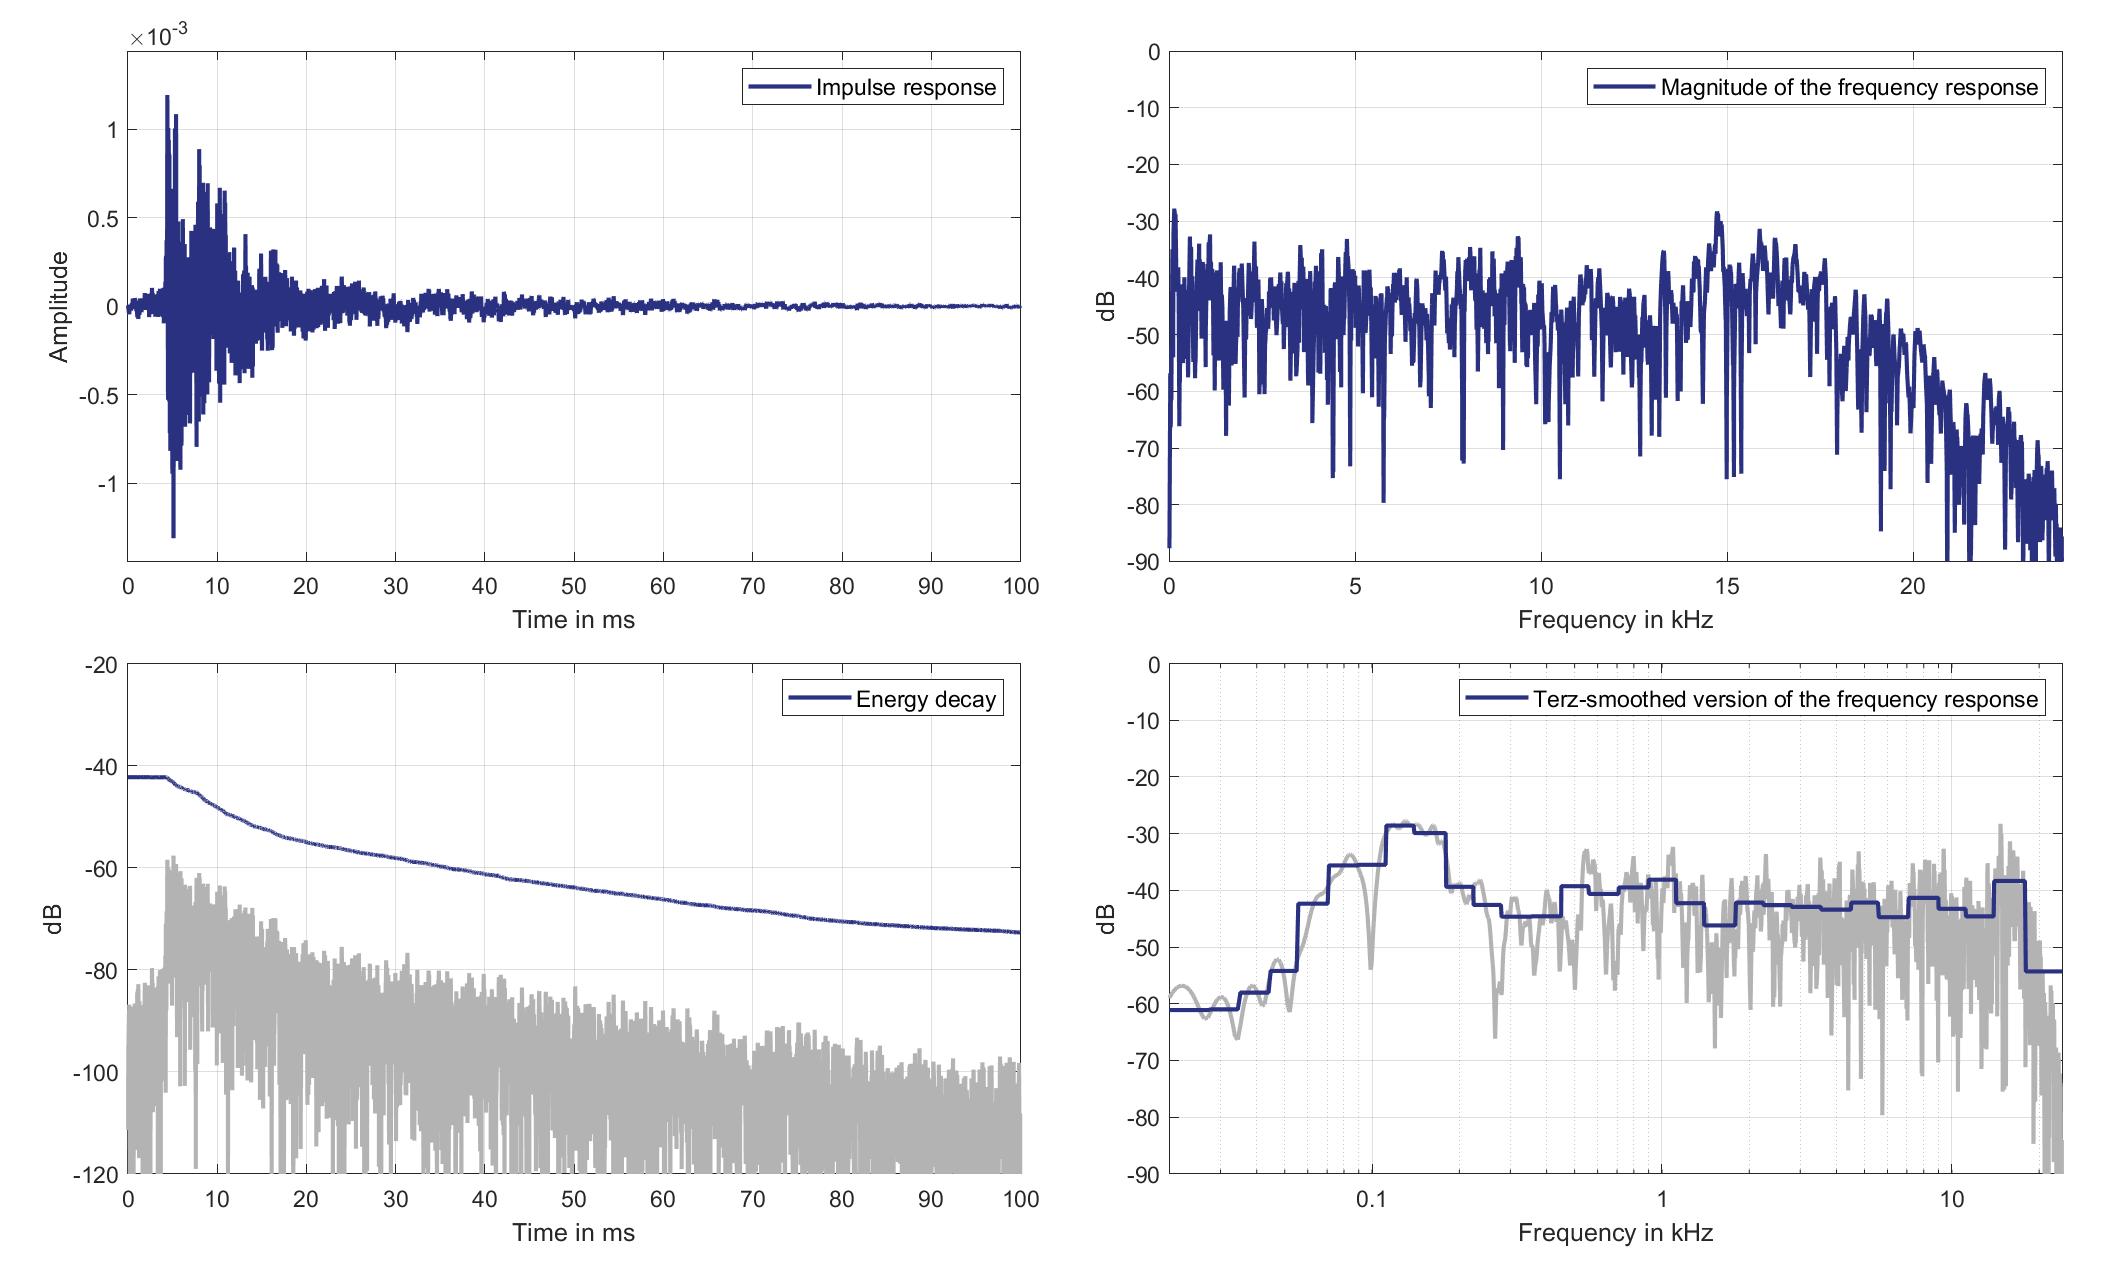
Download impulse response (in ".fir" format).
In the download section you can download all impulse response files as well as format explanation and Matlab as well as Python code examples for loading fir files.
Right Ear Microphone
Mouth Loudspeaker of Zone 8 (Lsp. 17) to Right Ear Microphone of Zone 3 (Mic. 24)
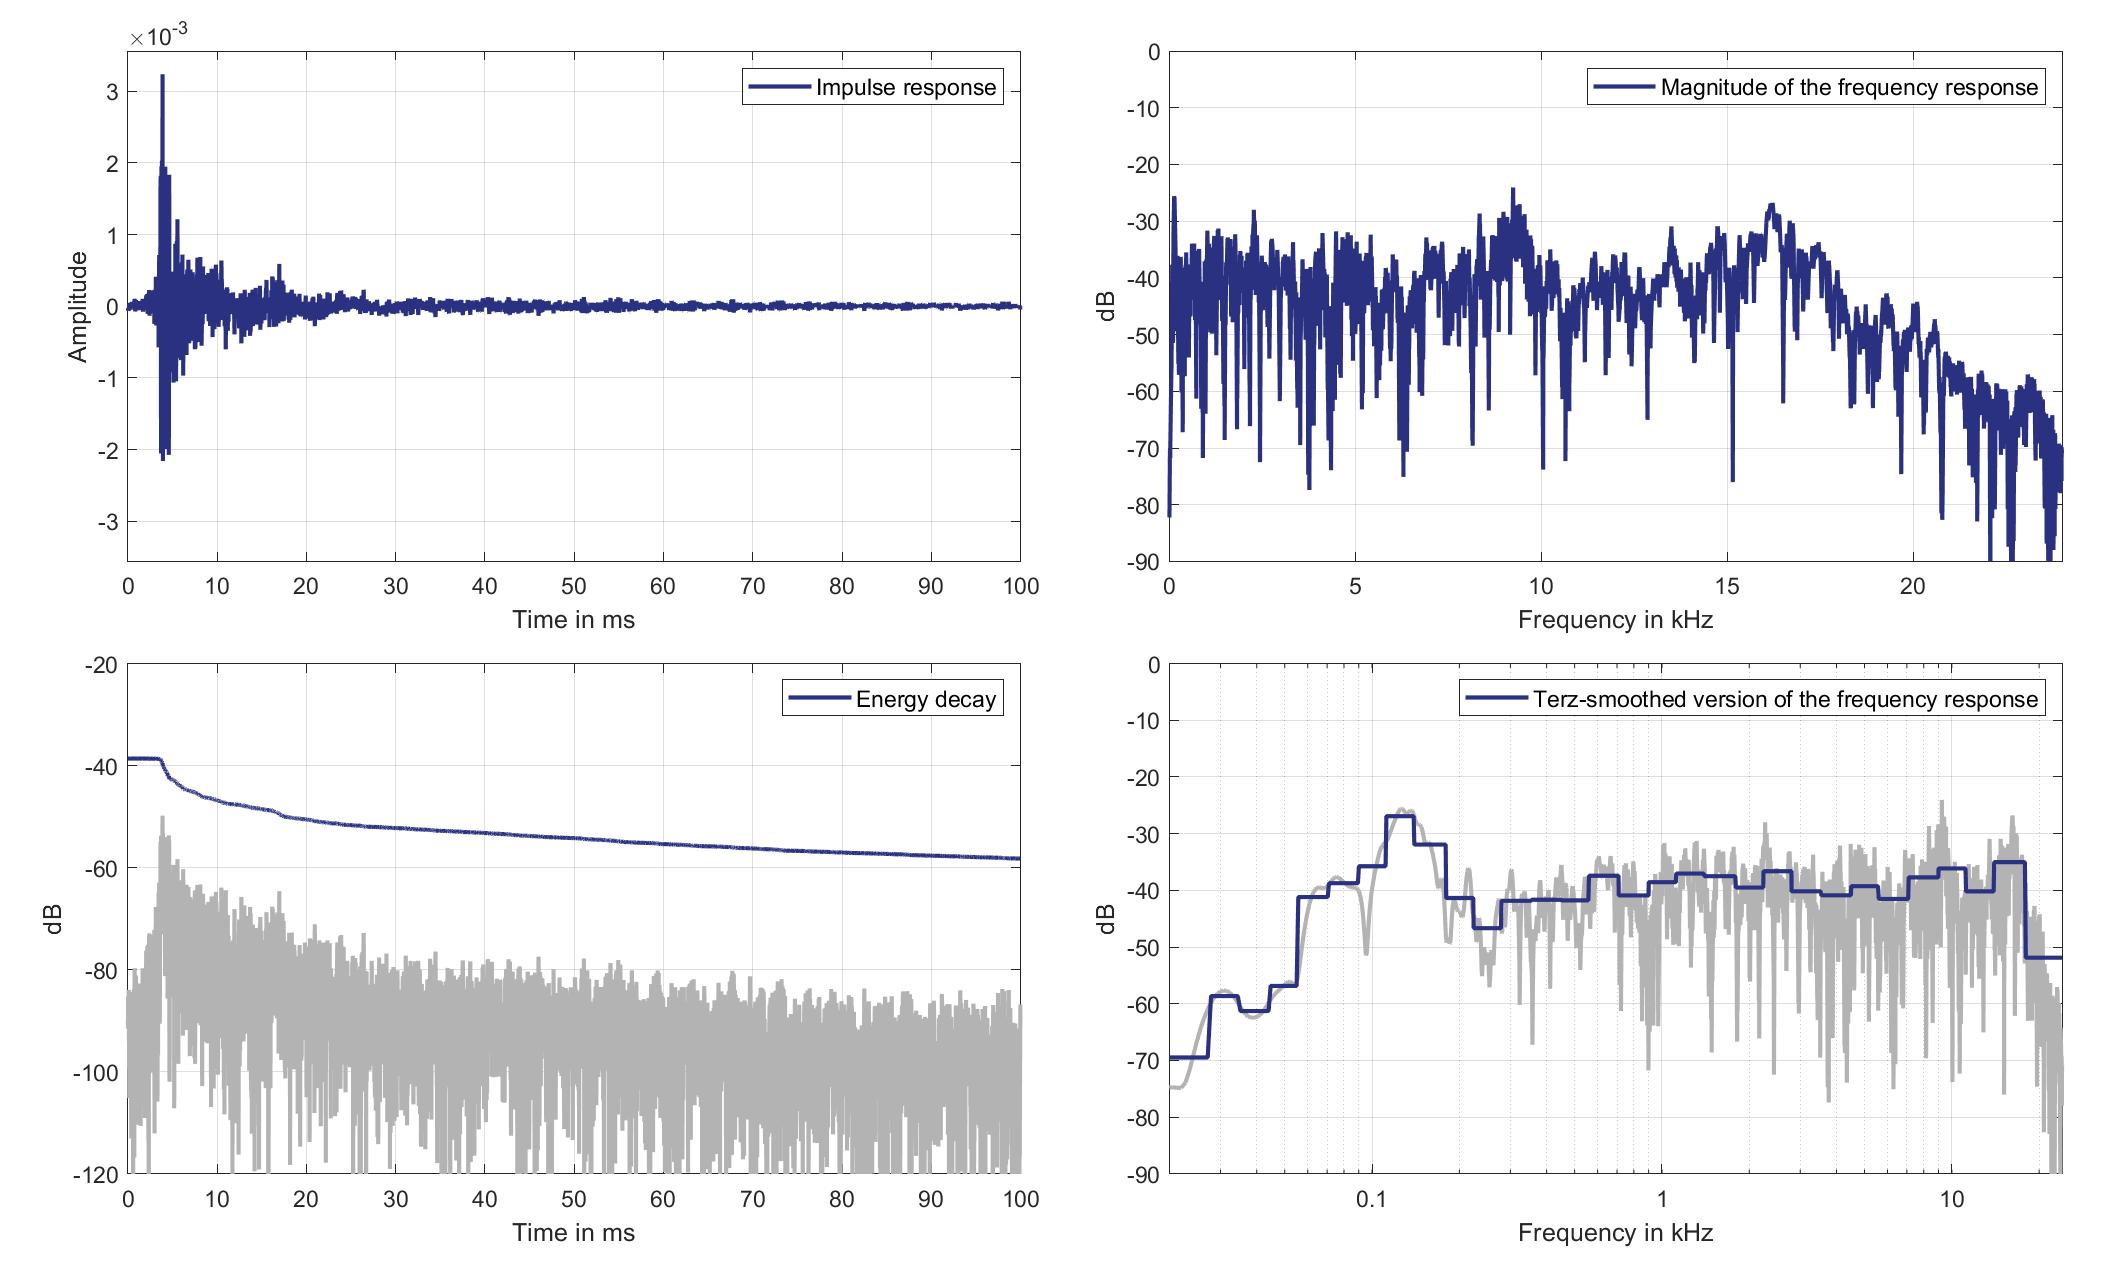
Download impulse response (in ".fir" format).
In the download section you can download all impulse response files as well as format explanation and Matlab as well as Python code examples for loading fir files.
Mics. 25/26
Left Ear Microphone
Mouth Loudspeaker of Zone 8 (Lsp. 17) to Left Ear Microphone of Zone 5 (Mic. 25)
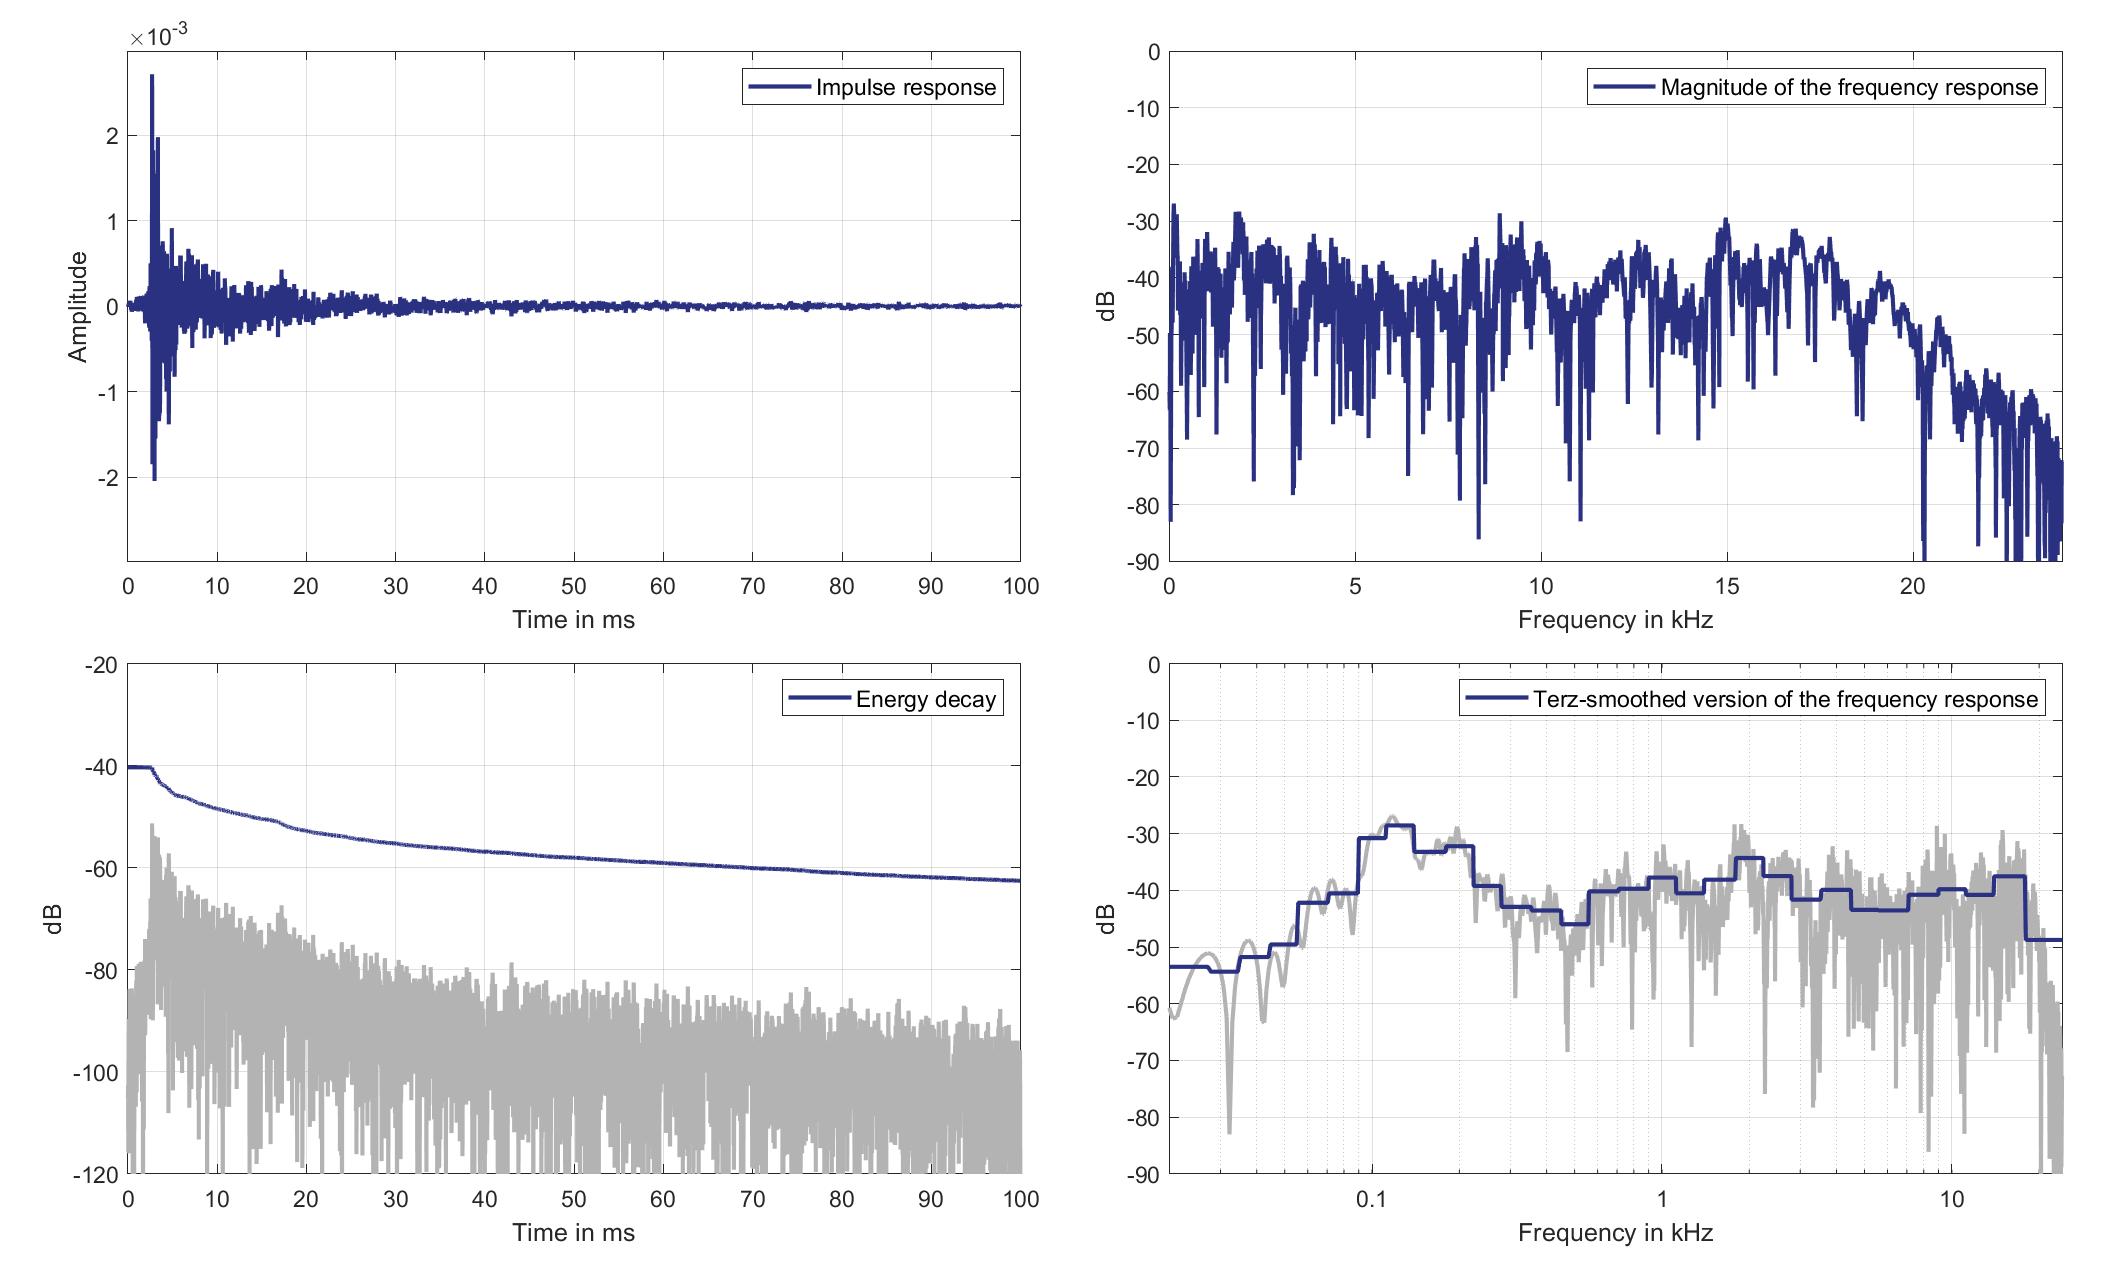
Download impulse response (in ".fir" format).
In the download section you can download all impulse response files as well as format explanation and Matlab as well as Python code examples for loading fir files.
Right Ear Microphone
Mouth Loudspeaker of Zone 8 (Lsp. 17) to Right Ear Microphone of Zone 5 (Mic. 26)
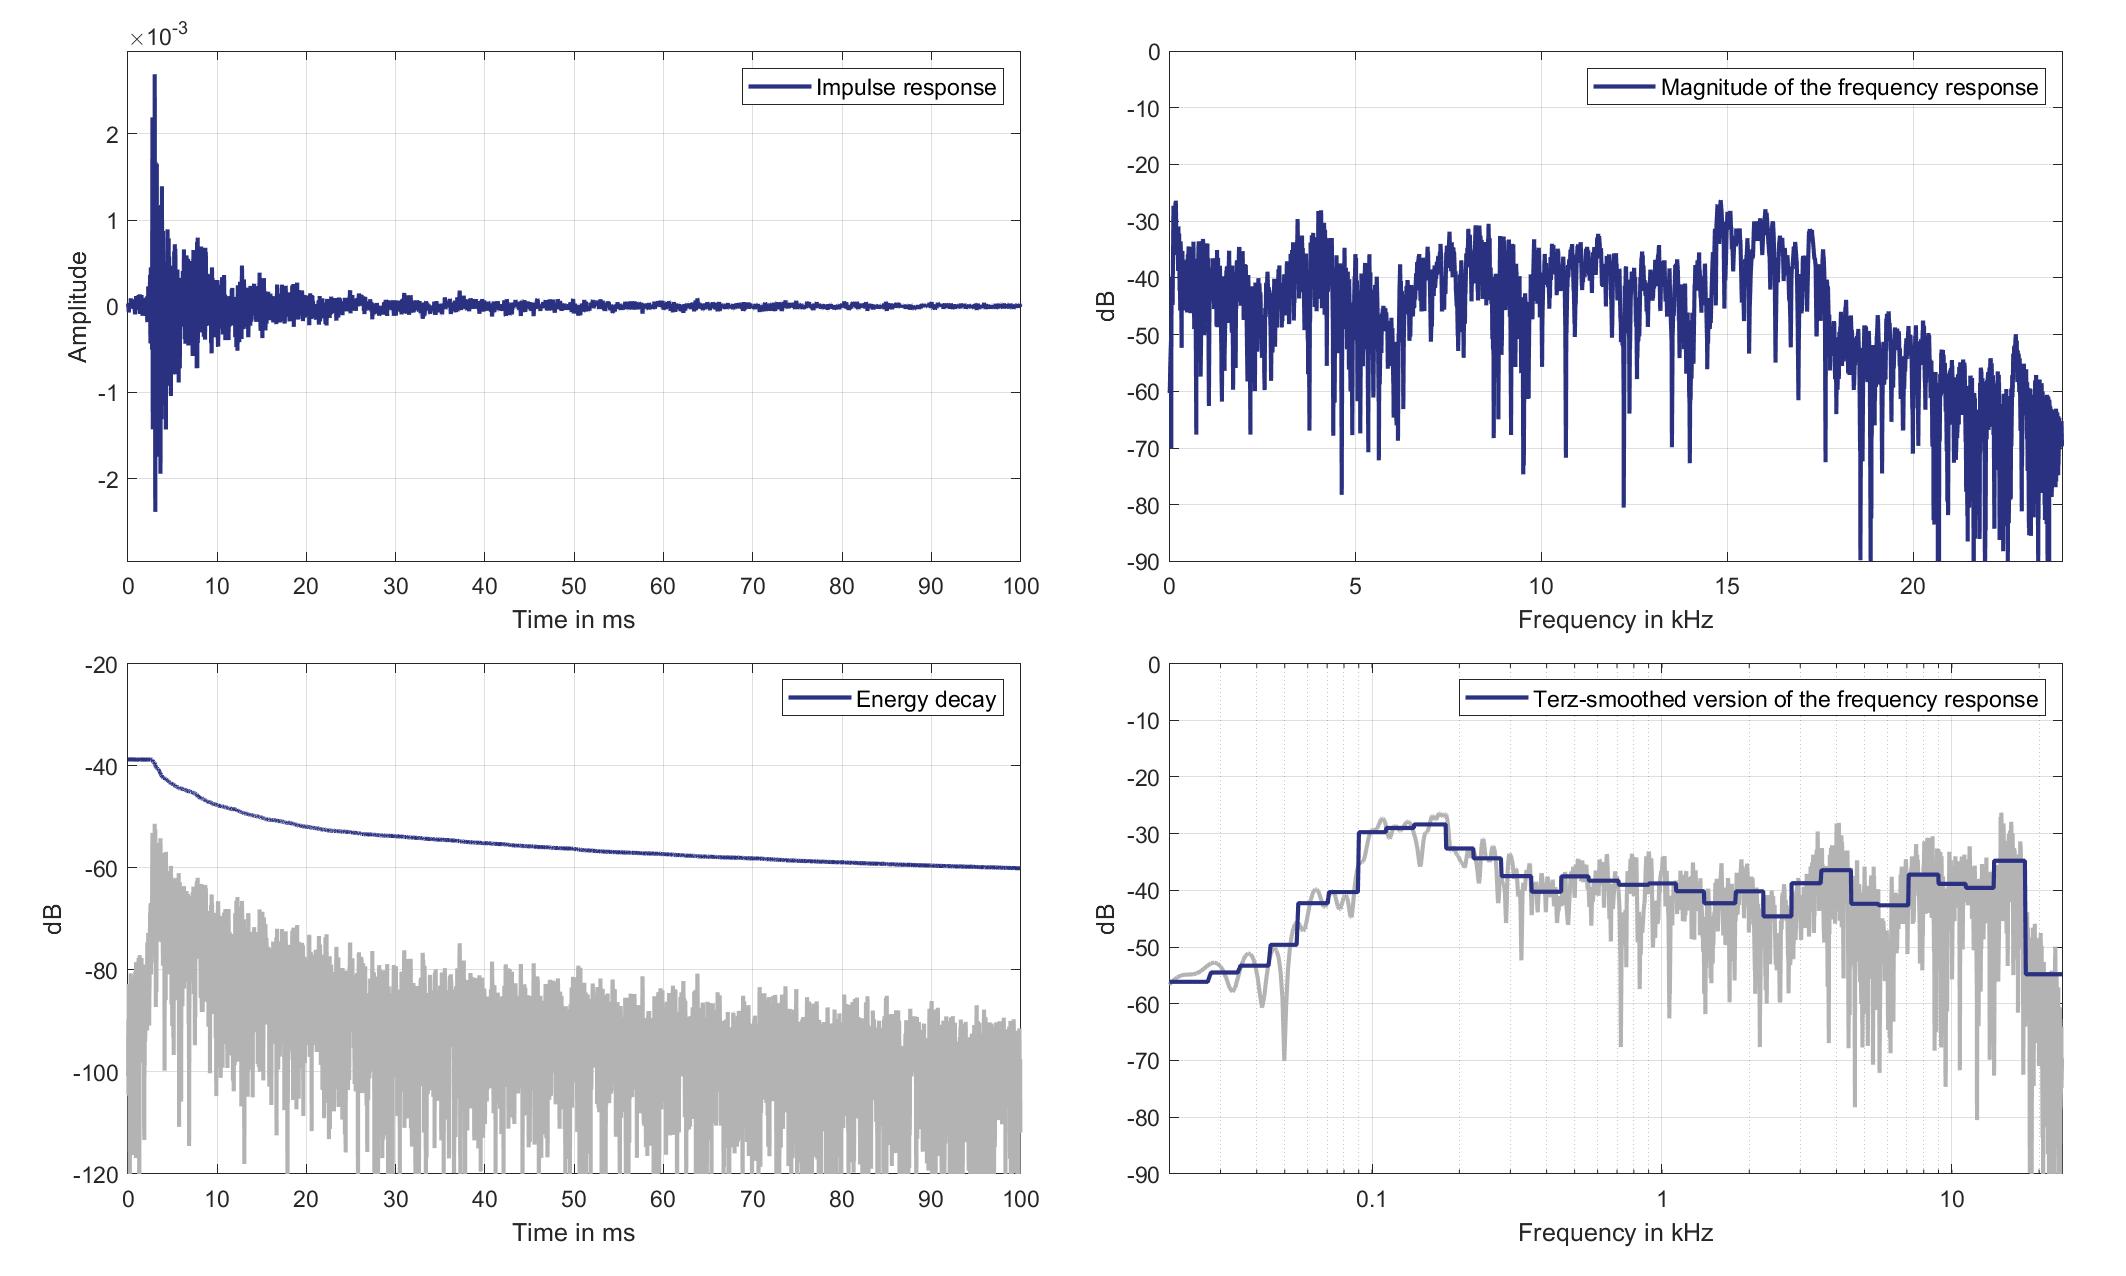
Download impulse response (in ".fir" format).
In the download section you can download all impulse response files as well as format explanation and Matlab as well as Python code examples for loading fir files.
Mics. 27/28
Left Ear Microphone
Mouth Loudspeaker of Zone 8 (Lsp. 17) to Left Ear Microphone of Zone 6 (Mic. 27)
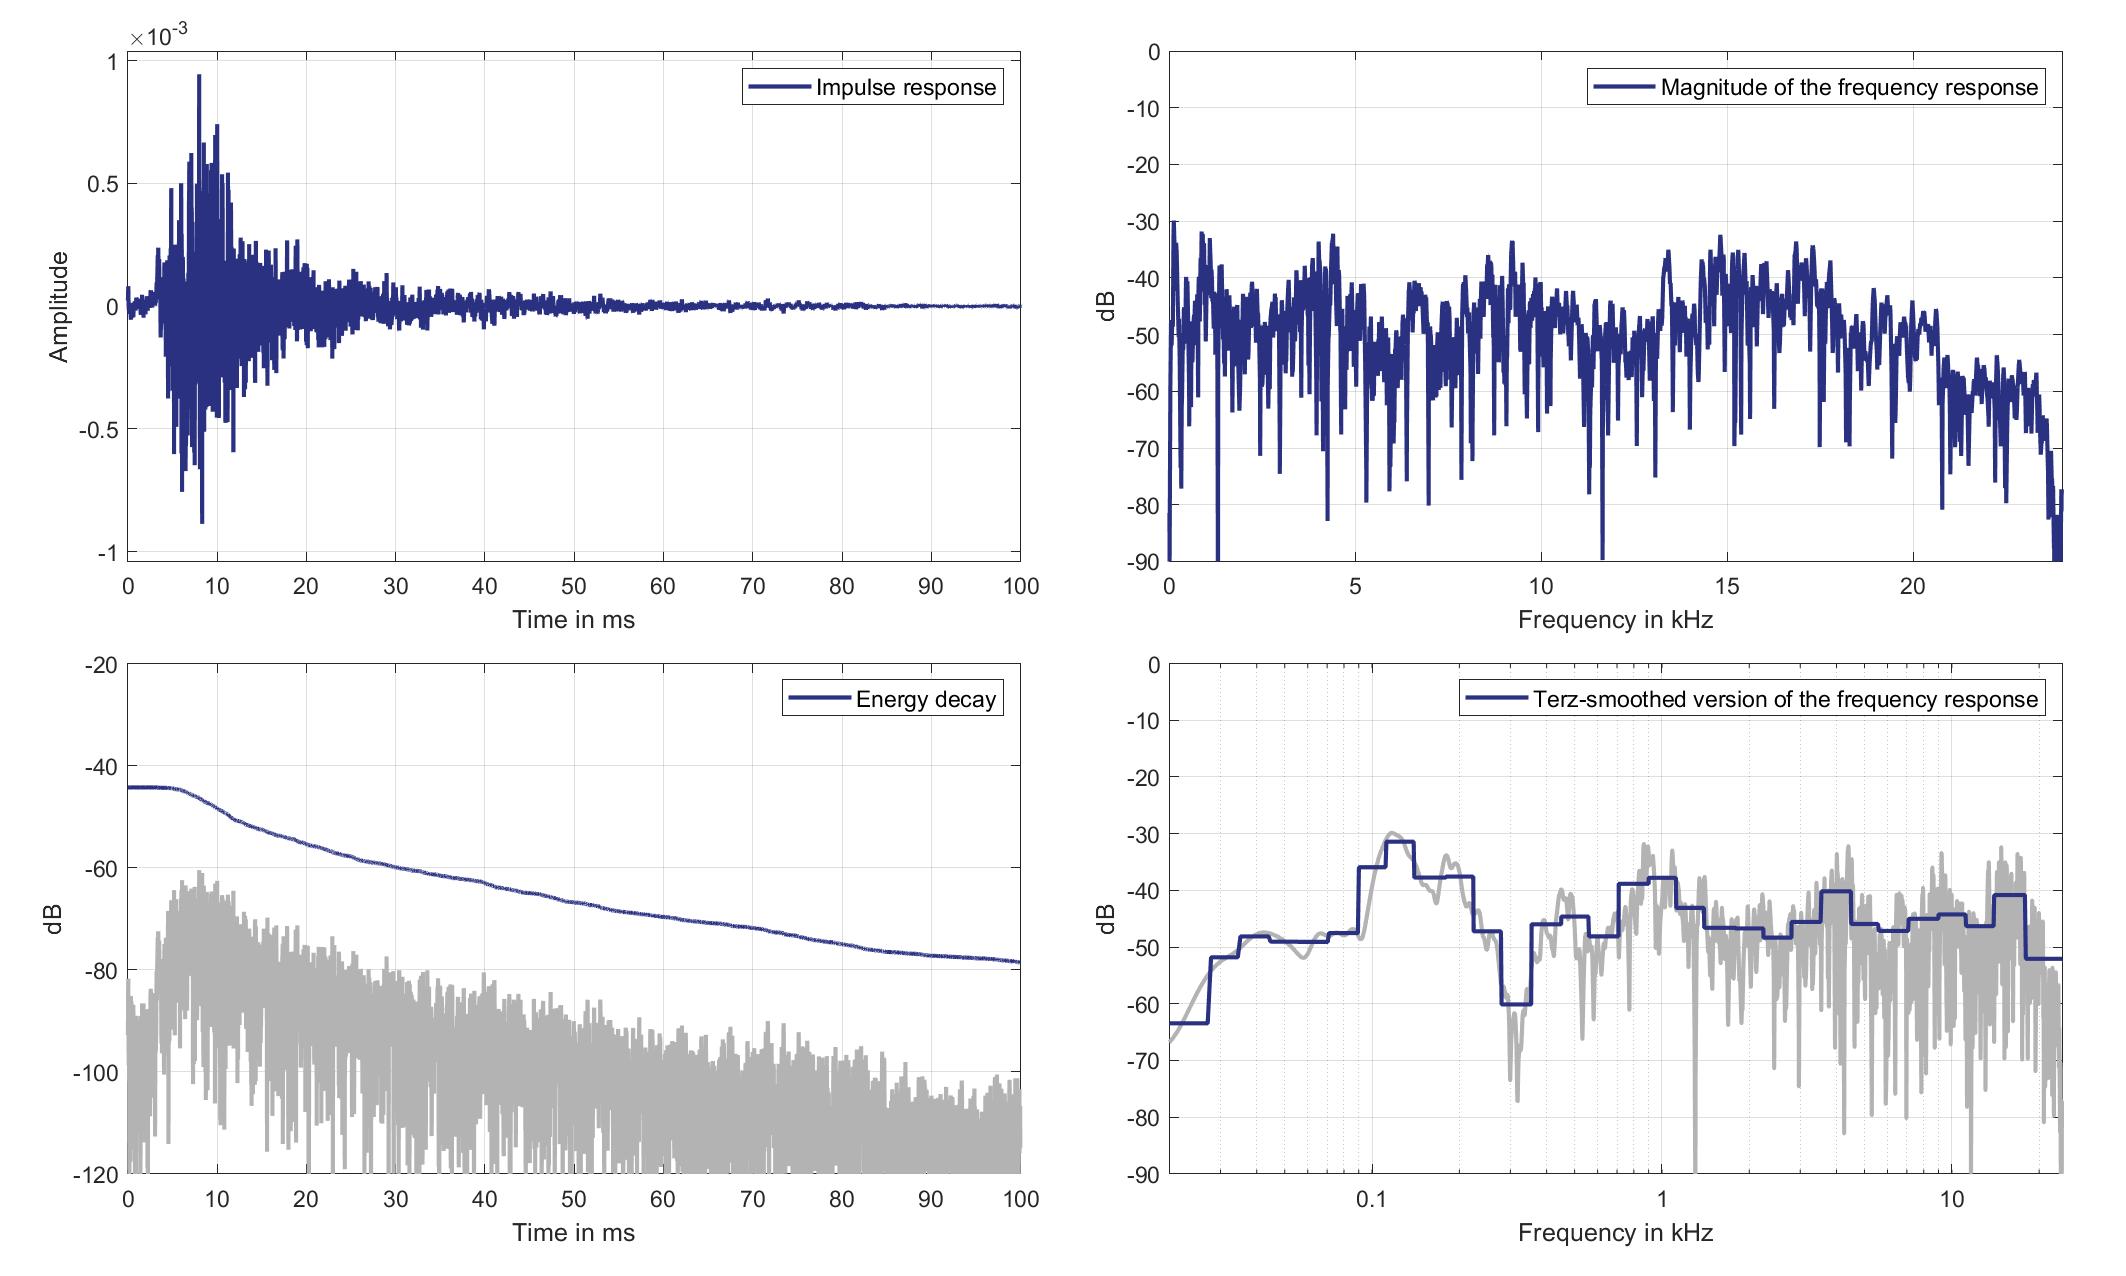
Download impulse response (in ".fir" format).
In the download section you can download all impulse response files as well as format explanation and Matlab as well as Python code examples for loading fir files.
Right Ear Microphone
Mouth Loudspeaker of Zone 8 (Lsp. 17) to Right Ear Microphone of Zone 6 (Mic. 28)
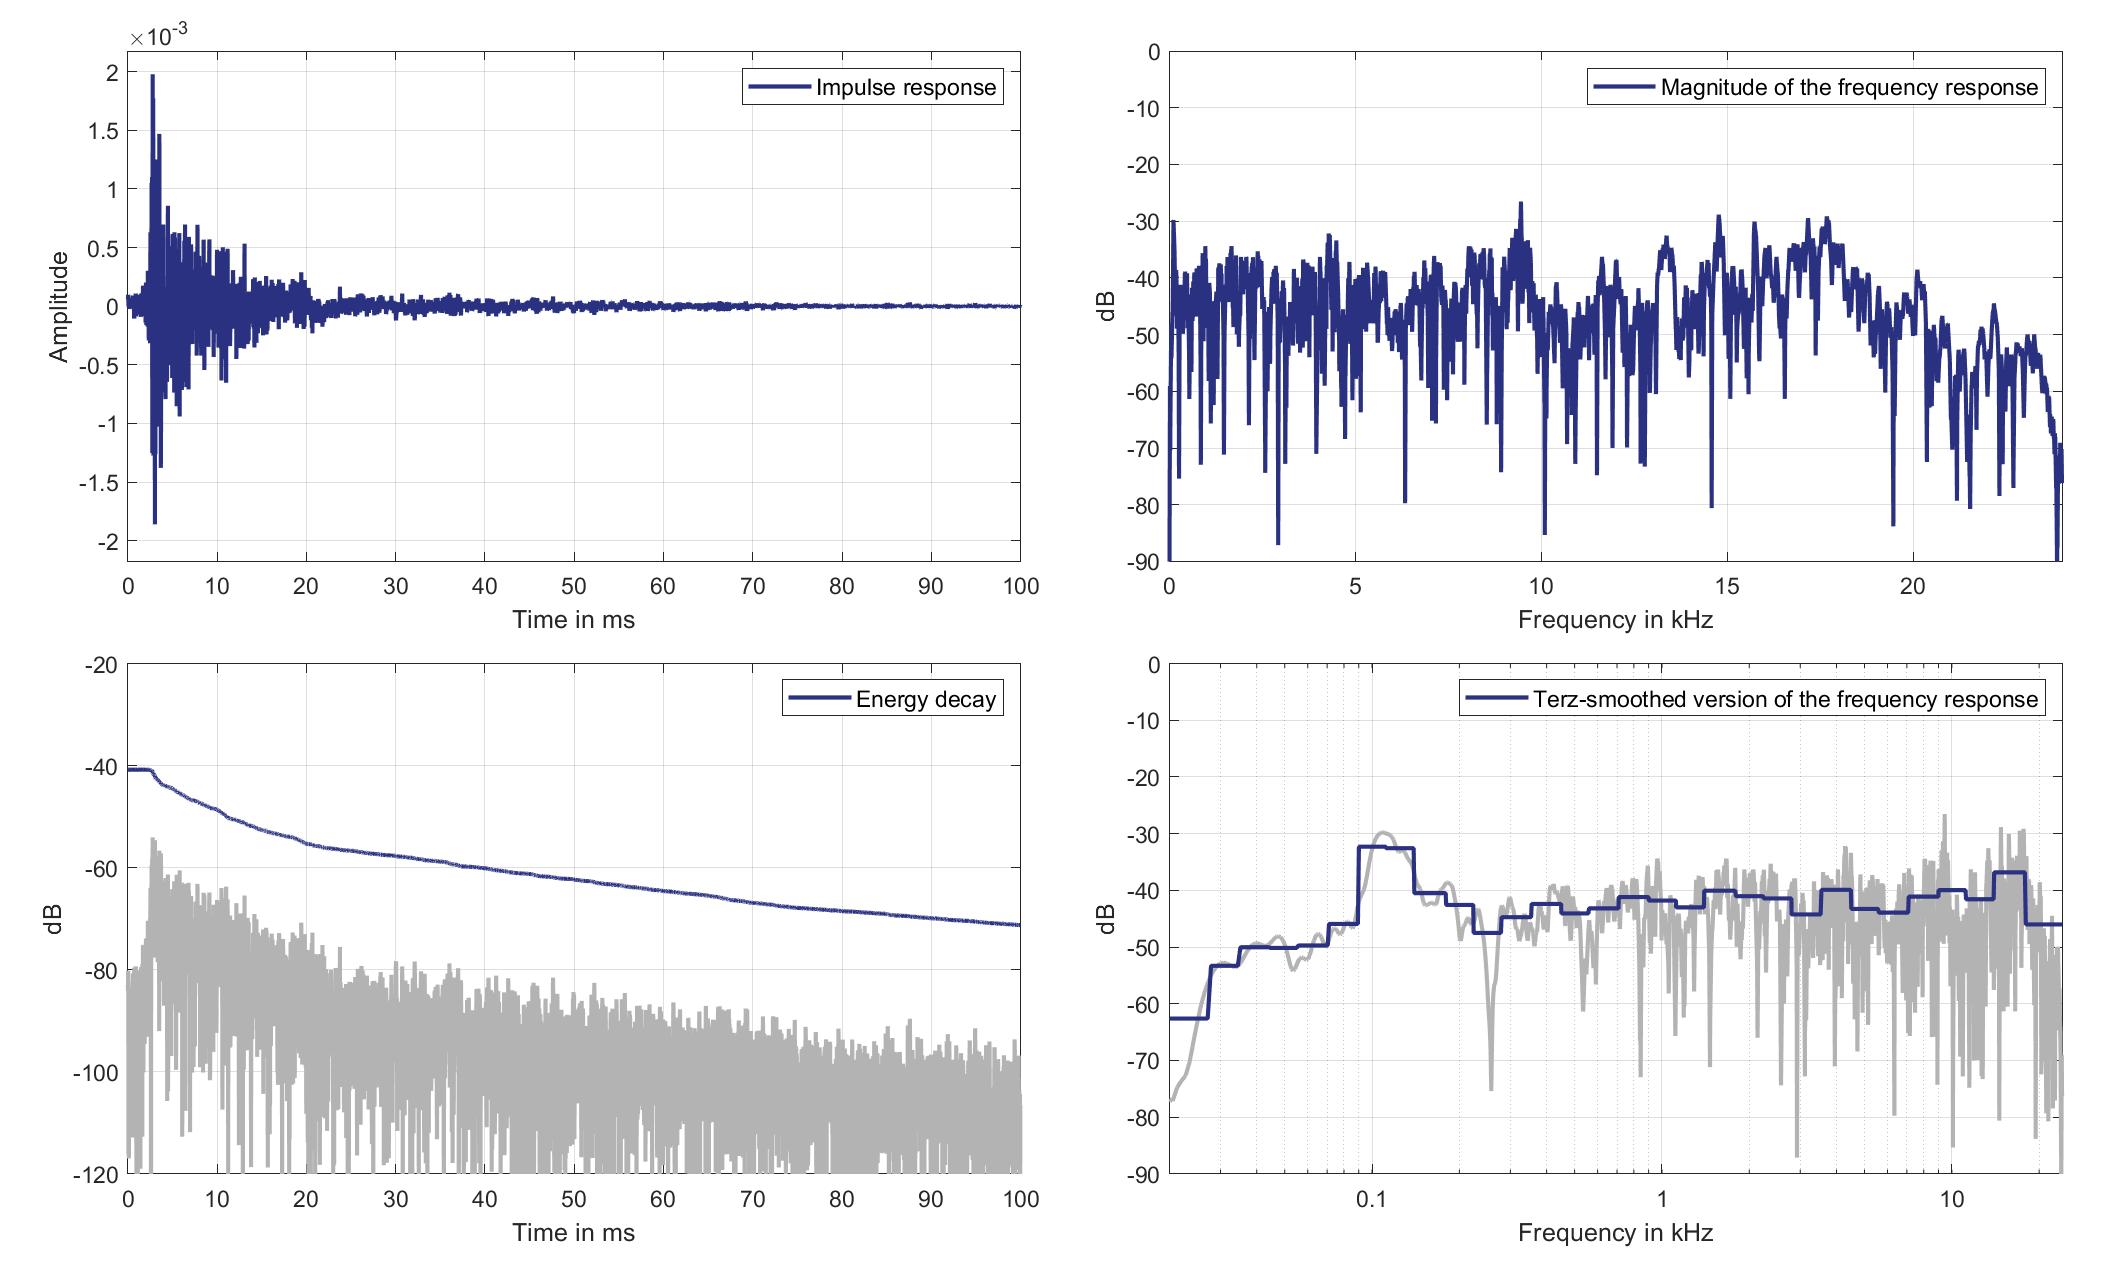
Download impulse response (in ".fir" format).
In the download section you can download all impulse response files as well as format explanation and Matlab as well as Python code examples for loading fir files.
Mics. 29/30
Left Ear Microphone
Mouth Loudspeaker of Zone 8 (Lsp. 17) to Left Ear Microphone of Zone 8 (Mic. 29)
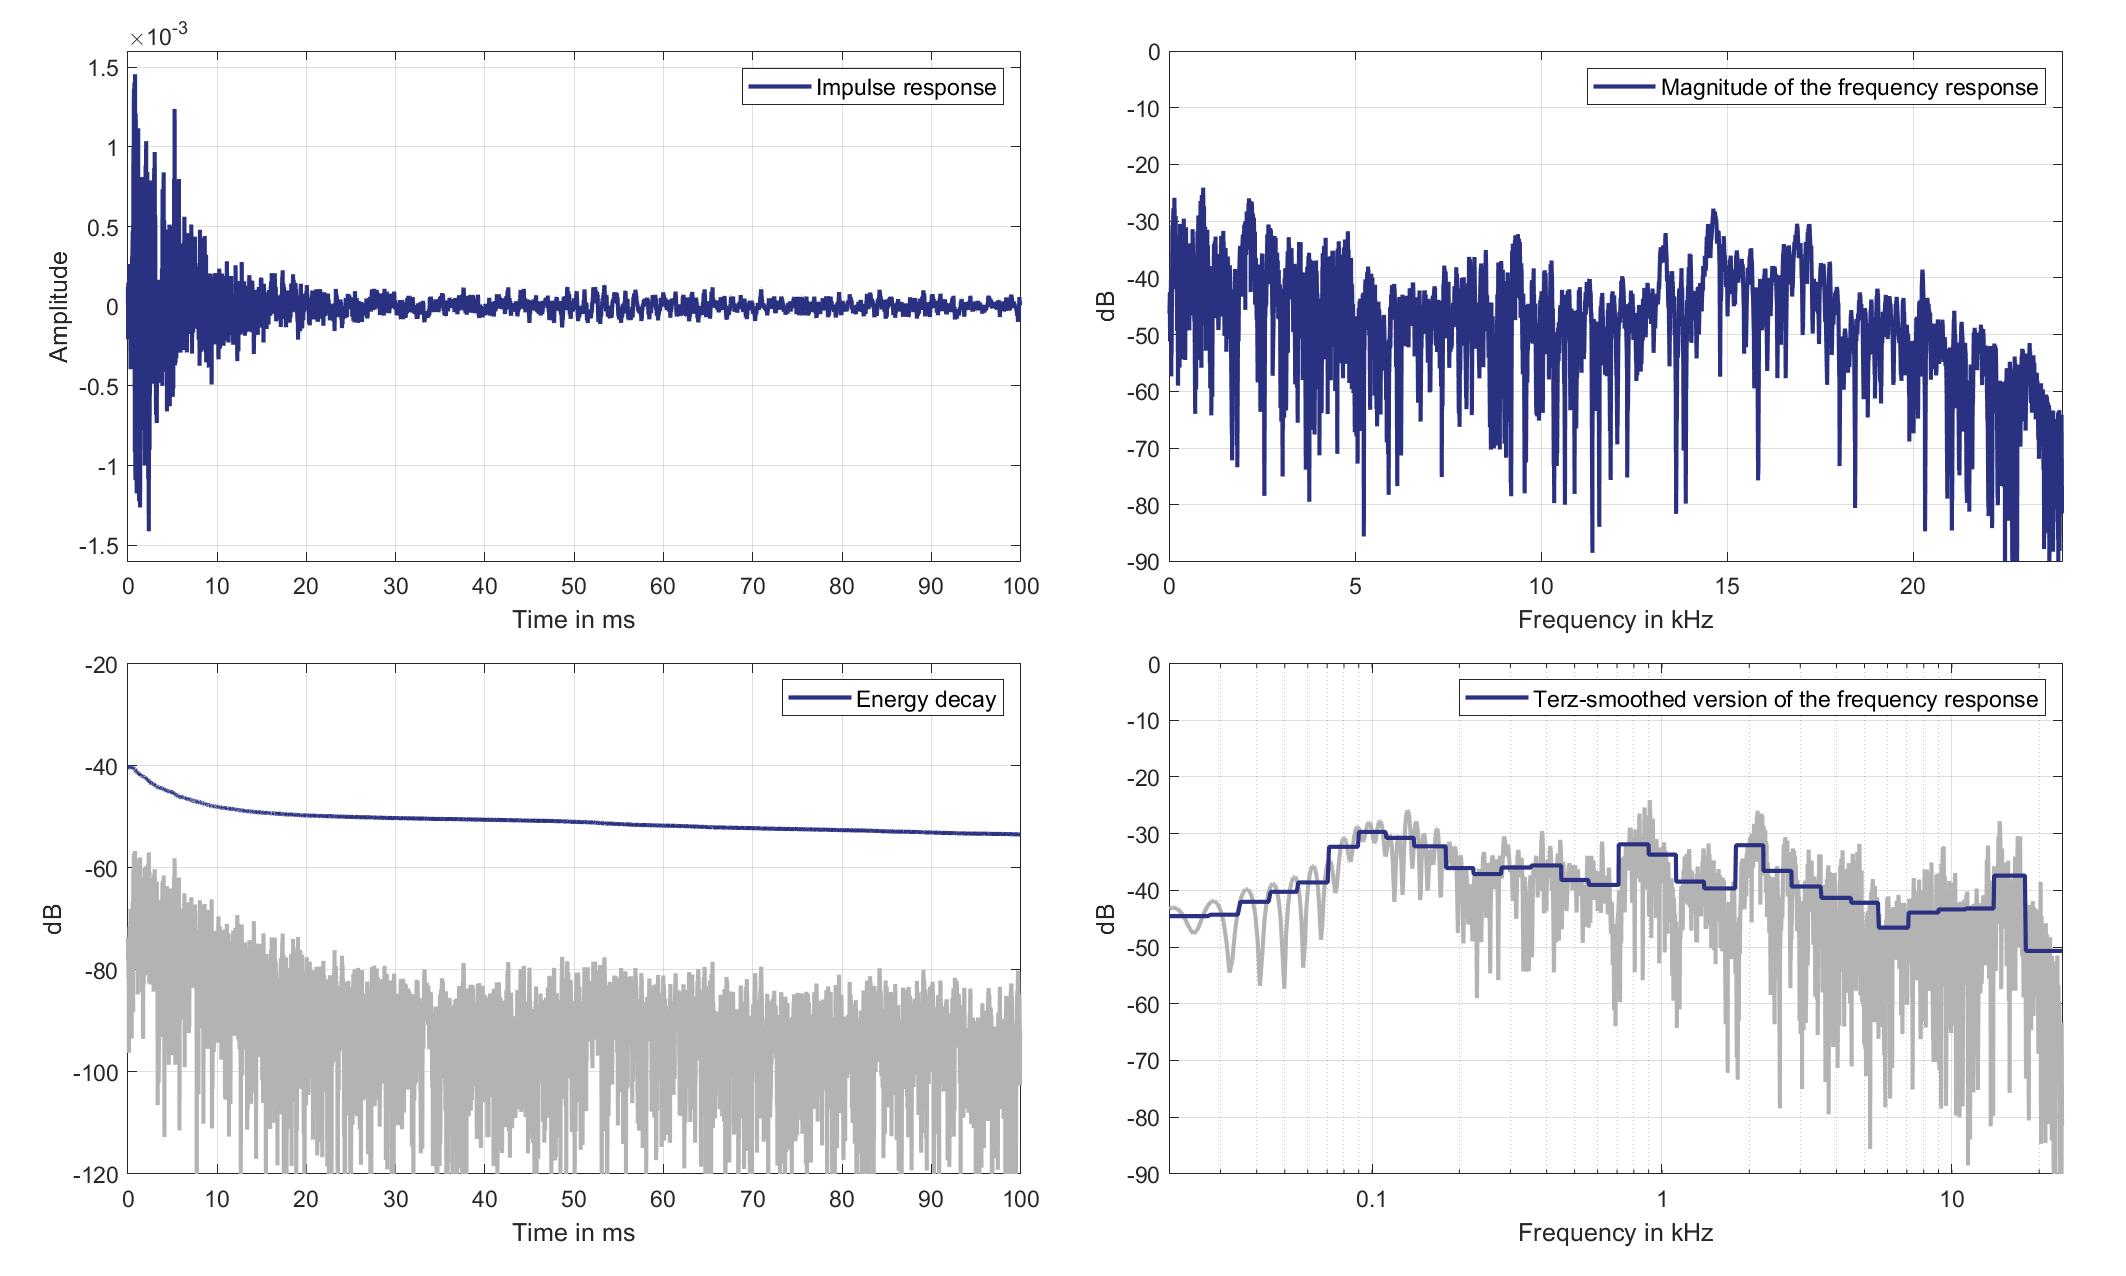
Download impulse response (in ".fir" format).
In the download section you can download all impulse response files as well as format explanation and Matlab as well as Python code examples for loading fir files.
Right Ear Microphone
Mouth Loudspeaker of Zone 8 (Lsp. 17) to Right Ear Microphone of Zone 8 (Mic. 30)
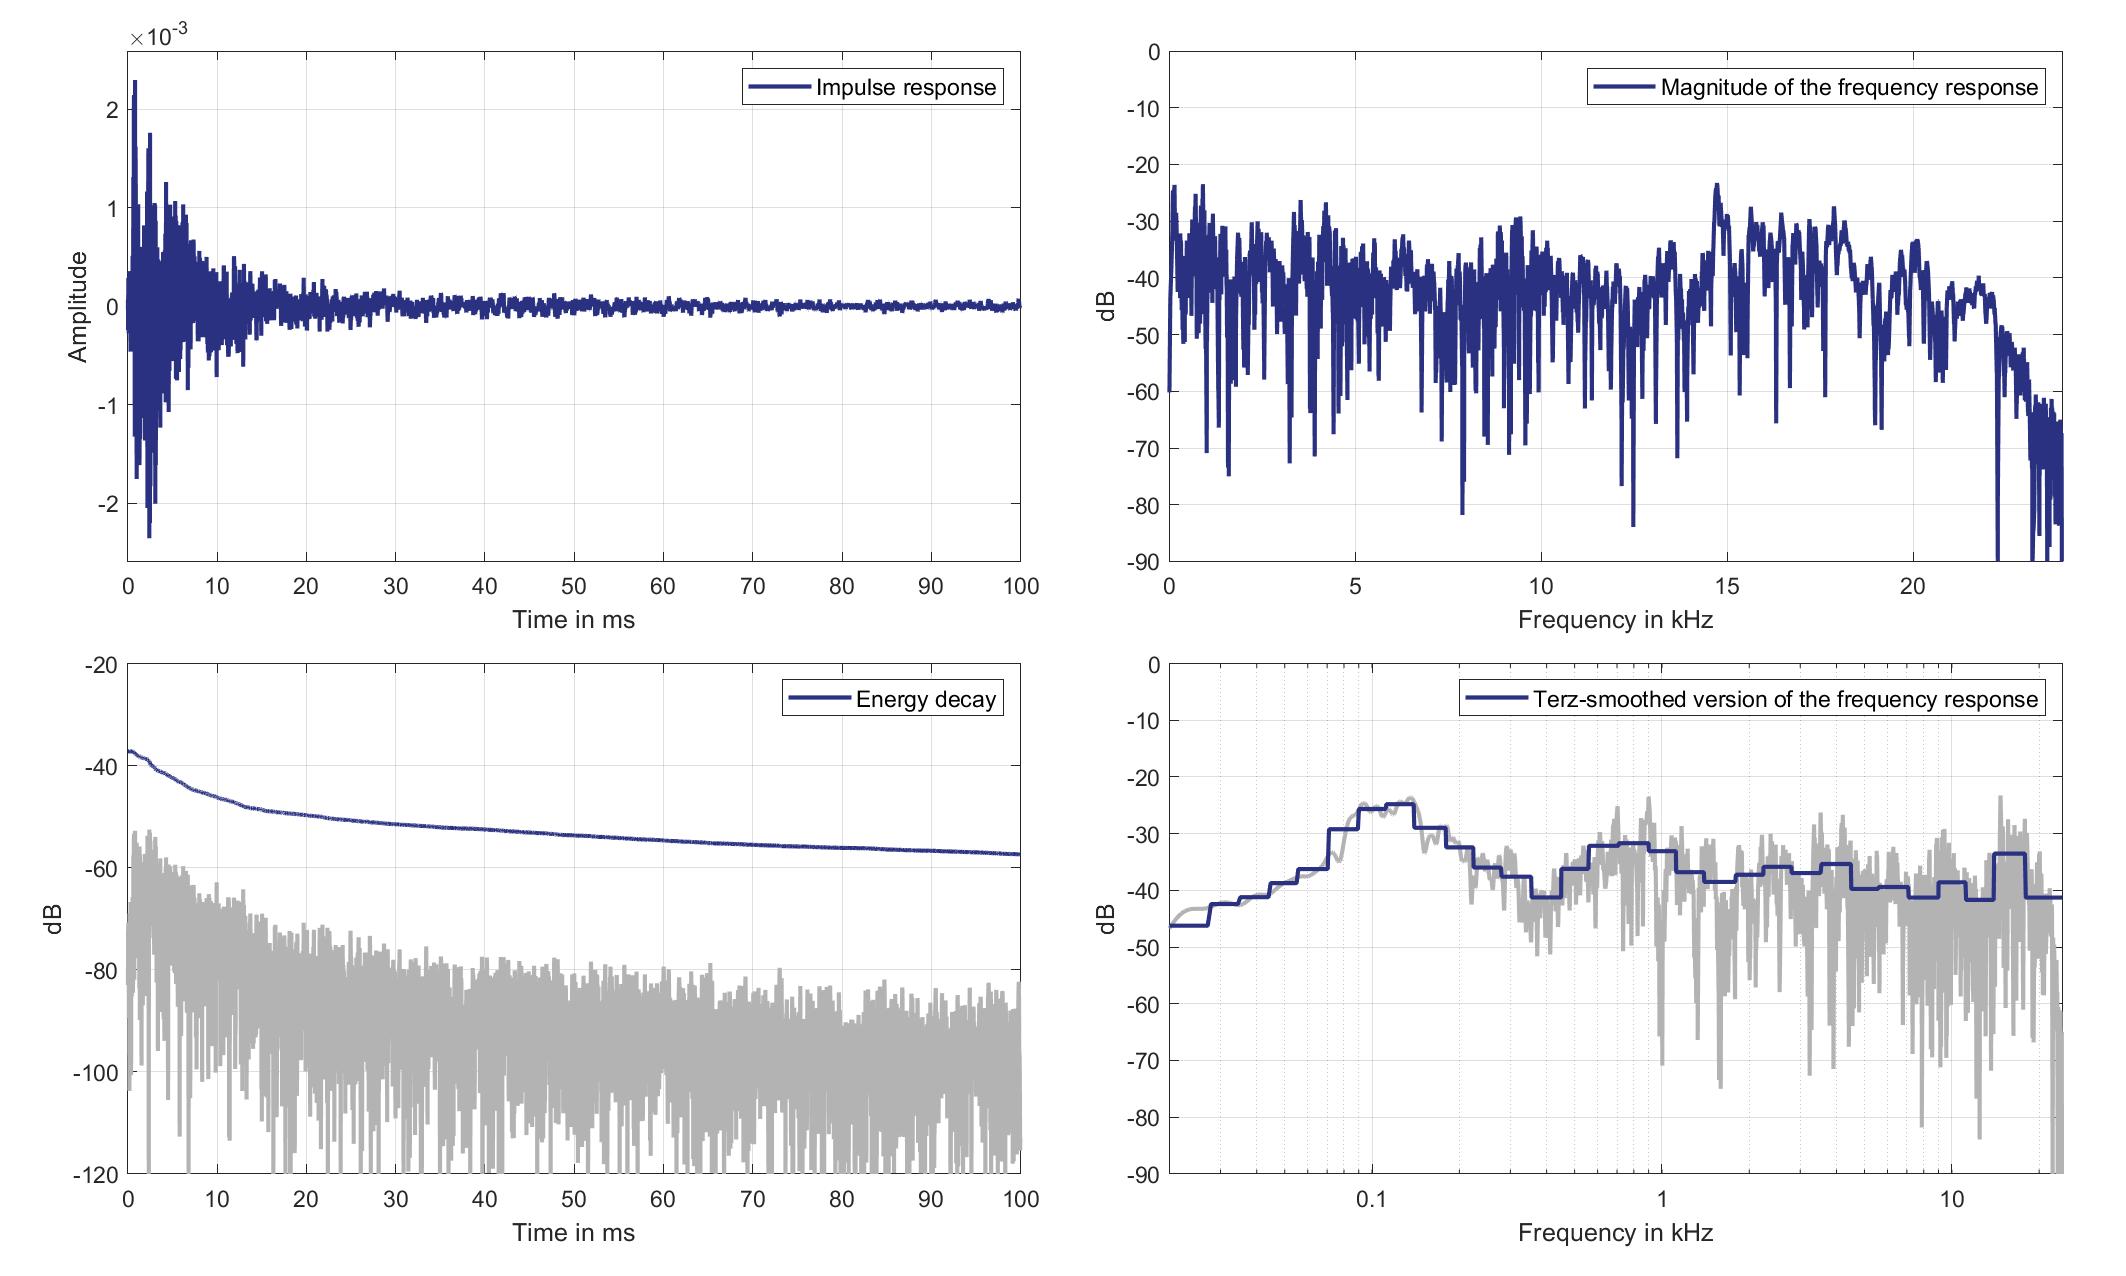
Download impulse response (in ".fir" format).
In the download section you can download all impulse response files as well as format explanation and Matlab as well as Python code examples for loading fir files.
Standard Car Loudspeakers to Standard Car Microphones
Lsp. 18
Mic. 0
Standard Car Loudspeaker 0 (Lsp. 18) to Standard Car Microphone 0 (Mic. 0)
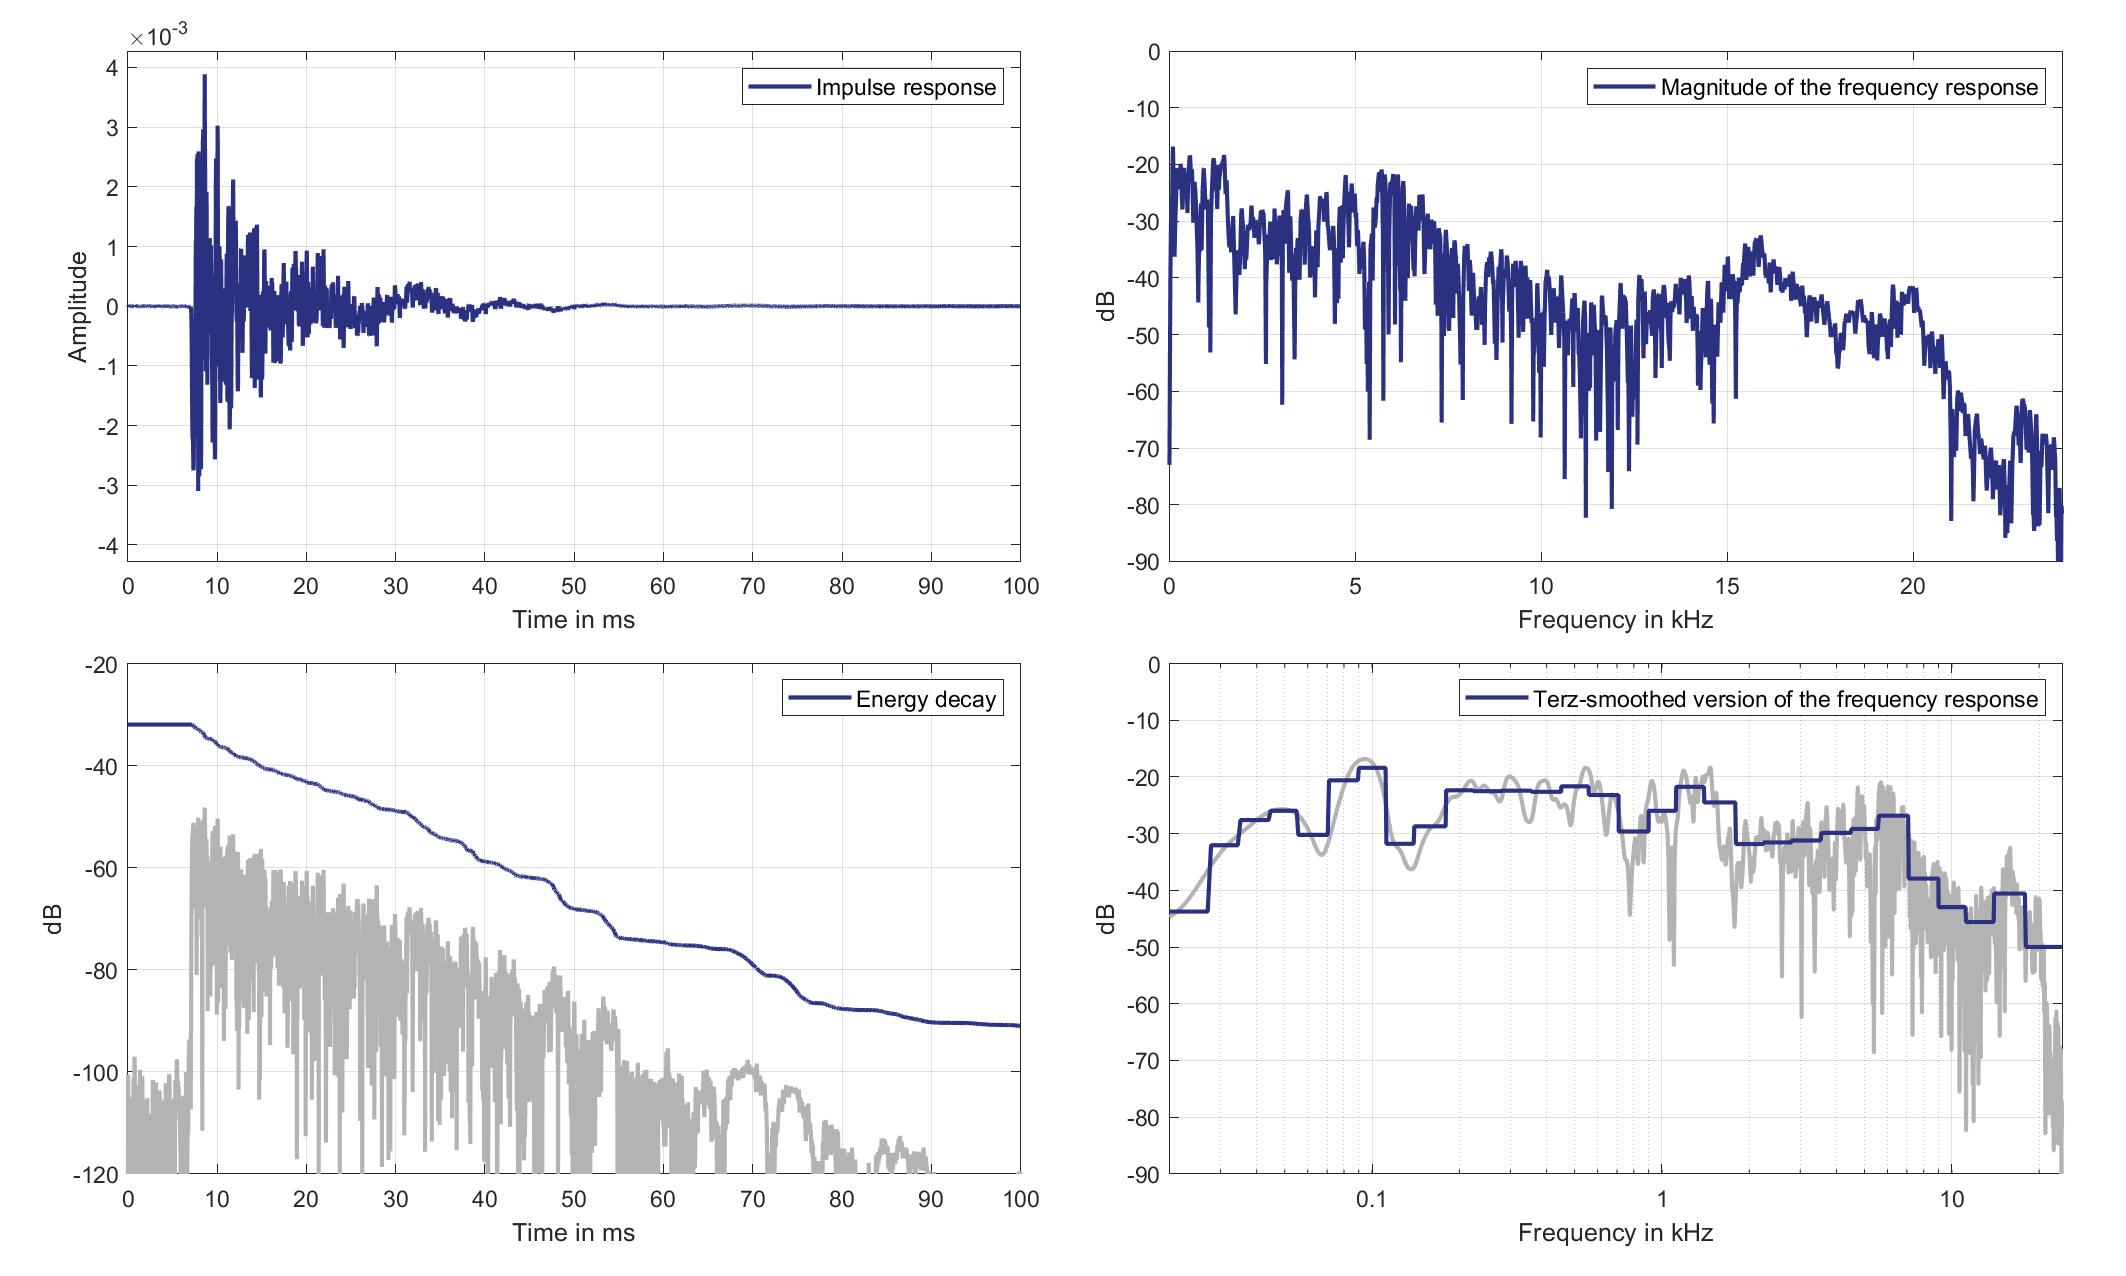
Download impulse response (in ".fir" format).
In the download section you can download all impulse response files as well as format explanation and Matlab as well as Python code examples for loading fir files.
Mic. 1
Standard Car Loudspeaker 0 (Lsp. 18) to Standard Car Microphone 1 (Mic. 1)
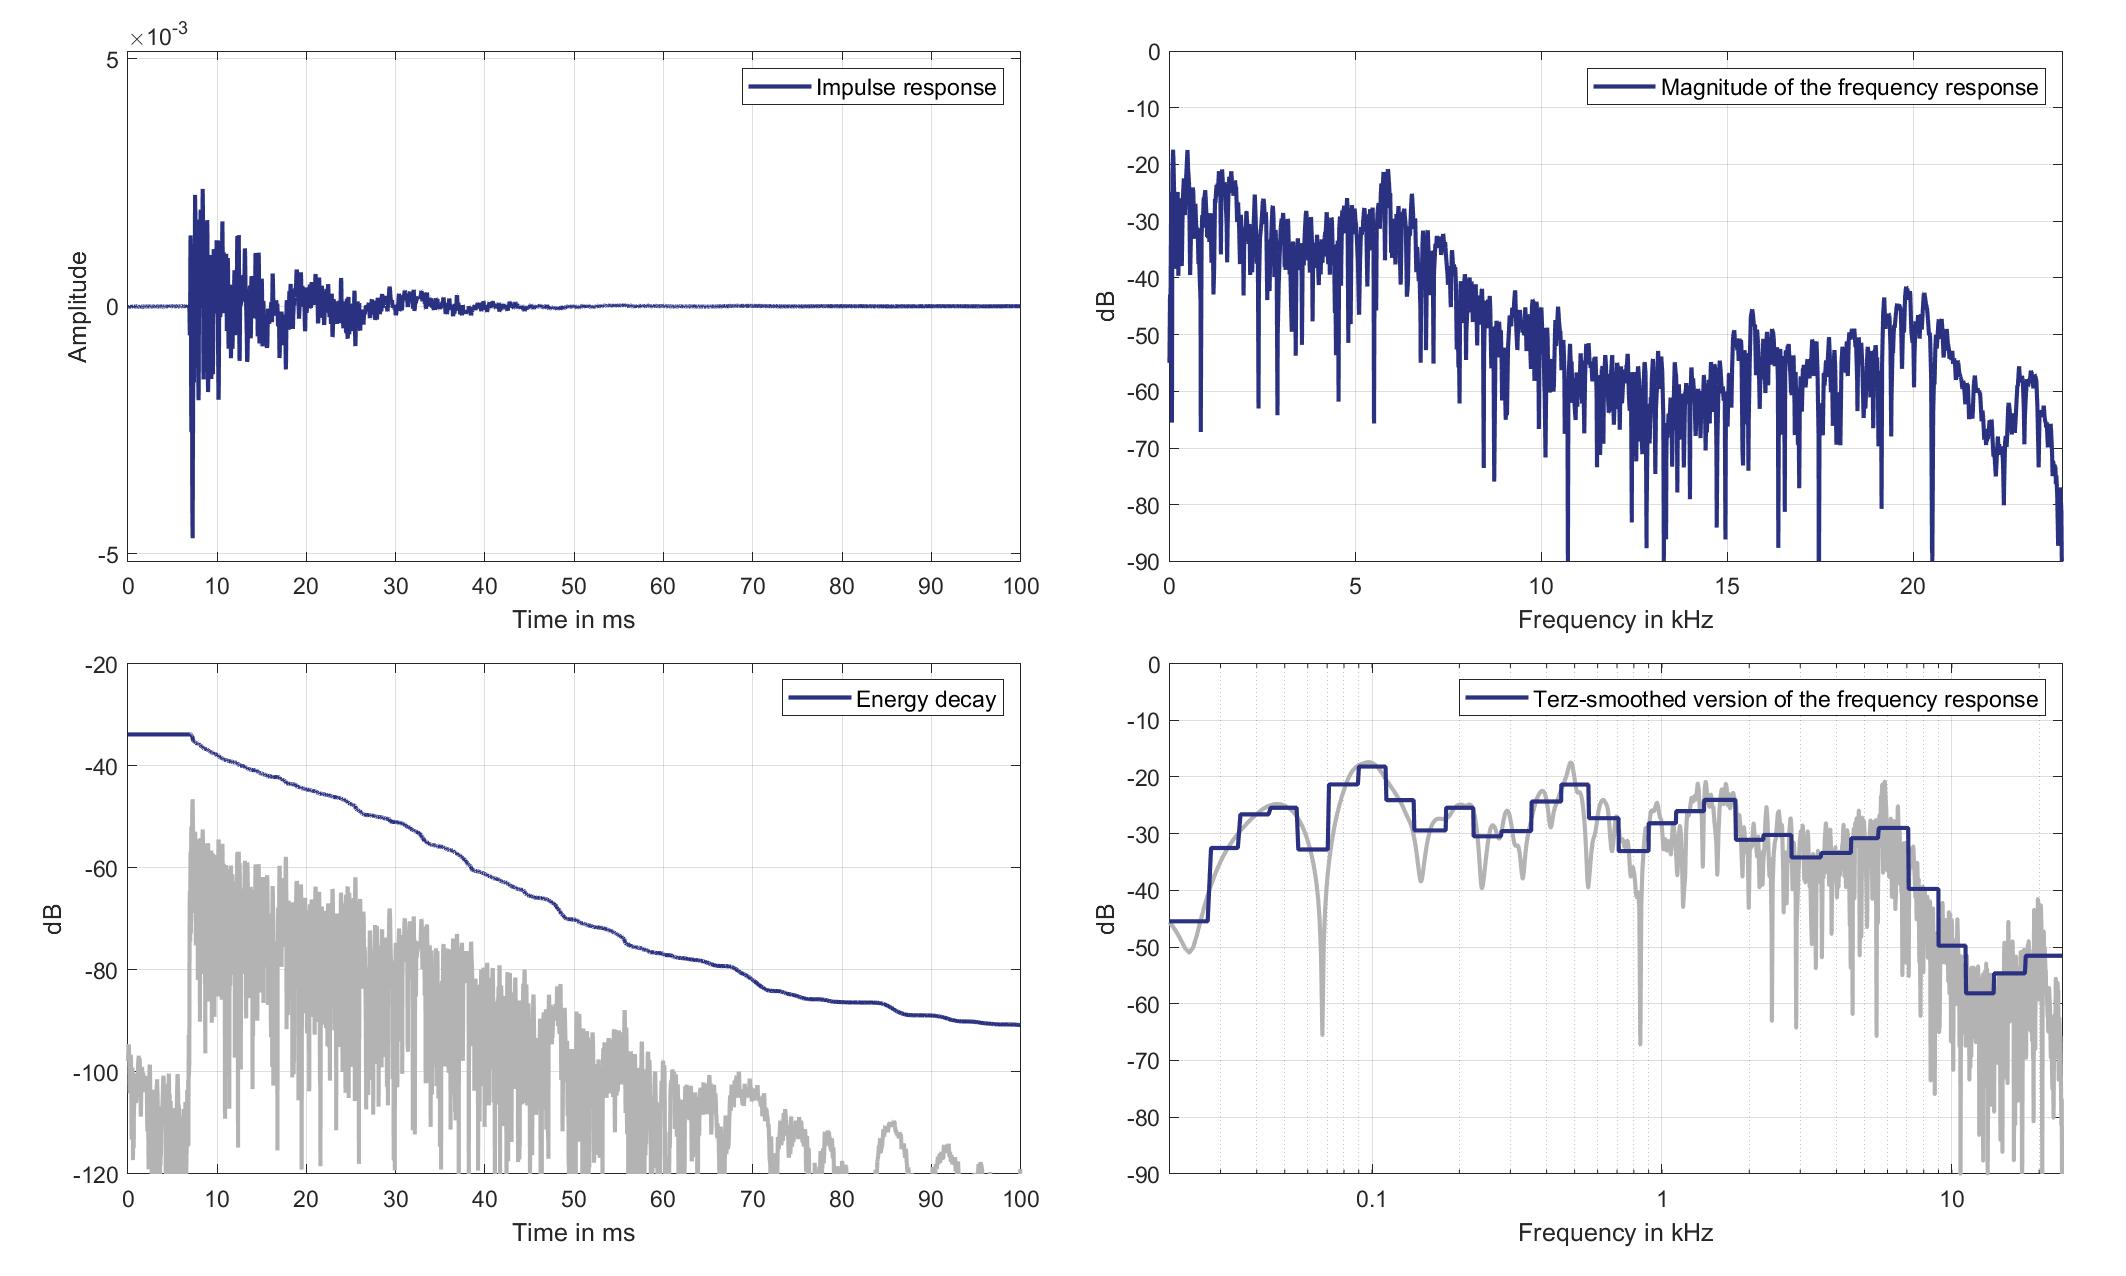
Download impulse response (in ".fir" format).
In the download section you can download all impulse response files as well as format explanation and Matlab as well as Python code examples for loading fir files.
Mic. 2
Standard Car Loudspeaker 0 (Lsp. 18) to Standard Car Microphone 2 (Mic. 2)
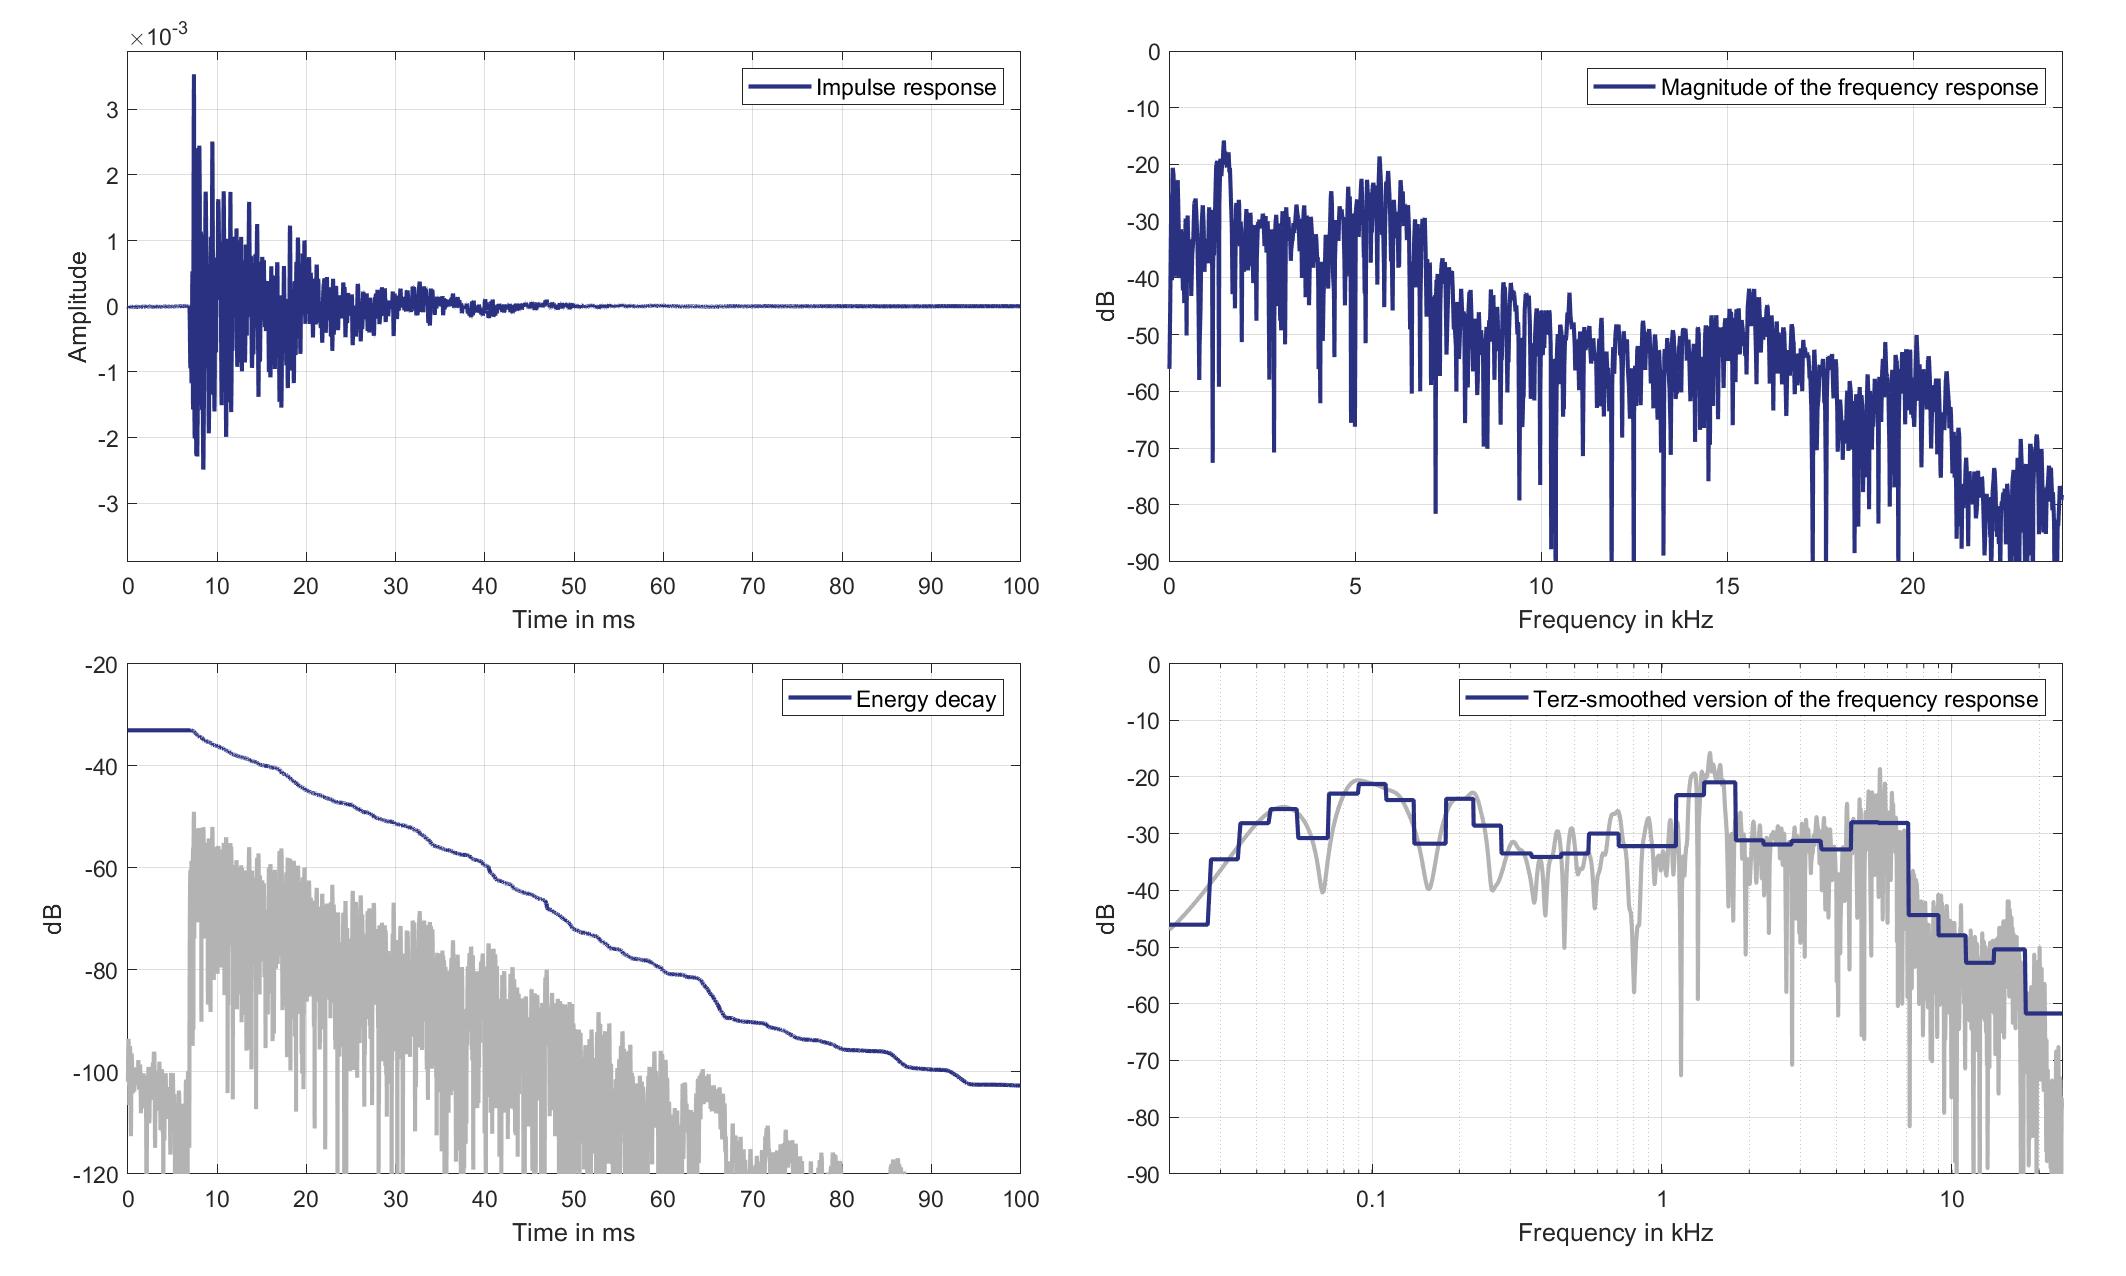
Download impulse response (in ".fir" format).
In the download section you can download all impulse response files as well as format explanation and Matlab as well as Python code examples for loading fir files.
Mic. 3
Standard Car Loudspeaker 0 (Lsp. 18) to Standard Car Microphone 3 (Mic. 3)
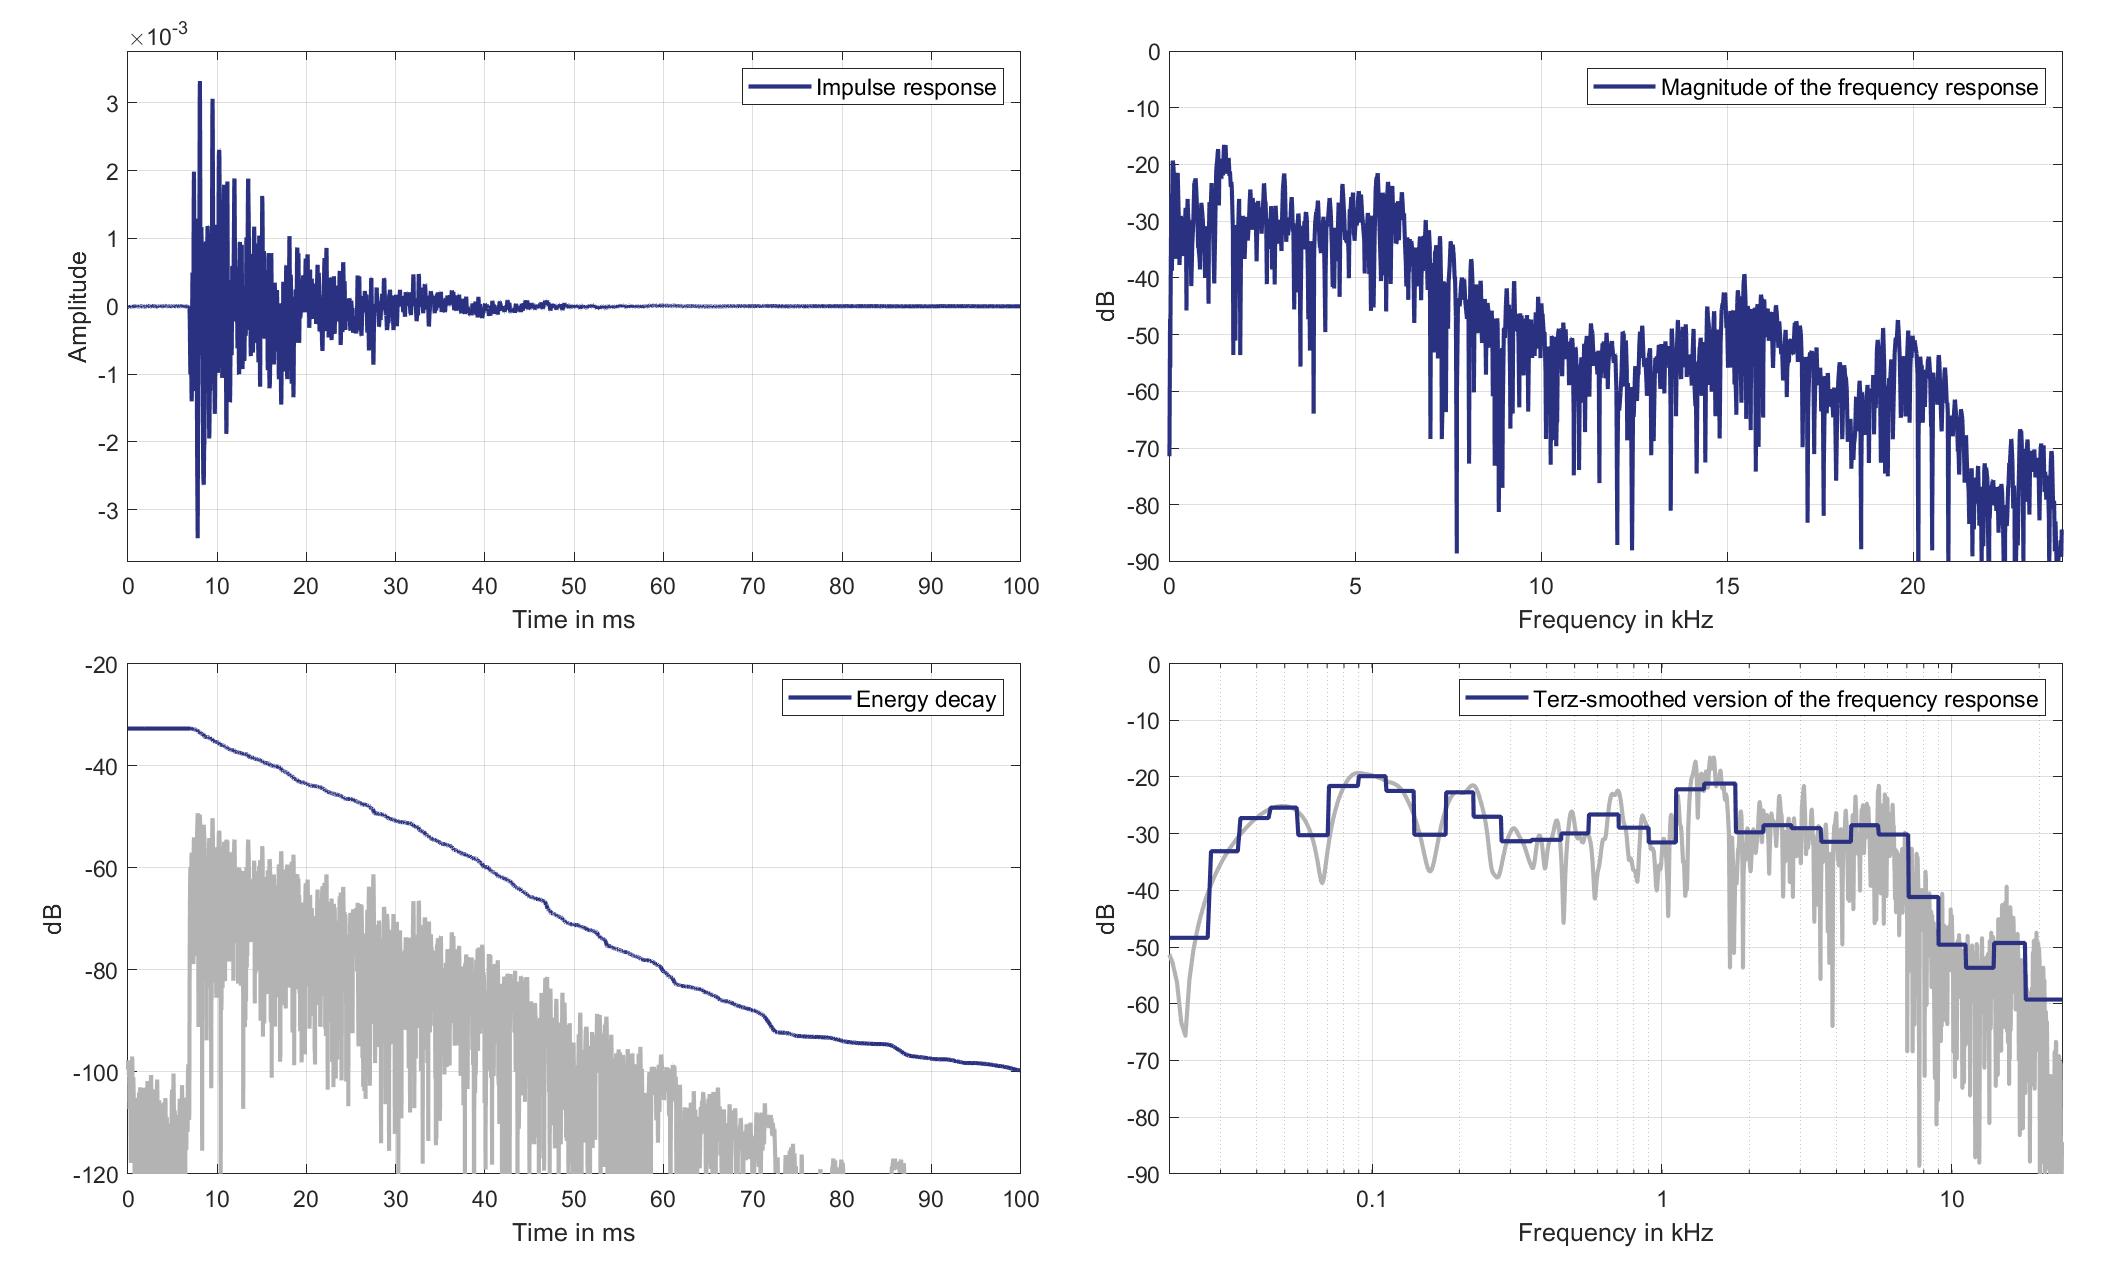
Download impulse response (in ".fir" format).
In the download section you can download all impulse response files as well as format explanation and Matlab as well as Python code examples for loading fir files.
Mic. 4
Standard Car Loudspeaker 0 (Lsp. 18) to Standard Car Microphone 4 (Mic. 4)
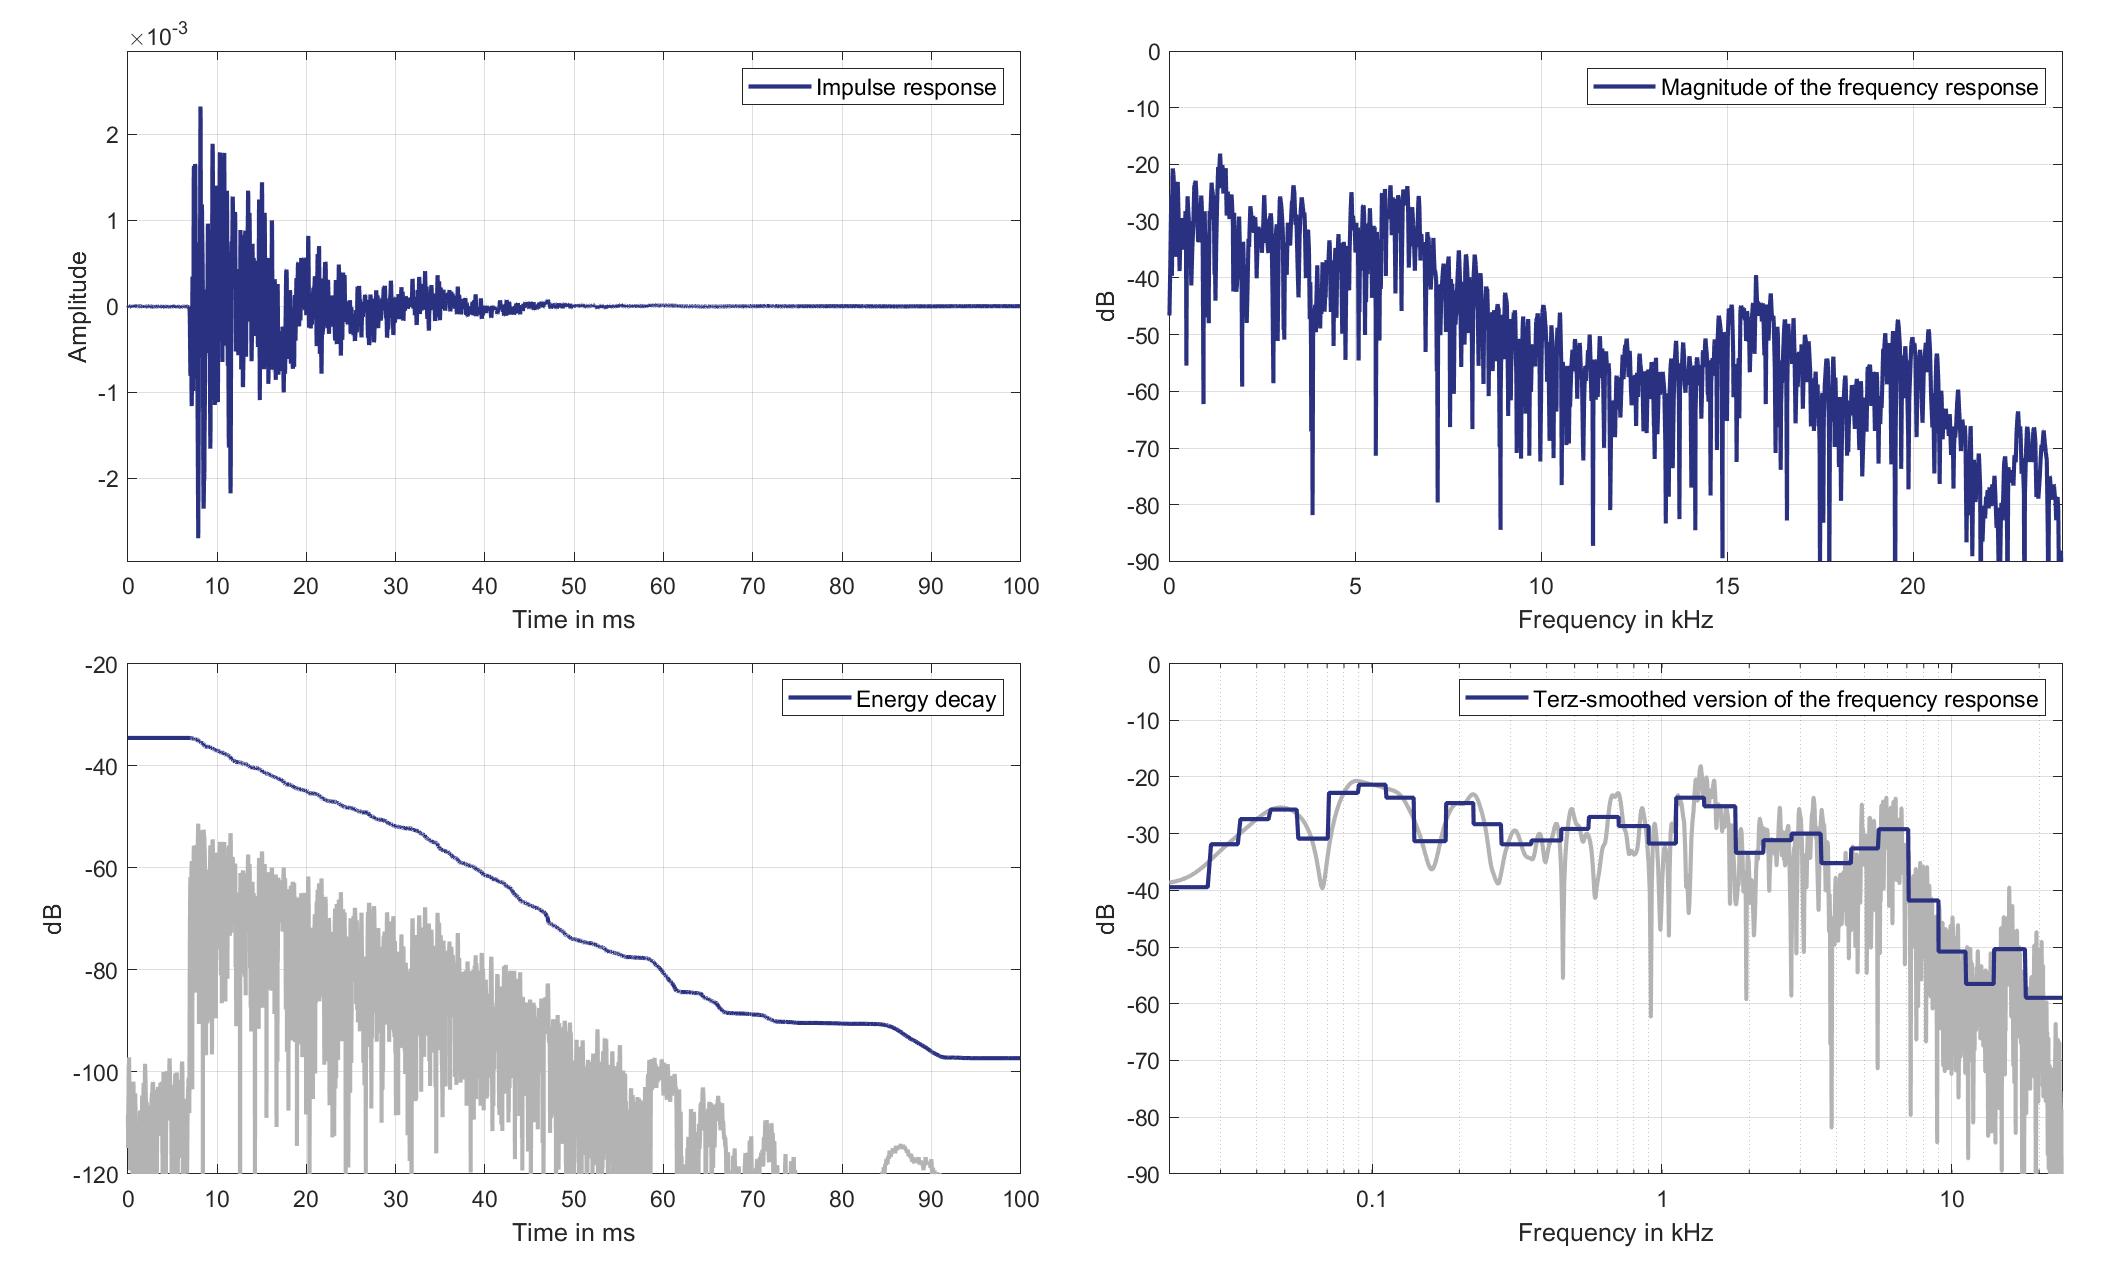
Download impulse response (in ".fir" format).
In the download section you can download all impulse response files as well as format explanation and Matlab as well as Python code examples for loading fir files.
Mic. 5
Standard Car Loudspeaker 0 (Lsp. 18) to Standard Car Microphone 5 (Mic. 5)
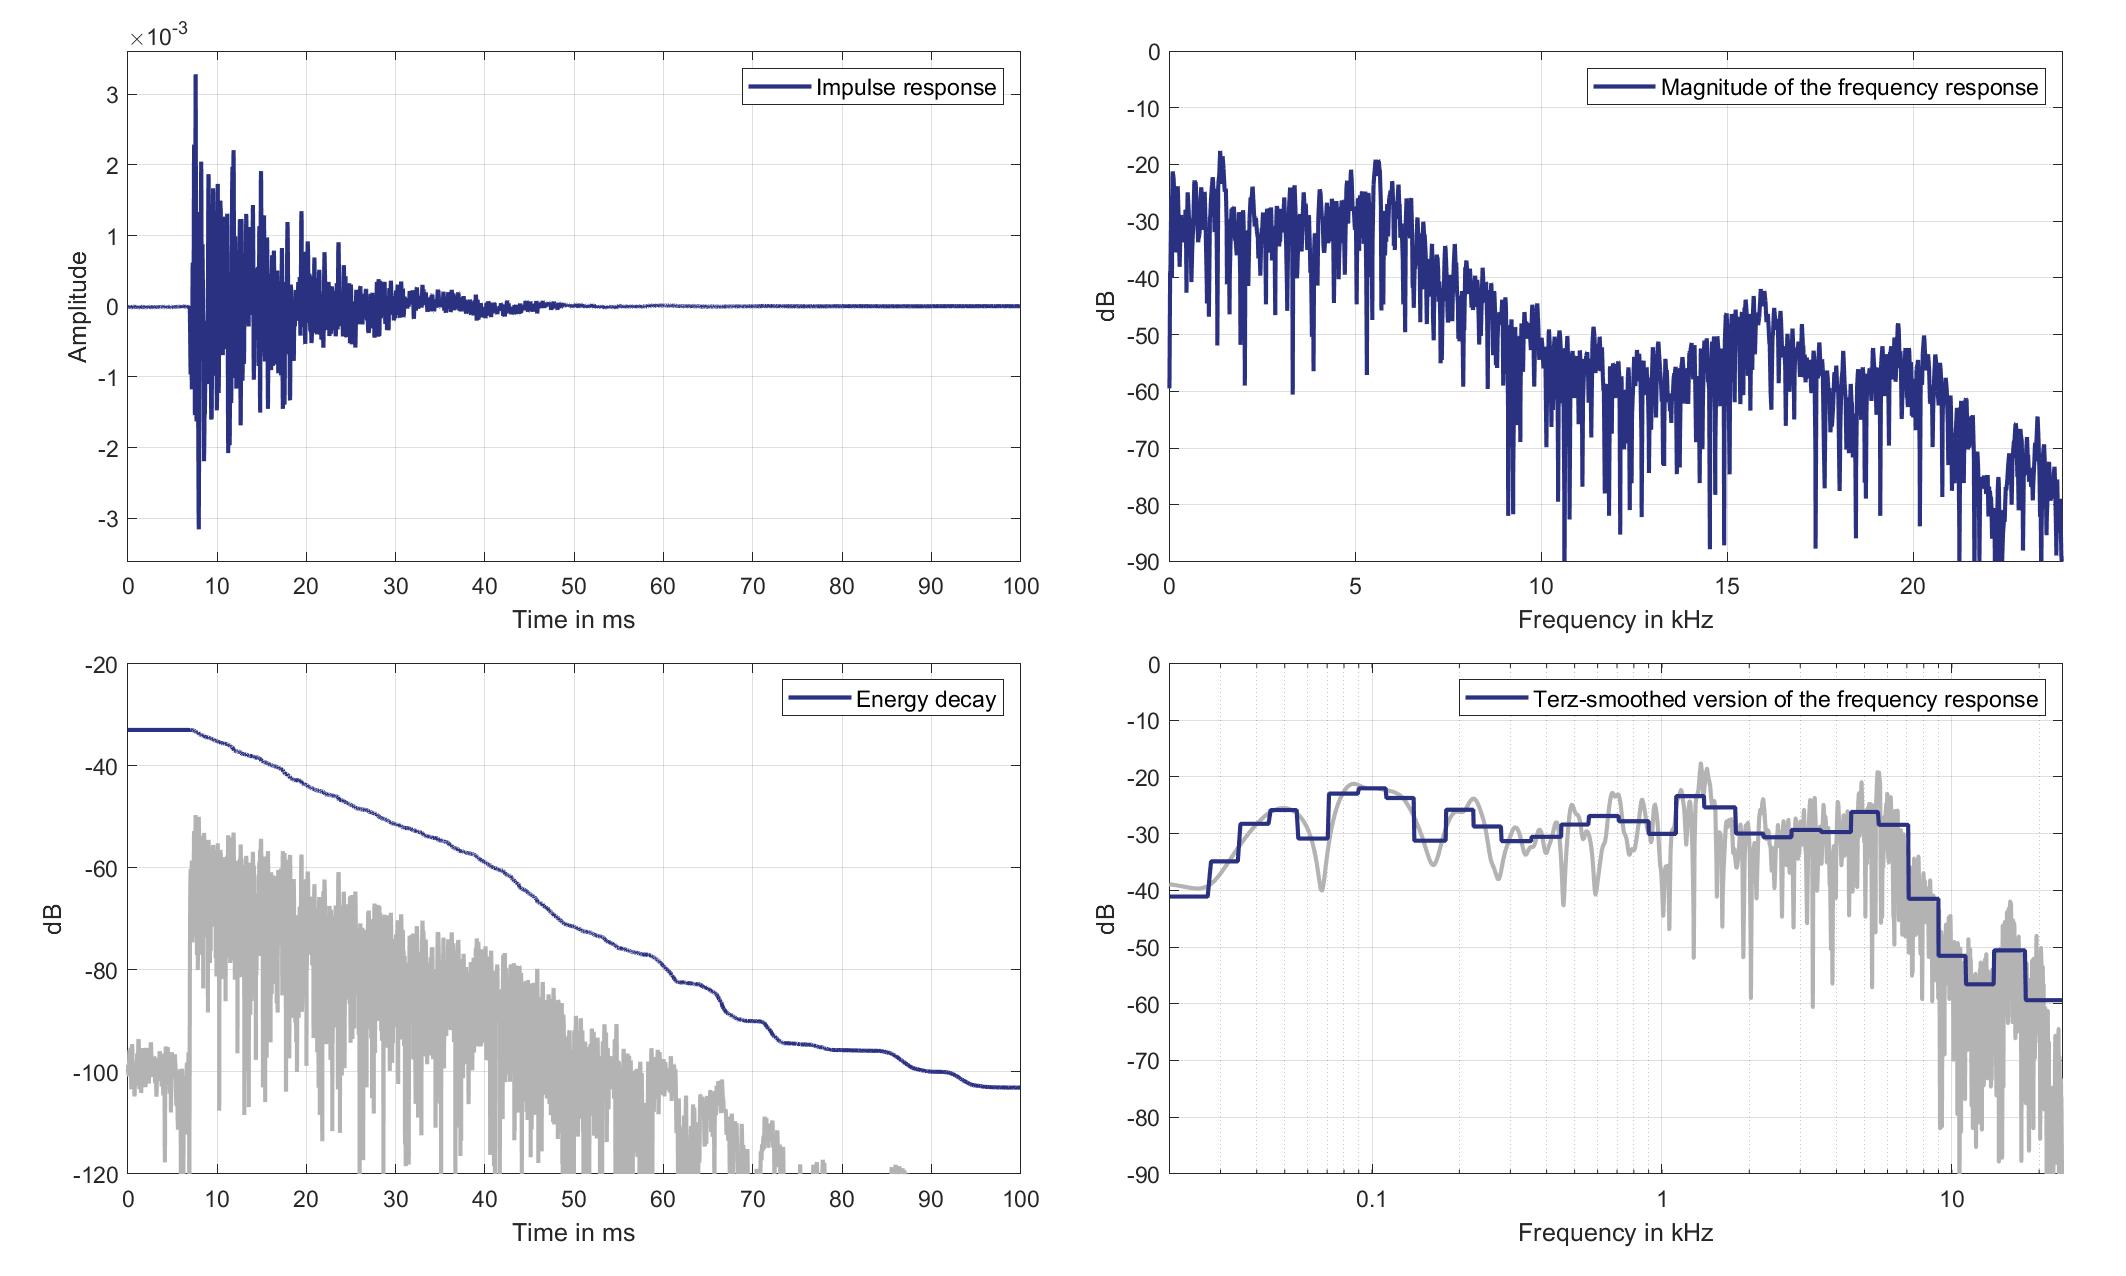
Download impulse response (in ".fir" format).
In the download section you can download all impulse response files as well as format explanation and Matlab as well as Python code examples for loading fir files.
Mic. 6
Standard Car Loudspeaker 0 (Lsp. 18) to Standard Car Microphone 6 (Mic. 6)
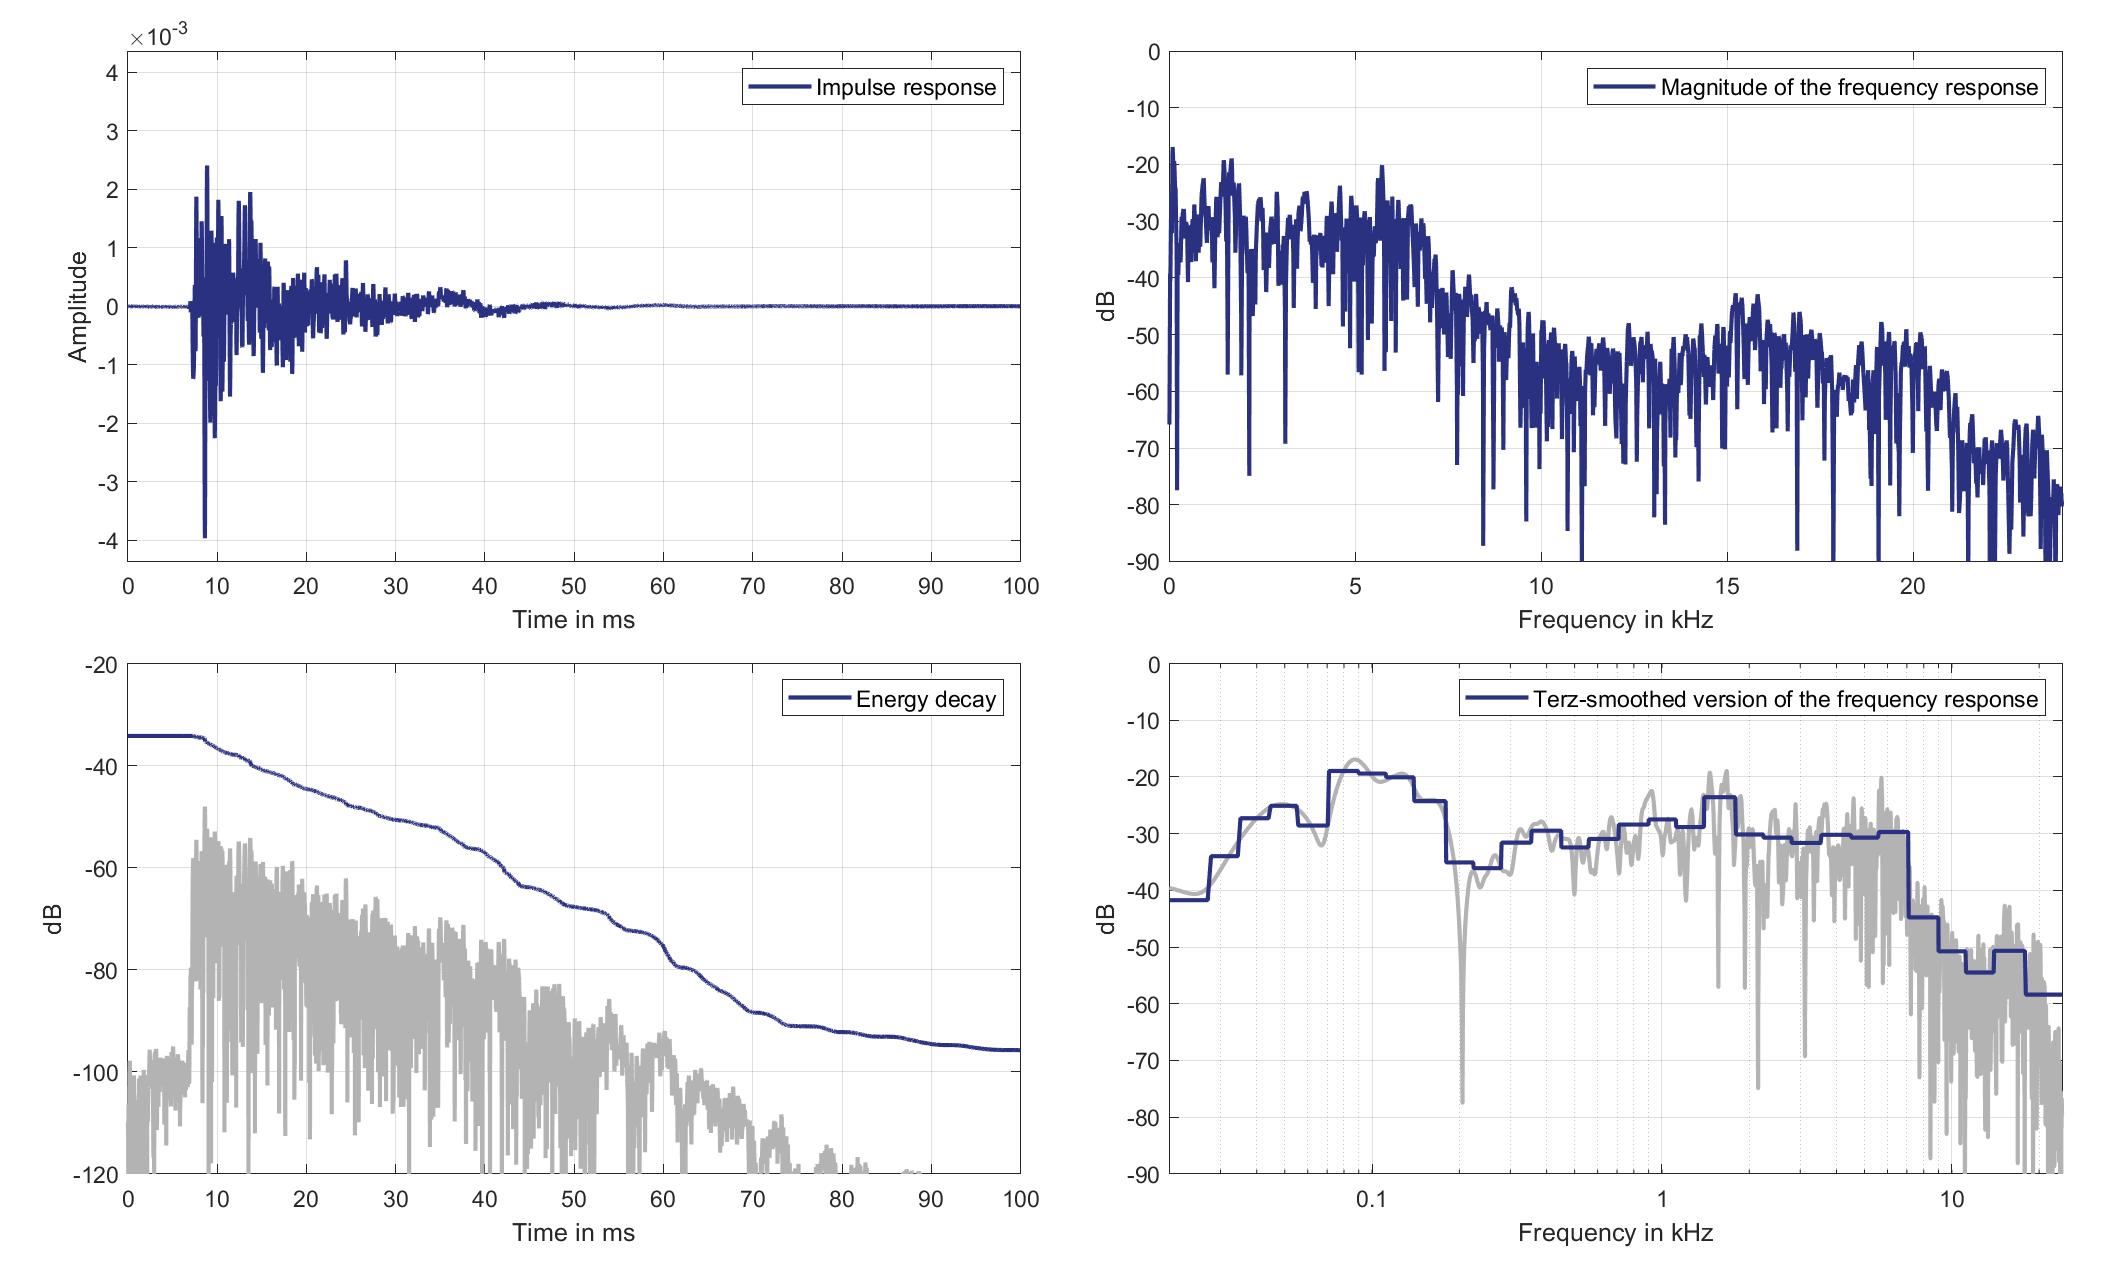
Download impulse response (in ".fir" format).
In the download section you can download all impulse response files as well as format explanation and Matlab as well as Python code examples for loading fir files.
Mic. 7
Standard Car Loudspeaker 0 (Lsp. 18) to Standard Car Microphone 7 (Mic. 7)
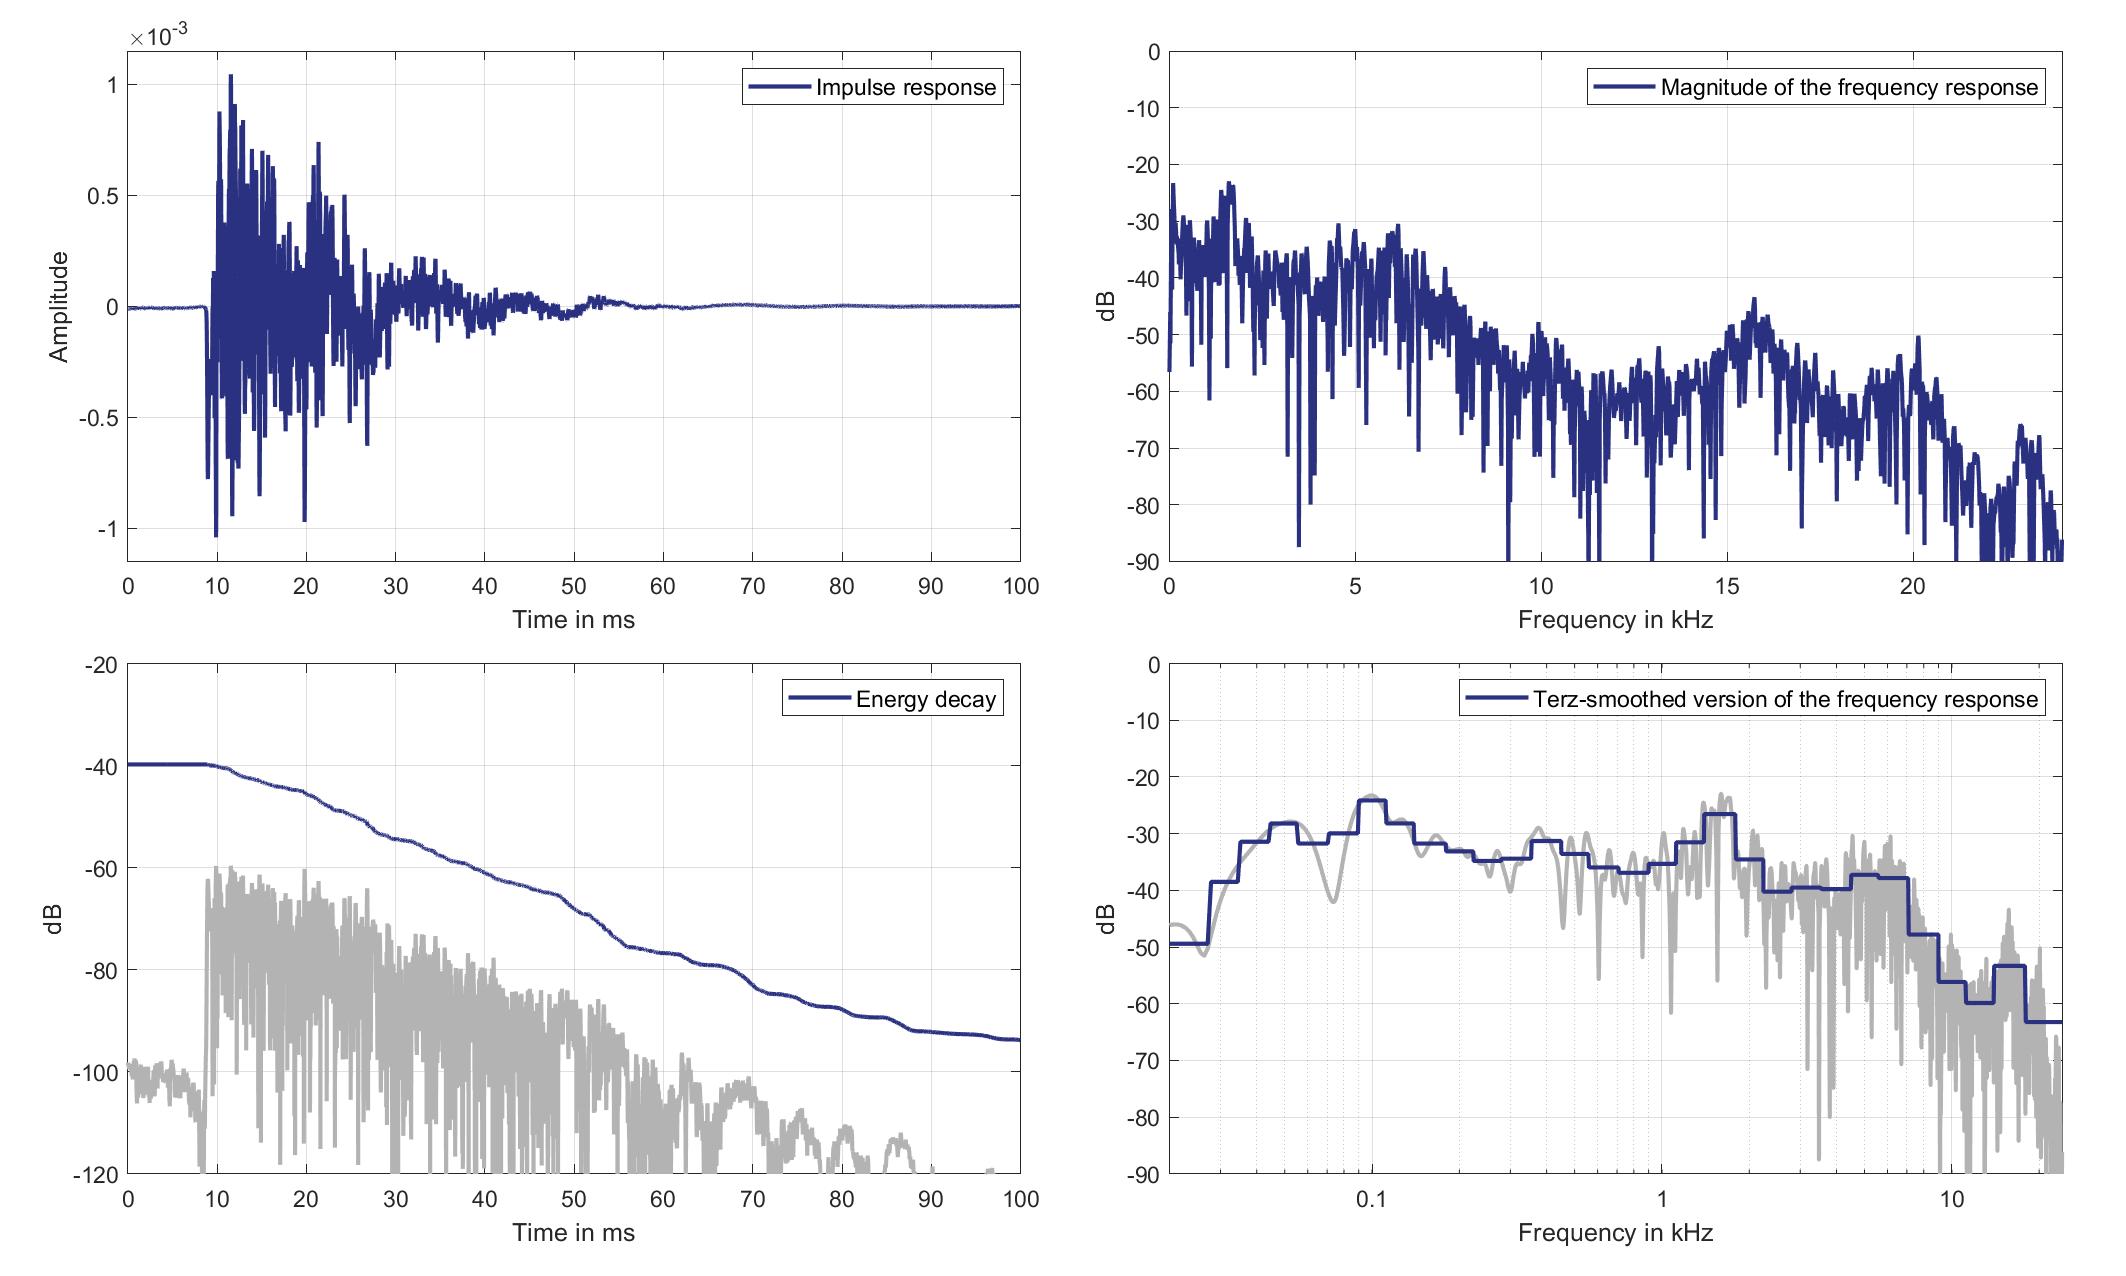
Download impulse response (in ".fir" format).
In the download section you can download all impulse response files as well as format explanation and Matlab as well as Python code examples for loading fir files.
Mic. 8
Standard Car Loudspeaker 0 (Lsp. 18) to Standard Car Microphone 8 (Mic. 8)

Download impulse response (in ".fir" format).
In the download section you can download all impulse response files as well as format explanation and Matlab as well as Python code examples for loading fir files.
Mic. 9
Standard Car Loudspeaker 0 (Lsp. 18) to Standard Car Microphone 9 (Mic. 9)

Download impulse response (in ".fir" format).
In the download section you can download all impulse response files as well as format explanation and Matlab as well as Python code examples for loading fir files.
Mic. 10
Standard Car Loudspeaker 0 (Lsp. 18) to Standard Car Microphone 10 (Mic. 10)
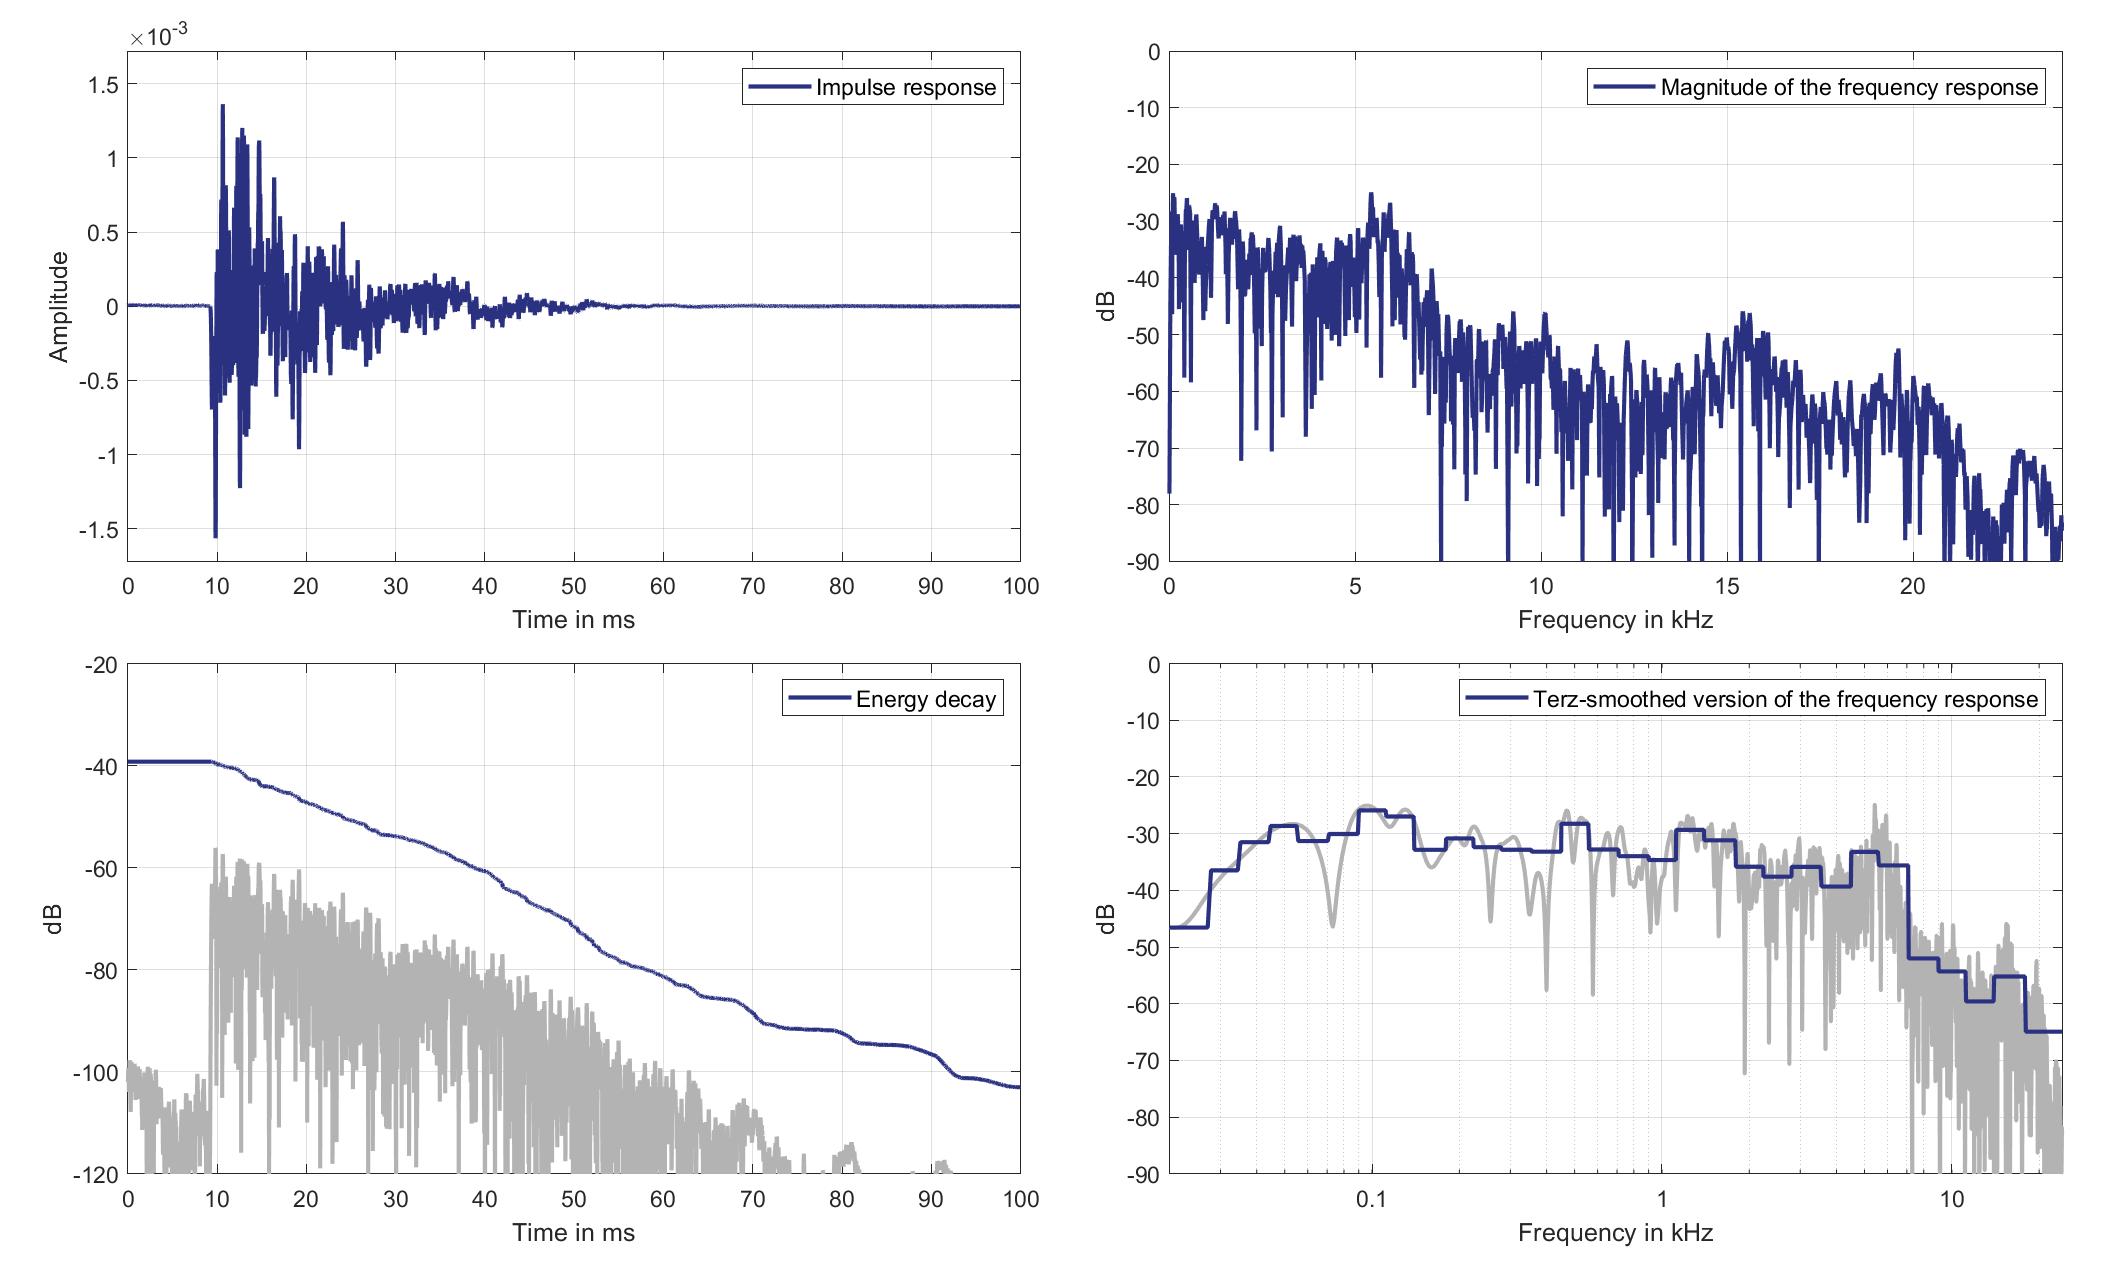
Download impulse response (in ".fir" format).
In the download section you can download all impulse response files as well as format explanation and Matlab as well as Python code examples for loading fir files.
Mic. 11
Standard Car Loudspeaker 0 (Lsp. 18) to Standard Car Microphone 11 (Mic. 11)
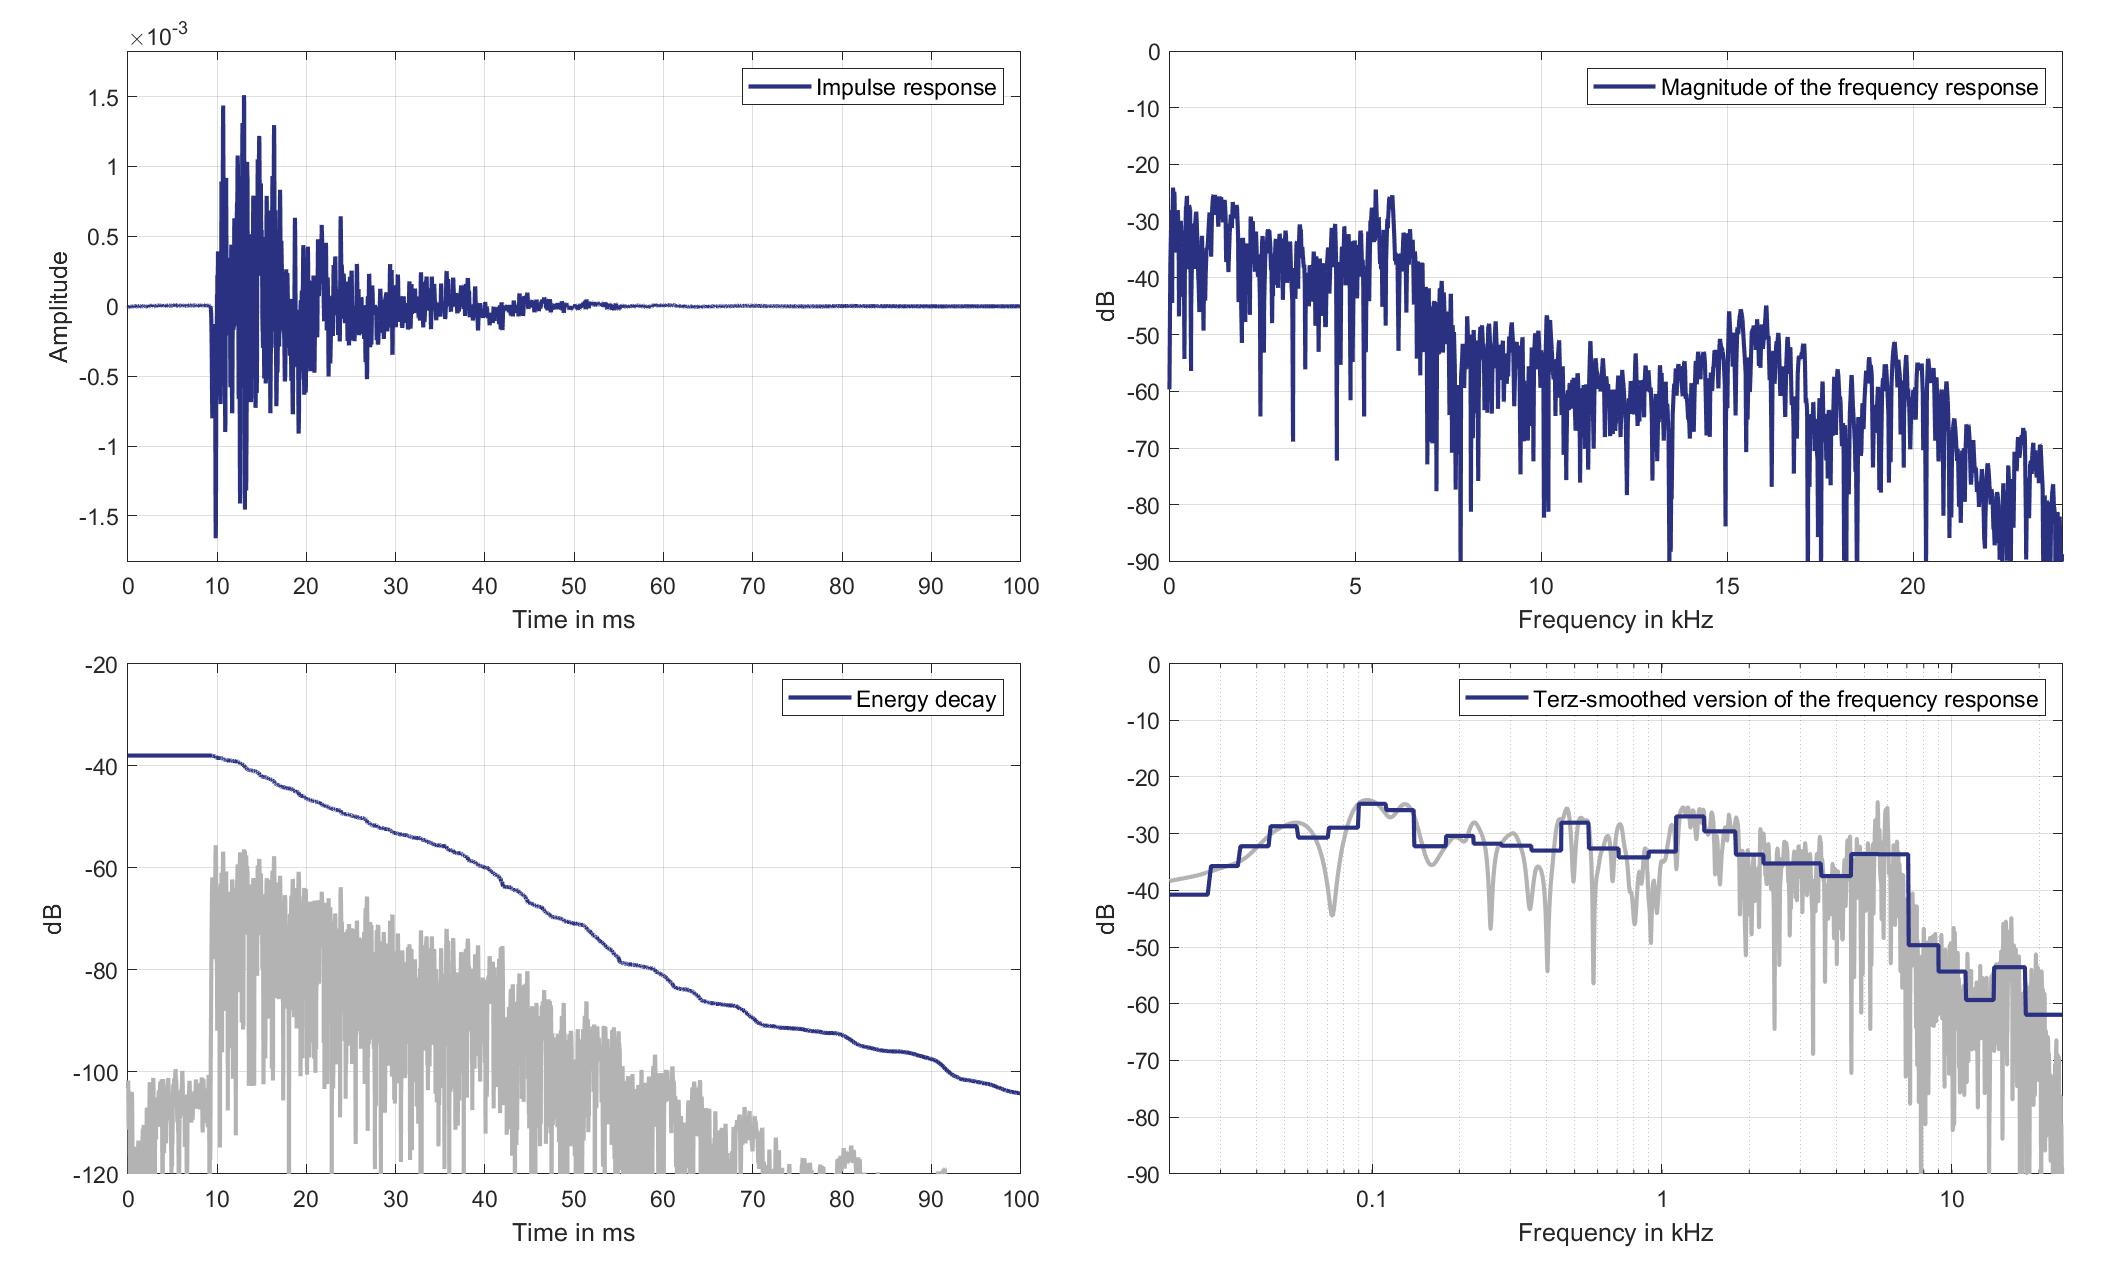
Download impulse response (in ".fir" format).
In the download section you can download all impulse response files as well as format explanation and Matlab as well as Python code examples for loading fir files.
Mic. 12
Standard Car Loudspeaker 0 (Lsp. 18) to Standard Car Microphone 12 (Mic. 12)

Download impulse response (in ".fir" format).
In the download section you can download all impulse response files as well as format explanation and Matlab as well as Python code examples for loading fir files.
Mic. 13
Standard Car Loudspeaker 0 (Lsp. 18) to Standard Car Microphone 13 (Mic. 13)
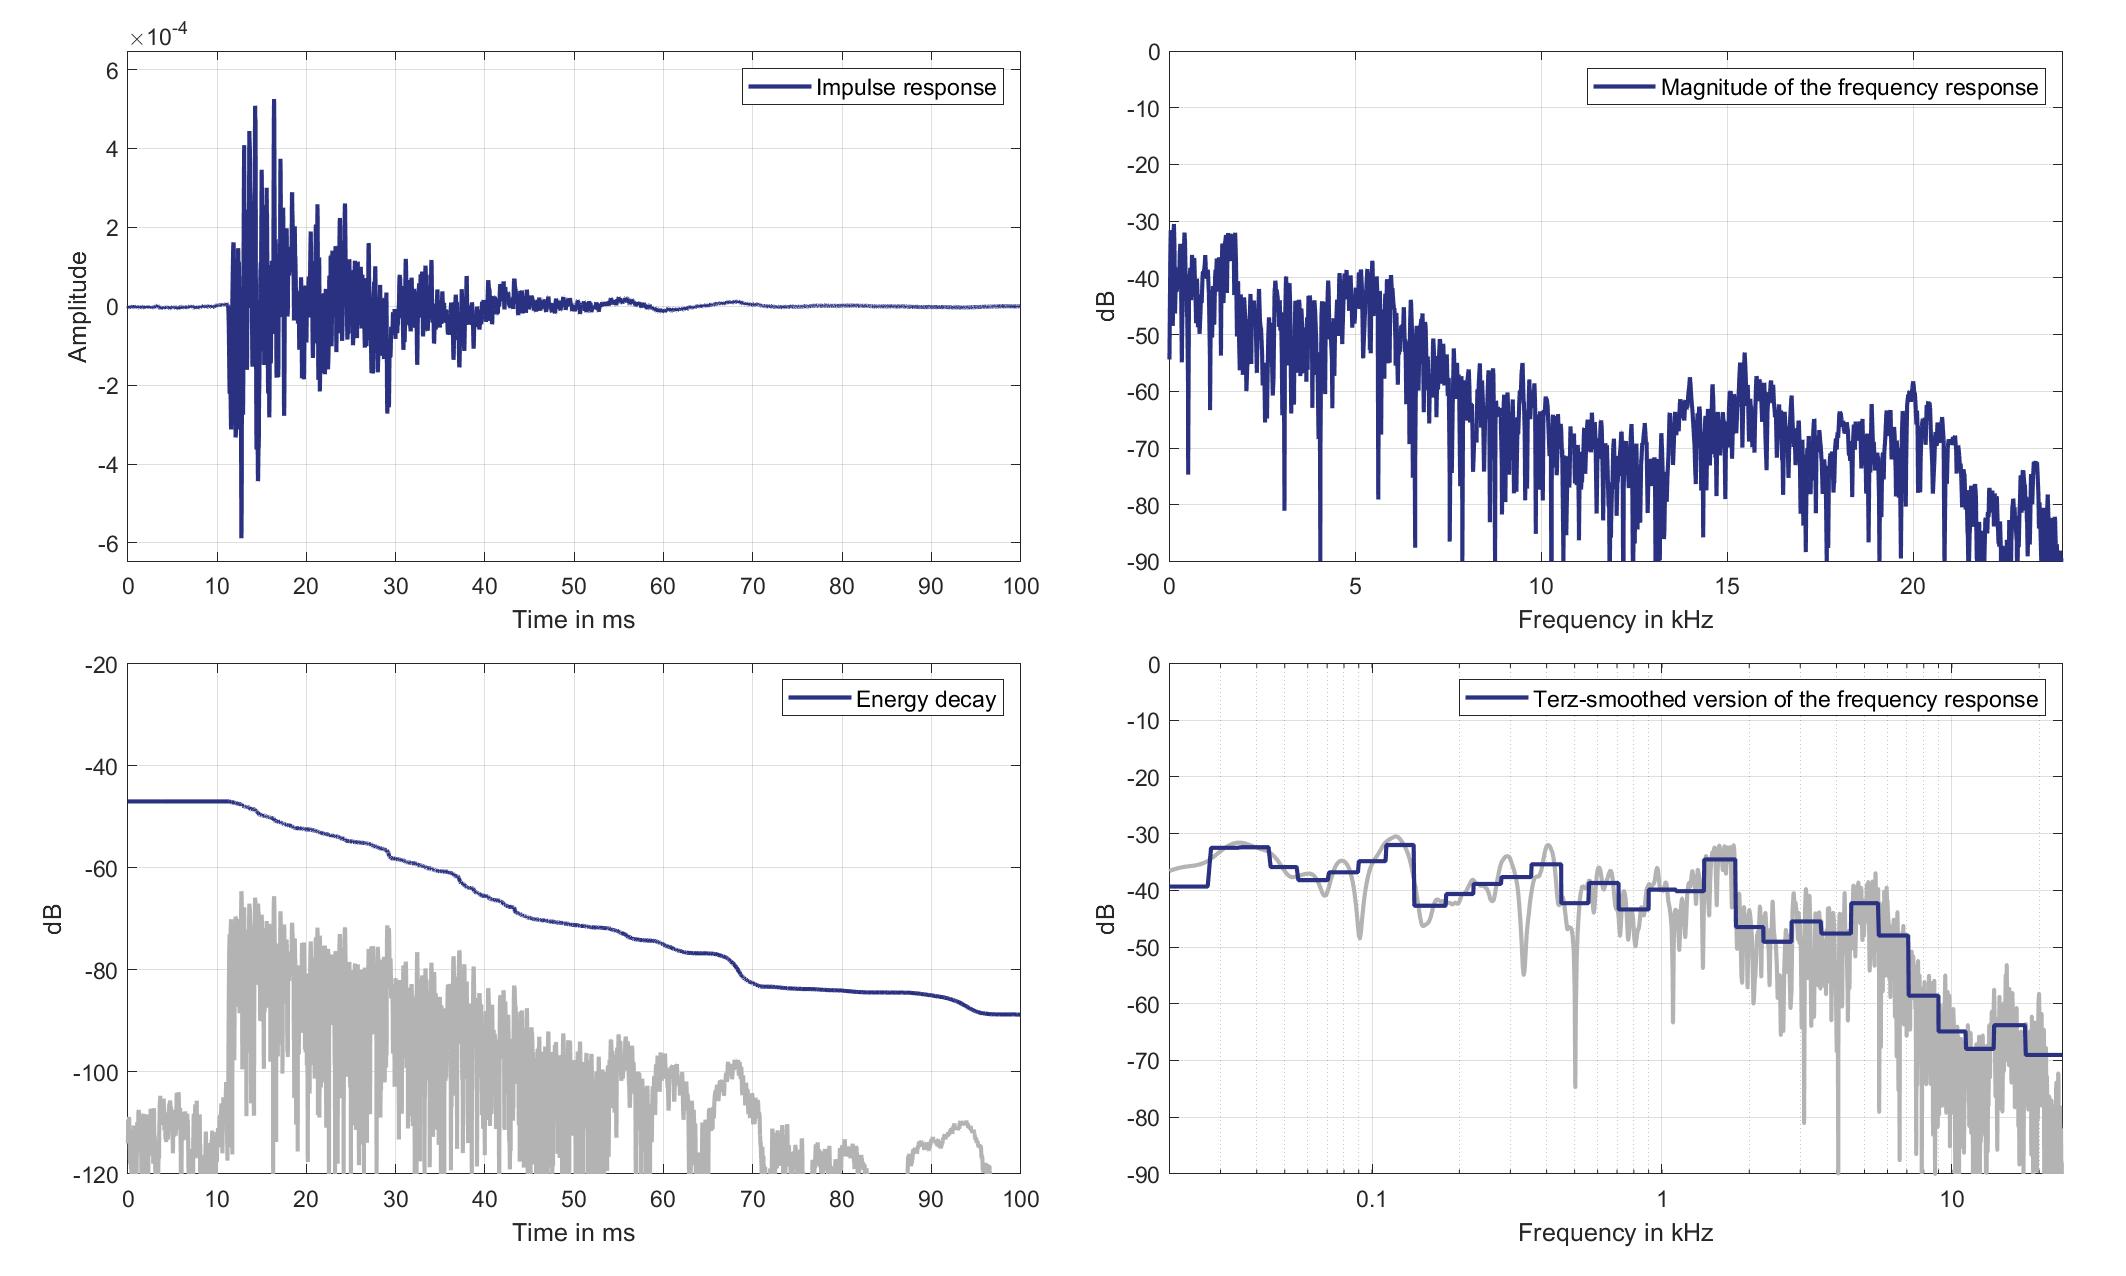
Download impulse response (in ".fir" format).
In the download section you can download all impulse response files as well as format explanation and Matlab as well as Python code examples for loading fir files.
Mic. 14
Standard Car Loudspeaker 0 (Lsp. 18) to Standard Car Microphone 14 (Mic. 14)
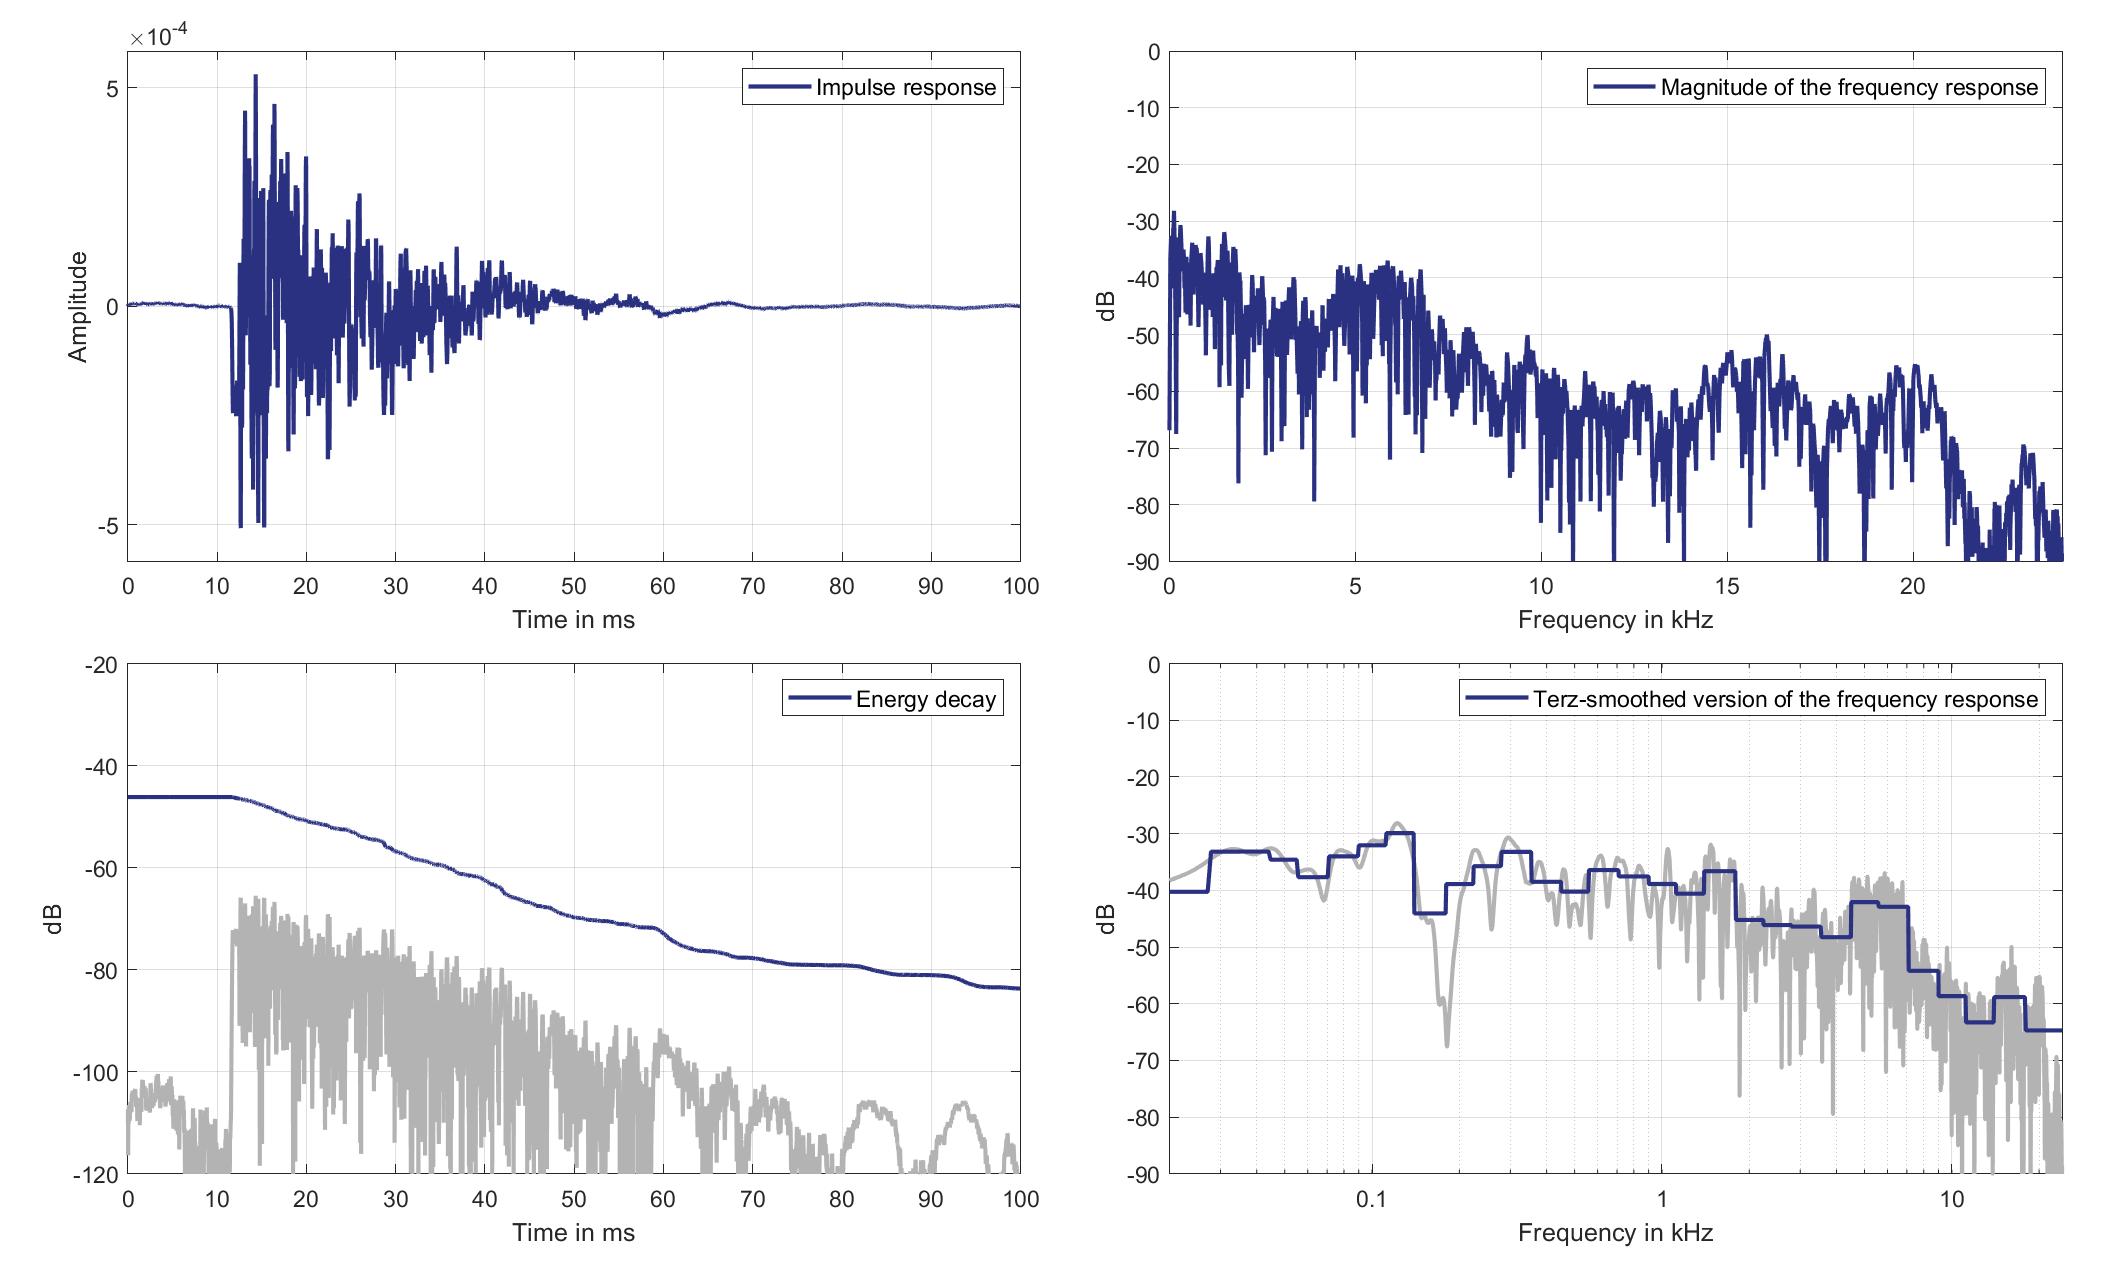
Download impulse response (in ".fir" format).
In the download section you can download all impulse response files as well as format explanation and Matlab as well as Python code examples for loading fir files.
Mic. 15
Standard Car Loudspeaker 0 (Lsp. 18) to Standard Car Microphone 15 (Mic. 15)

Download impulse response (in ".fir" format).
In the download section you can download all impulse response files as well as format explanation and Matlab as well as Python code examples for loading fir files.
Mic. 16
Standard Car Loudspeaker 0 (Lsp. 18) to Standard Car Microphone 16 (Mic. 16)
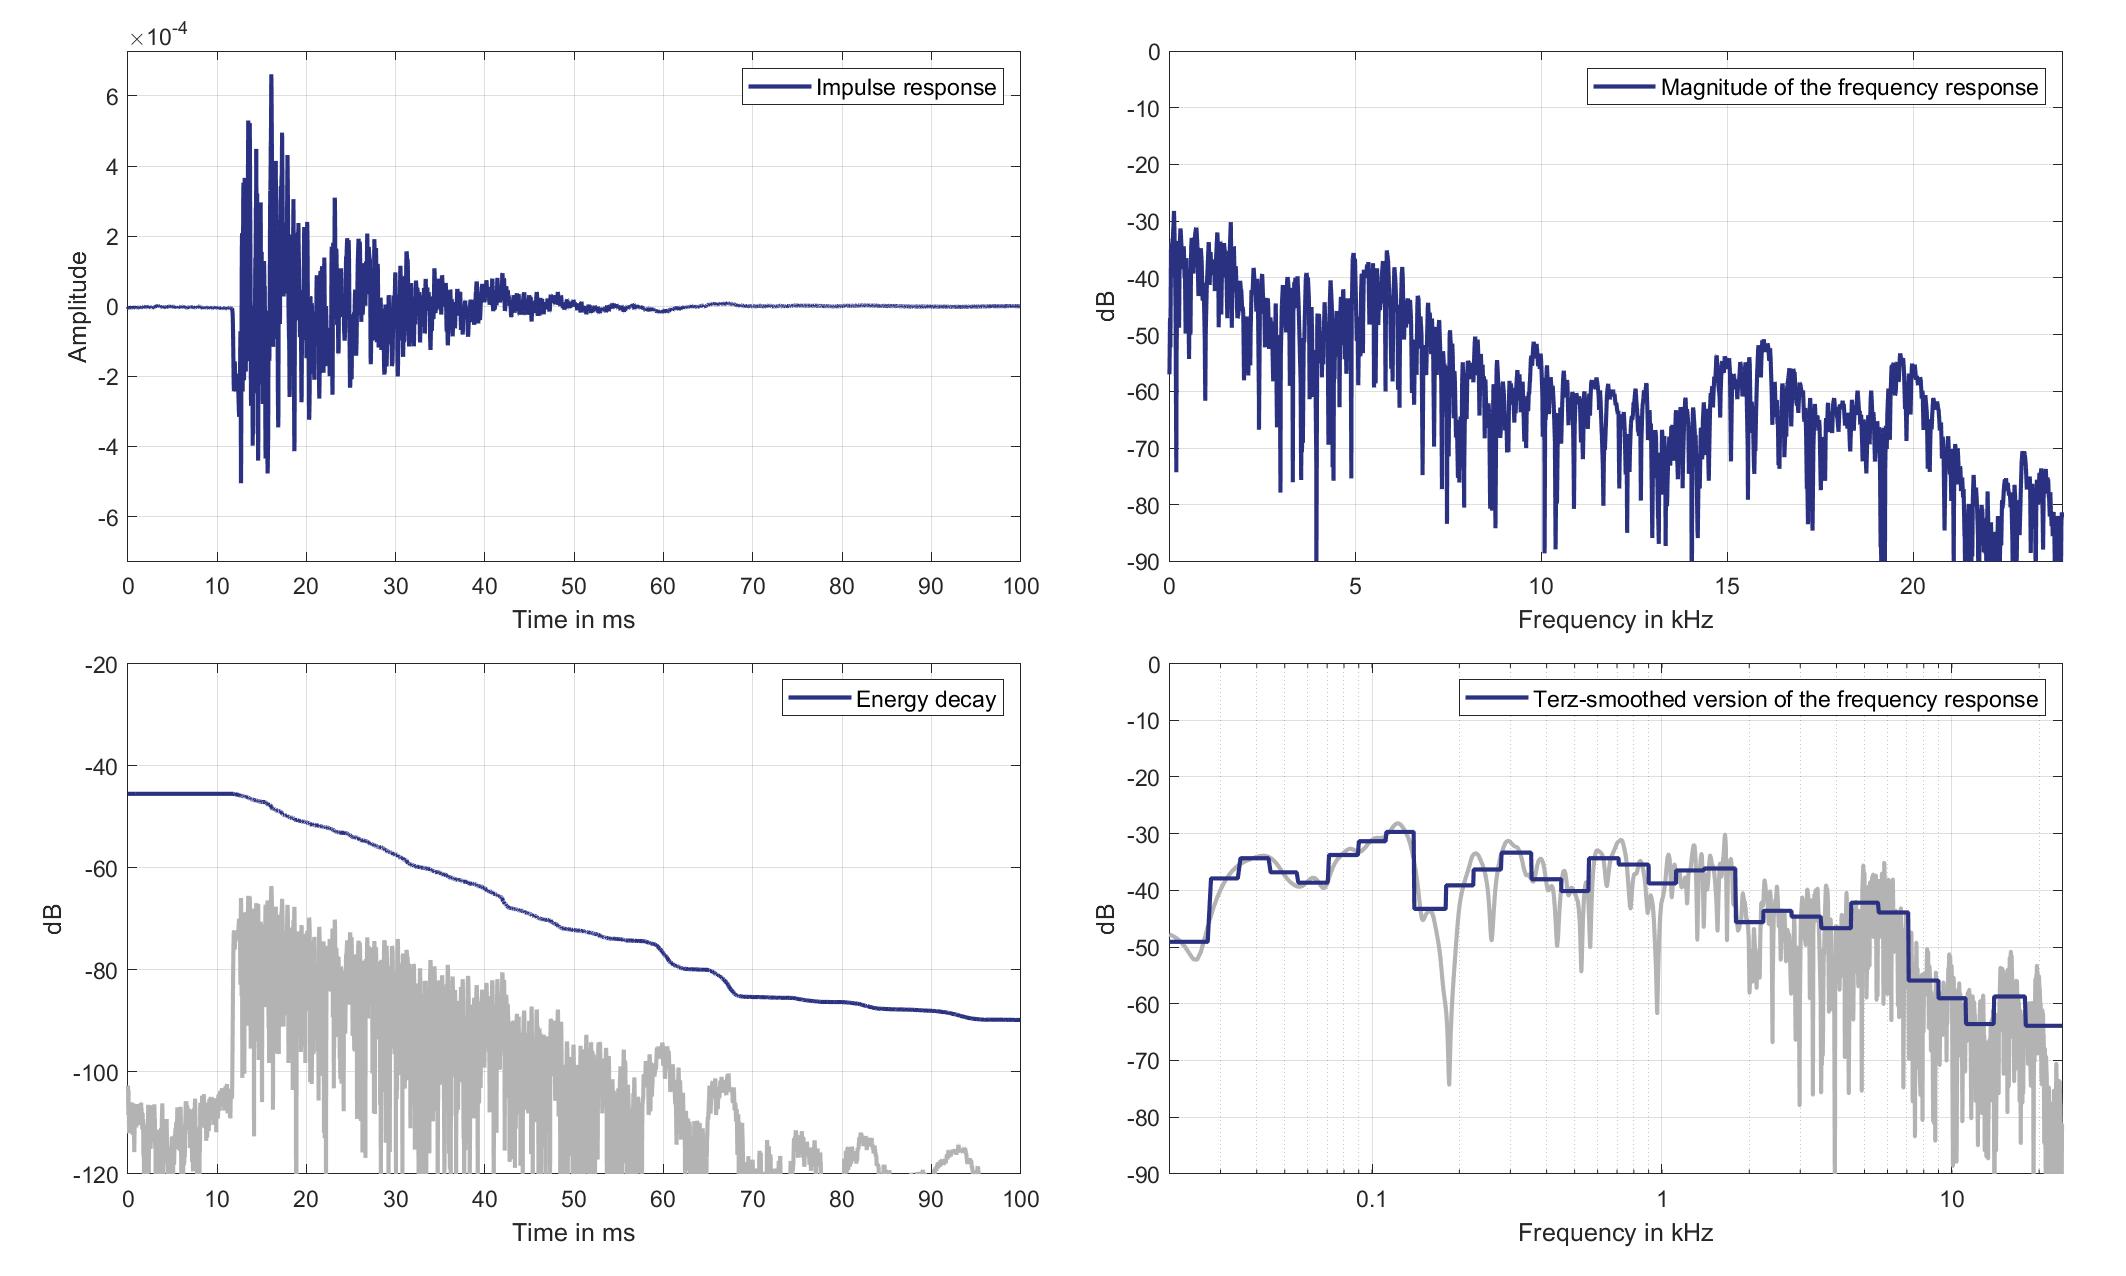
Download impulse response (in ".fir" format).
In the download section you can download all impulse response files as well as format explanation and Matlab as well as Python code examples for loading fir files.
Mic. 17
Standard Car Loudspeaker 0 (Lsp. 18) to Standard Car Microphone 17 (Mic. 17)
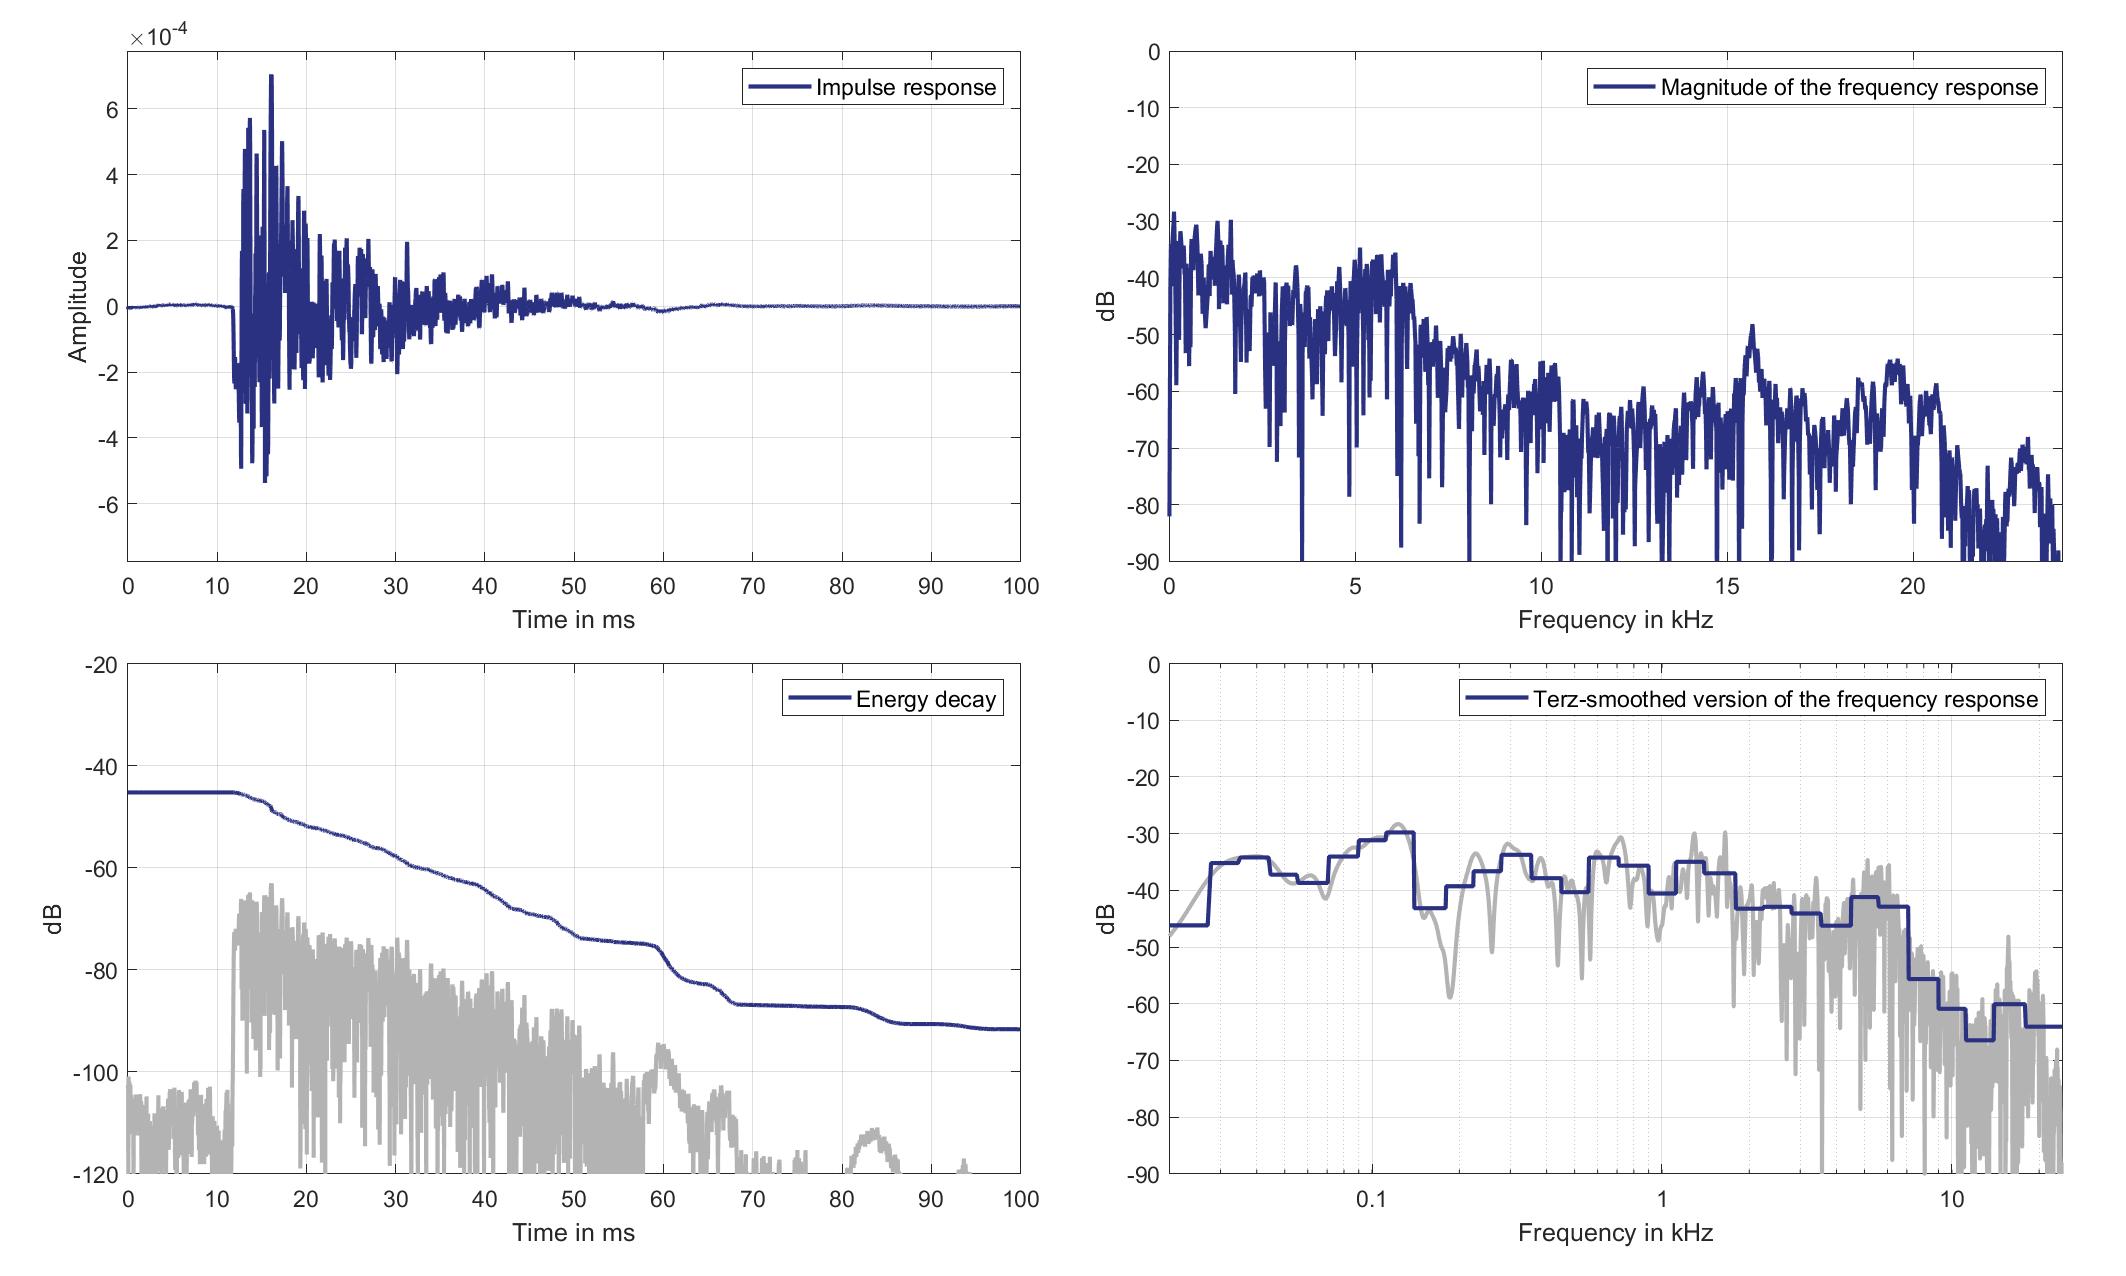
Download impulse response (in ".fir" format).
In the download section you can download all impulse response files as well as format explanation and Matlab as well as Python code examples for loading fir files.
Mic. 18
Standard Car Loudspeaker 0 (Lsp. 18) to Standard Car Microphone 18 (Mic. 18)
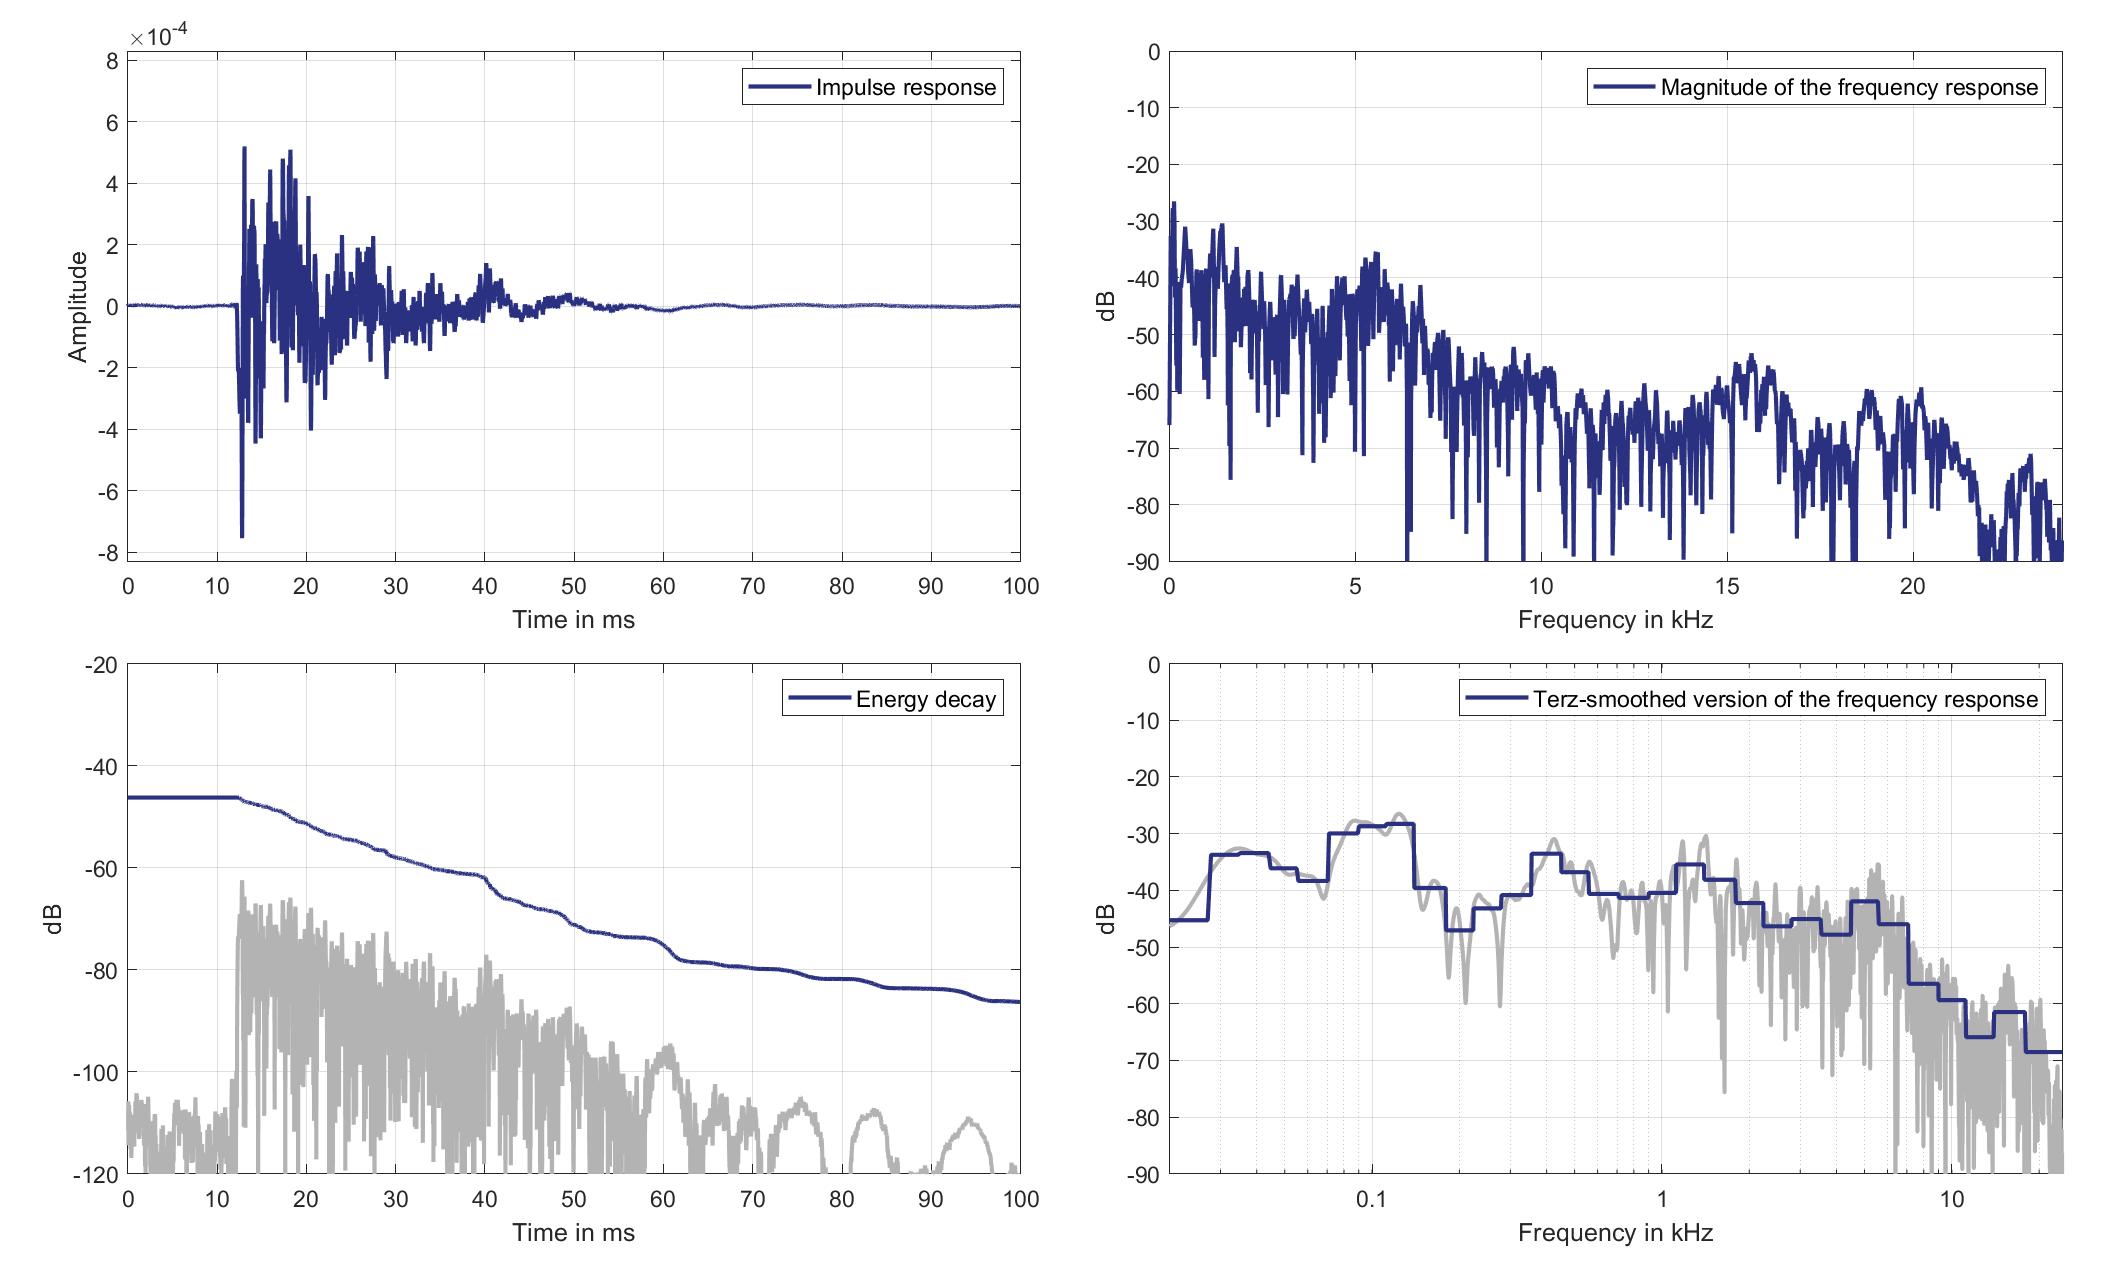
Download impulse response (in ".fir" format).
In the download section you can download all impulse response files as well as format explanation and Matlab as well as Python code examples for loading fir files.
Lsp. 19
Mic. 0
Standard Car Loudspeaker 1 (Lsp. 19) to Standard Car Microphone 0 (Mic. 0)
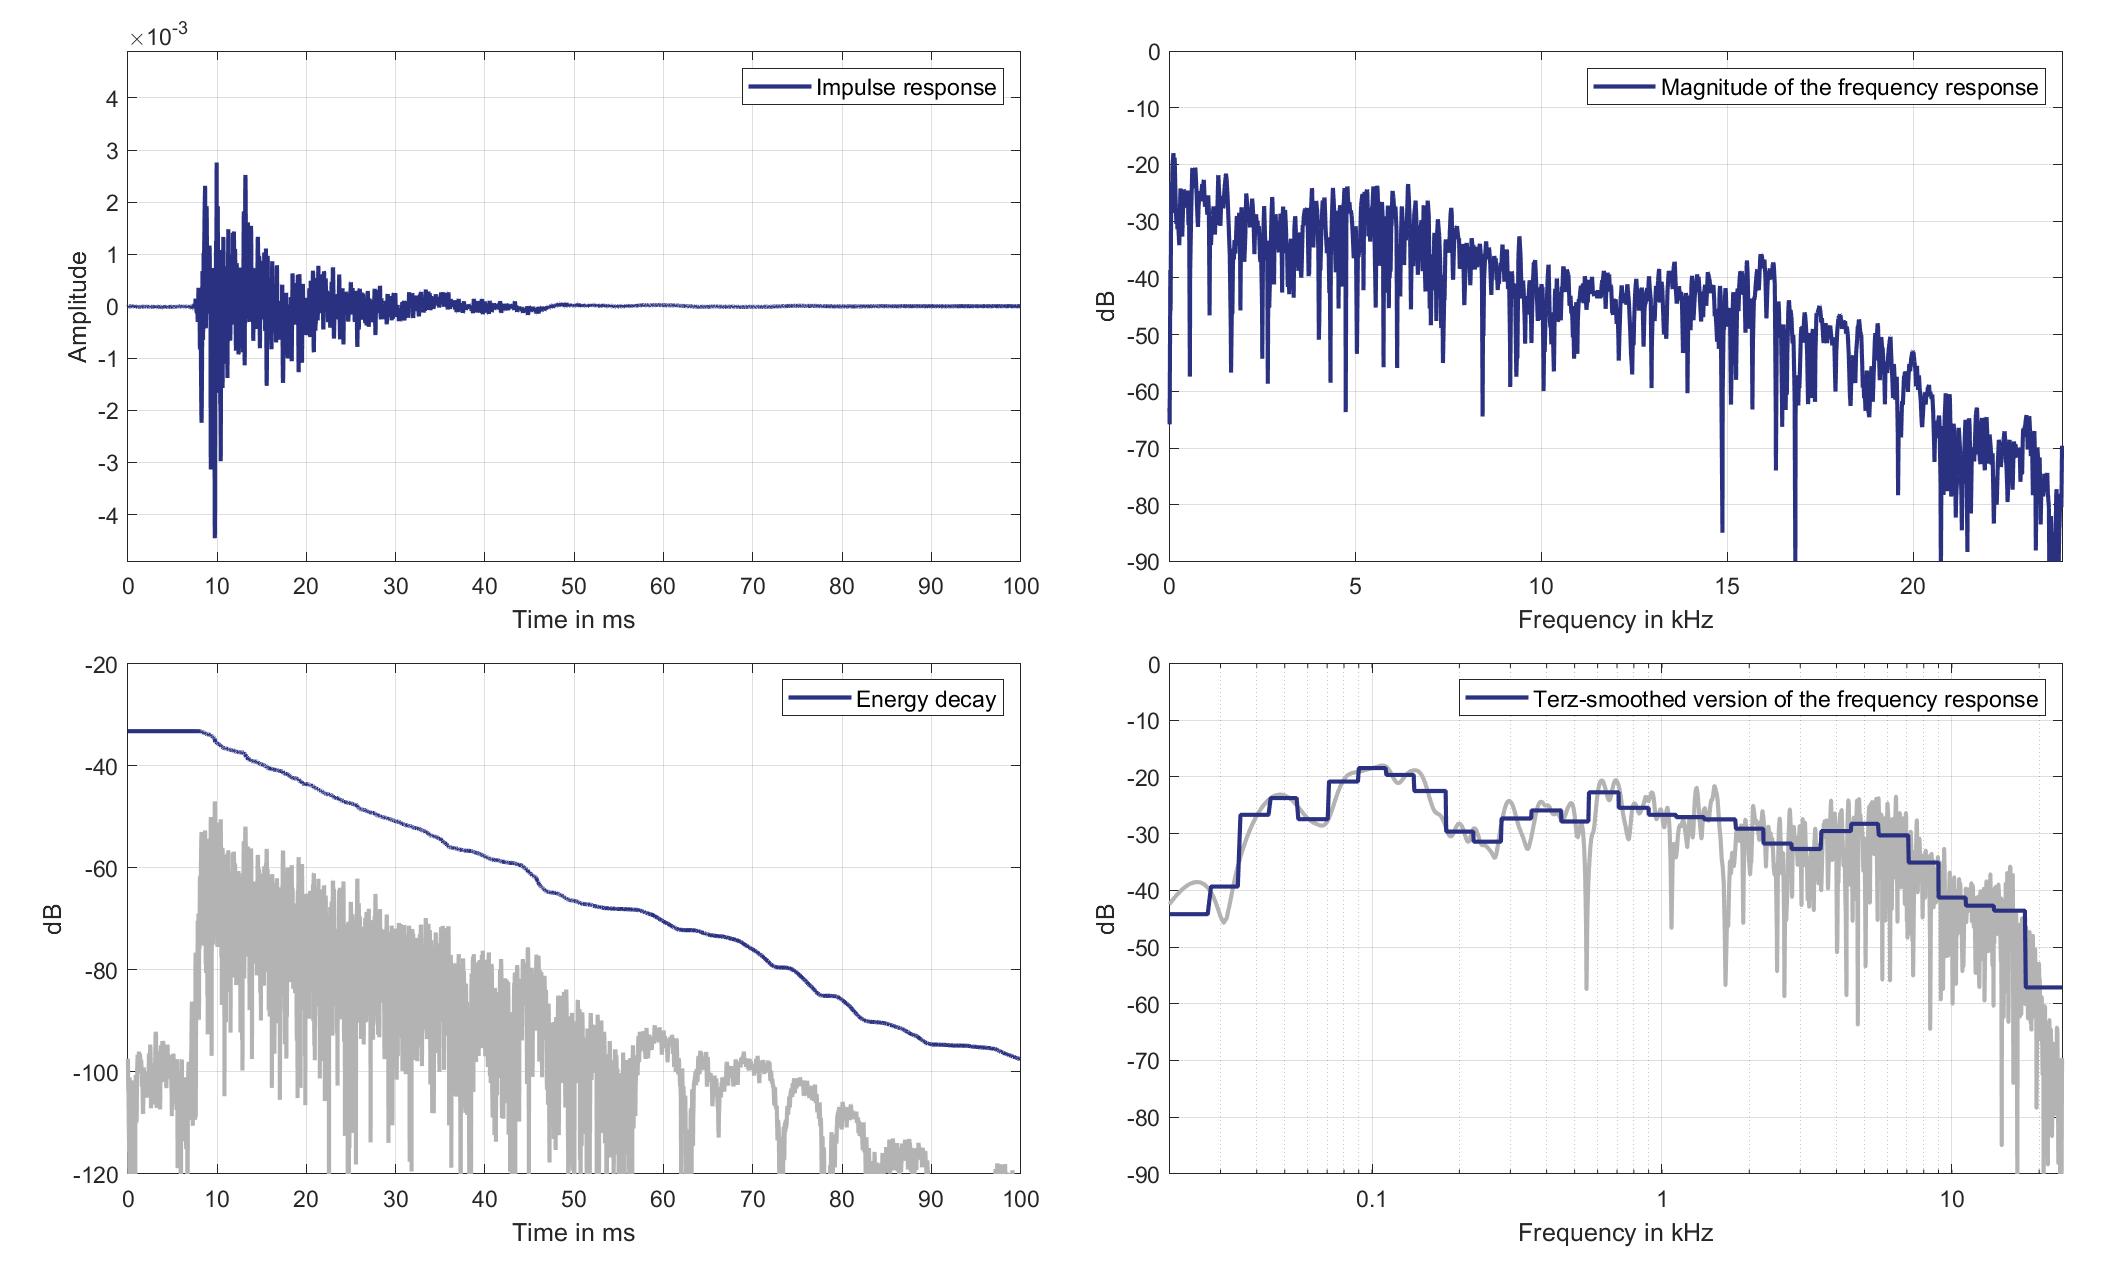
Download impulse response (in ".fir" format).
In the download section you can download all impulse response files as well as format explanation and Matlab as well as Python code examples for loading fir files.
Mic. 1
Standard Car Loudspeaker 1 (Lsp. 19) to Standard Car Microphone 1 (Mic. 1)
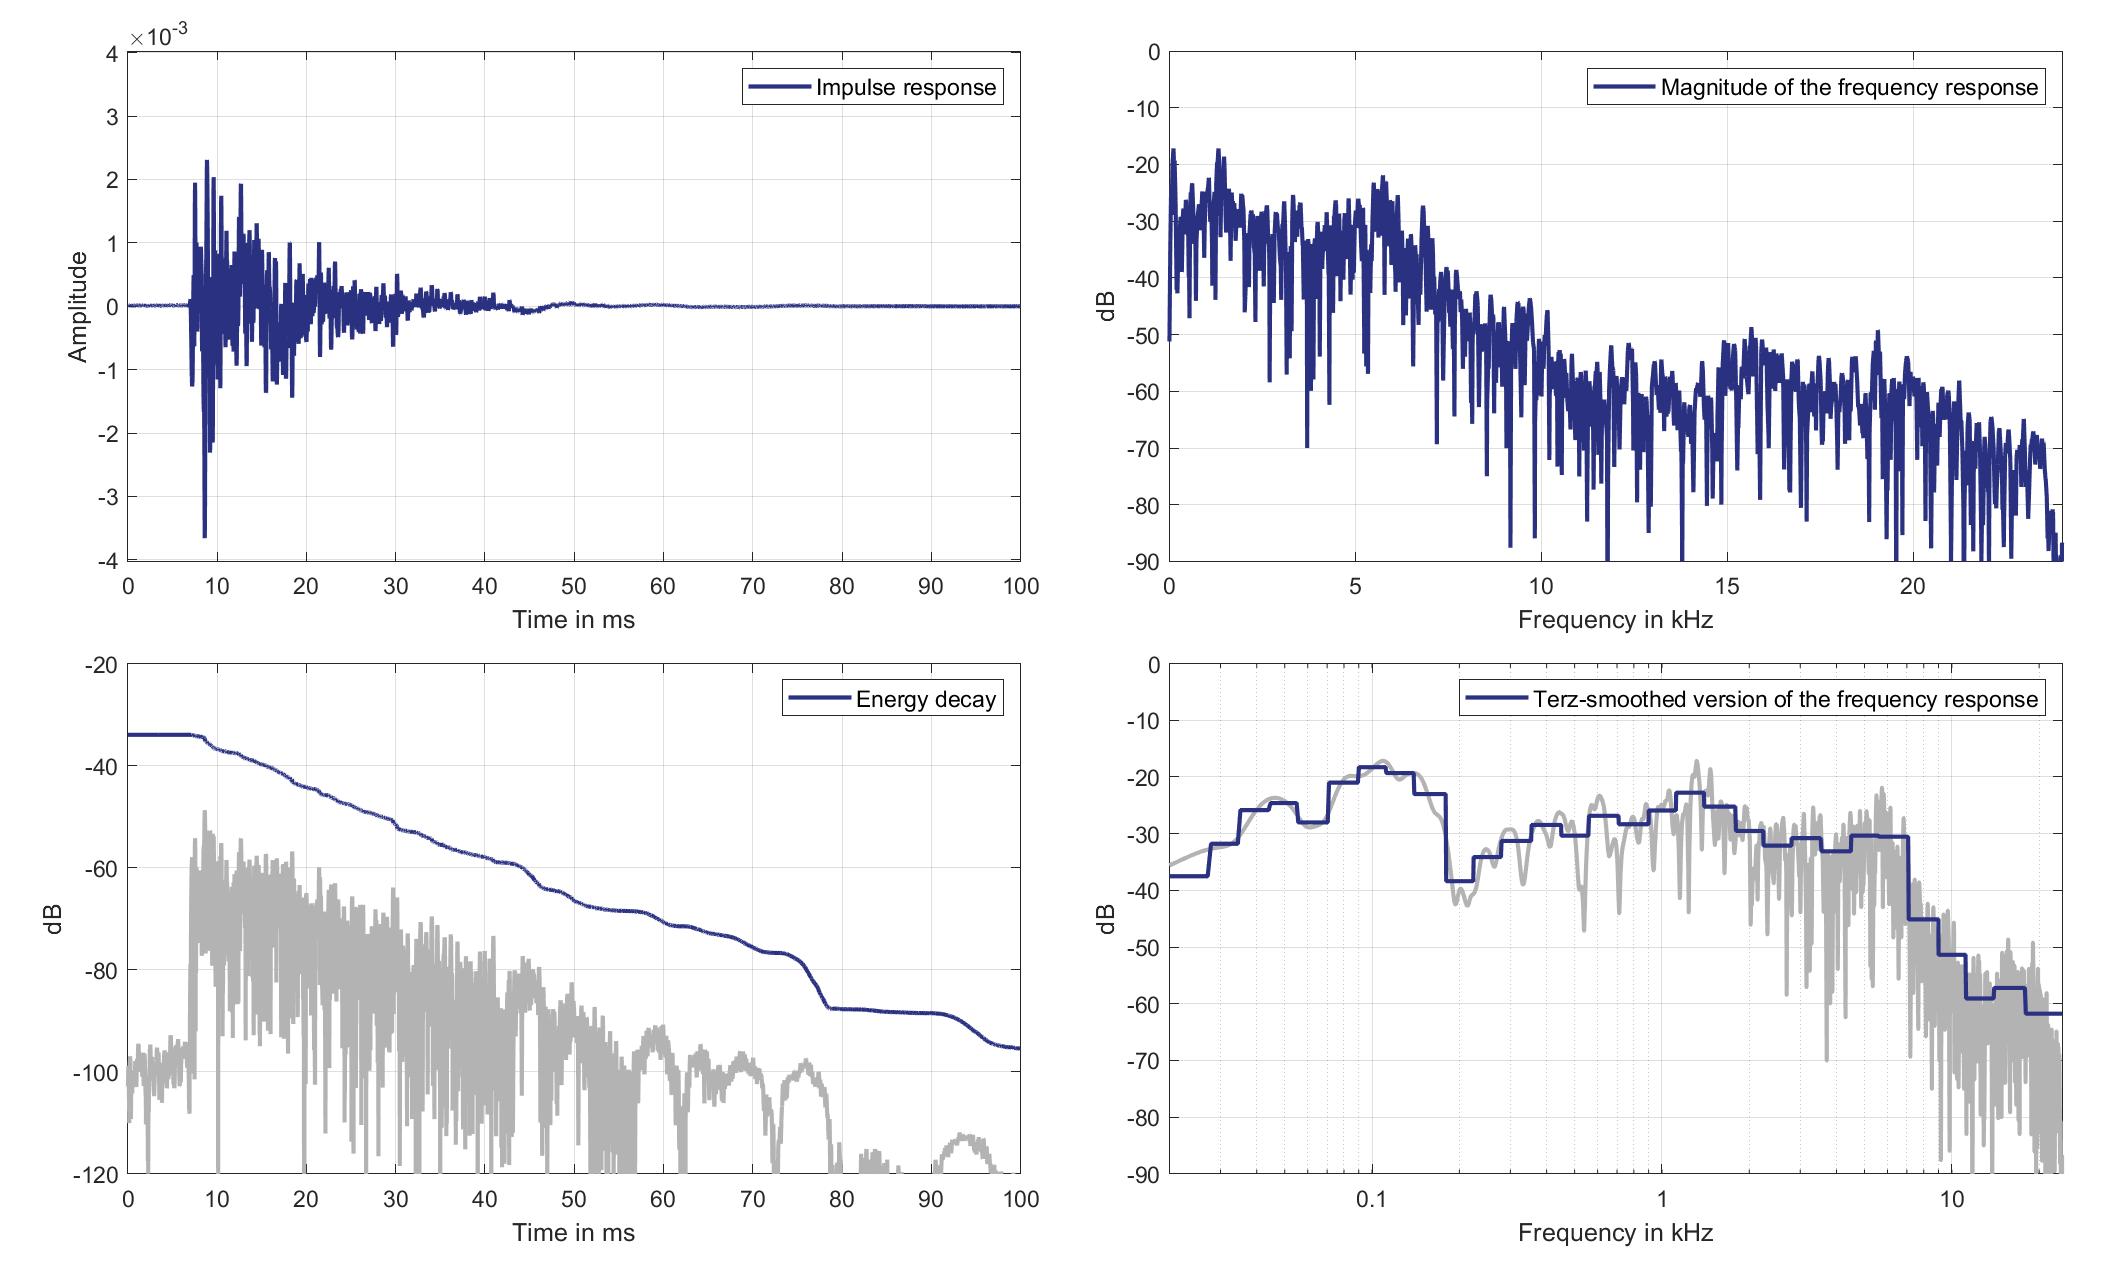
Download impulse response (in ".fir" format).
In the download section you can download all impulse response files as well as format explanation and Matlab as well as Python code examples for loading fir files.
Mic. 2
Standard Car Loudspeaker 1 (Lsp. 19) to Standard Car Microphone 2 (Mic. 2)

Download impulse response (in ".fir" format).
In the download section you can download all impulse response files as well as format explanation and Matlab as well as Python code examples for loading fir files.
Mic. 3
Standard Car Loudspeaker 1 (Lsp. 19) to Standard Car Microphone 3 (Mic. 3)
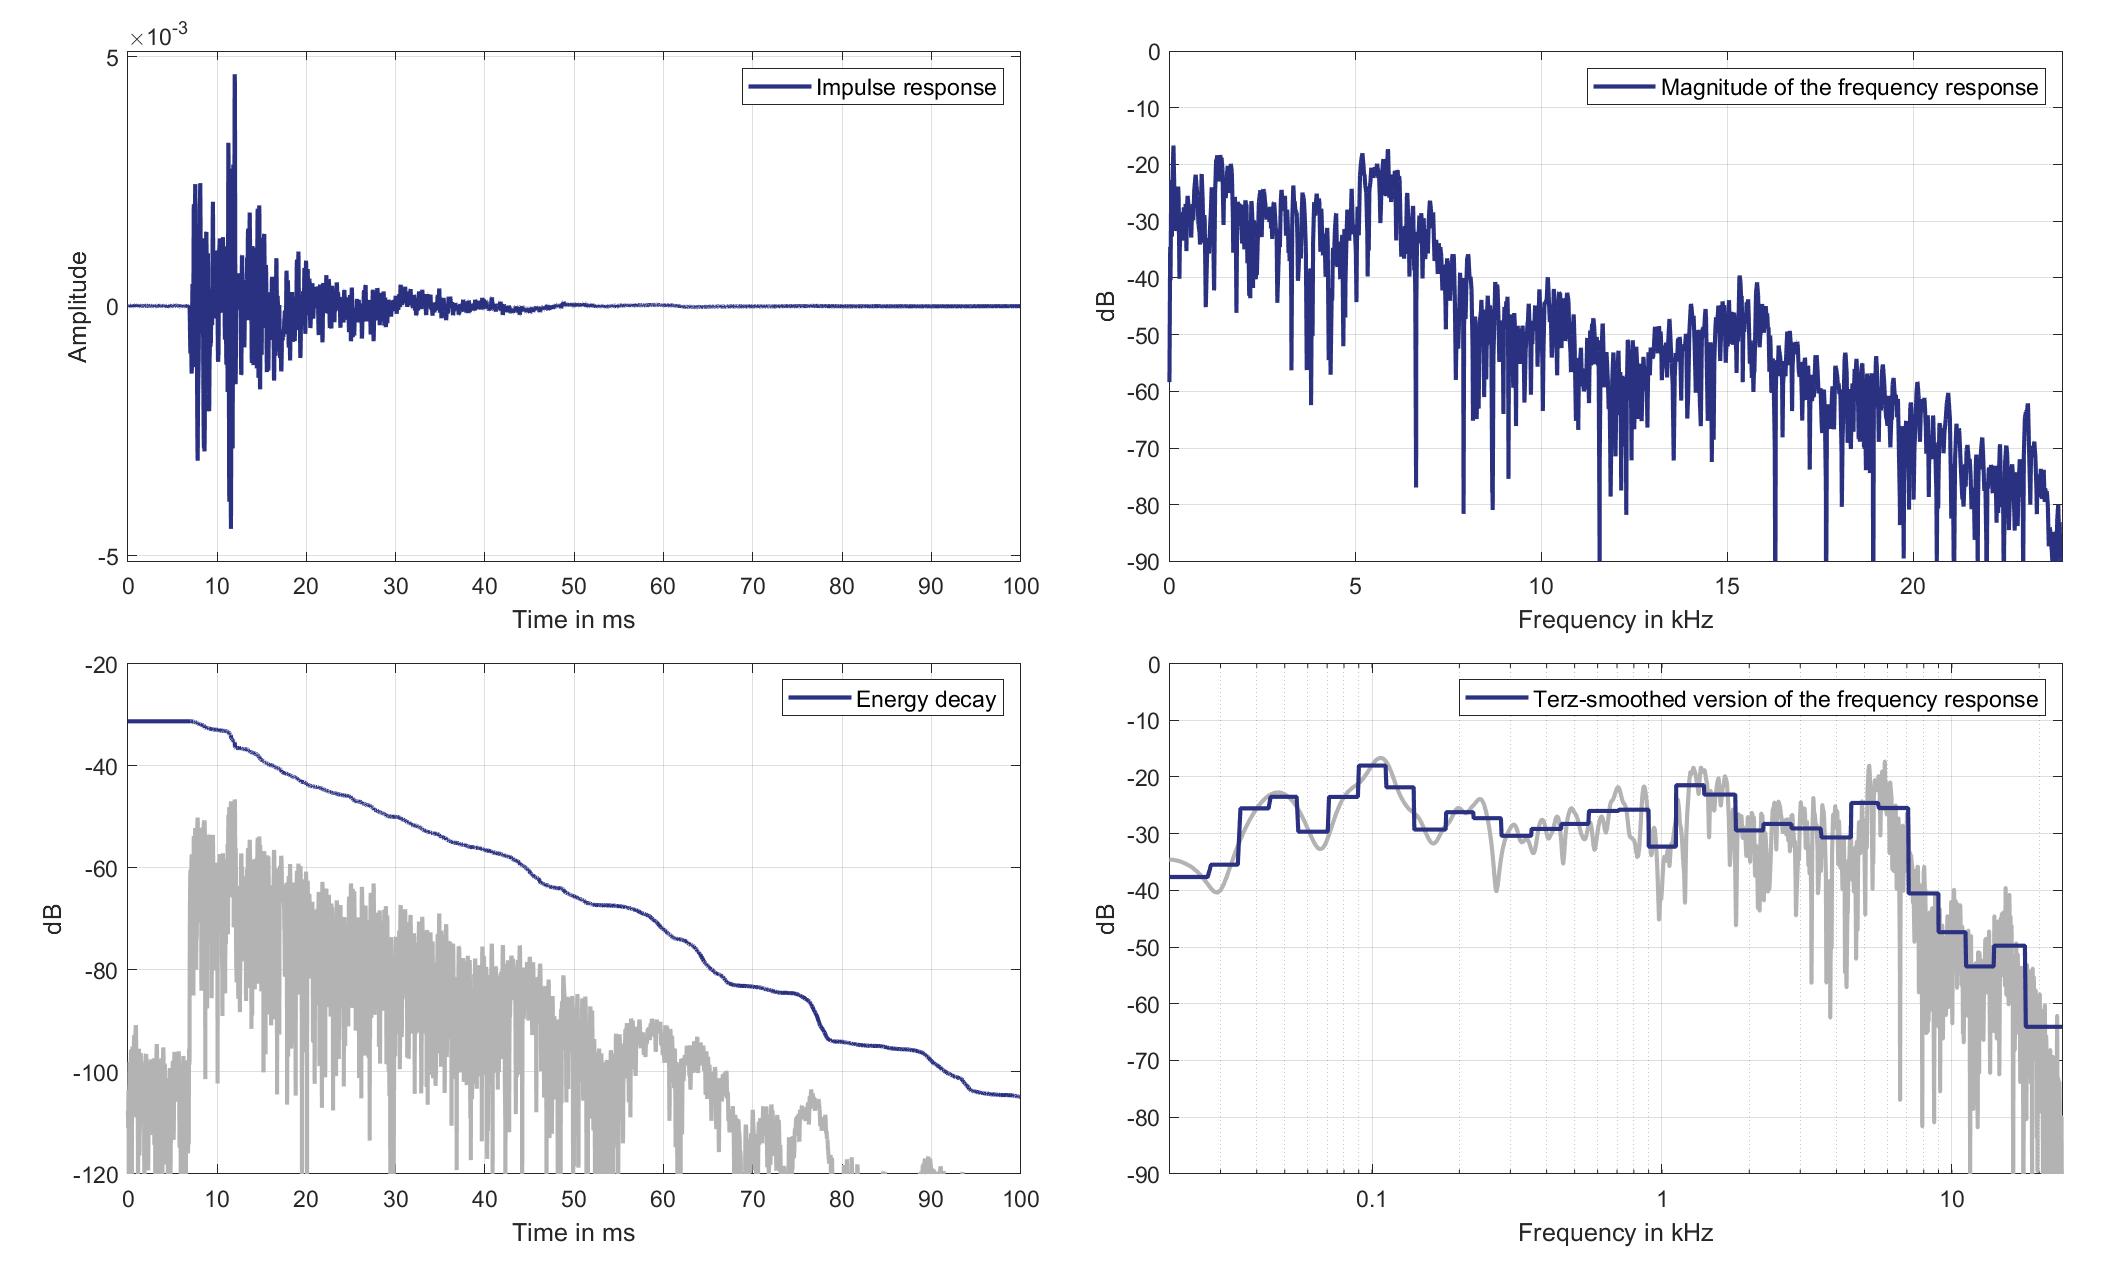
Download impulse response (in ".fir" format).
In the download section you can download all impulse response files as well as format explanation and Matlab as well as Python code examples for loading fir files.
Mic. 4
Standard Car Loudspeaker 1 (Lsp. 19) to Standard Car Microphone 4 (Mic. 4)
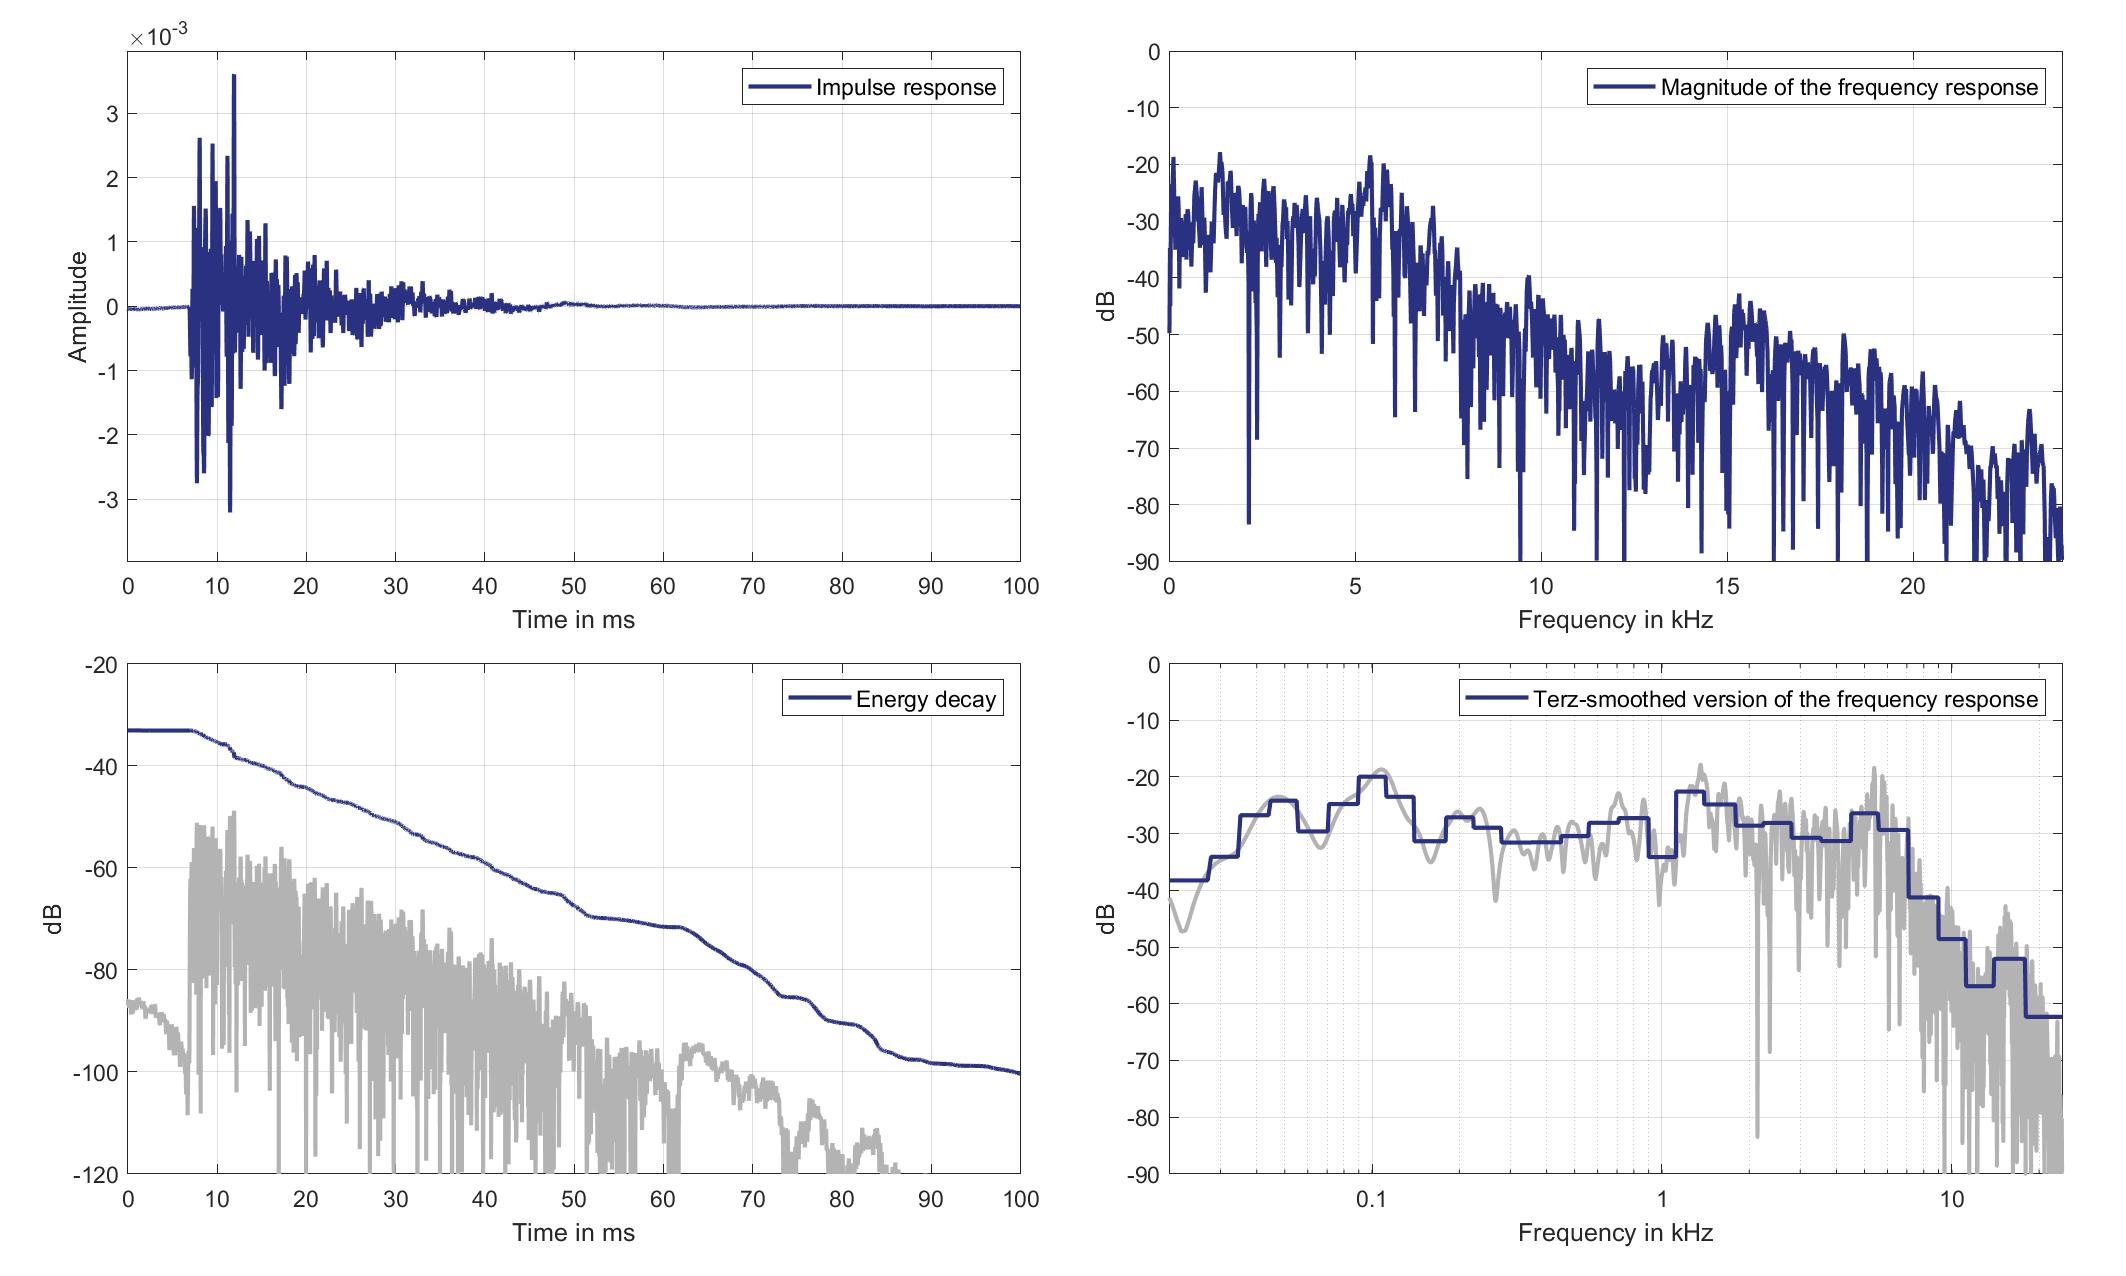
Download impulse response (in ".fir" format).
In the download section you can download all impulse response files as well as format explanation and Matlab as well as Python code examples for loading fir files.
Mic. 5
Standard Car Loudspeaker 1 (Lsp. 19) to Standard Car Microphone 5 (Mic. 5)
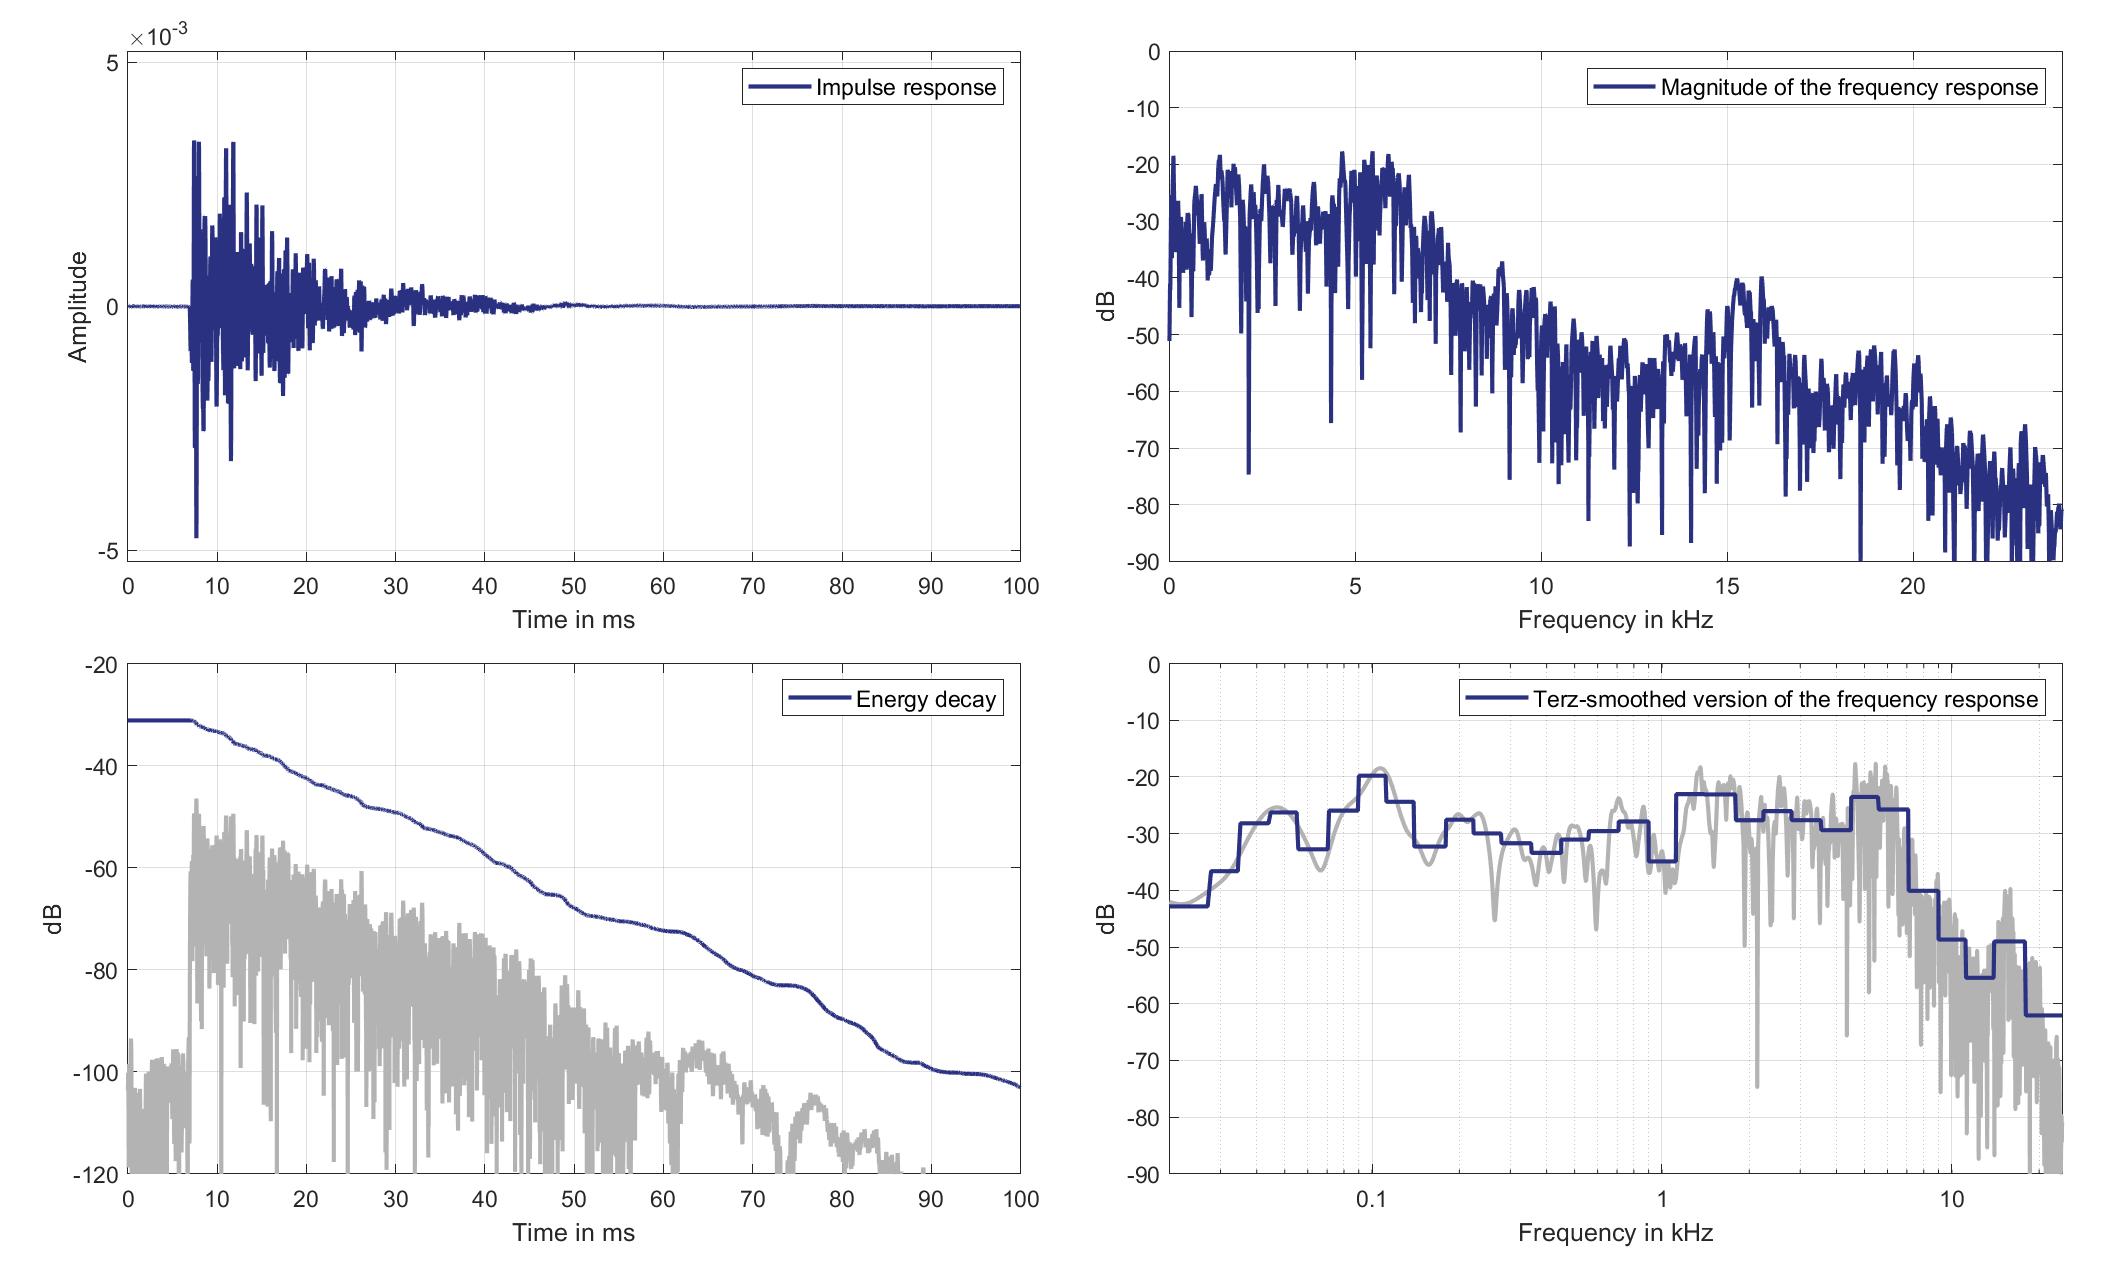
Download impulse response (in ".fir" format).
In the download section you can download all impulse response files as well as format explanation and Matlab as well as Python code examples for loading fir files.
Mic. 6
Standard Car Loudspeaker 1 (Lsp. 19) to Standard Car Microphone 6 (Mic. 6)
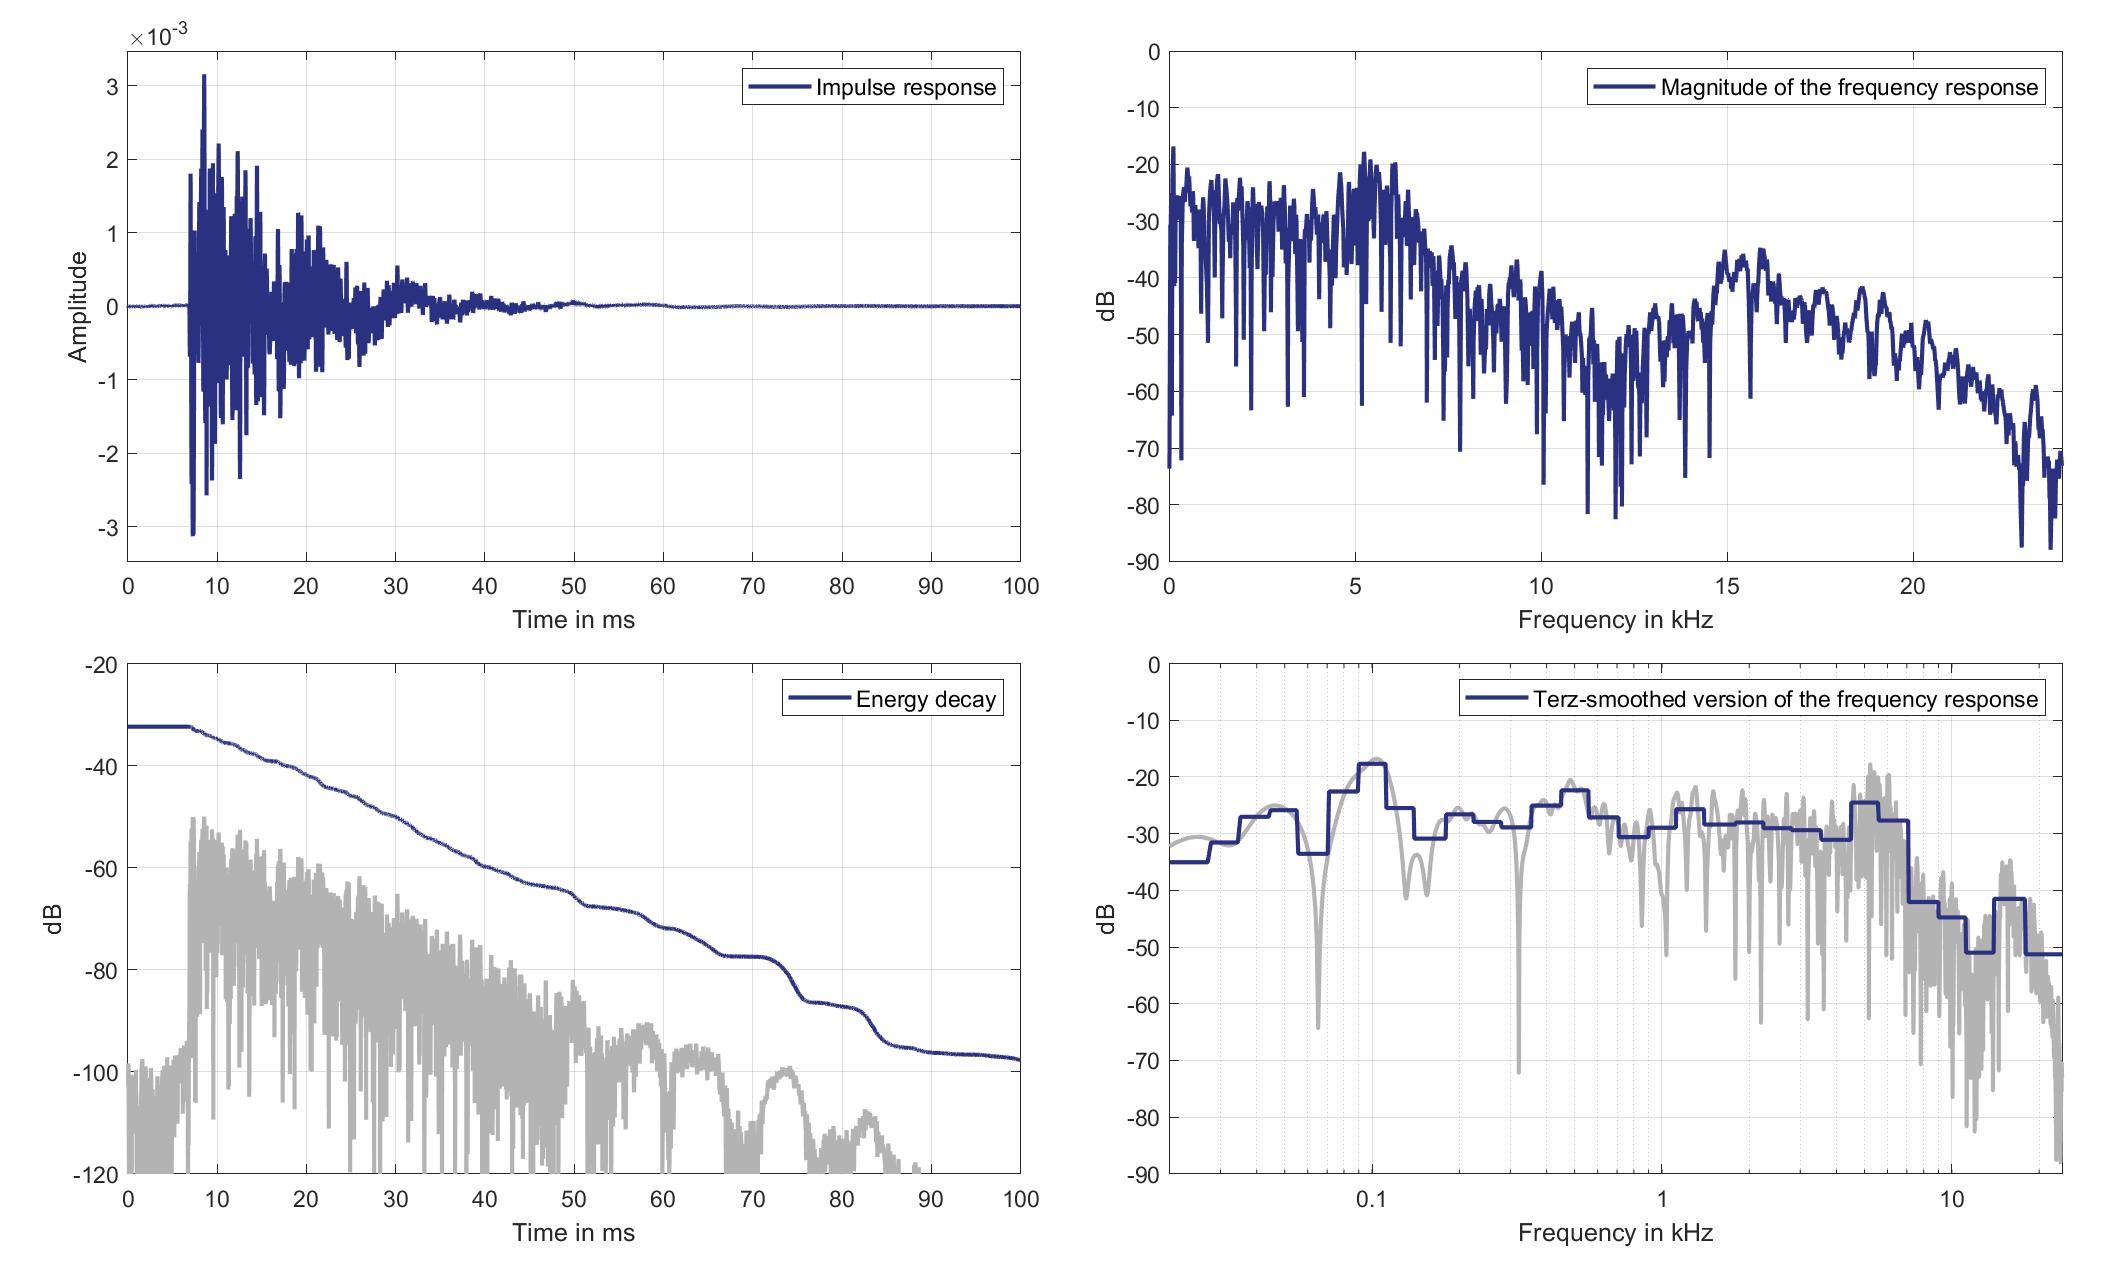
Download impulse response (in ".fir" format).
In the download section you can download all impulse response files as well as format explanation and Matlab as well as Python code examples for loading fir files.
Mic. 7
Standard Car Loudspeaker 1 (Lsp. 19) to Standard Car Microphone 7 (Mic. 7)
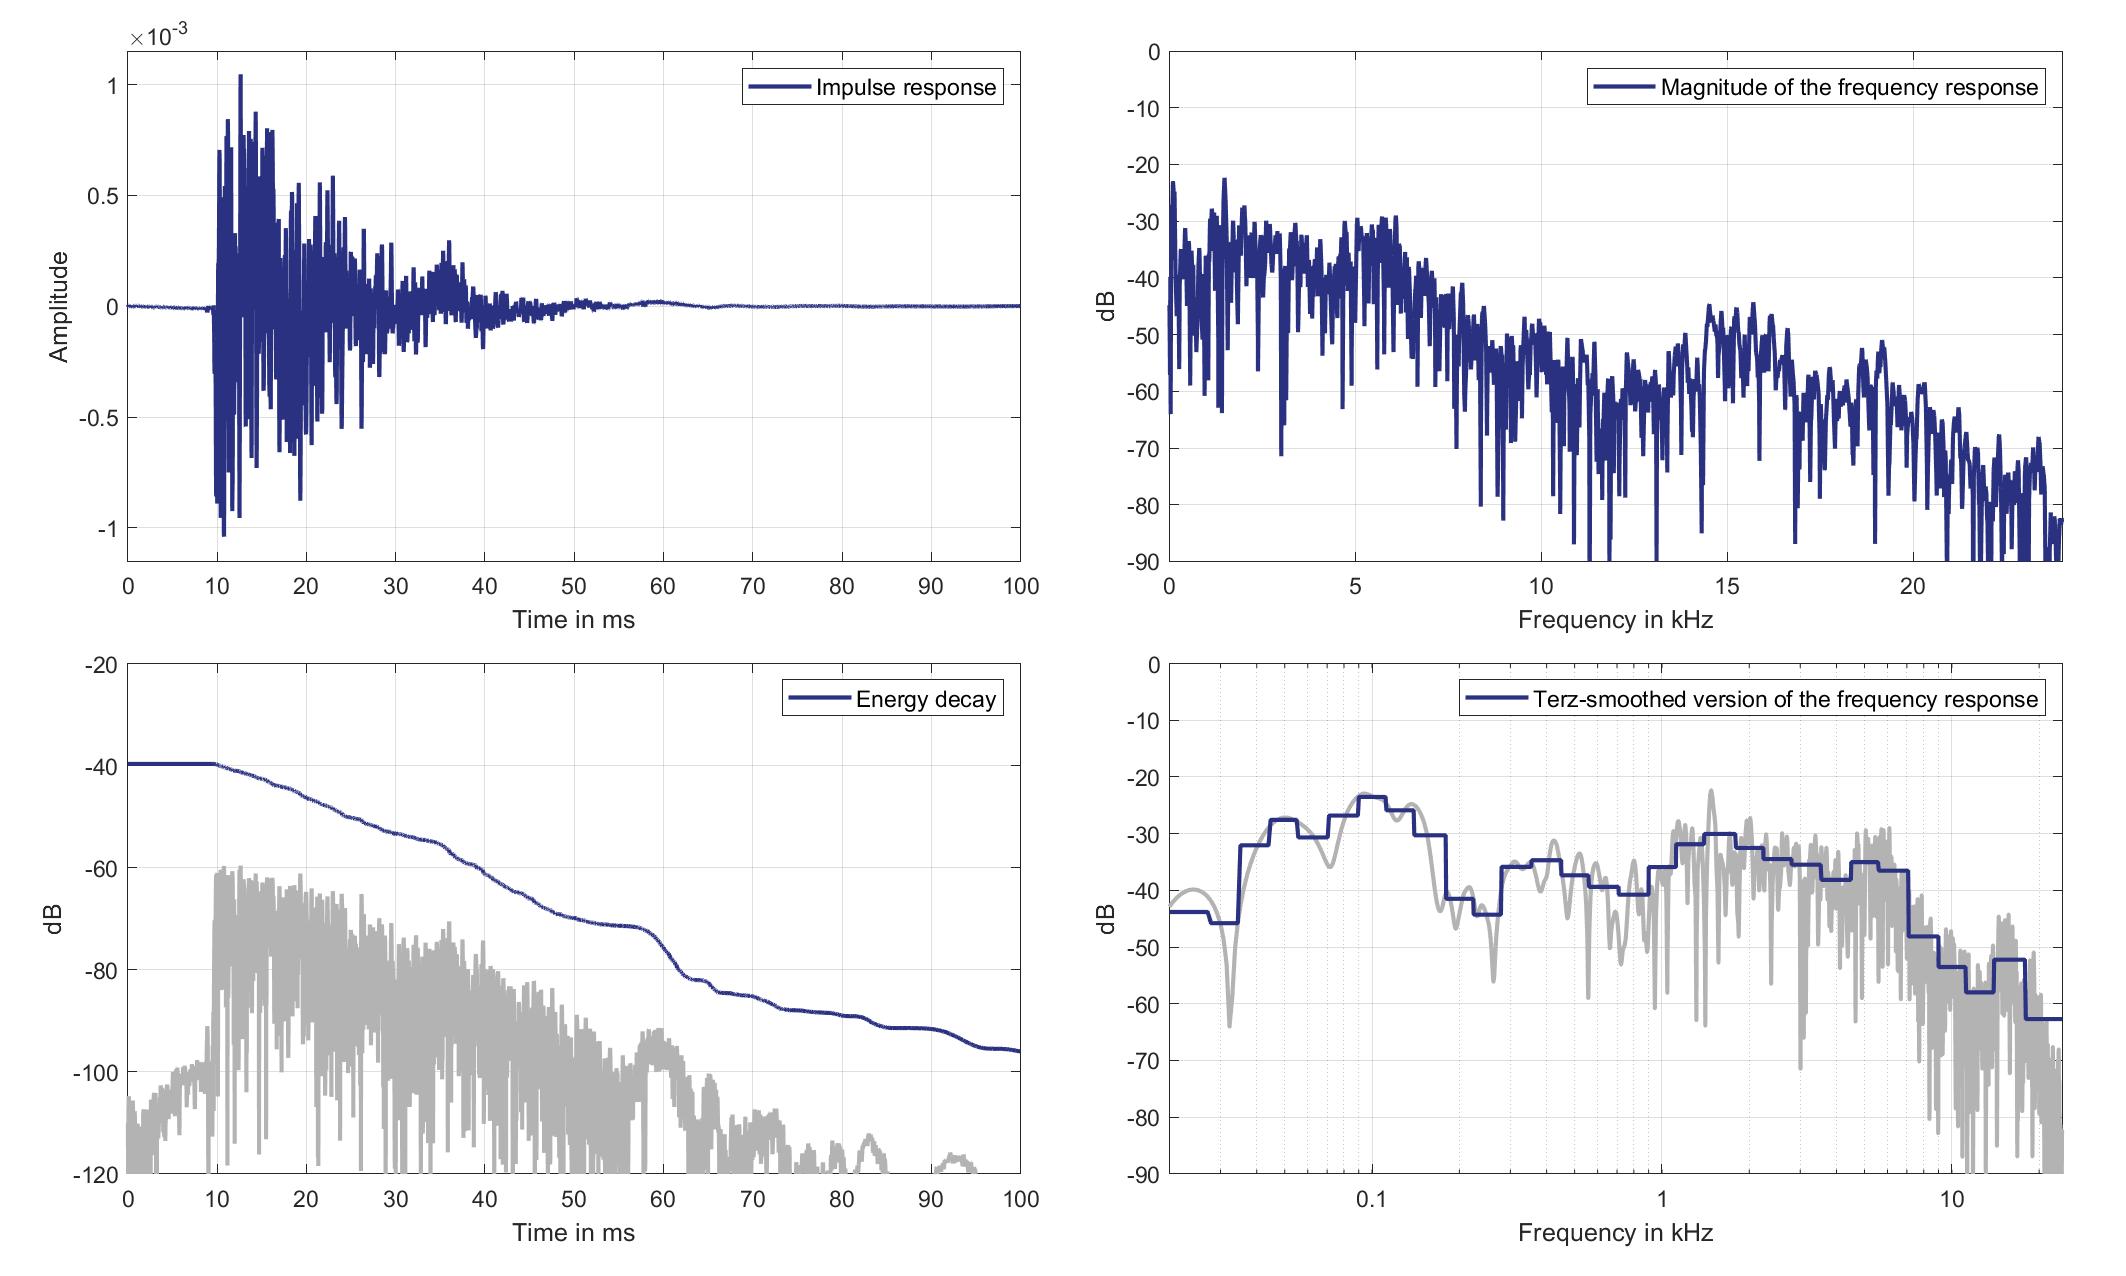
Download impulse response (in ".fir" format).
In the download section you can download all impulse response files as well as format explanation and Matlab as well as Python code examples for loading fir files.
Mic. 8
Standard Car Loudspeaker 1 (Lsp. 19) to Standard Car Microphone 8 (Mic. 8)
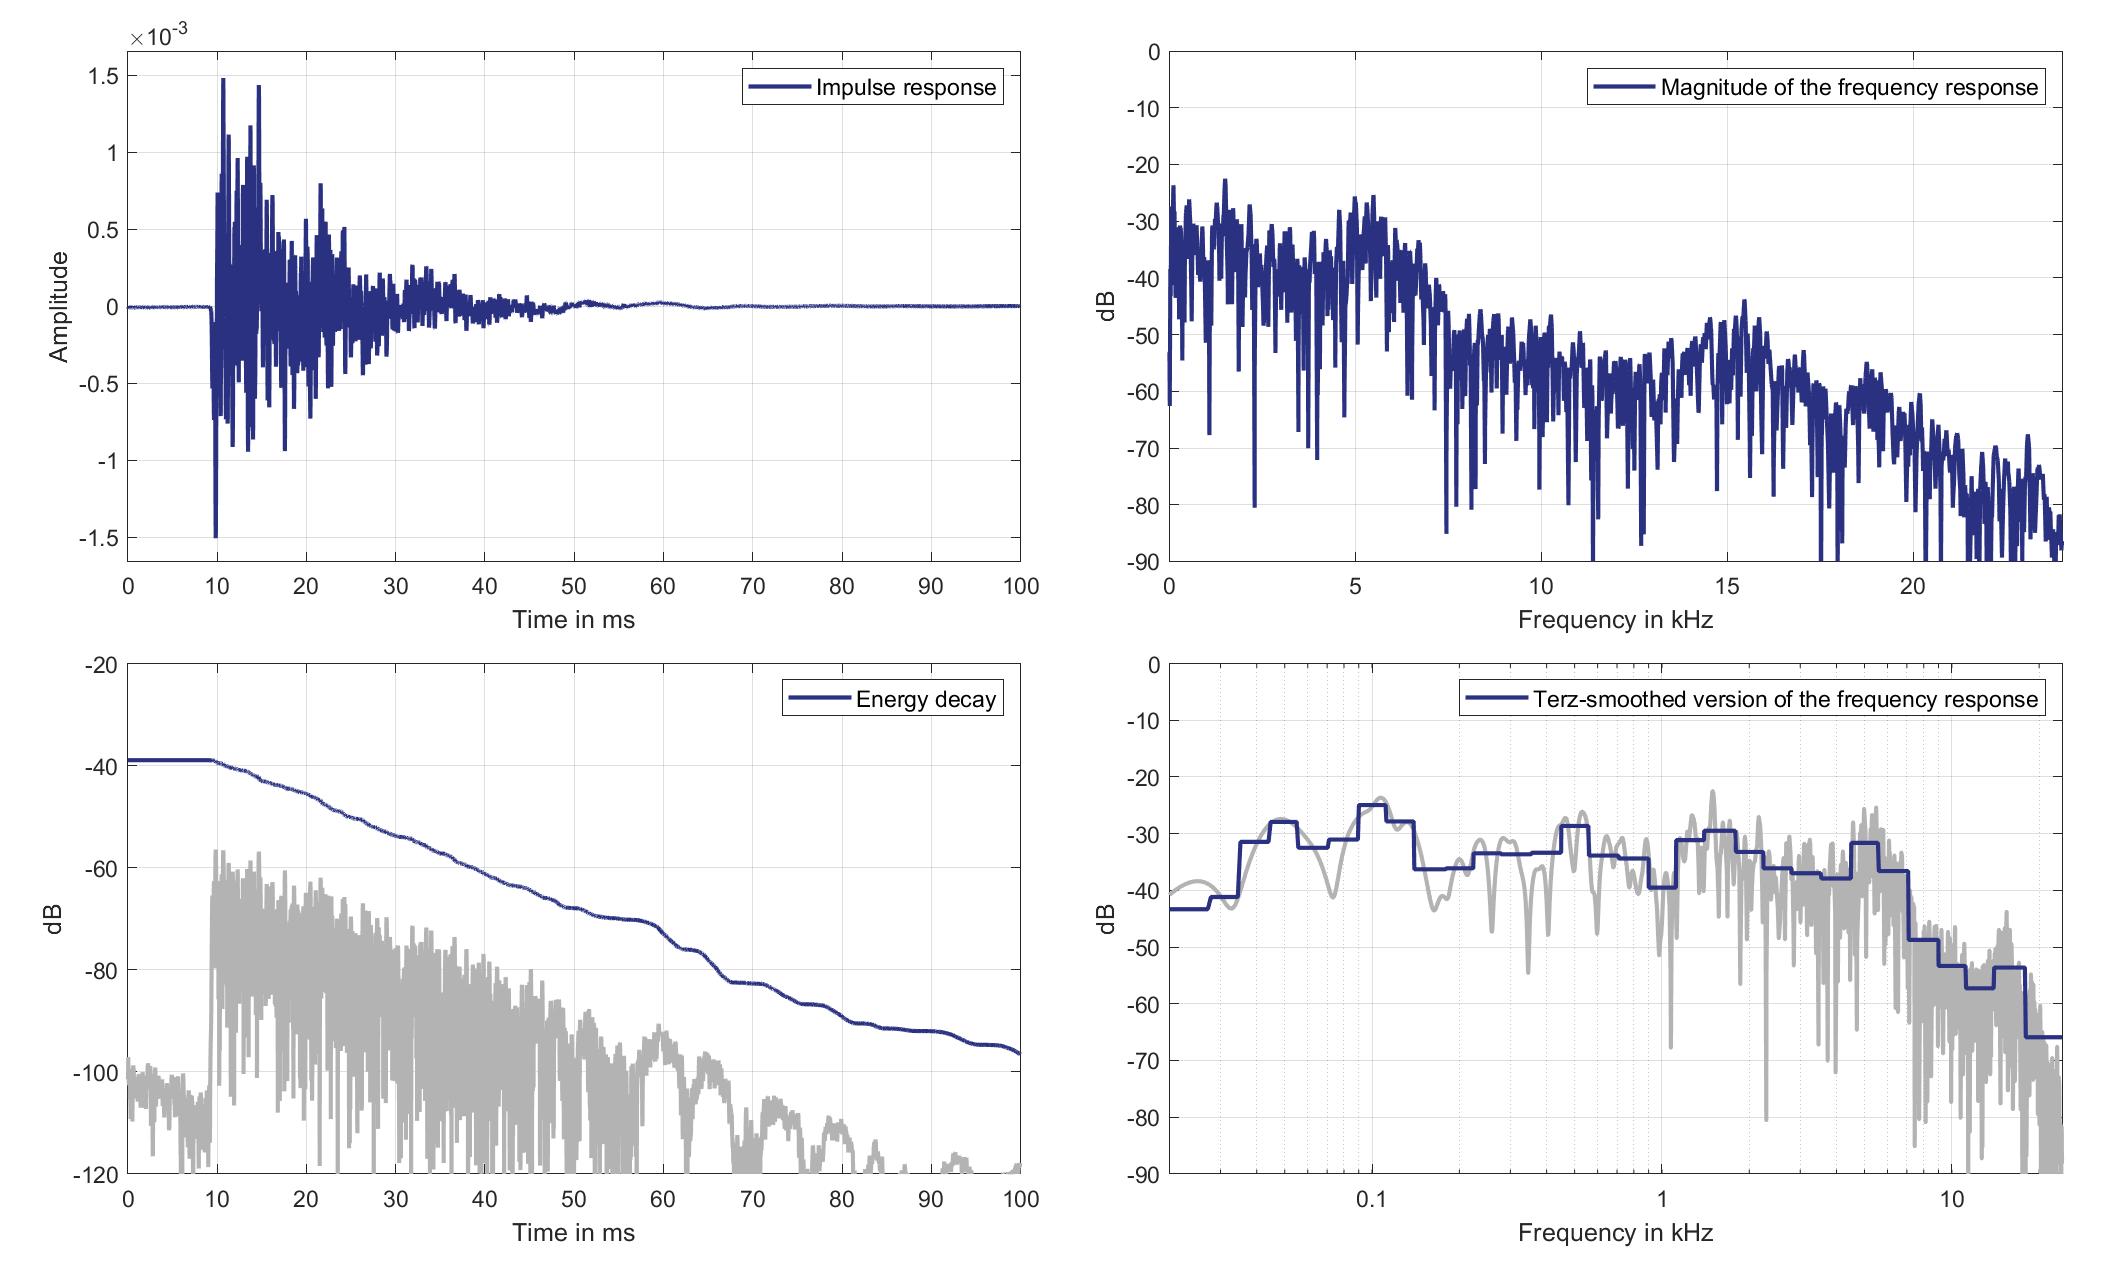
Download impulse response (in ".fir" format).
In the download section you can download all impulse response files as well as format explanation and Matlab as well as Python code examples for loading fir files.
Mic. 9
Standard Car Loudspeaker 1 (Lsp. 19) to Standard Car Microphone 9 (Mic. 9)
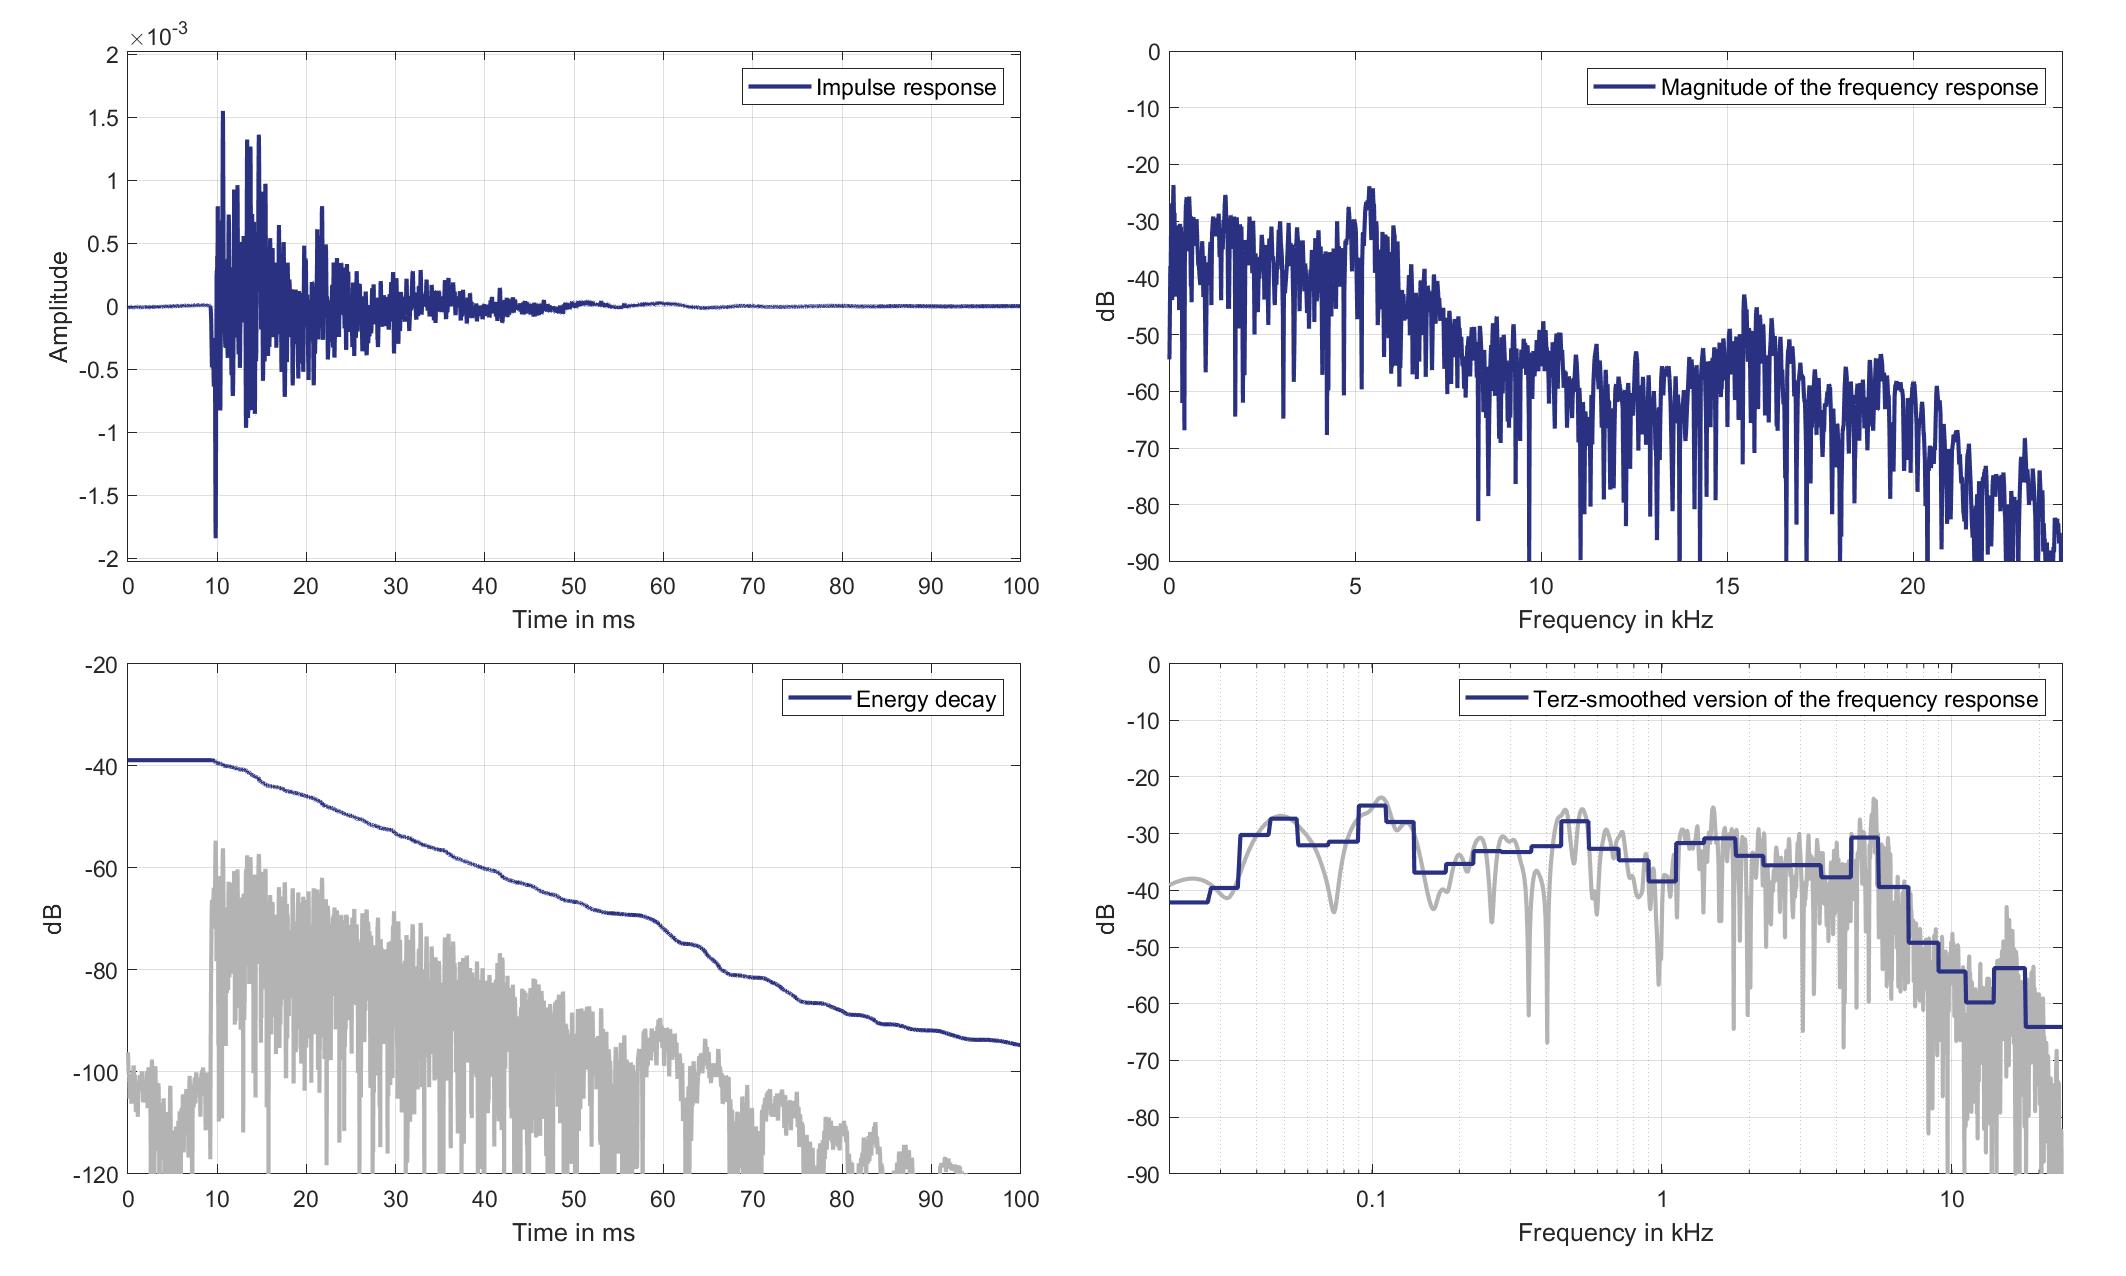
Download impulse response (in ".fir" format).
In the download section you can download all impulse response files as well as format explanation and Matlab as well as Python code examples for loading fir files.
Mic. 10
Standard Car Loudspeaker 1 (Lsp. 19) to Standard Car Microphone 10 (Mic. 10)
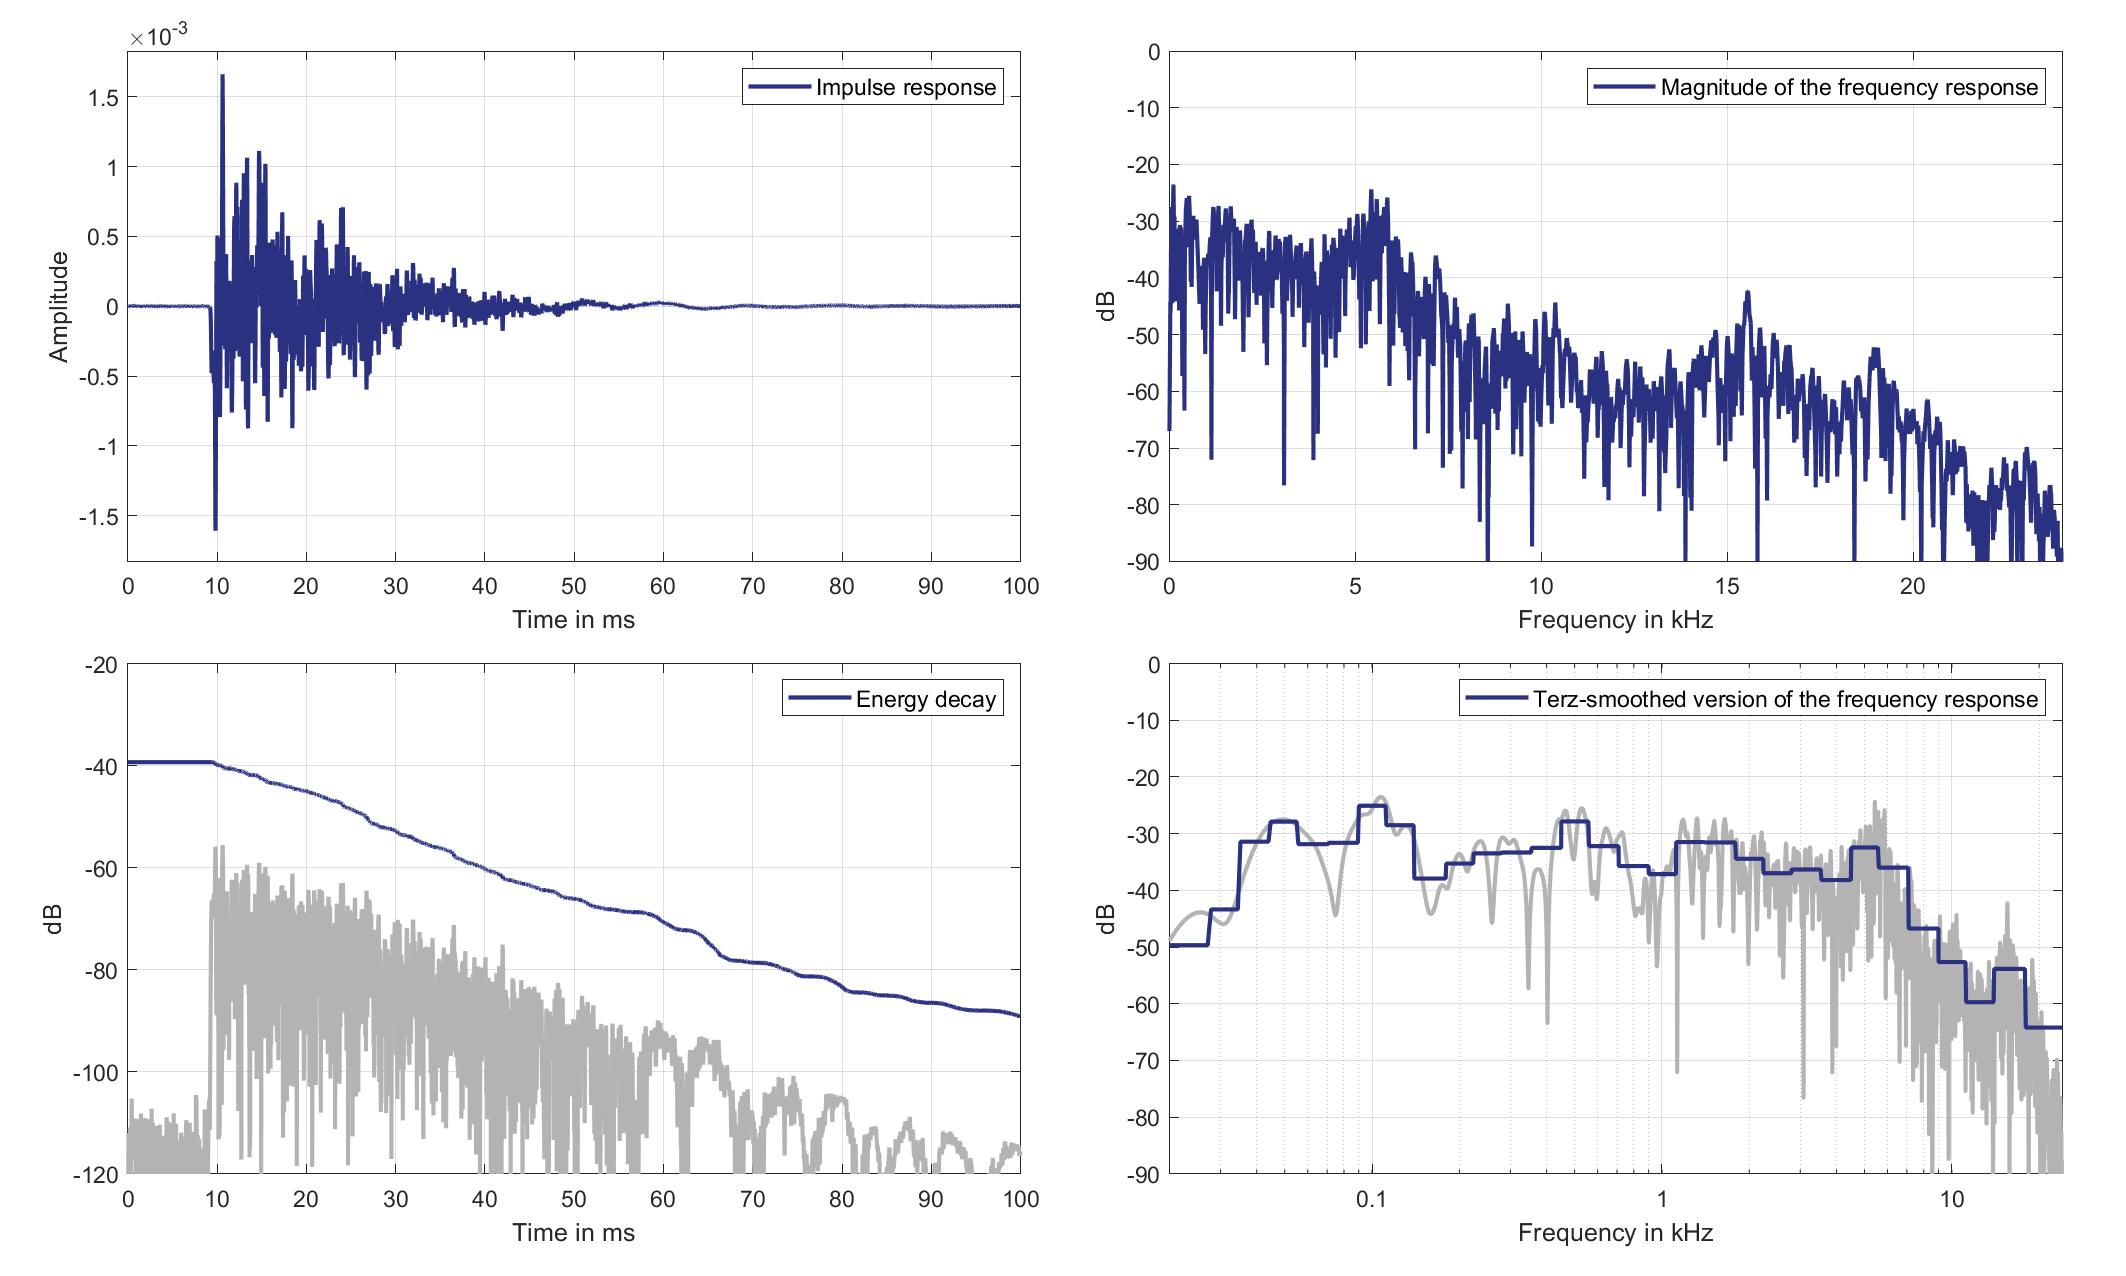
Download impulse response (in ".fir" format).
In the download section you can download all impulse response files as well as format explanation and Matlab as well as Python code examples for loading fir files.
Mic. 11
Standard Car Loudspeaker 1 (Lsp. 19) to Standard Car Microphone 11 (Mic. 11)
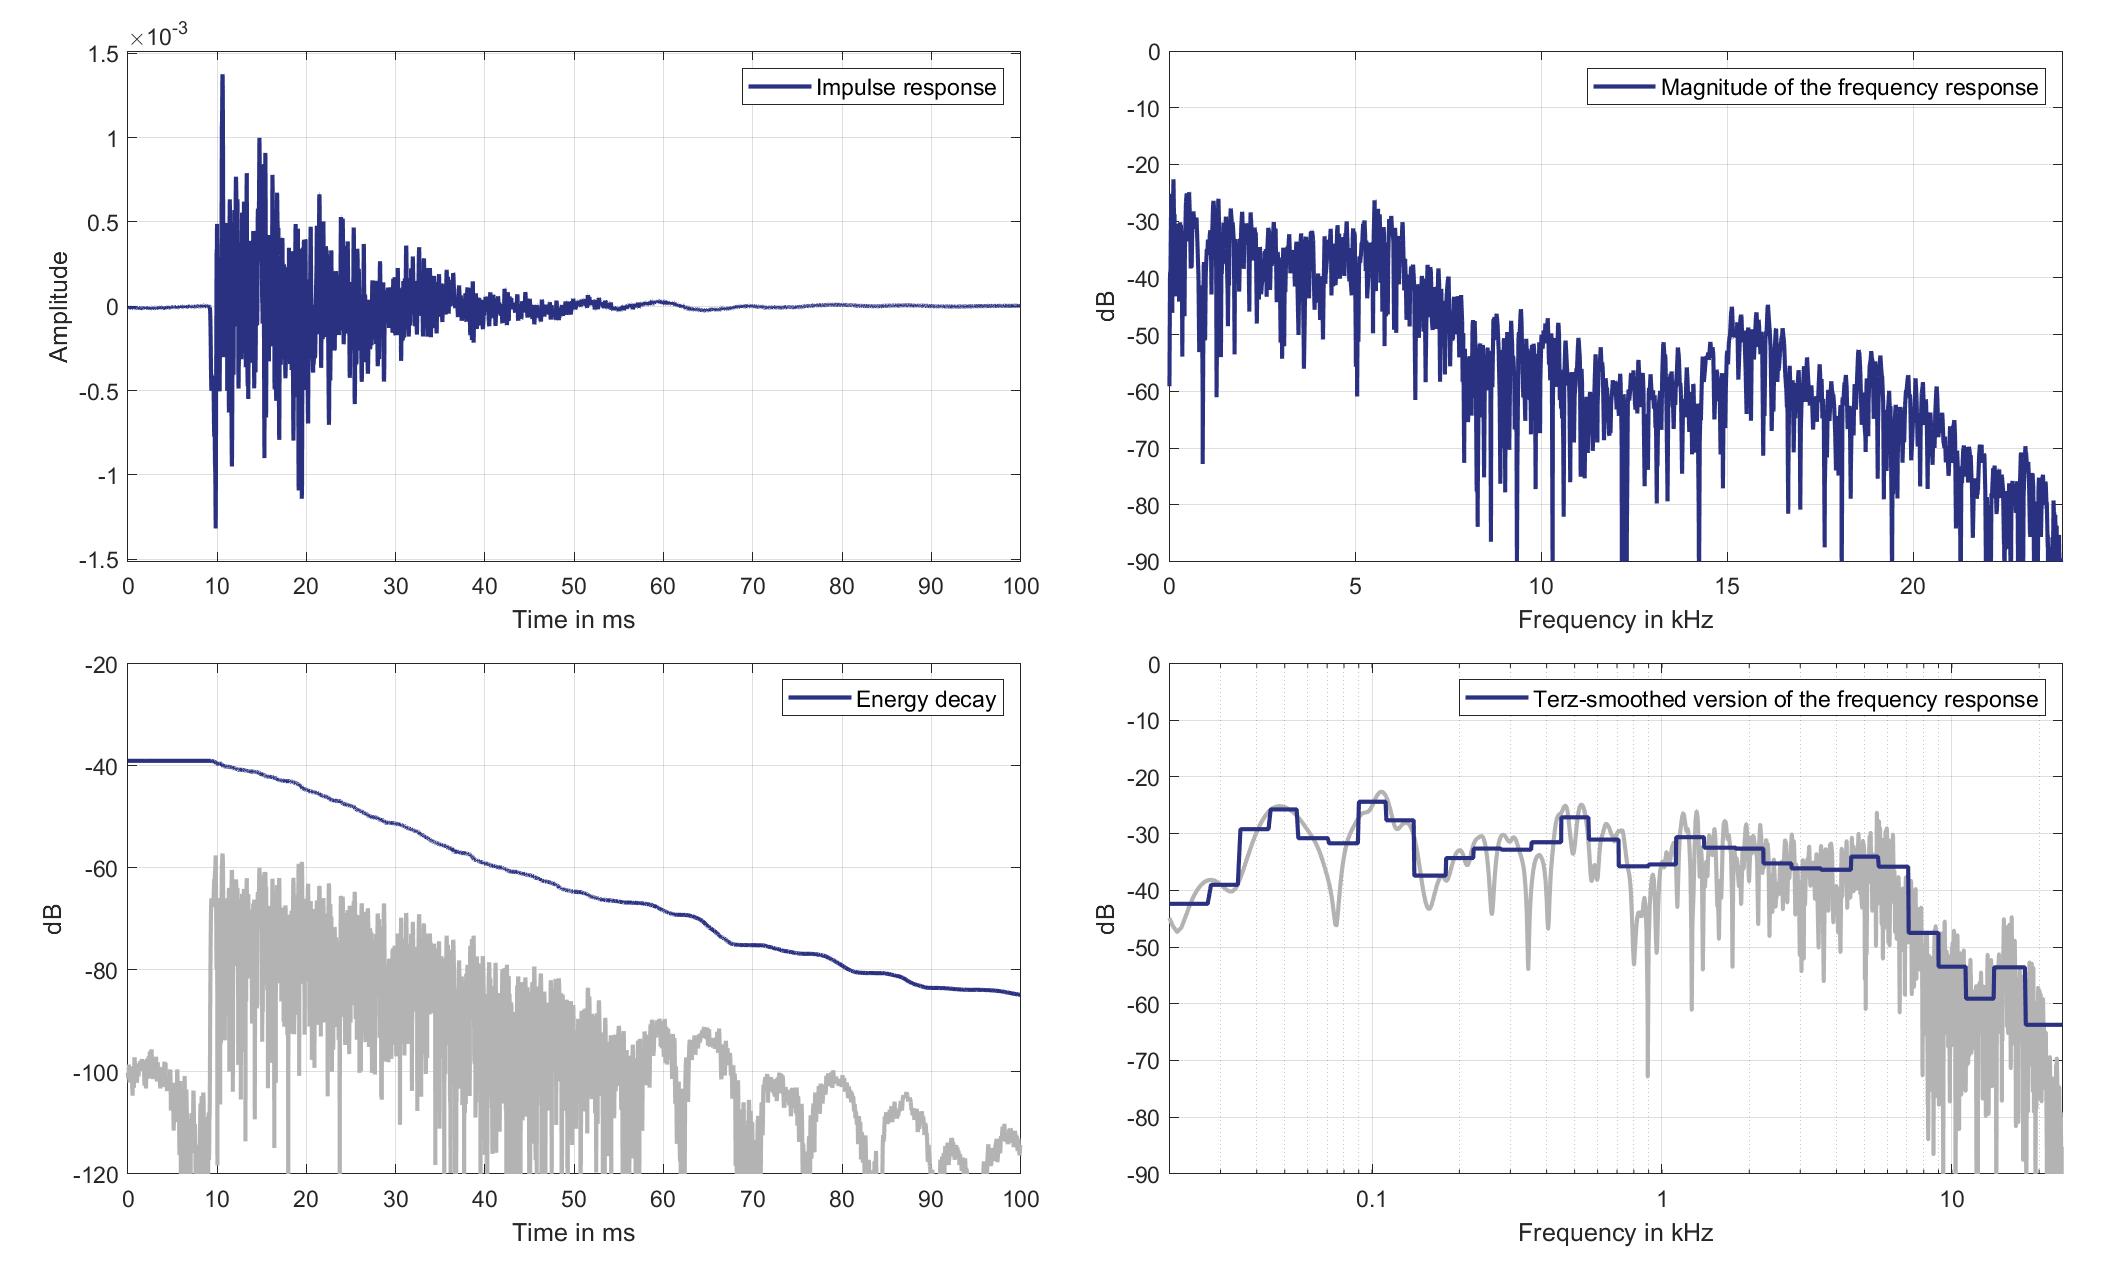
Download impulse response (in ".fir" format).
In the download section you can download all impulse response files as well as format explanation and Matlab as well as Python code examples for loading fir files.
Mic. 12
Standard Car Loudspeaker 1 (Lsp. 19) to Standard Car Microphone 12 (Mic. 12)
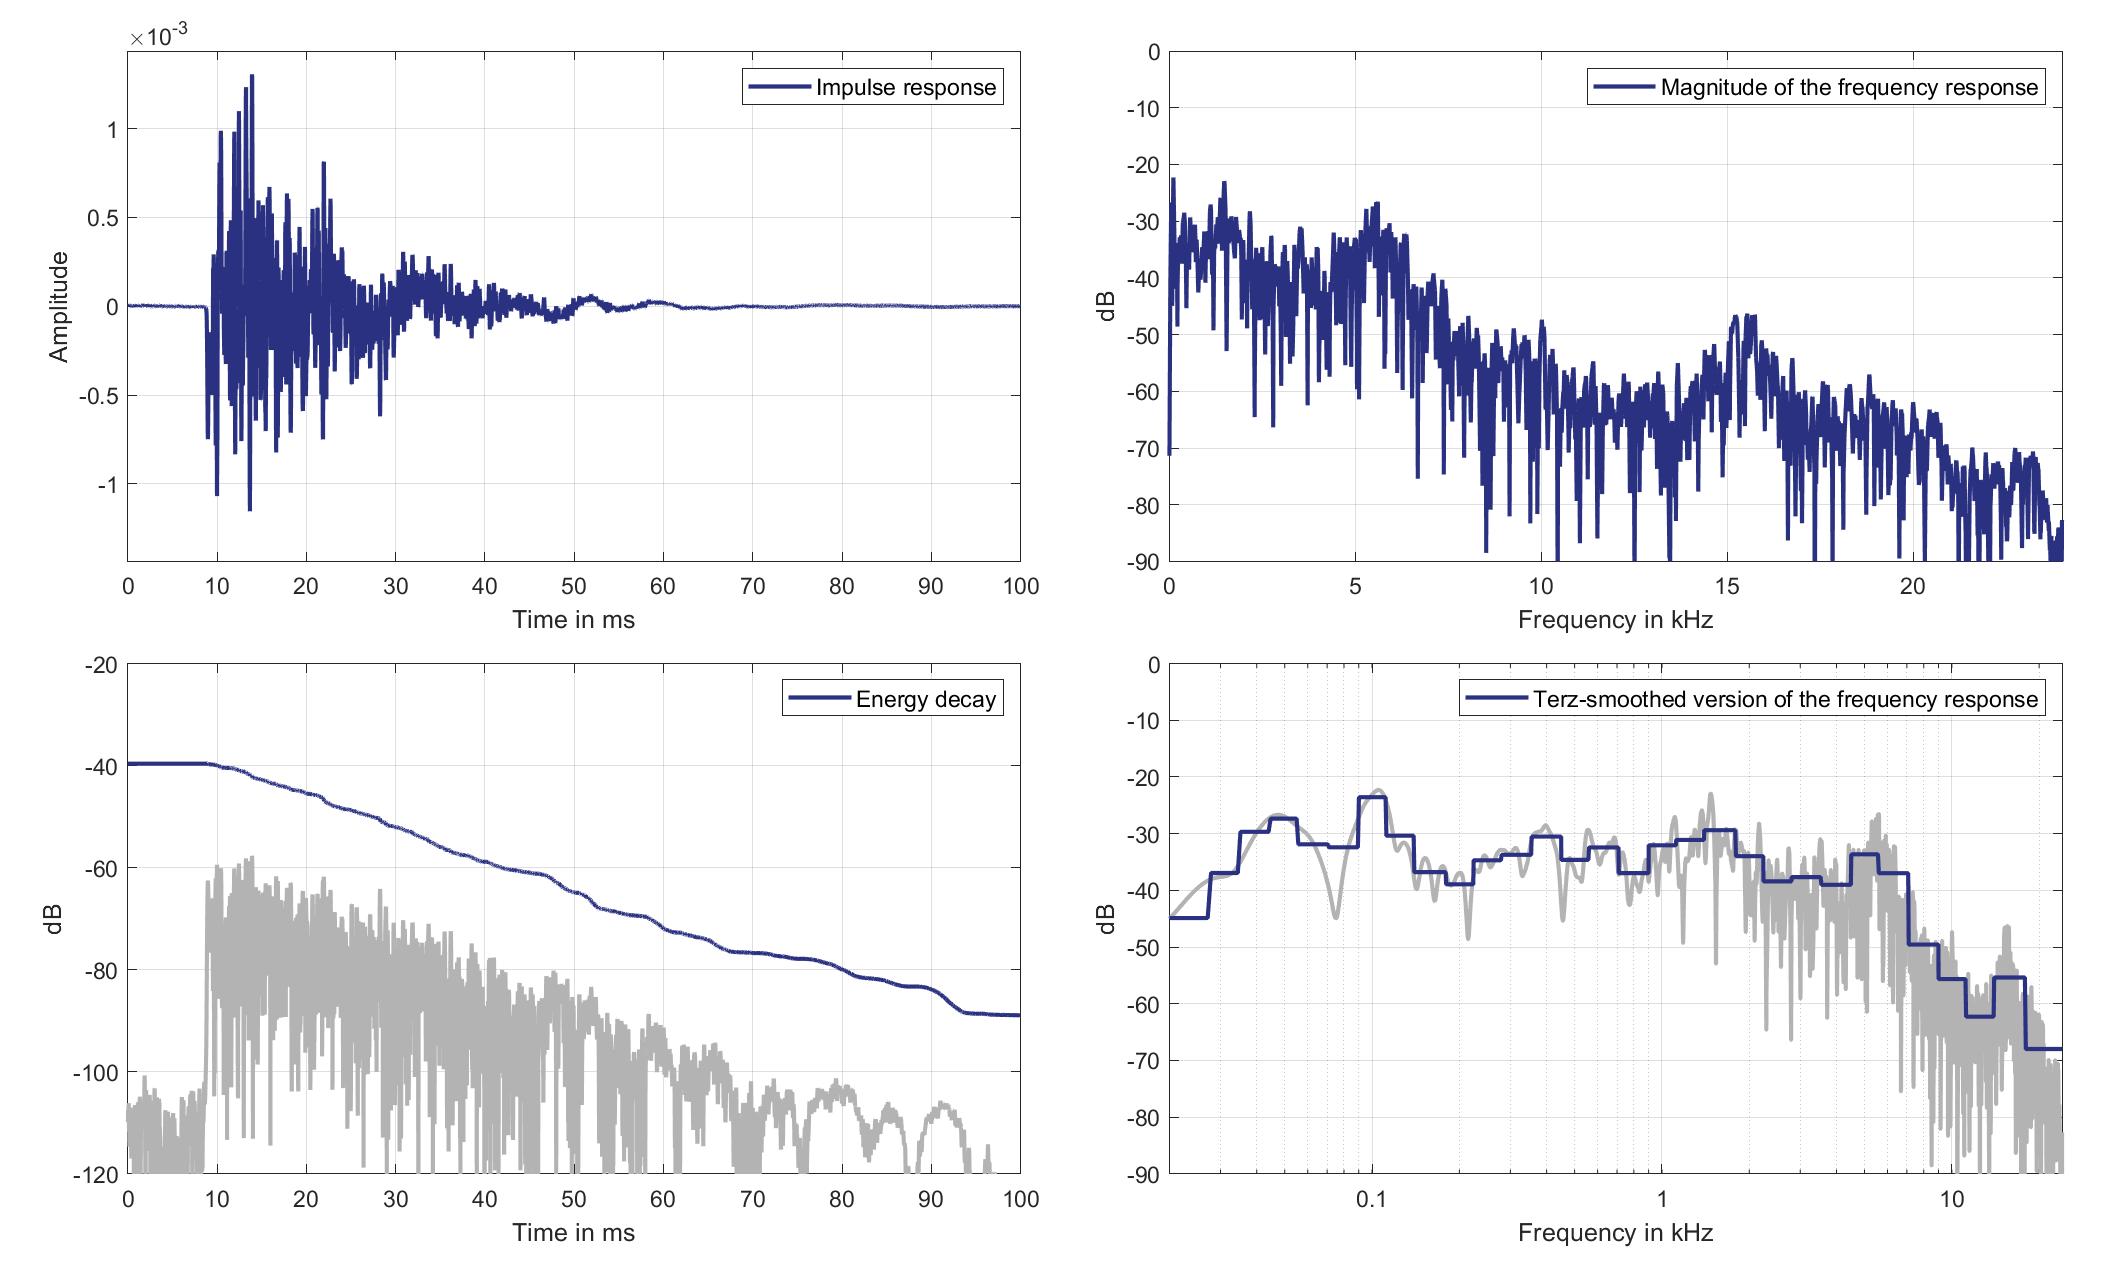
Download impulse response (in ".fir" format).
In the download section you can download all impulse response files as well as format explanation and Matlab as well as Python code examples for loading fir files.
Mic. 13
Standard Car Loudspeaker 1 (Lsp. 19) to Standard Car Microphone 13 (Mic. 13)
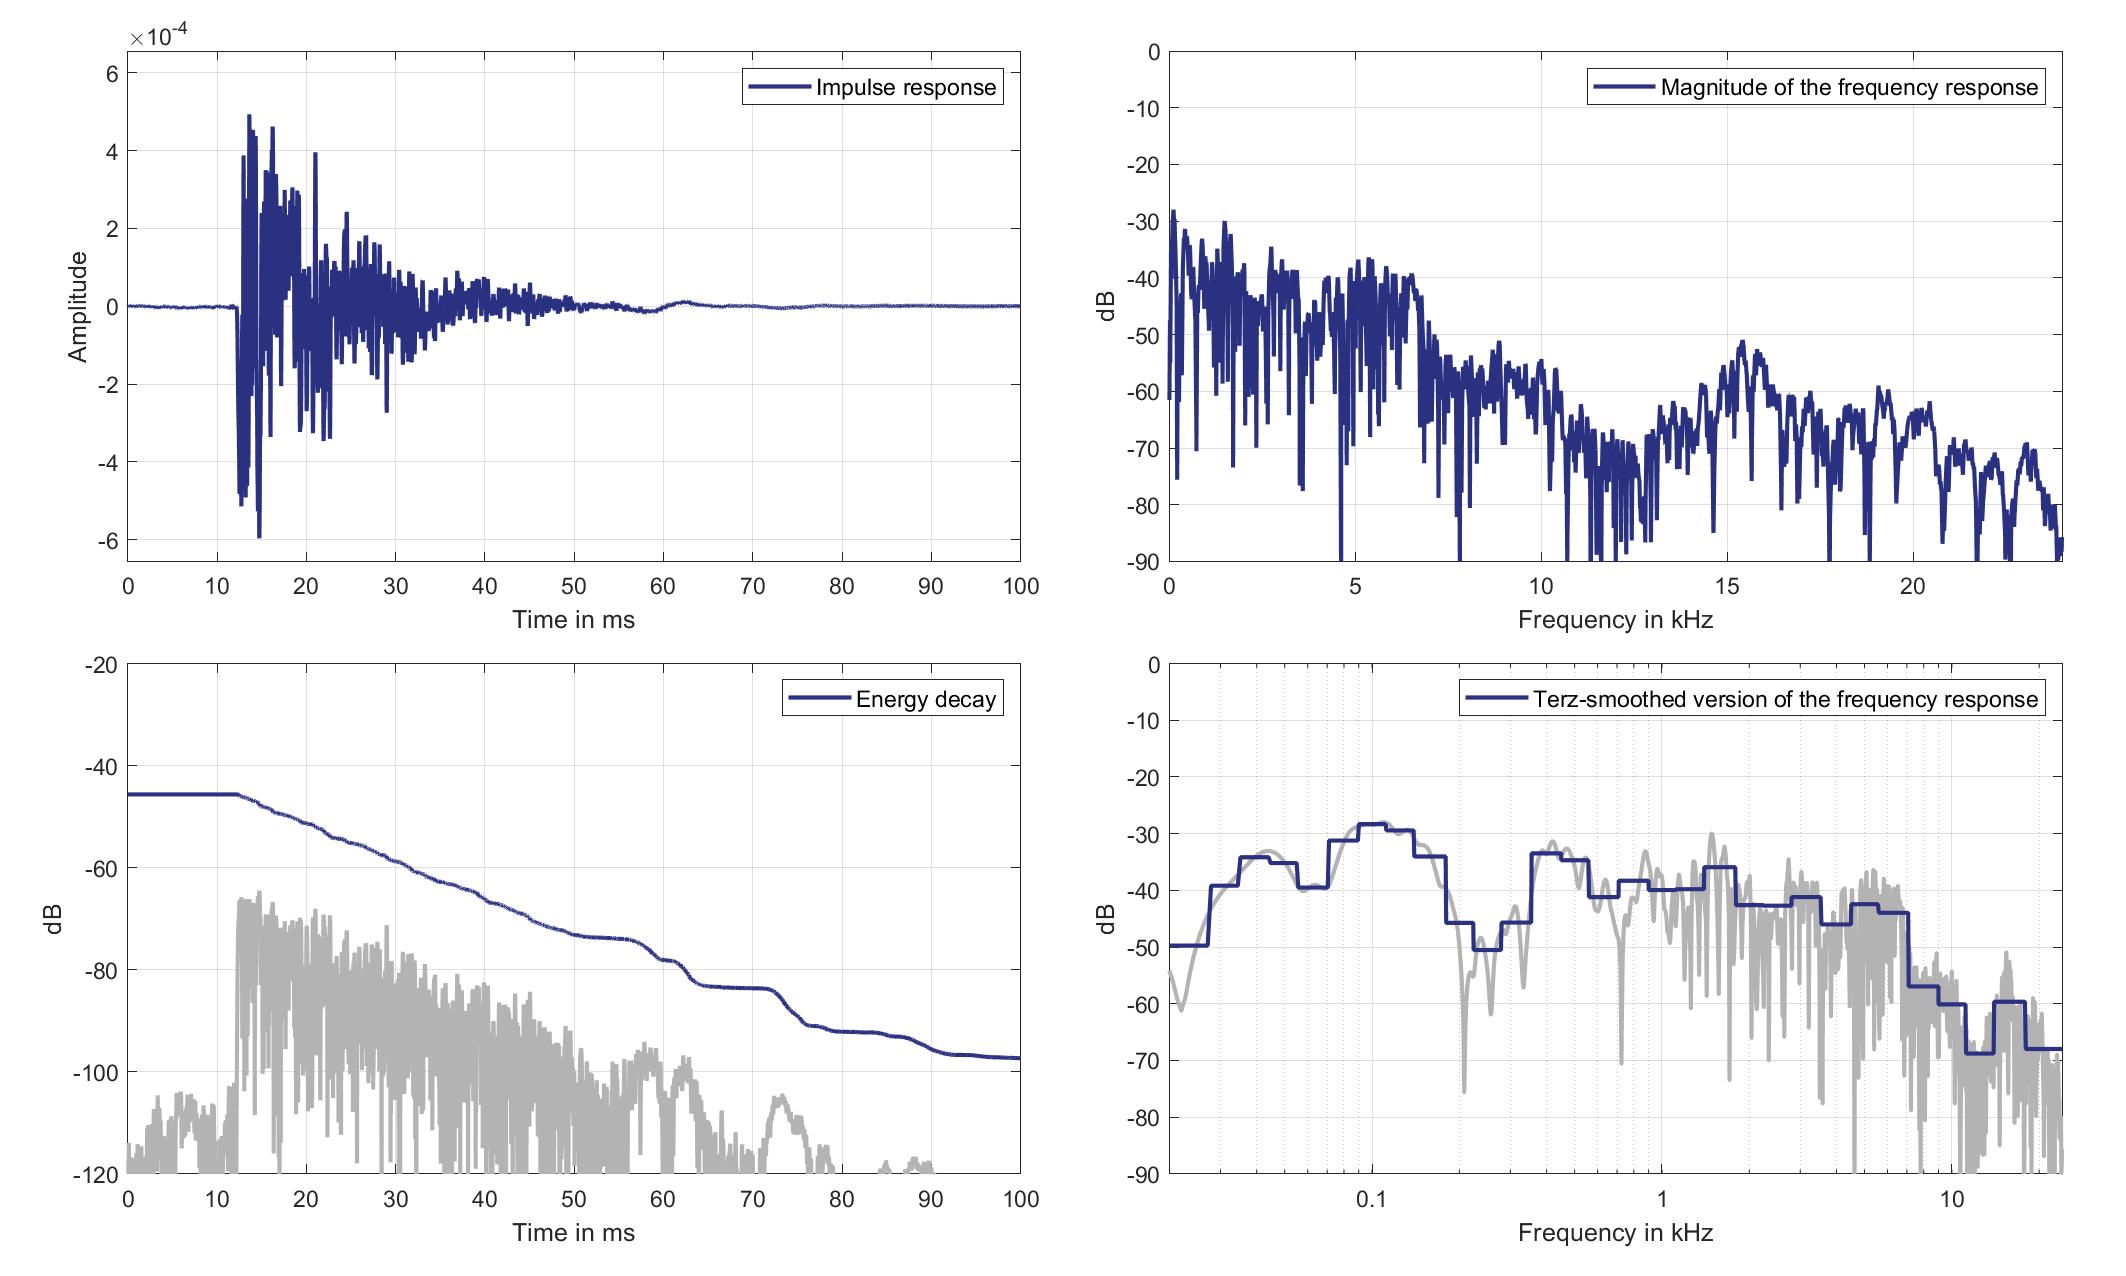
Download impulse response (in ".fir" format).
In the download section you can download all impulse response files as well as format explanation and Matlab as well as Python code examples for loading fir files.
Mic. 14
Standard Car Loudspeaker 1 (Lsp. 19) to Standard Car Microphone 14 (Mic. 14)
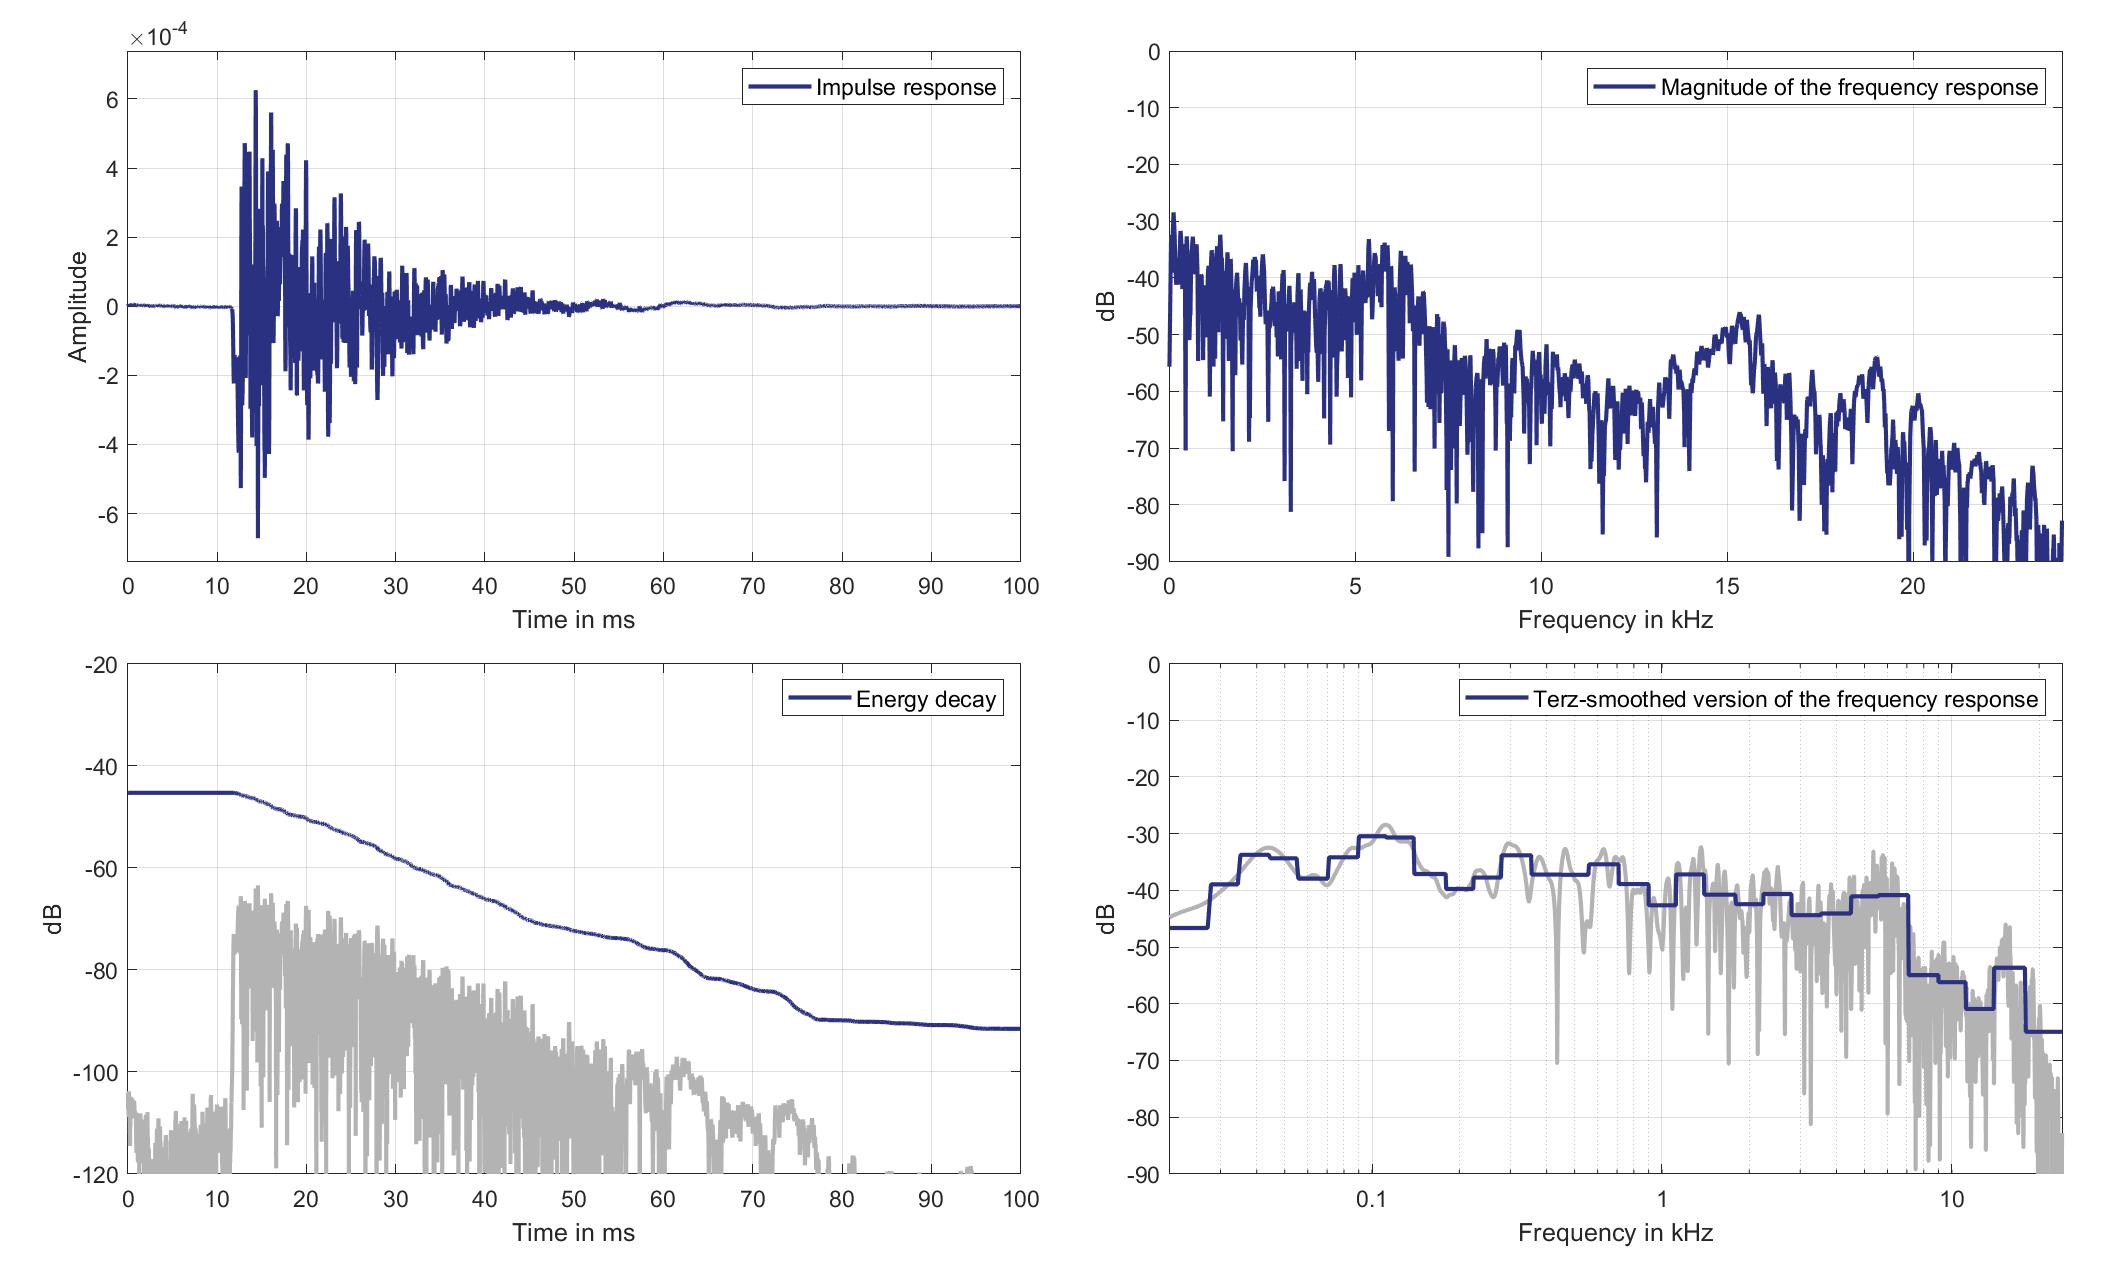
Download impulse response (in ".fir" format).
In the download section you can download all impulse response files as well as format explanation and Matlab as well as Python code examples for loading fir files.
Mic. 15
Standard Car Loudspeaker 1 (Lsp. 19) to Standard Car Microphone 15 (Mic. 15)
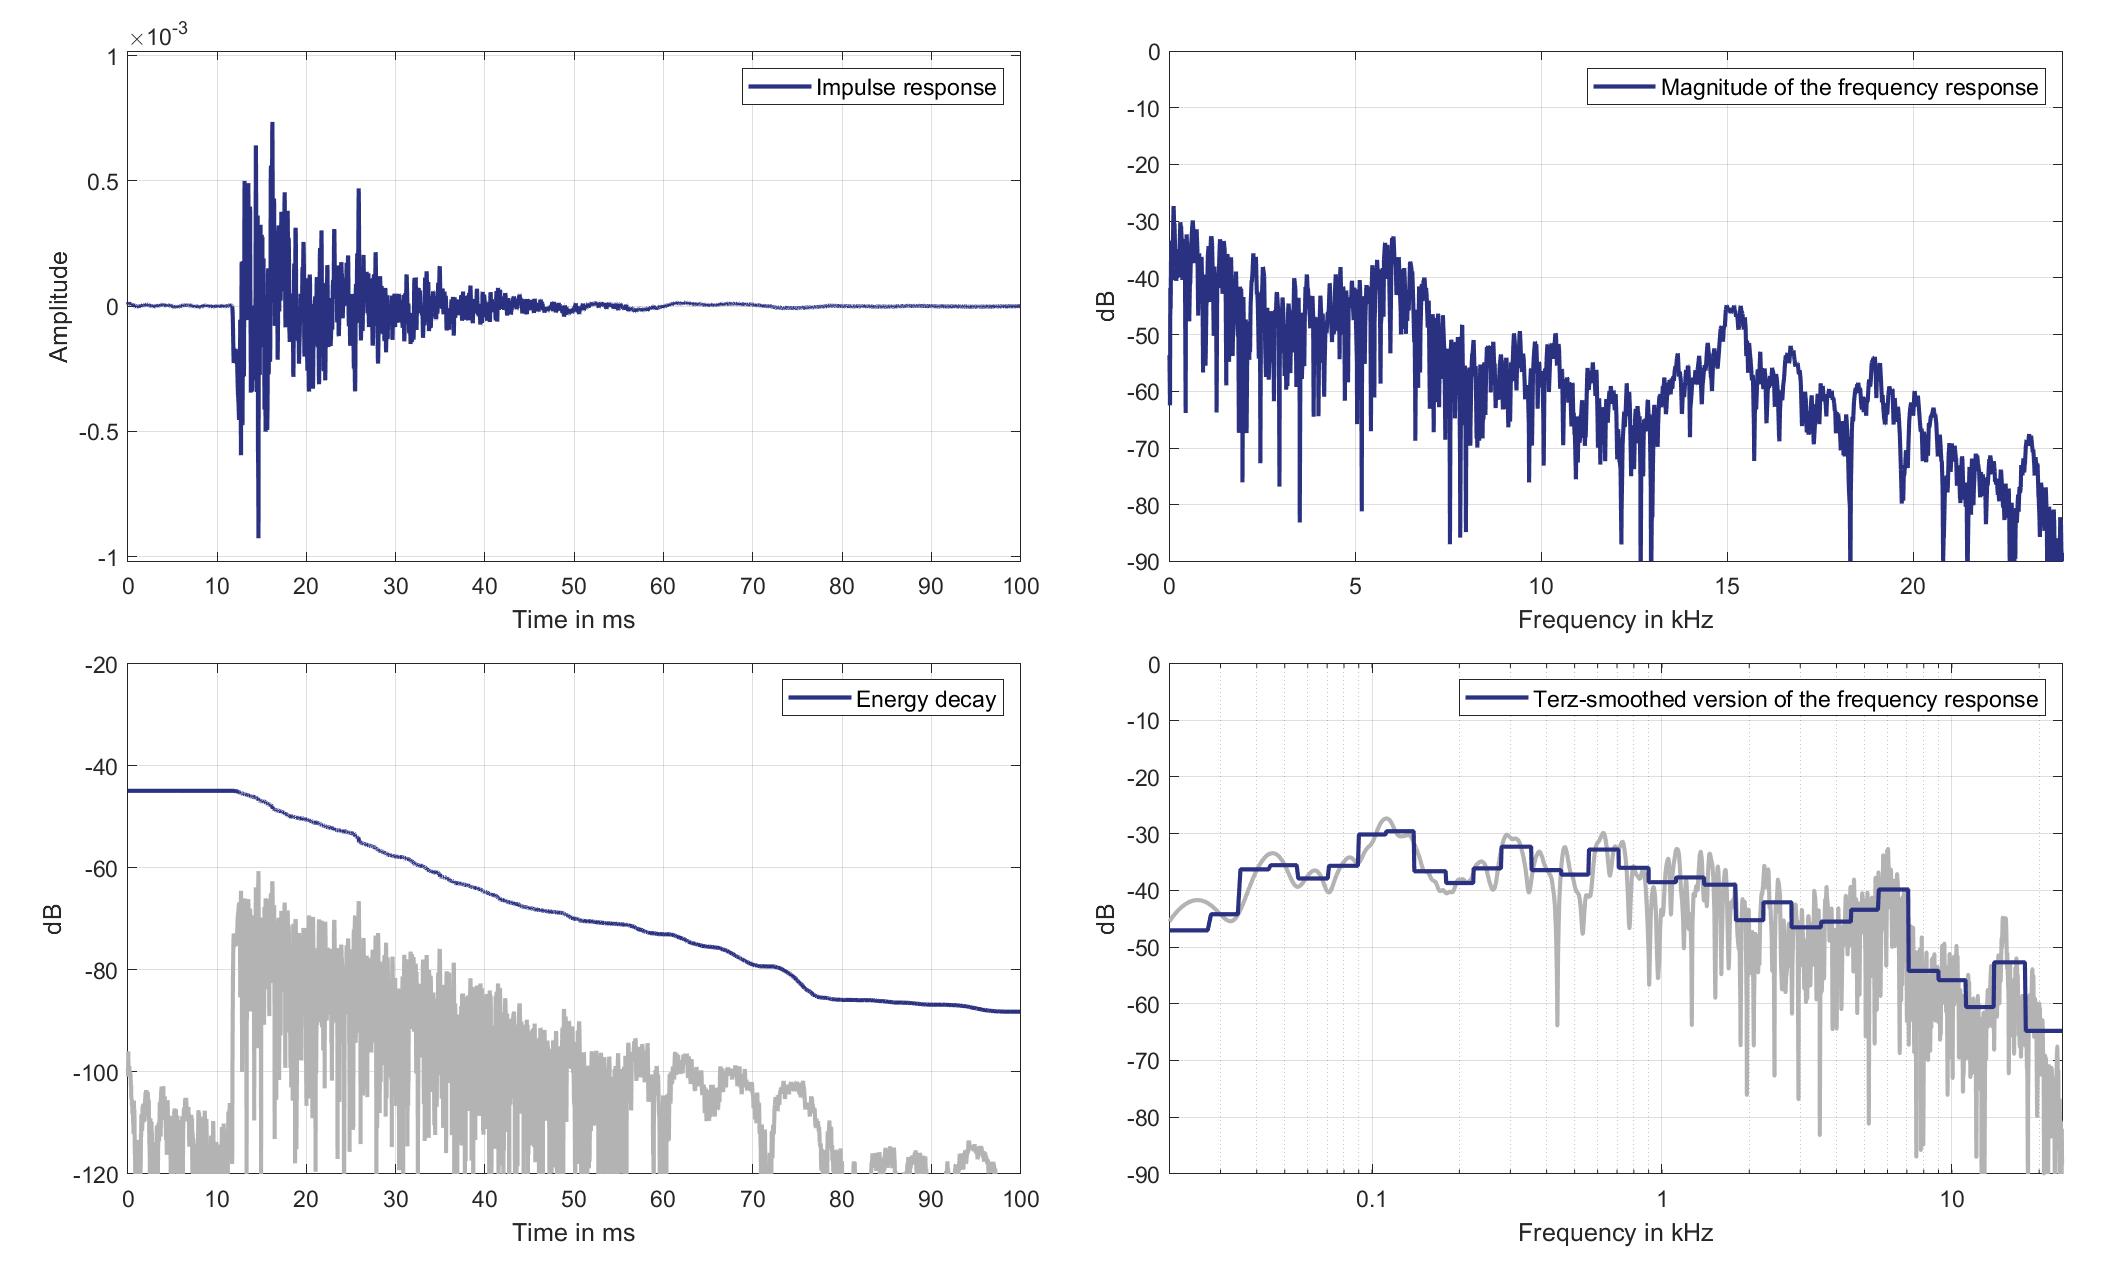
Download impulse response (in ".fir" format).
In the download section you can download all impulse response files as well as format explanation and Matlab as well as Python code examples for loading fir files.
Mic. 16
Standard Car Loudspeaker 1 (Lsp. 19) to Standard Car Microphone 16 (Mic. 16)

Download impulse response (in ".fir" format).
In the download section you can download all impulse response files as well as format explanation and Matlab as well as Python code examples for loading fir files.
Mic. 17
Standard Car Loudspeaker 1 (Lsp. 19) to Standard Car Microphone 17 (Mic. 17)
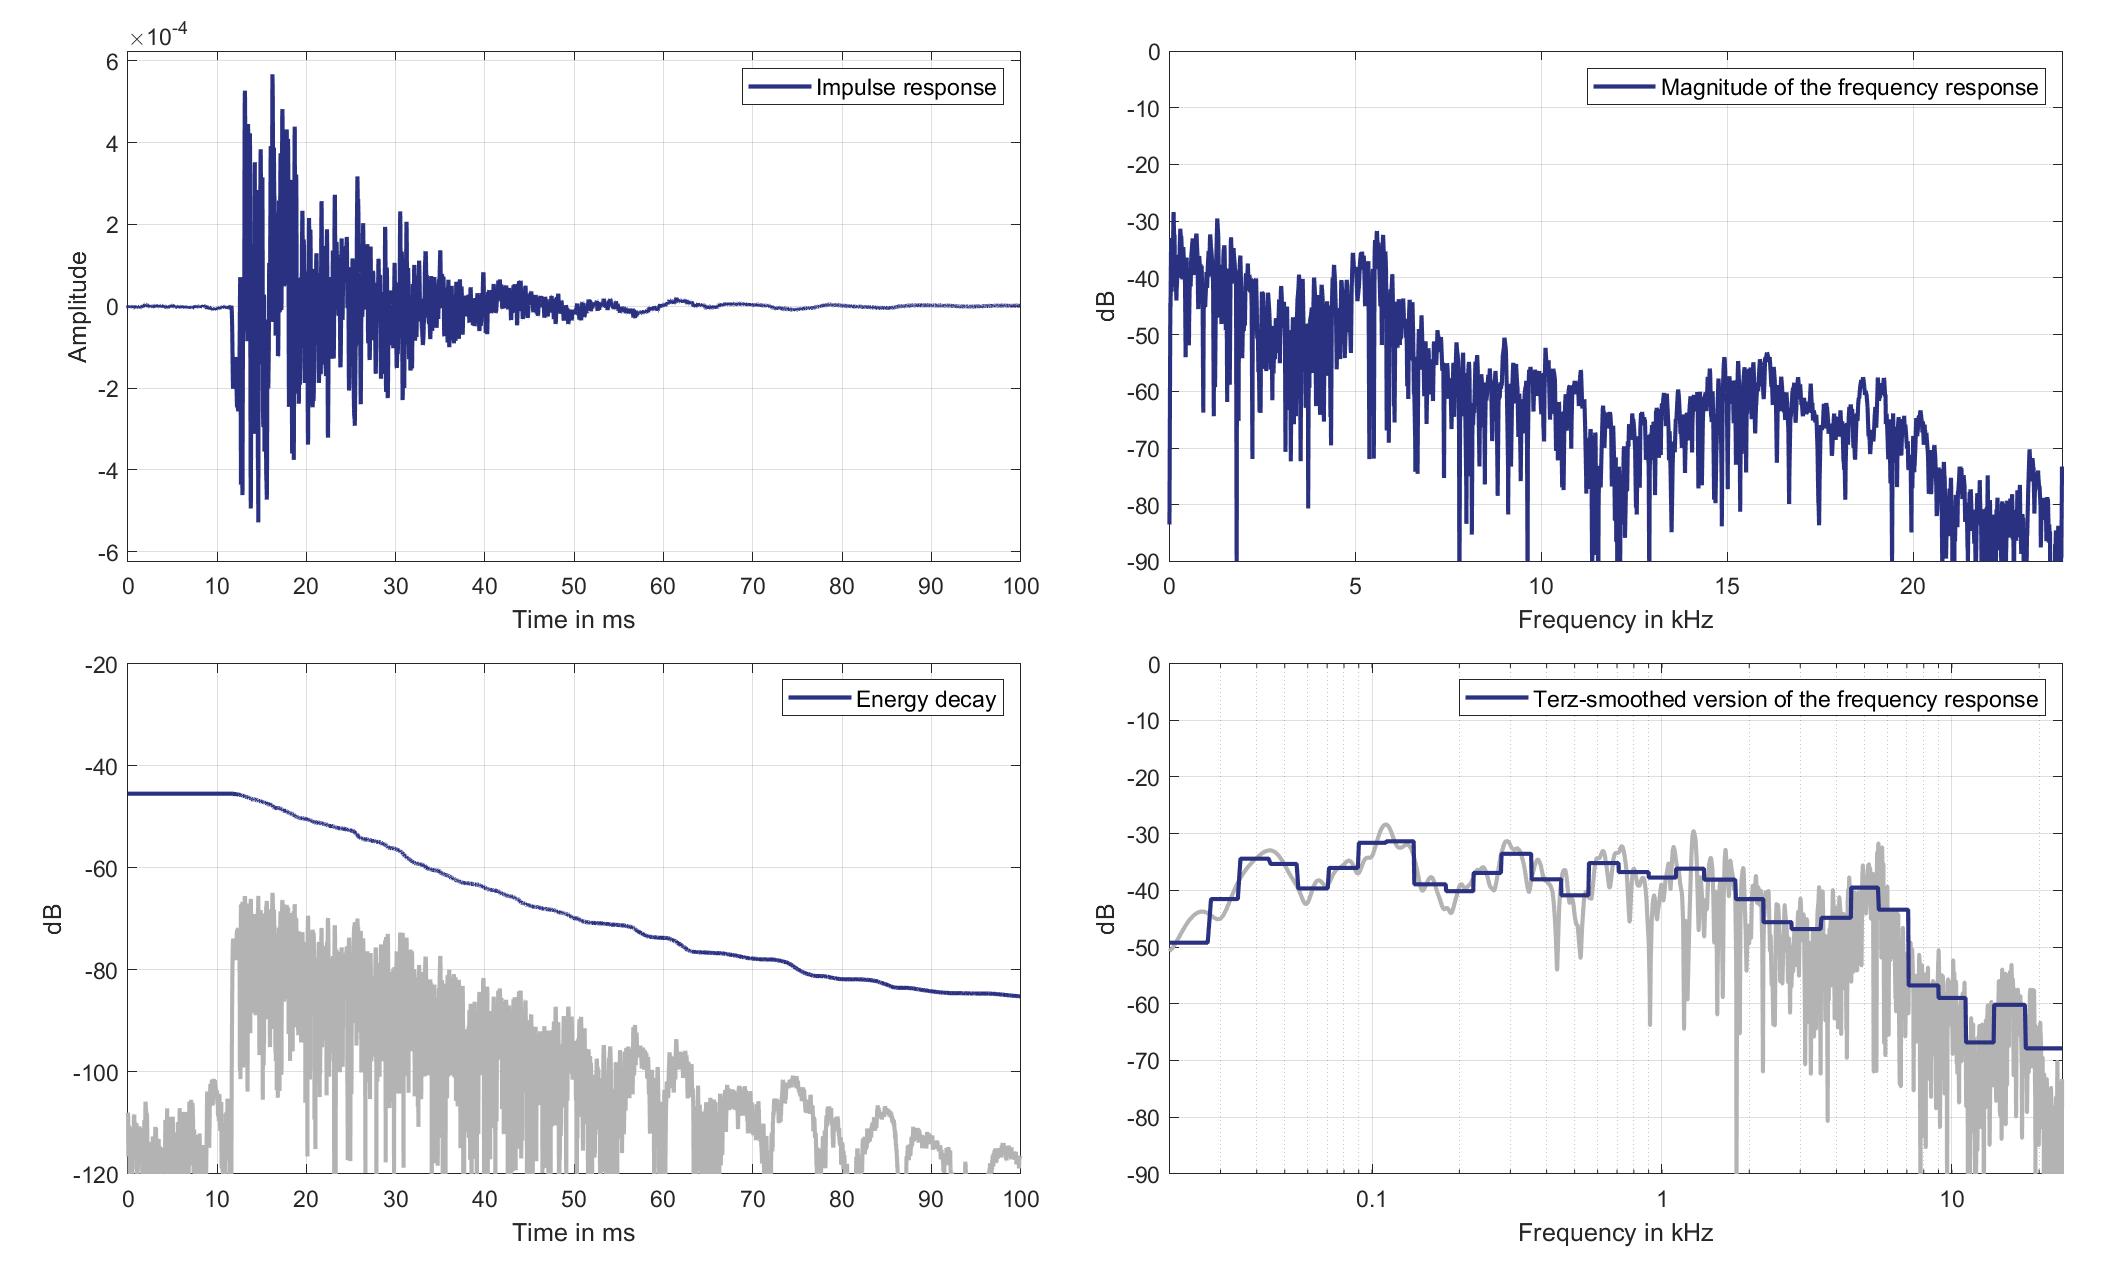
Download impulse response (in ".fir" format).
In the download section you can download all impulse response files as well as format explanation and Matlab as well as Python code examples for loading fir files.
Mic. 18
Standard Car Loudspeaker 1 (Lsp. 19) to Standard Car Microphone 18 (Mic. 18)

Download impulse response (in ".fir" format).
In the download section you can download all impulse response files as well as format explanation and Matlab as well as Python code examples for loading fir files.
Lsp. 20
Mic. 0
Standard Car Loudspeaker 2 (Lsp. 20) to Standard Car Microphone 0 (Mic. 0)
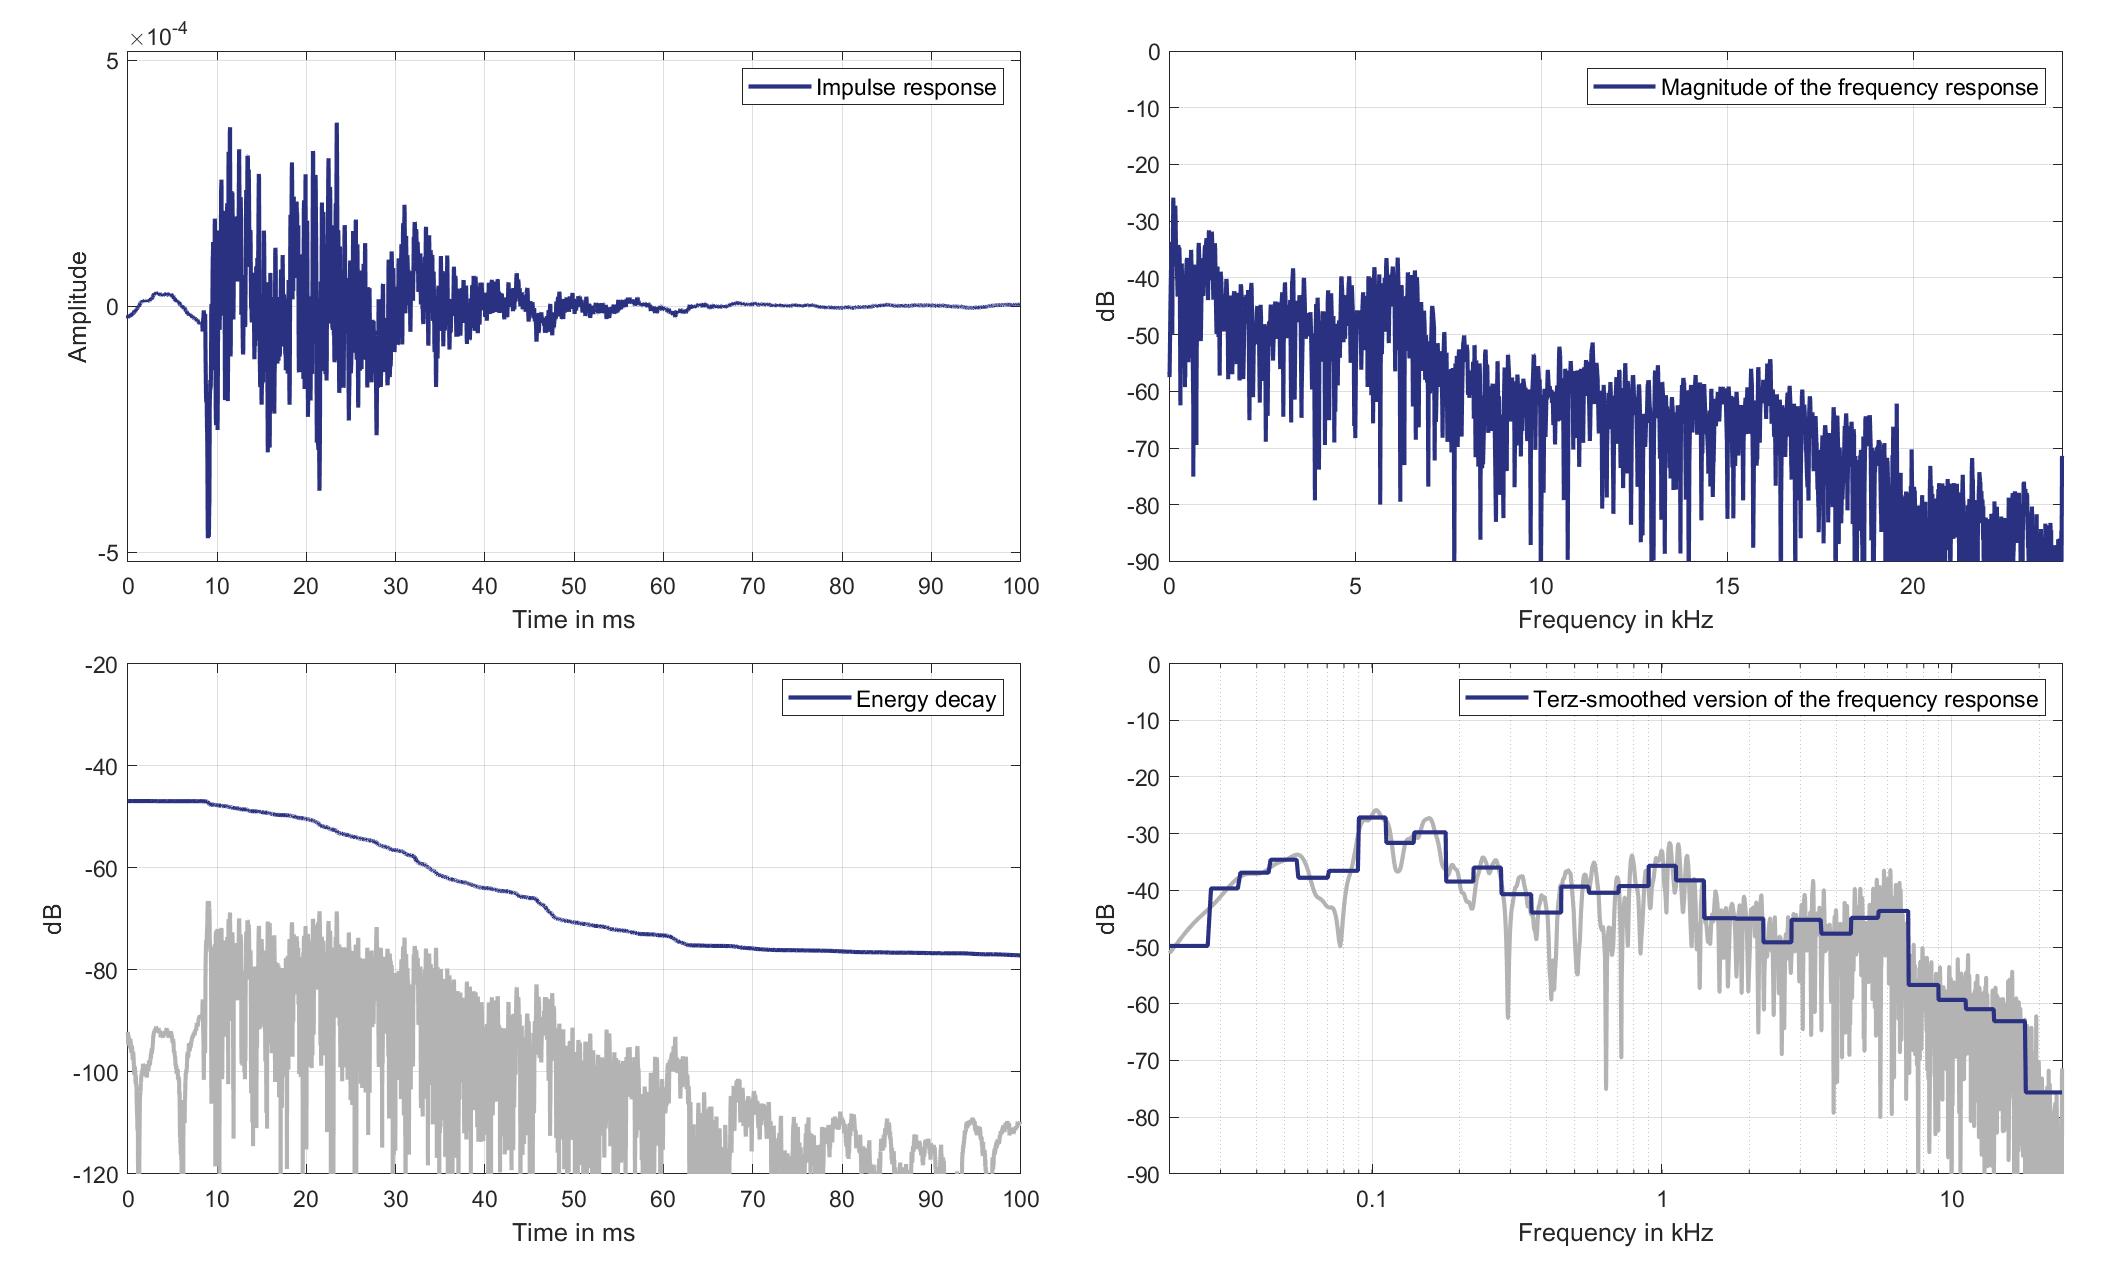
Download impulse response (in ".fir" format).
In the download section you can download all impulse response files as well as format explanation and Matlab as well as Python code examples for loading fir files.
Mic. 1
Standard Car Loudspeaker 2 (Lsp. 20) to Standard Car Microphone 1 (Mic. 1)
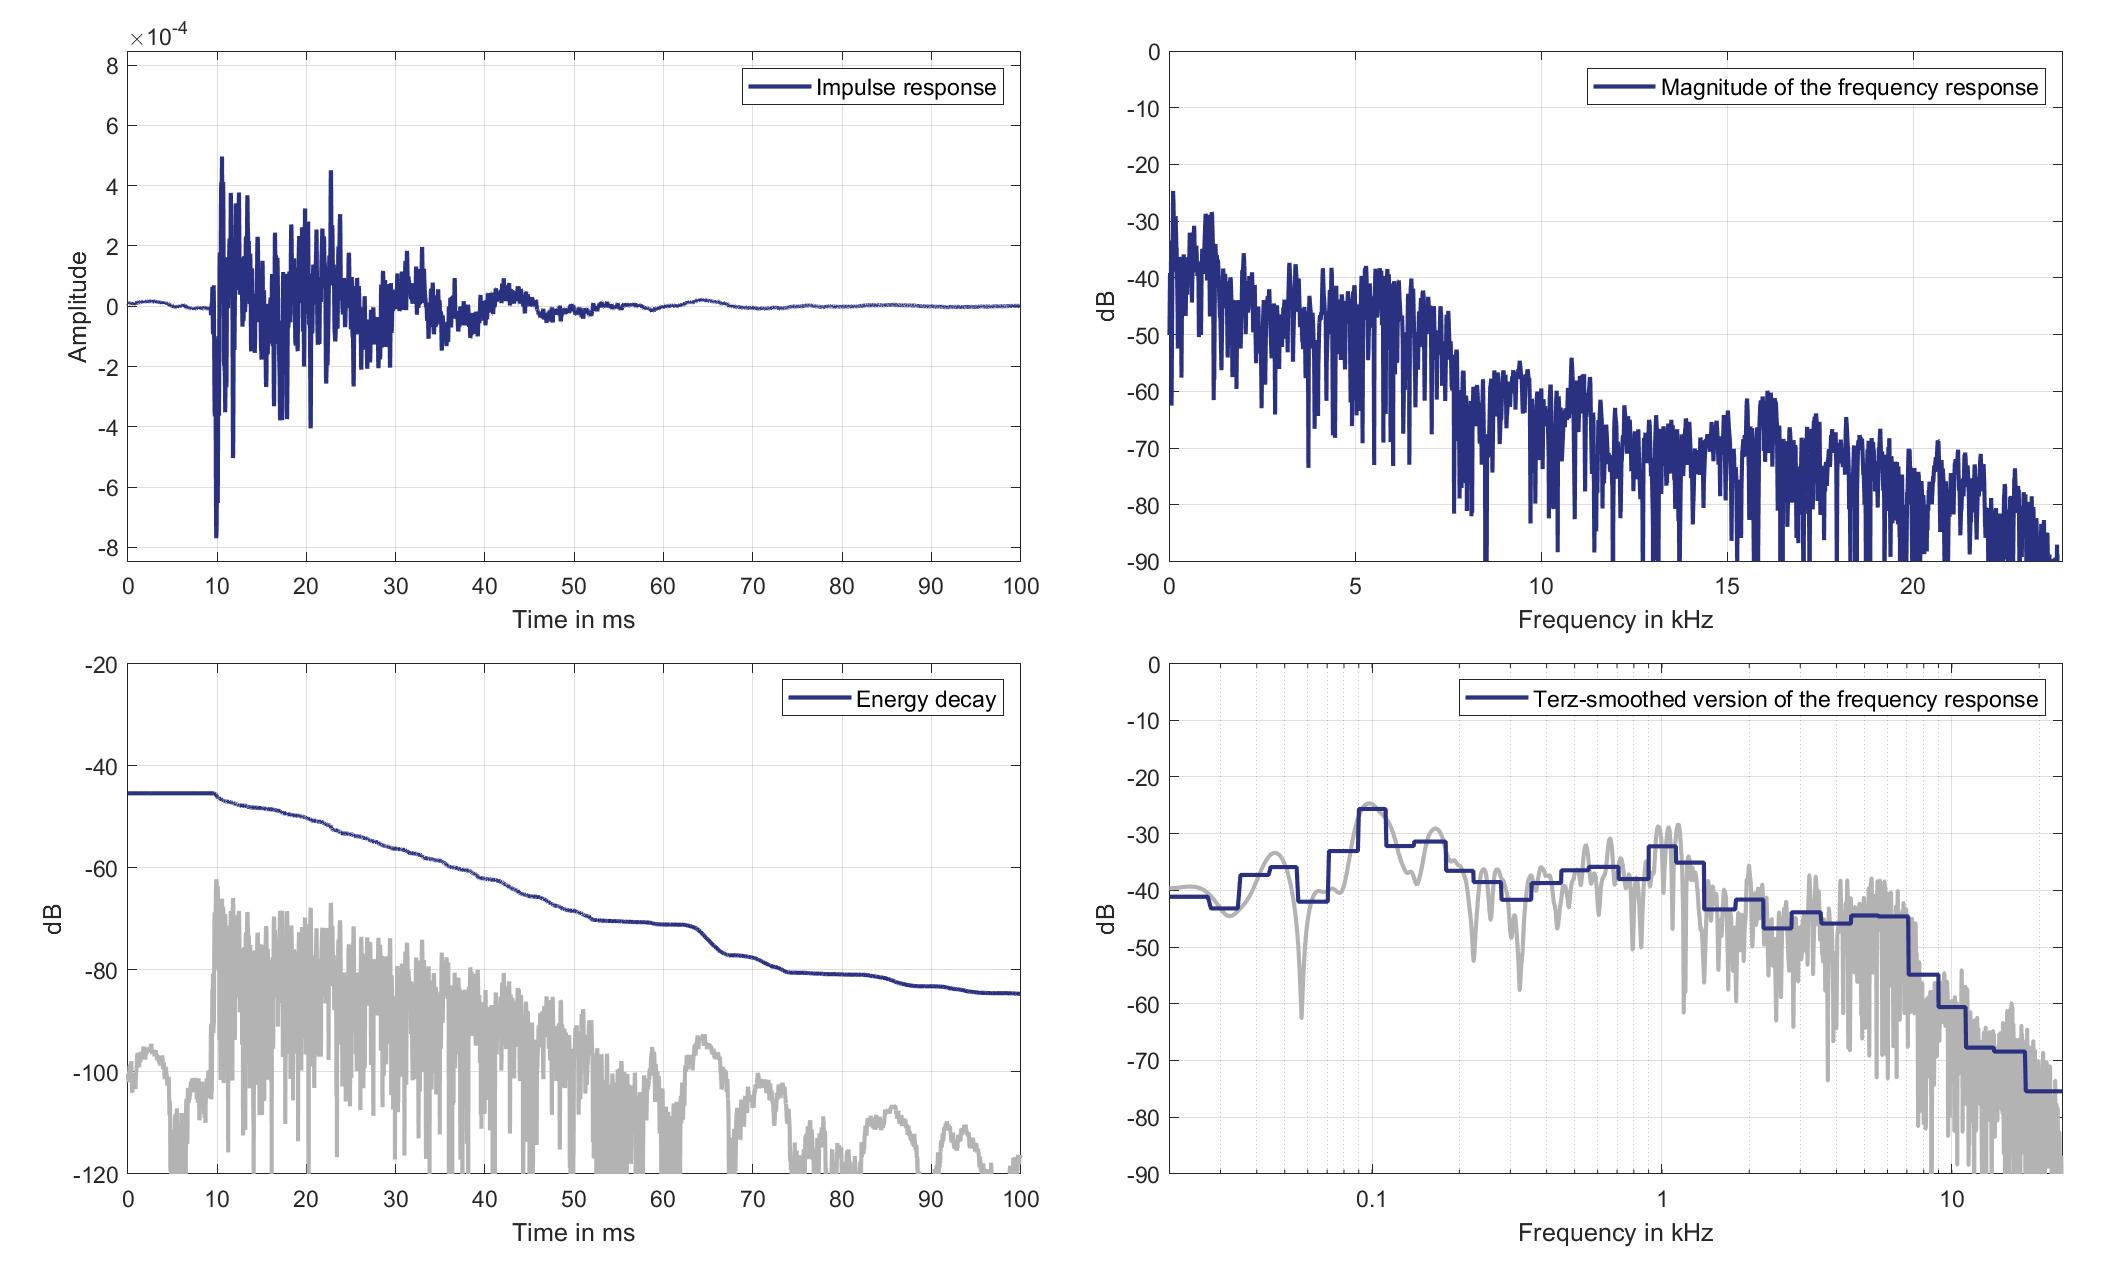
Download impulse response (in ".fir" format).
In the download section you can download all impulse response files as well as format explanation and Matlab as well as Python code examples for loading fir files.
Mic. 2
Standard Car Loudspeaker 2 (Lsp. 20) to Standard Car Microphone 2 (Mic. 2)

Download impulse response (in ".fir" format).
In the download section you can download all impulse response files as well as format explanation and Matlab as well as Python code examples for loading fir files.
Mic. 3
Standard Car Loudspeaker 2 (Lsp. 20) to Standard Car Microphone 3 (Mic. 3)
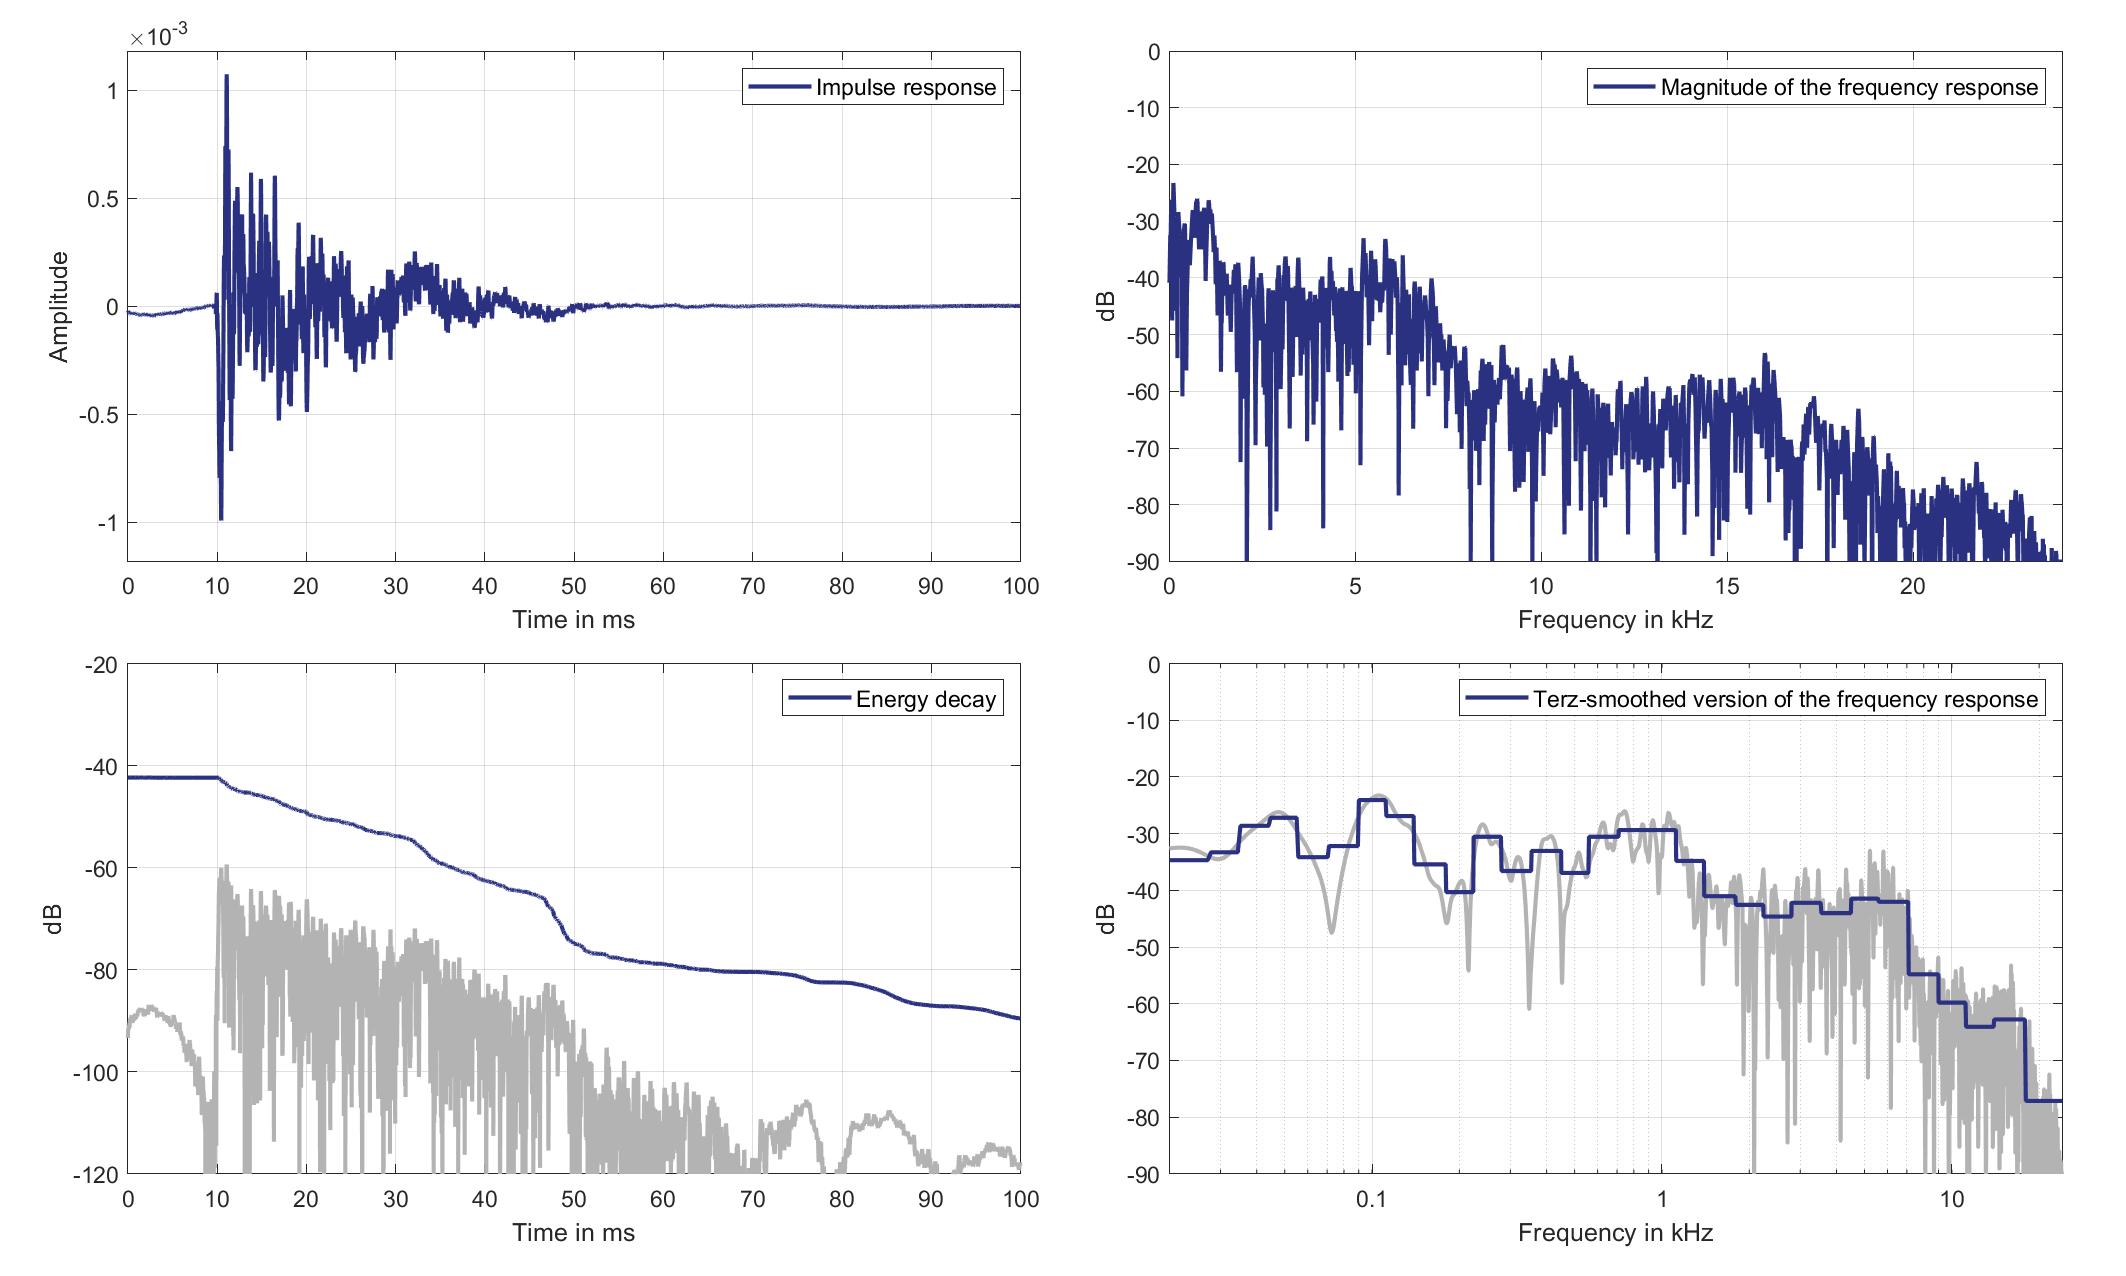
Download impulse response (in ".fir" format).
In the download section you can download all impulse response files as well as format explanation and Matlab as well as Python code examples for loading fir files.
Mic. 4
Standard Car Loudspeaker 2 (Lsp. 20) to Standard Car Microphone 4 (Mic. 4)
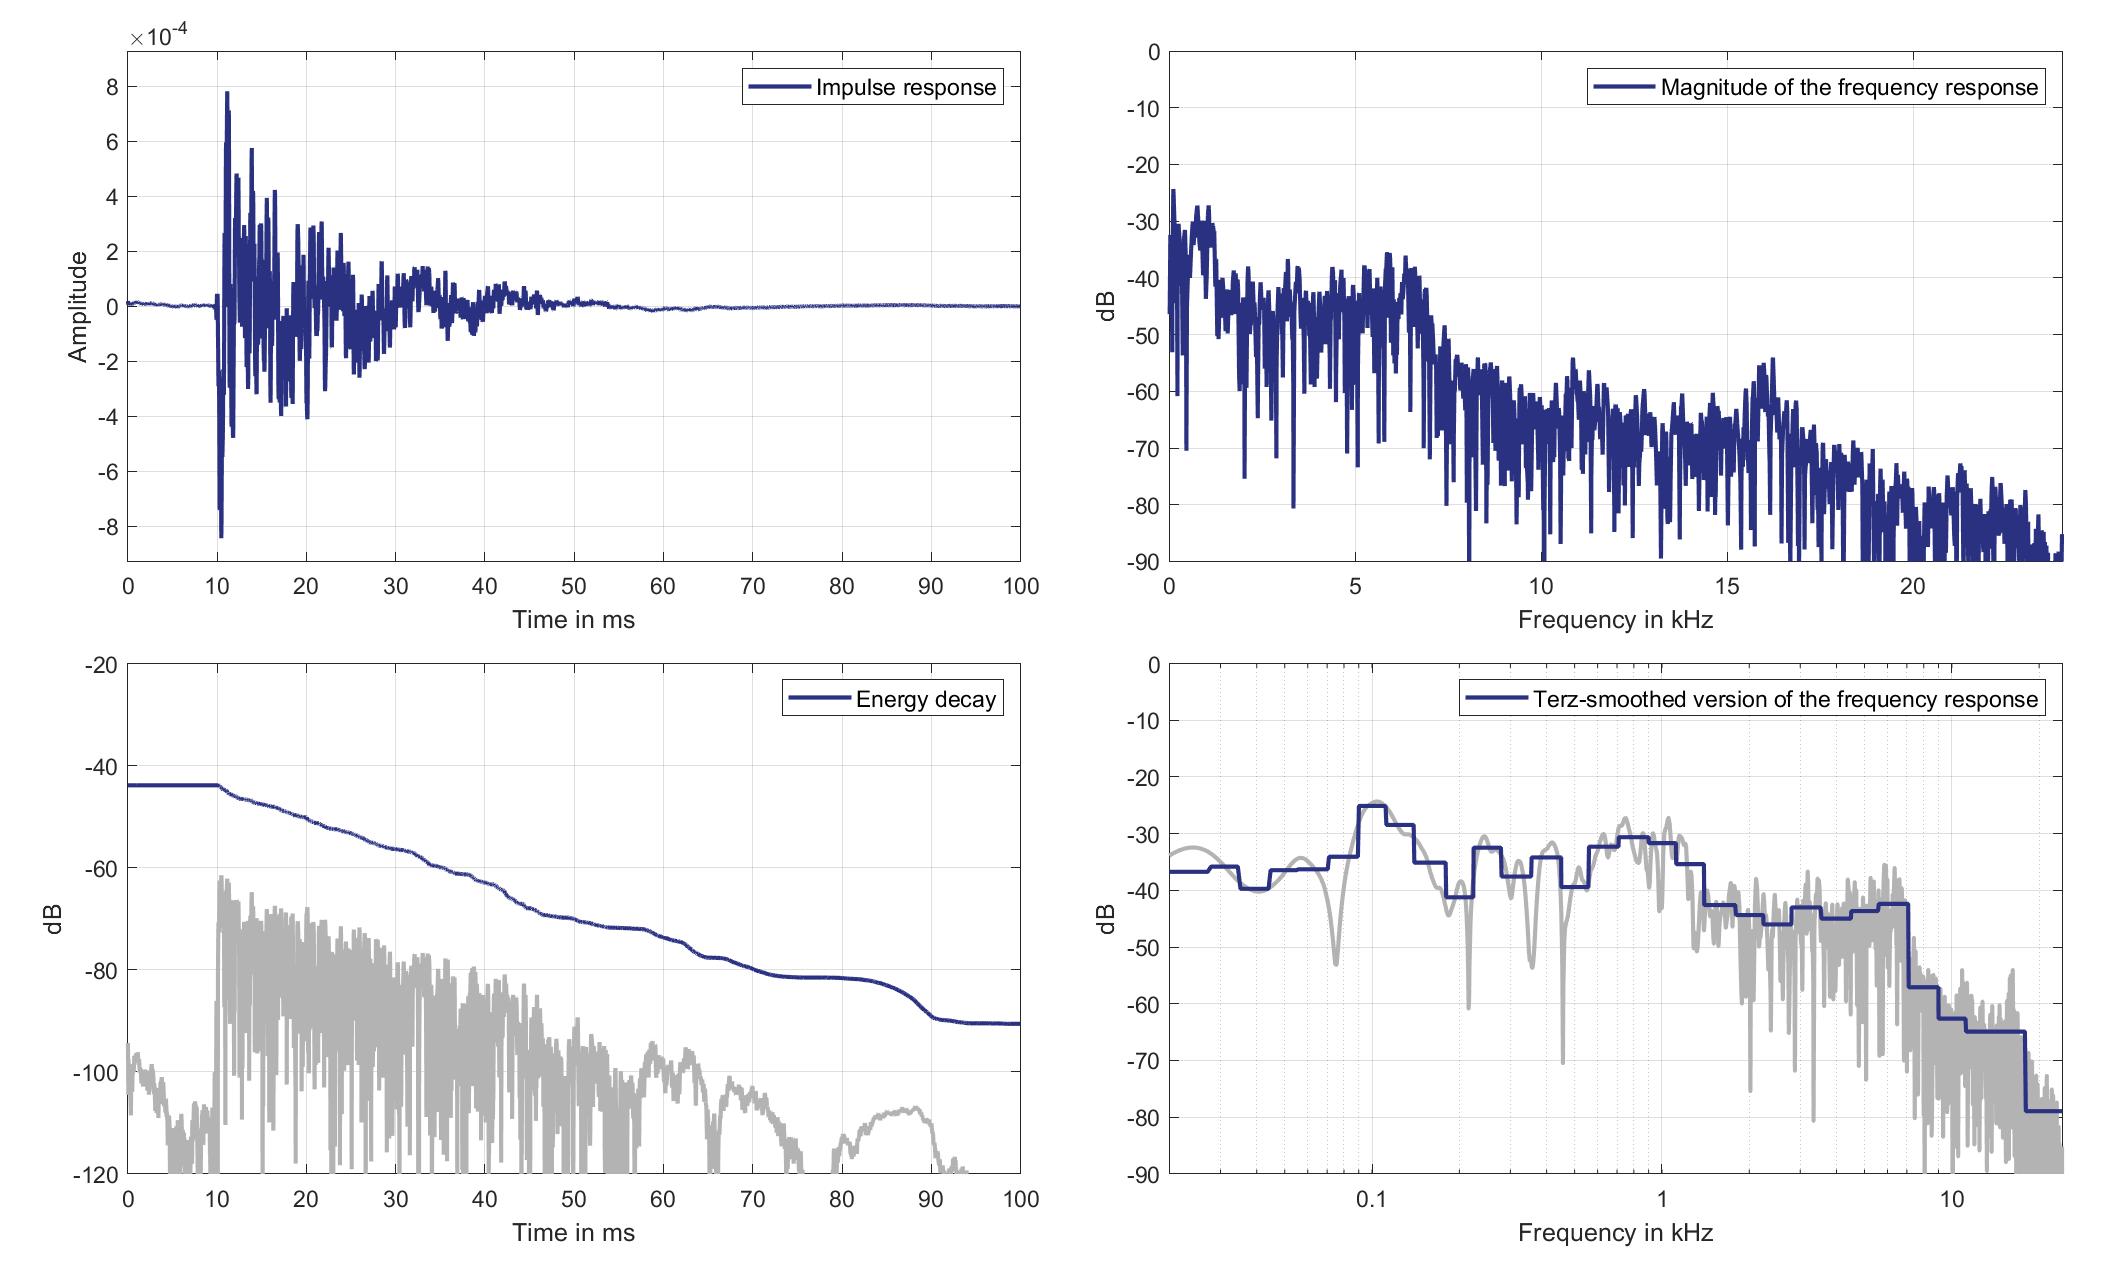
Download impulse response (in ".fir" format).
In the download section you can download all impulse response files as well as format explanation and Matlab as well as Python code examples for loading fir files.
Mic. 5
Standard Car Loudspeaker 2 (Lsp. 20) to Standard Car Microphone 5 (Mic. 5)
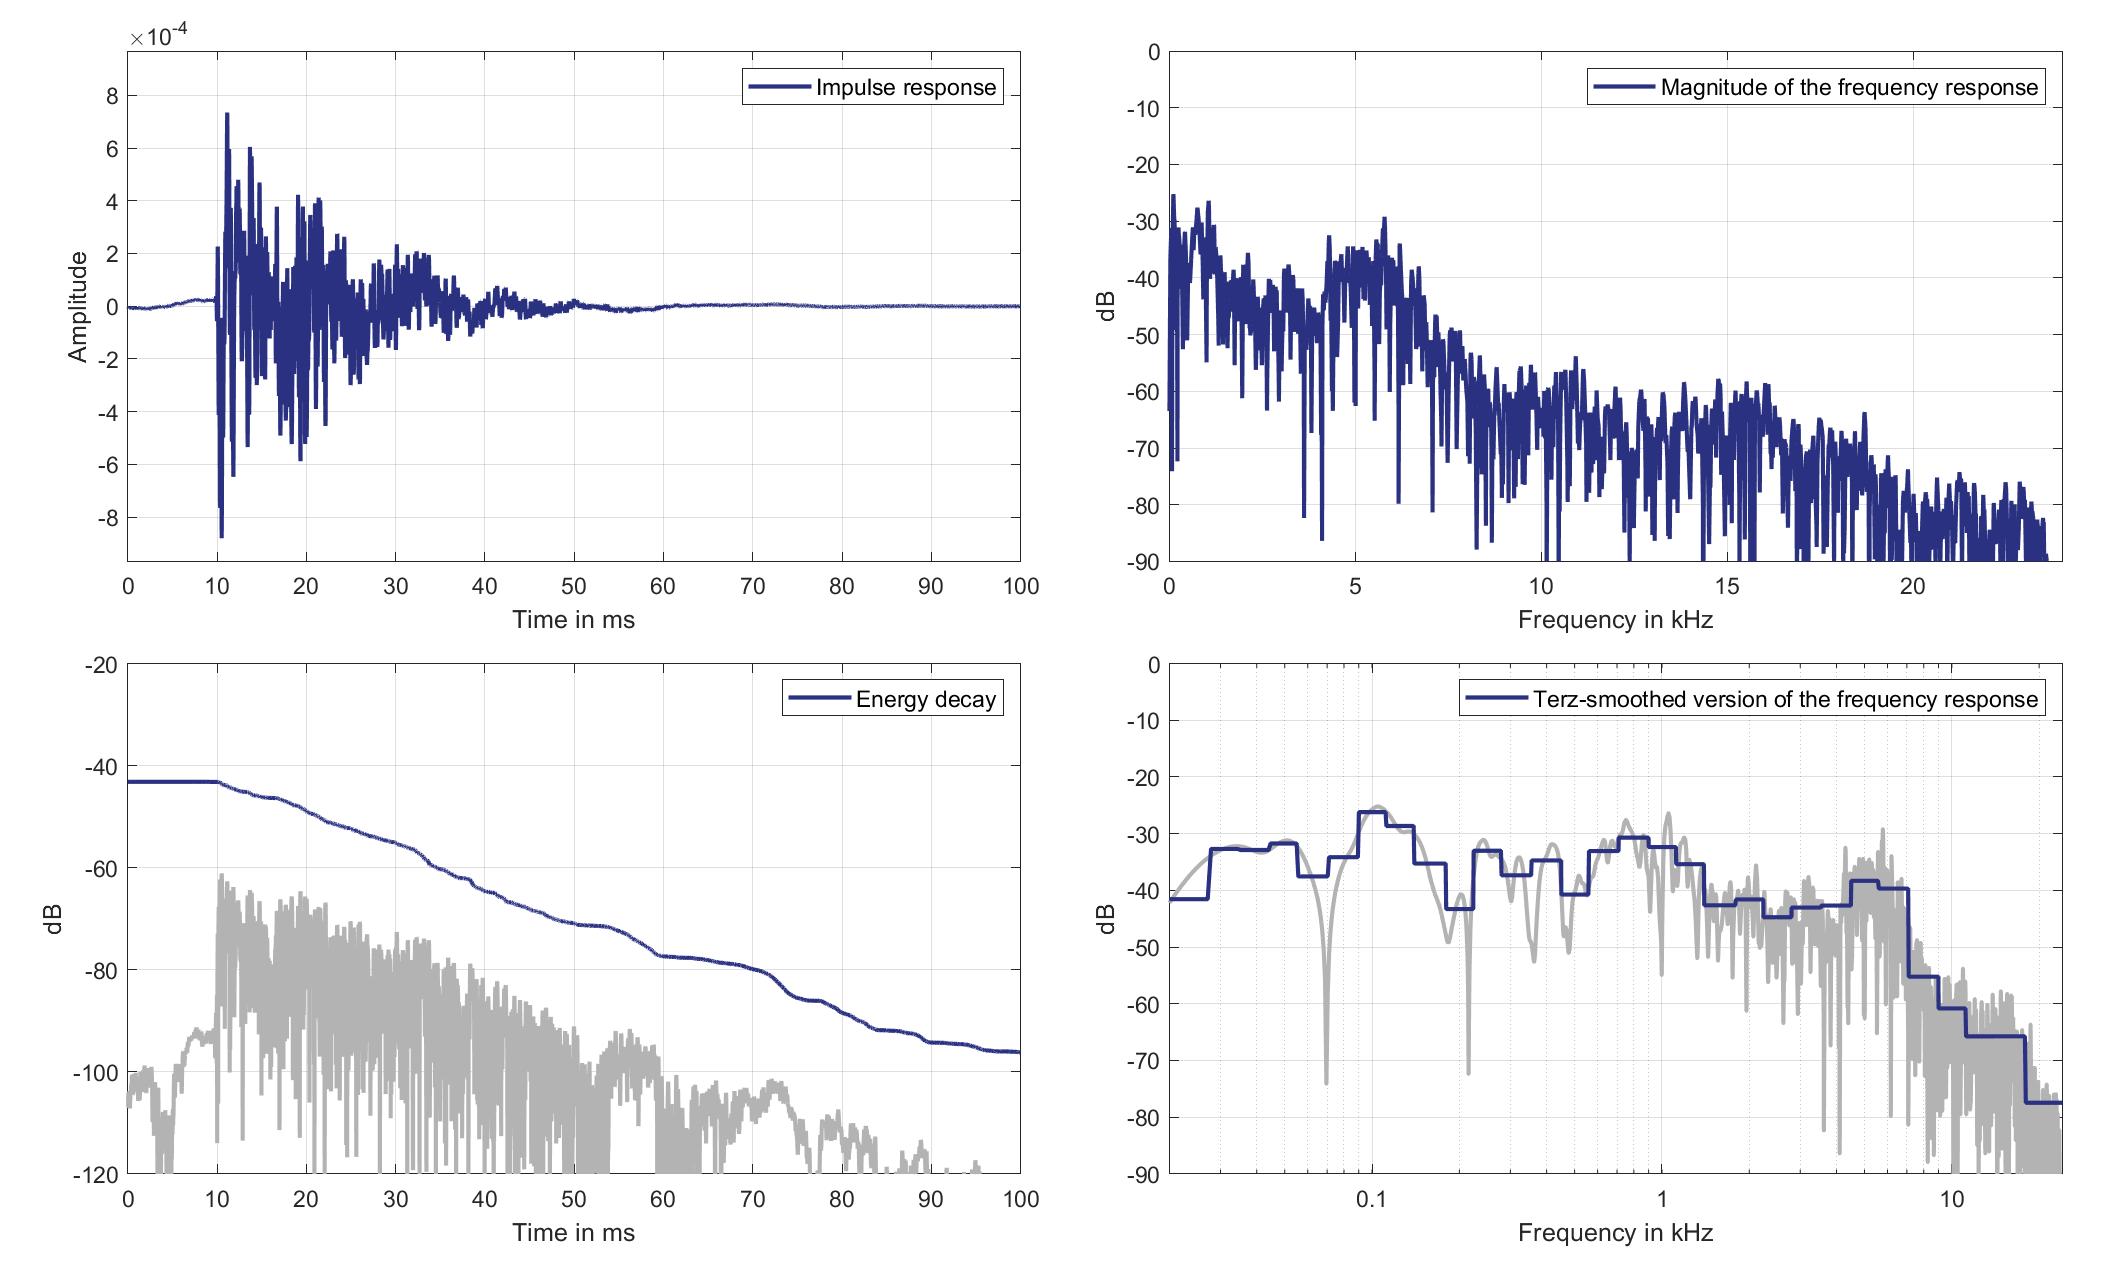
Download impulse response (in ".fir" format).
In the download section you can download all impulse response files as well as format explanation and Matlab as well as Python code examples for loading fir files.
Mic. 6
Standard Car Loudspeaker 2 (Lsp. 20) to Standard Car Microphone 6 (Mic. 6)
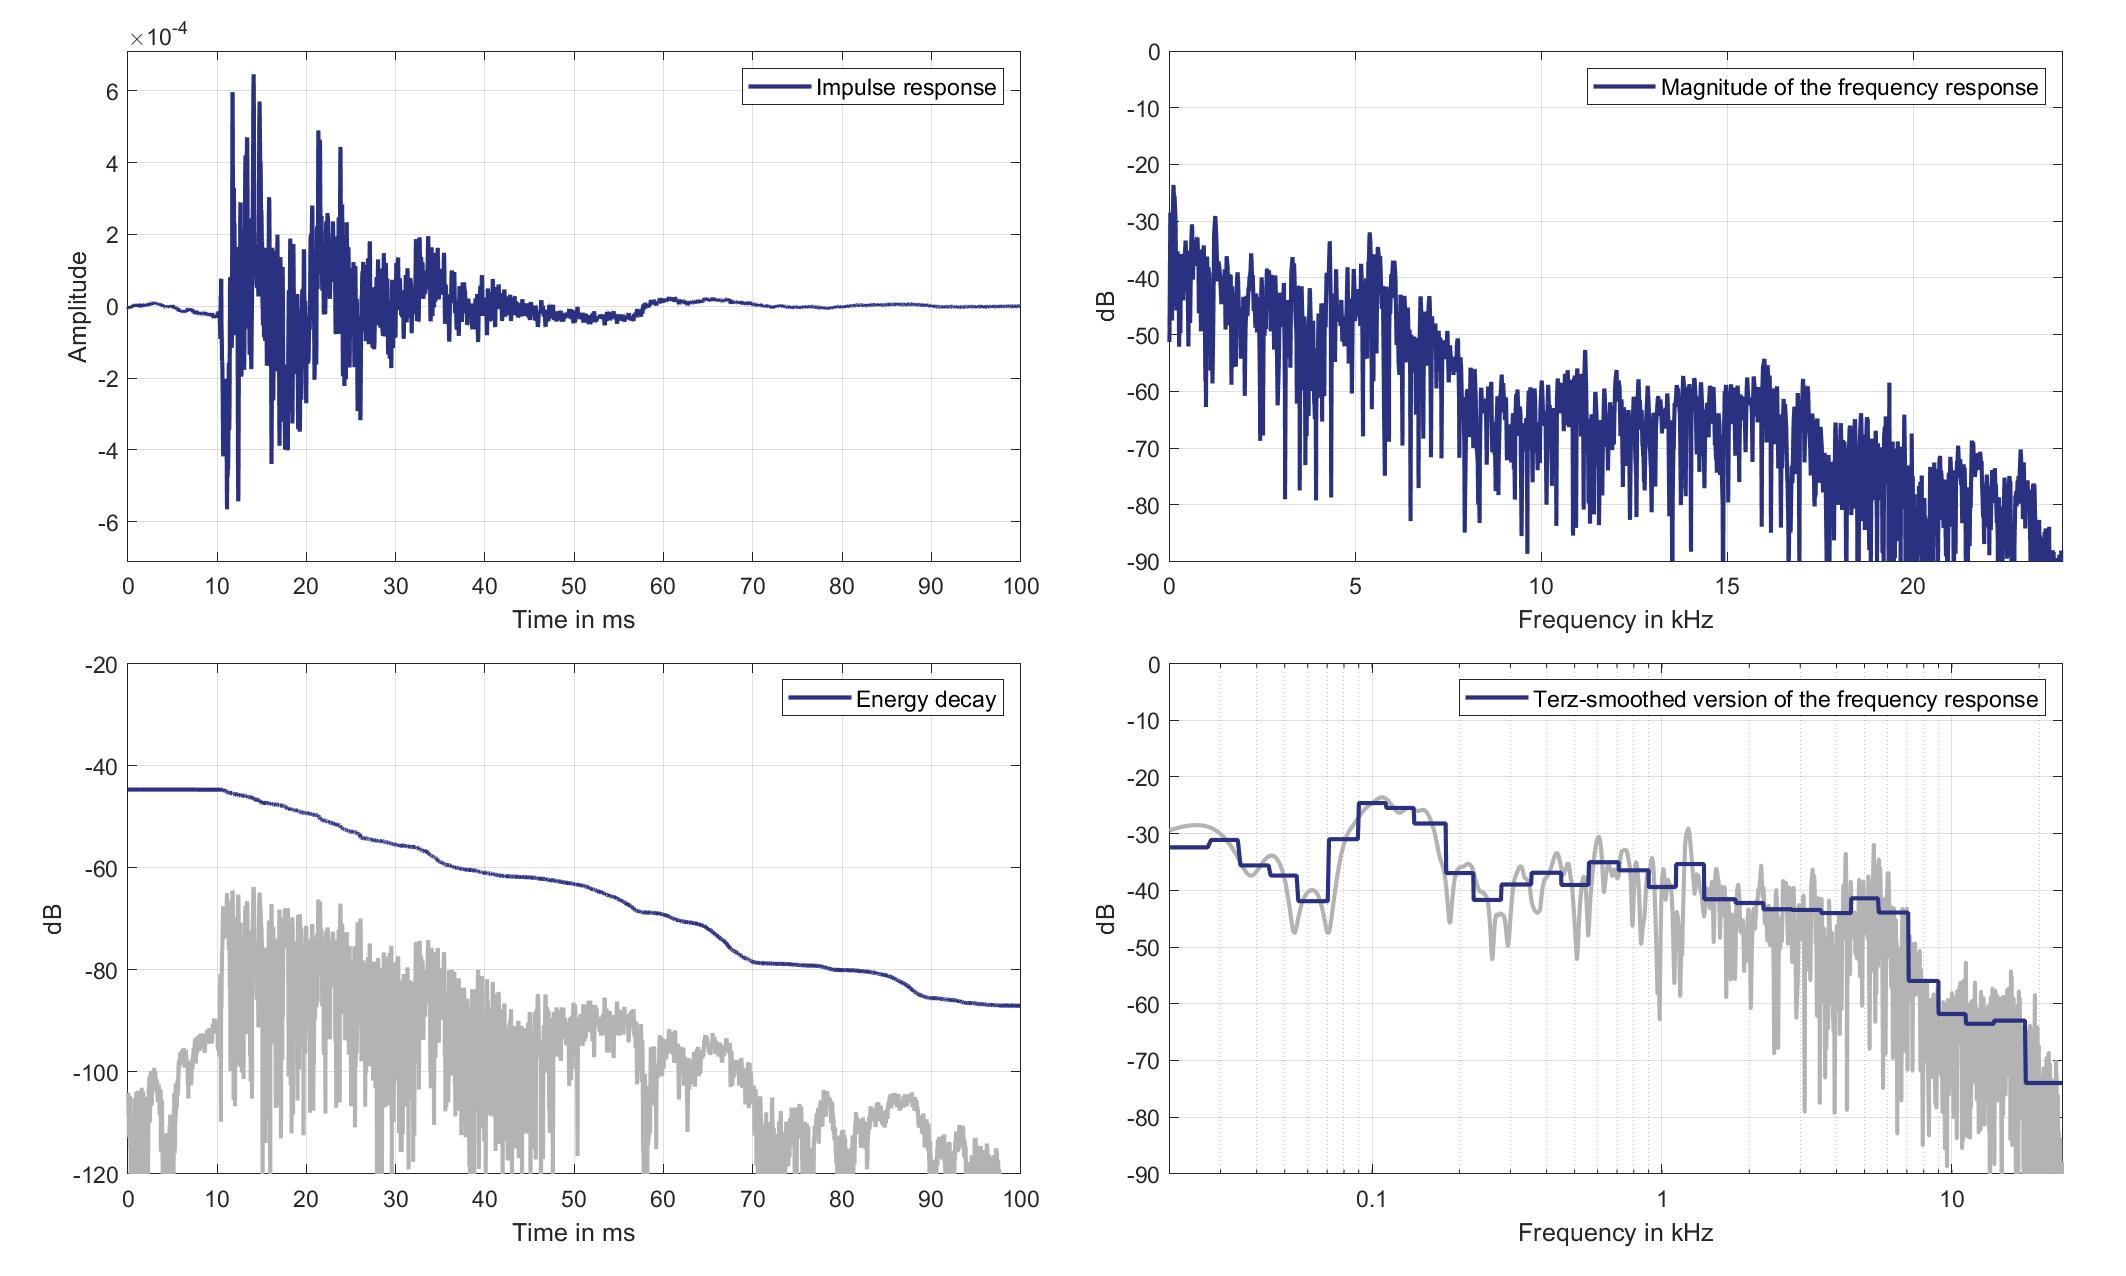
Download impulse response (in ".fir" format).
In the download section you can download all impulse response files as well as format explanation and Matlab as well as Python code examples for loading fir files.
Mic. 7
Standard Car Loudspeaker 2 (Lsp. 20) to Standard Car Microphone 7 (Mic. 7)
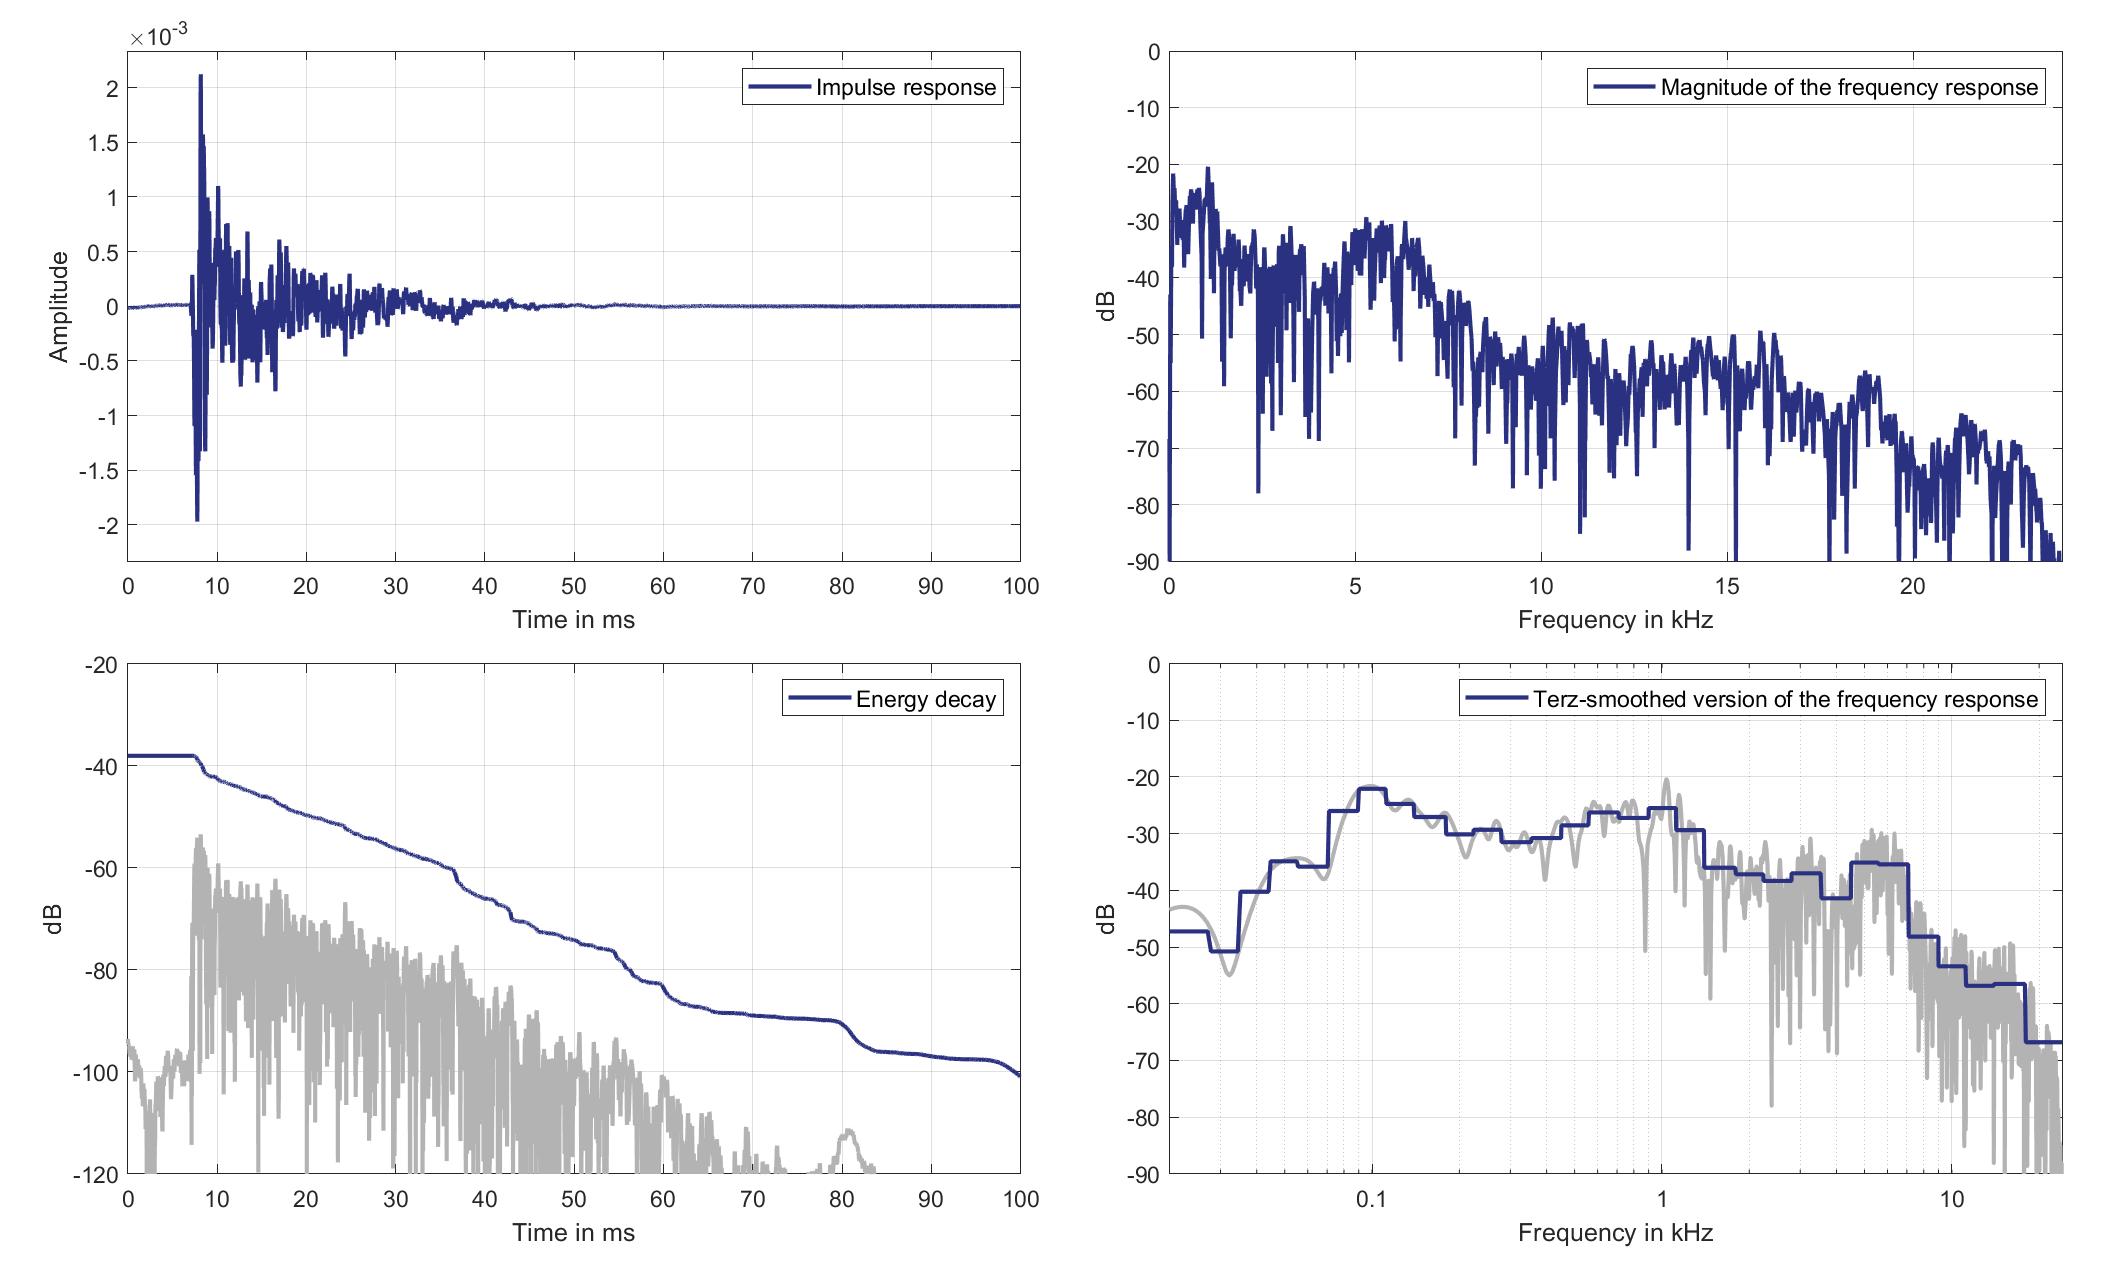
Download impulse response (in ".fir" format).
In the download section you can download all impulse response files as well as format explanation and Matlab as well as Python code examples for loading fir files.
Mic. 8
Standard Car Loudspeaker 2 (Lsp. 20) to Standard Car Microphone 8 (Mic. 8)

Download impulse response (in ".fir" format).
In the download section you can download all impulse response files as well as format explanation and Matlab as well as Python code examples for loading fir files.
Mic. 9
Standard Car Loudspeaker 2 (Lsp. 20) to Standard Car Microphone 9 (Mic. 9)

Download impulse response (in ".fir" format).
In the download section you can download all impulse response files as well as format explanation and Matlab as well as Python code examples for loading fir files.
Mic. 10
Standard Car Loudspeaker 2 (Lsp. 20) to Standard Car Microphone 10 (Mic. 10)

Download impulse response (in ".fir" format).
In the download section you can download all impulse response files as well as format explanation and Matlab as well as Python code examples for loading fir files.
Mic. 11
Standard Car Loudspeaker 2 (Lsp. 20) to Standard Car Microphone 11 (Mic. 11)
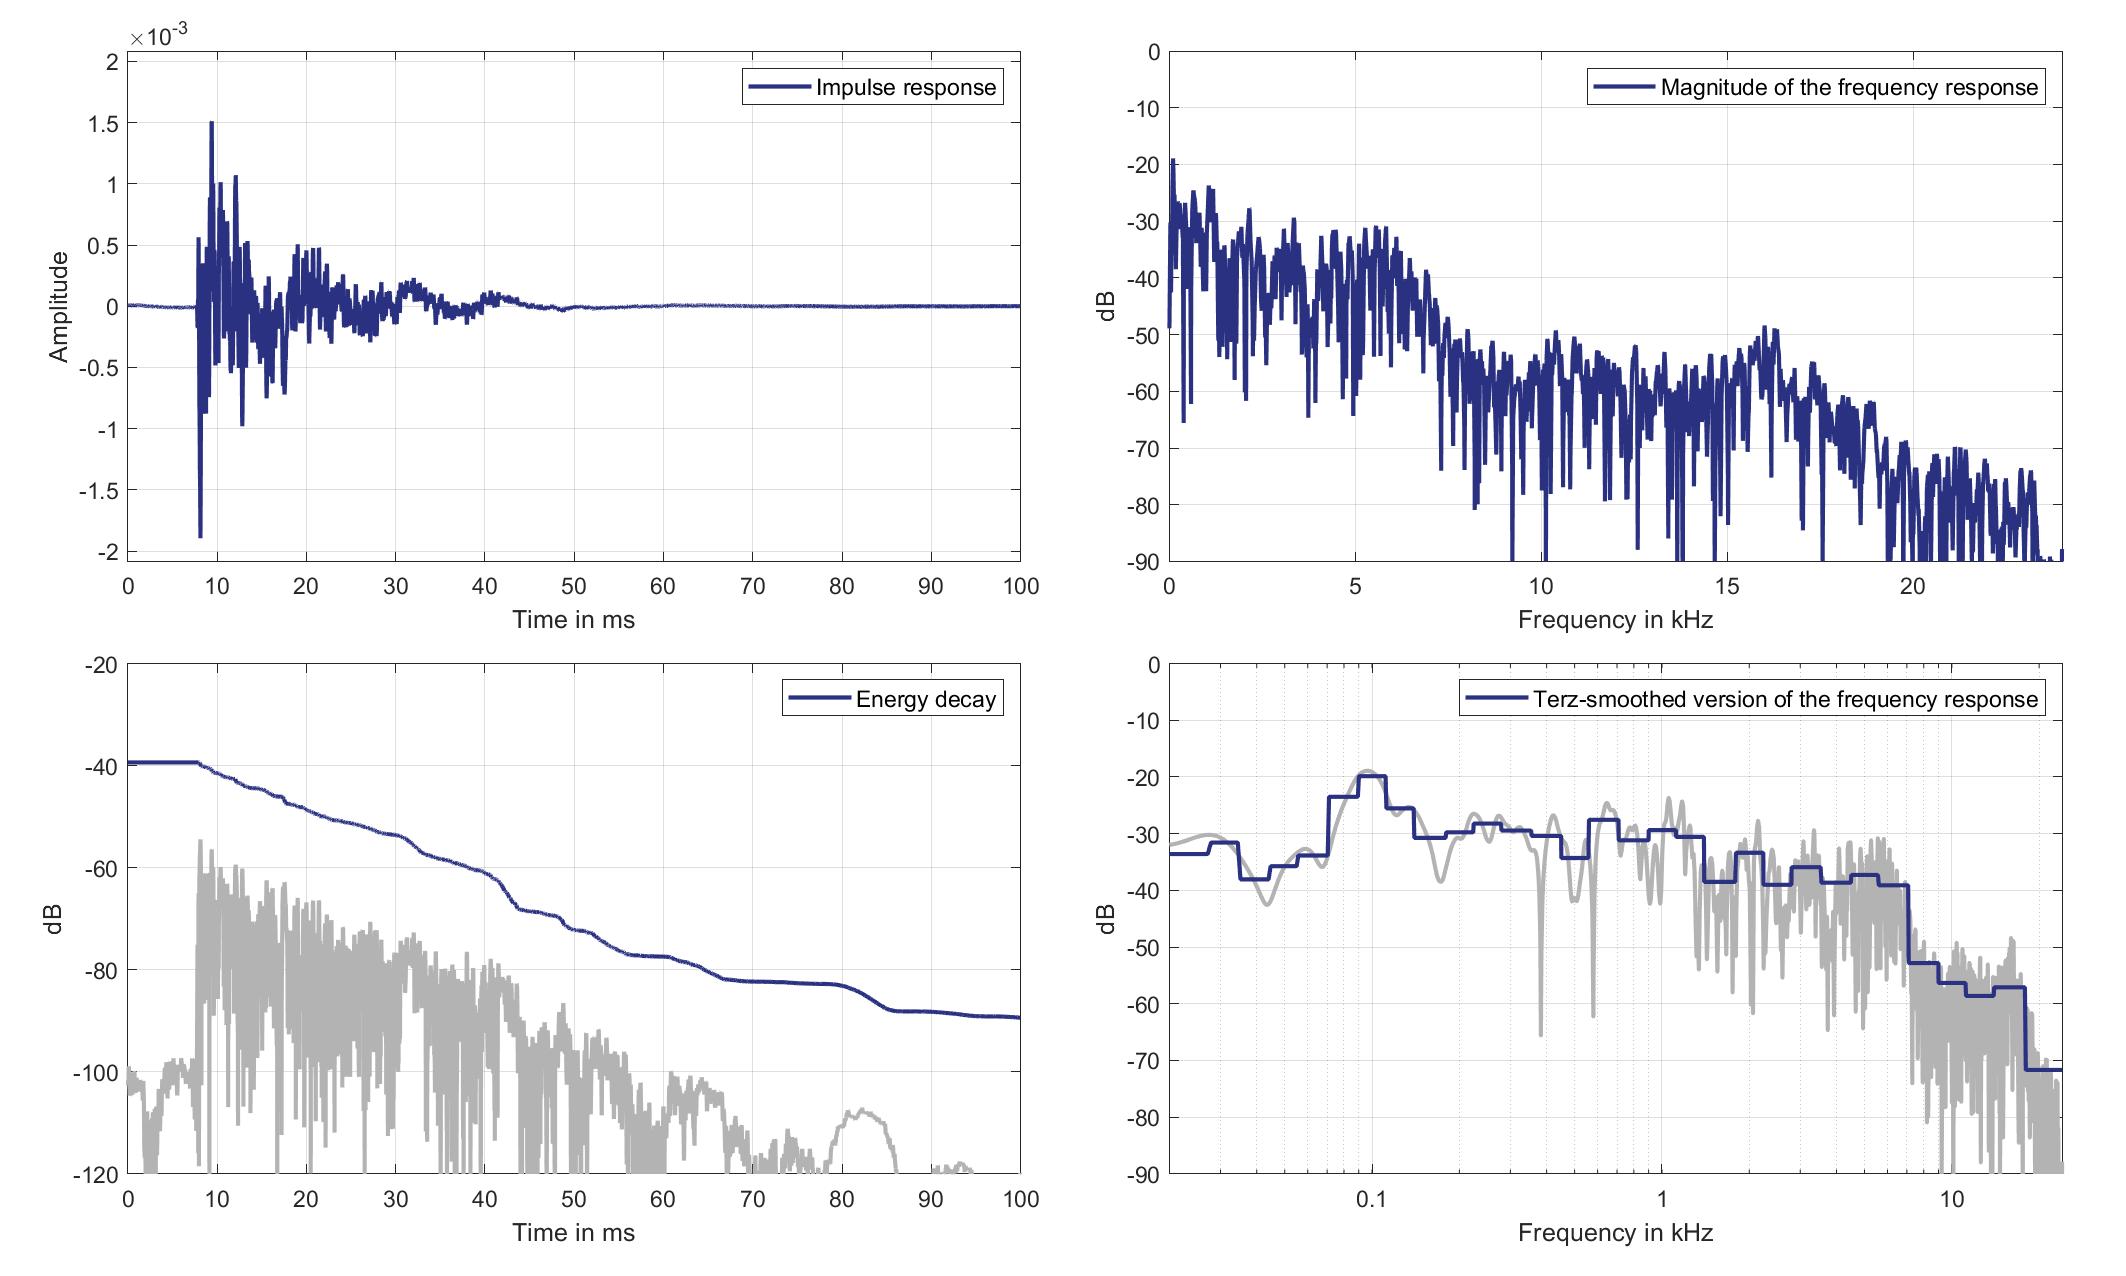
Download impulse response (in ".fir" format).
In the download section you can download all impulse response files as well as format explanation and Matlab as well as Python code examples for loading fir files.
Mic. 12
Standard Car Loudspeaker 2 (Lsp. 20) to Standard Car Microphone 12 (Mic. 12)
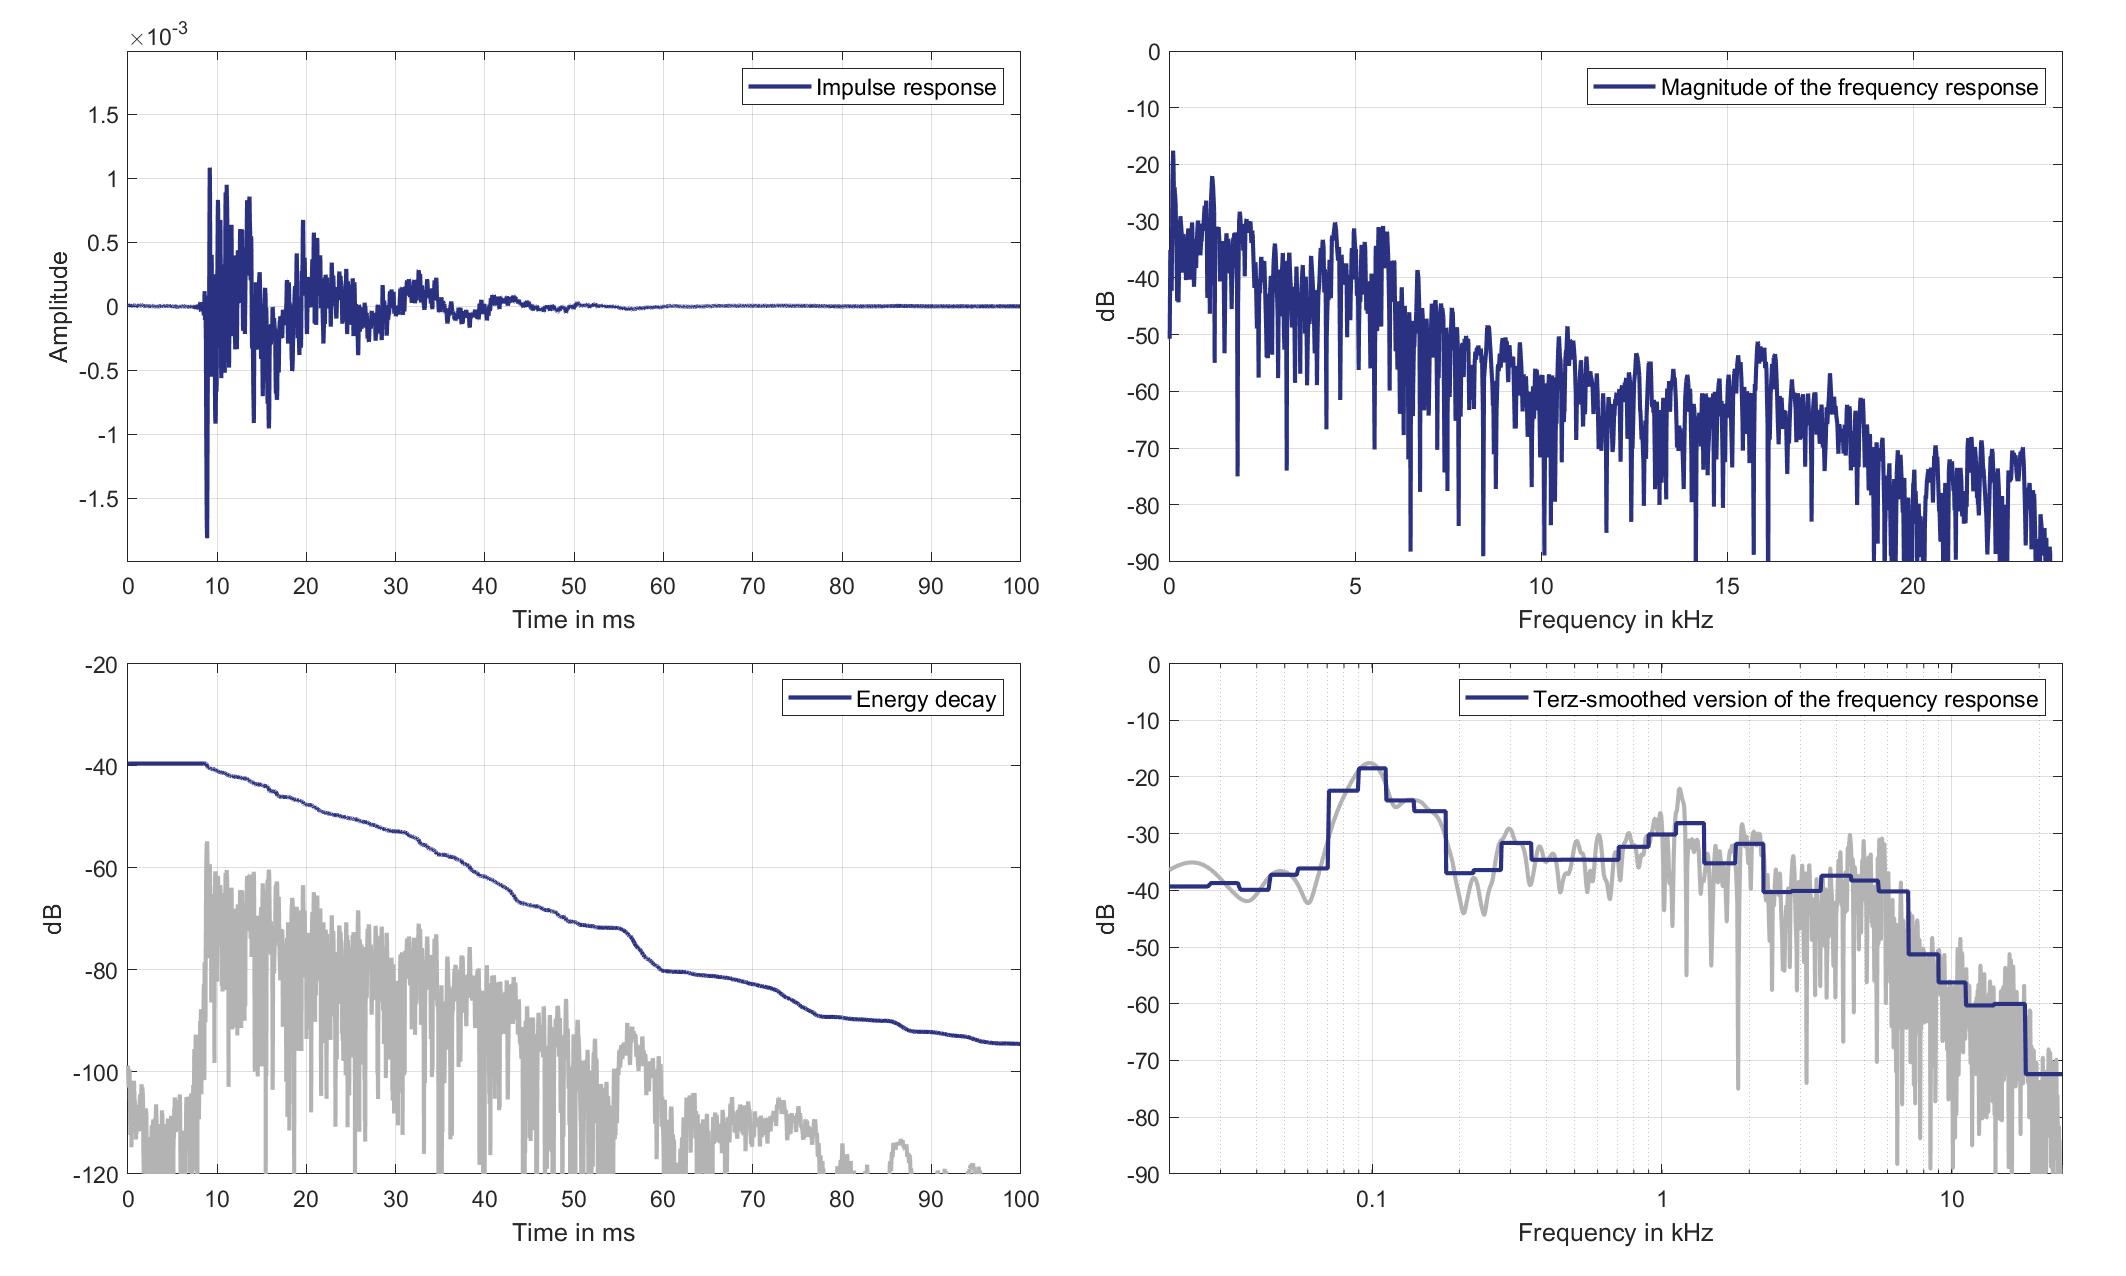
Download impulse response (in ".fir" format).
In the download section you can download all impulse response files as well as format explanation and Matlab as well as Python code examples for loading fir files.
Mic. 13
Standard Car Loudspeaker 2 (Lsp. 20) to Standard Car Microphone 13 (Mic. 13)
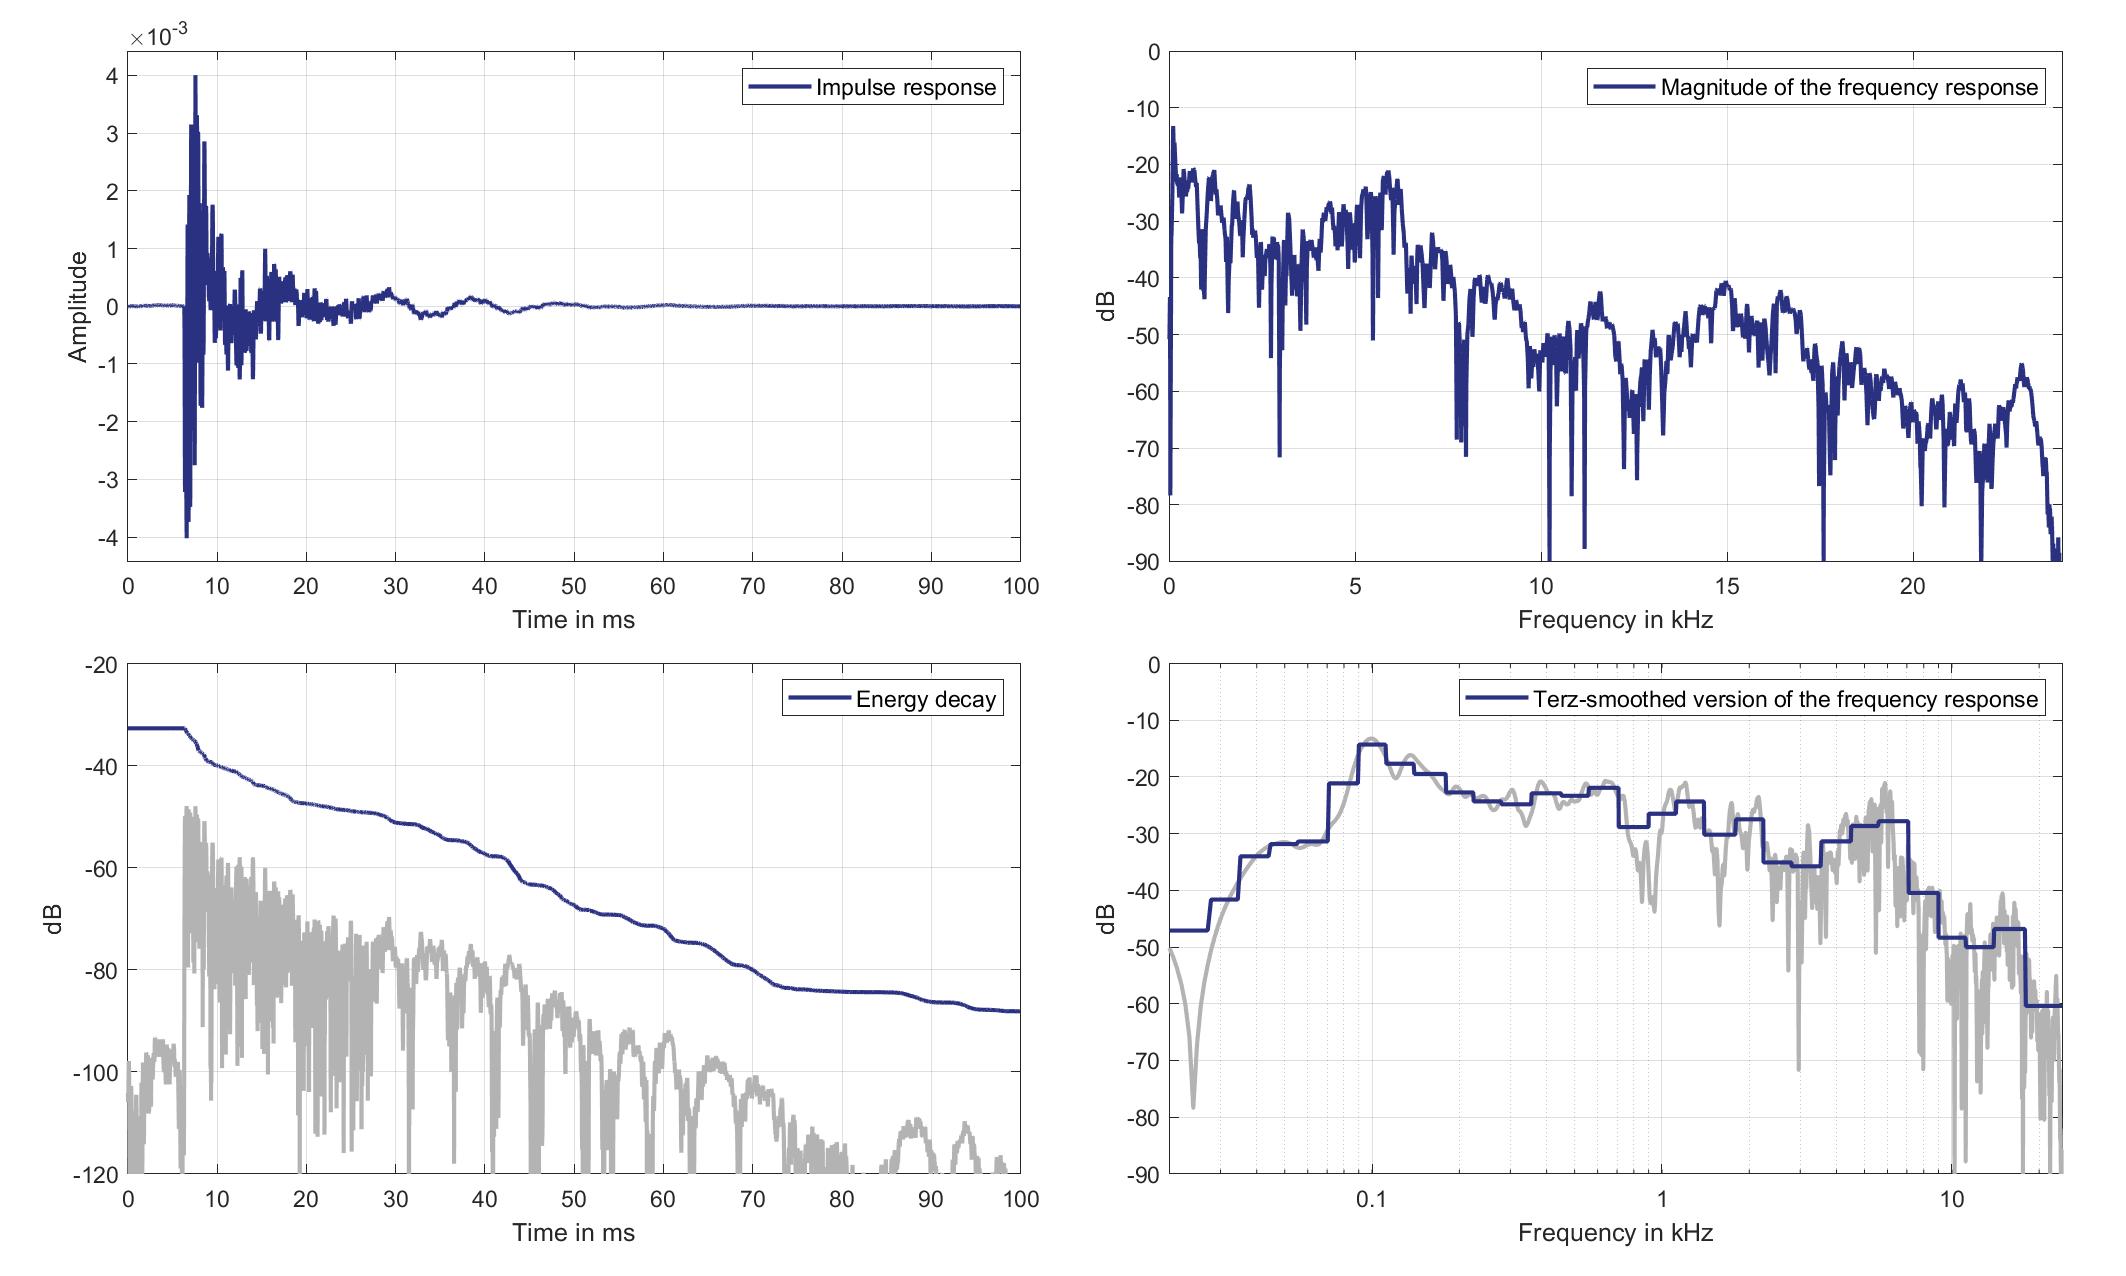
Download impulse response (in ".fir" format).
In the download section you can download all impulse response files as well as format explanation and Matlab as well as Python code examples for loading fir files.
Mic. 14
Standard Car Loudspeaker 2 (Lsp. 20) to Standard Car Microphone 14 (Mic. 14)
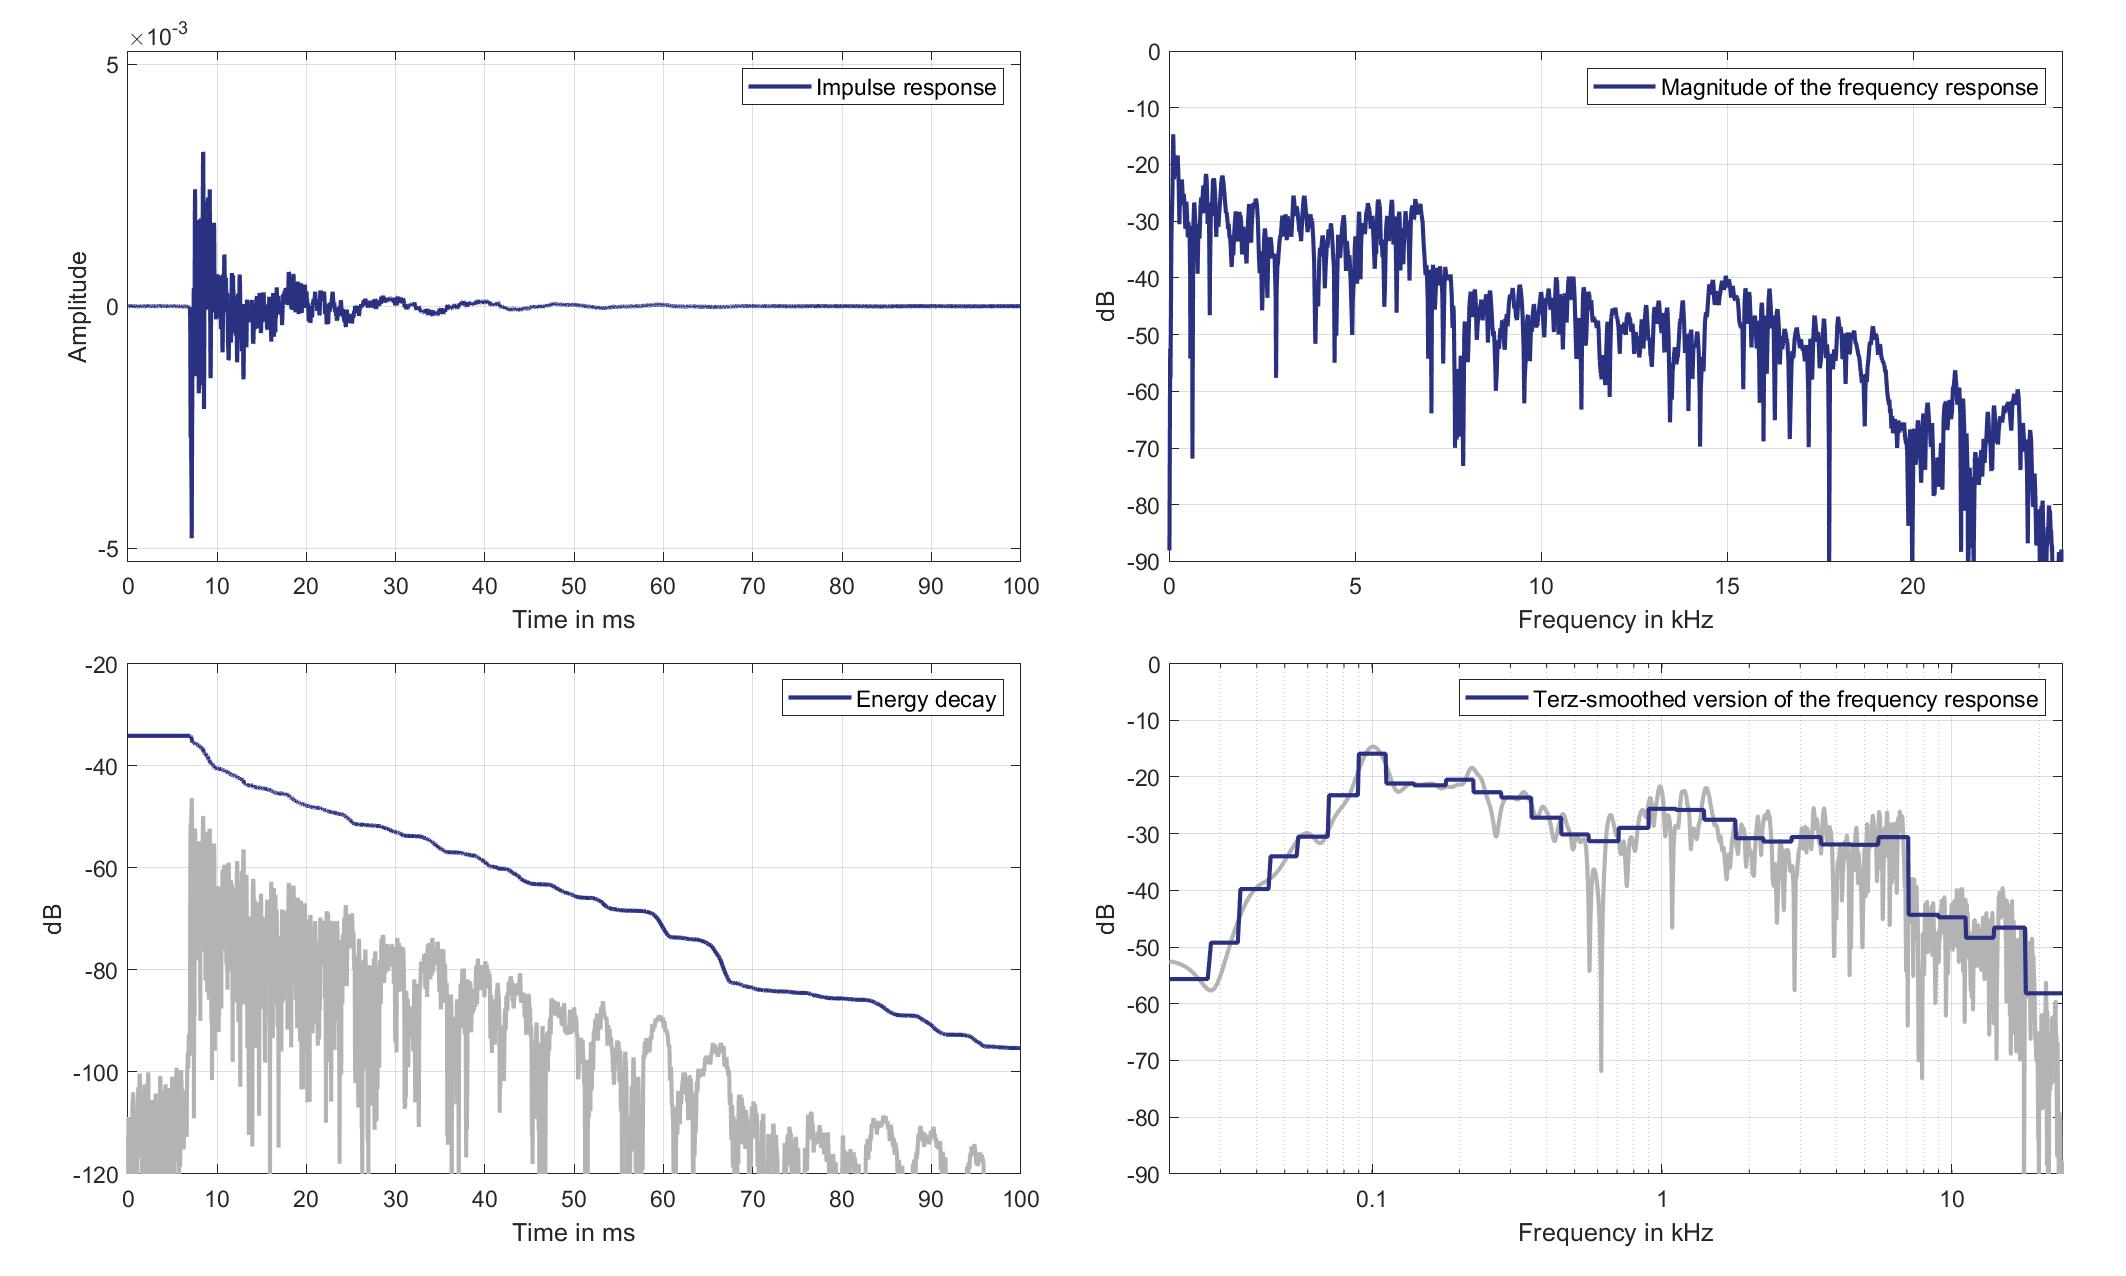
Download impulse response (in ".fir" format).
In the download section you can download all impulse response files as well as format explanation and Matlab as well as Python code examples for loading fir files.
Mic. 15
Standard Car Loudspeaker 2 (Lsp. 20) to Standard Car Microphone 15 (Mic. 15)
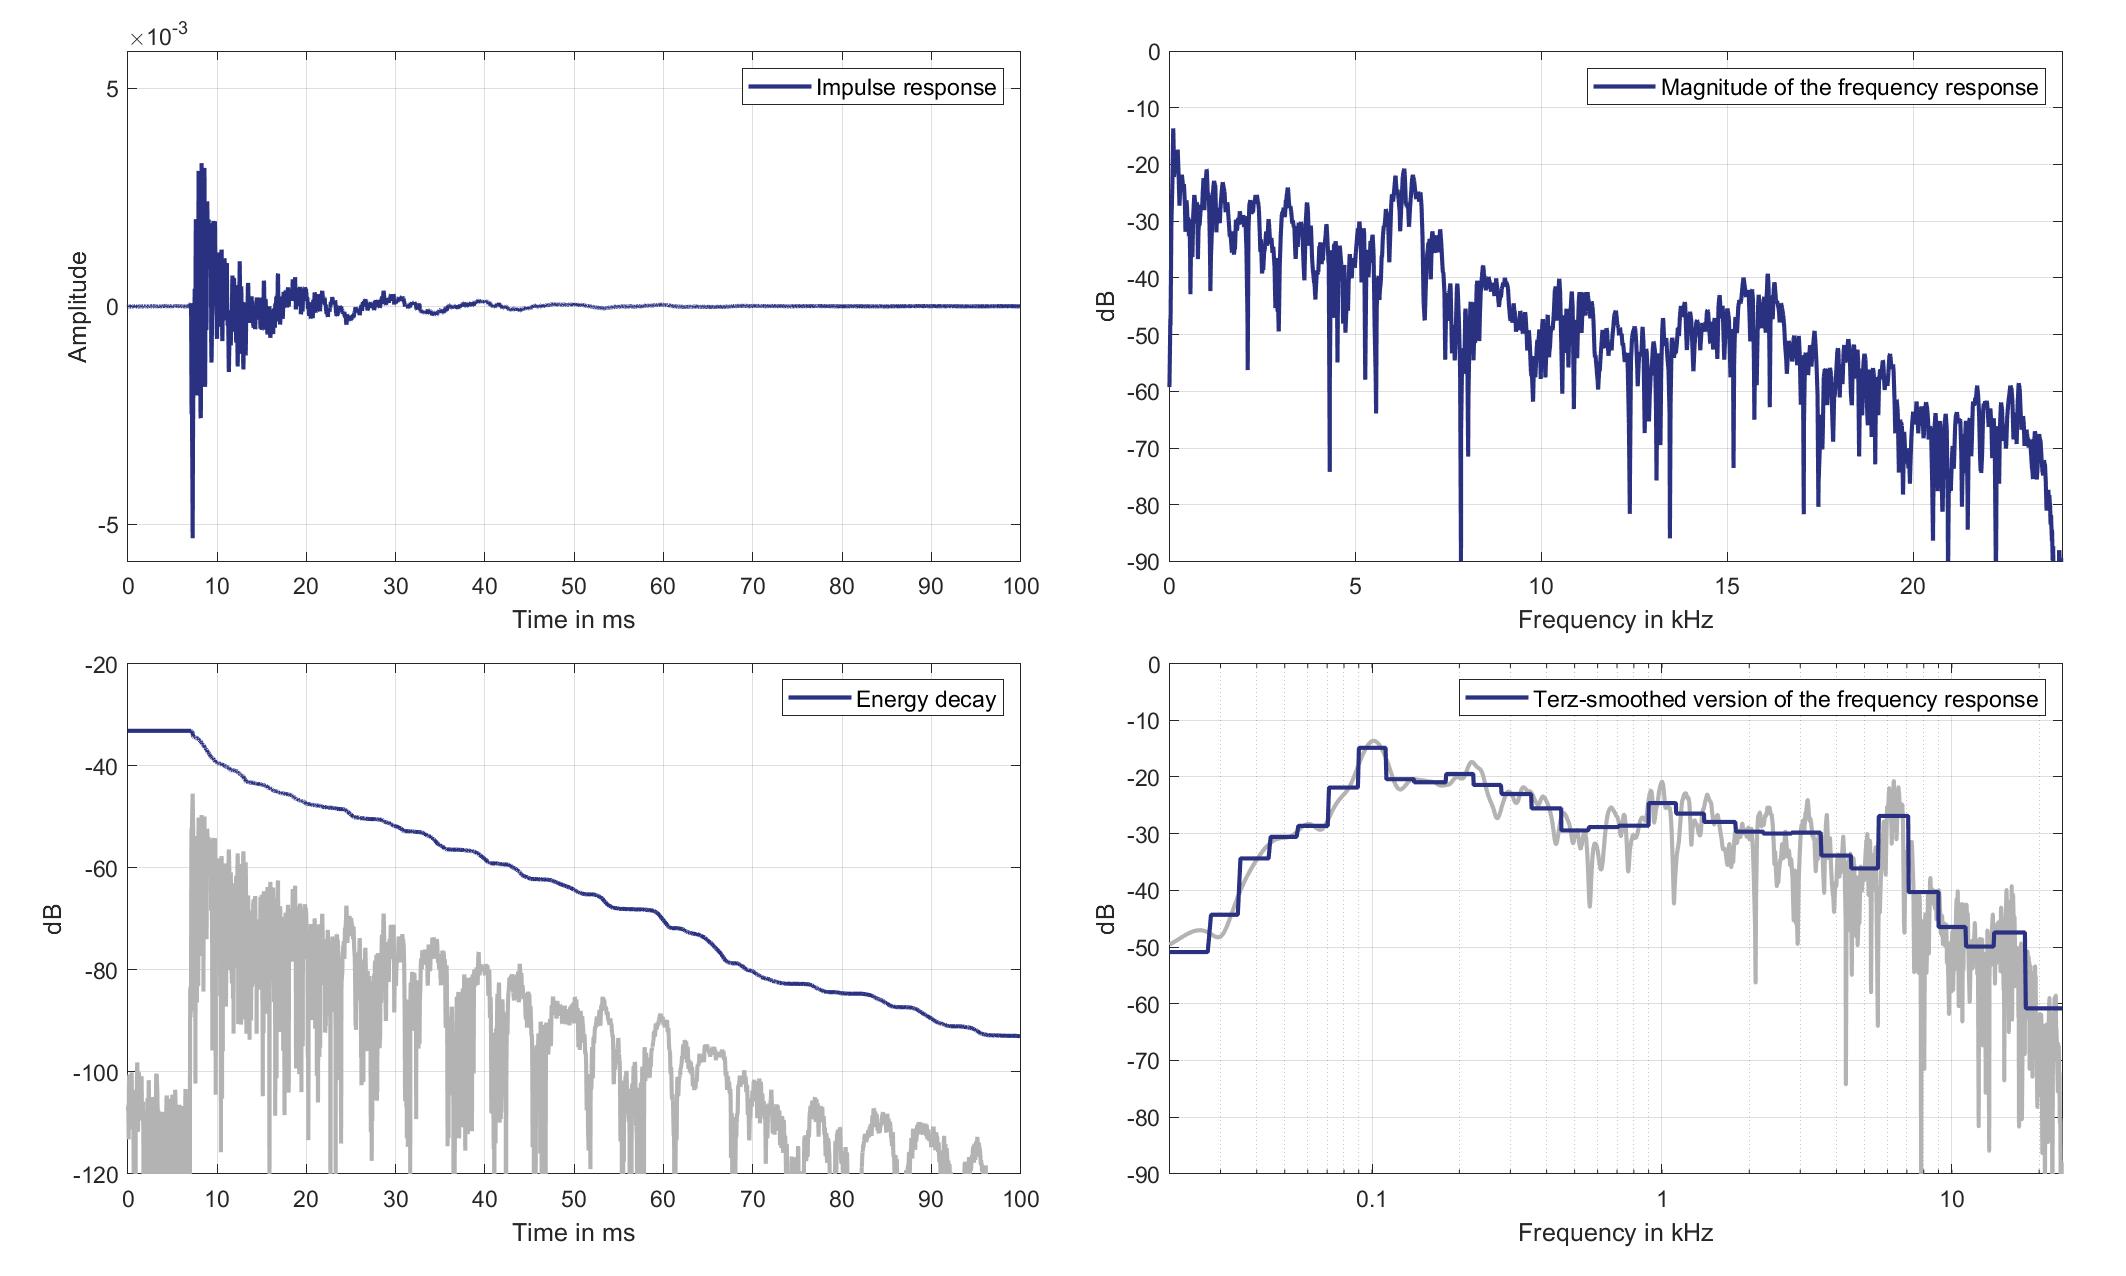
Download impulse response (in ".fir" format).
In the download section you can download all impulse response files as well as format explanation and Matlab as well as Python code examples for loading fir files.
Mic. 16
Standard Car Loudspeaker 2 (Lsp. 20) to Standard Car Microphone 16 (Mic. 16)
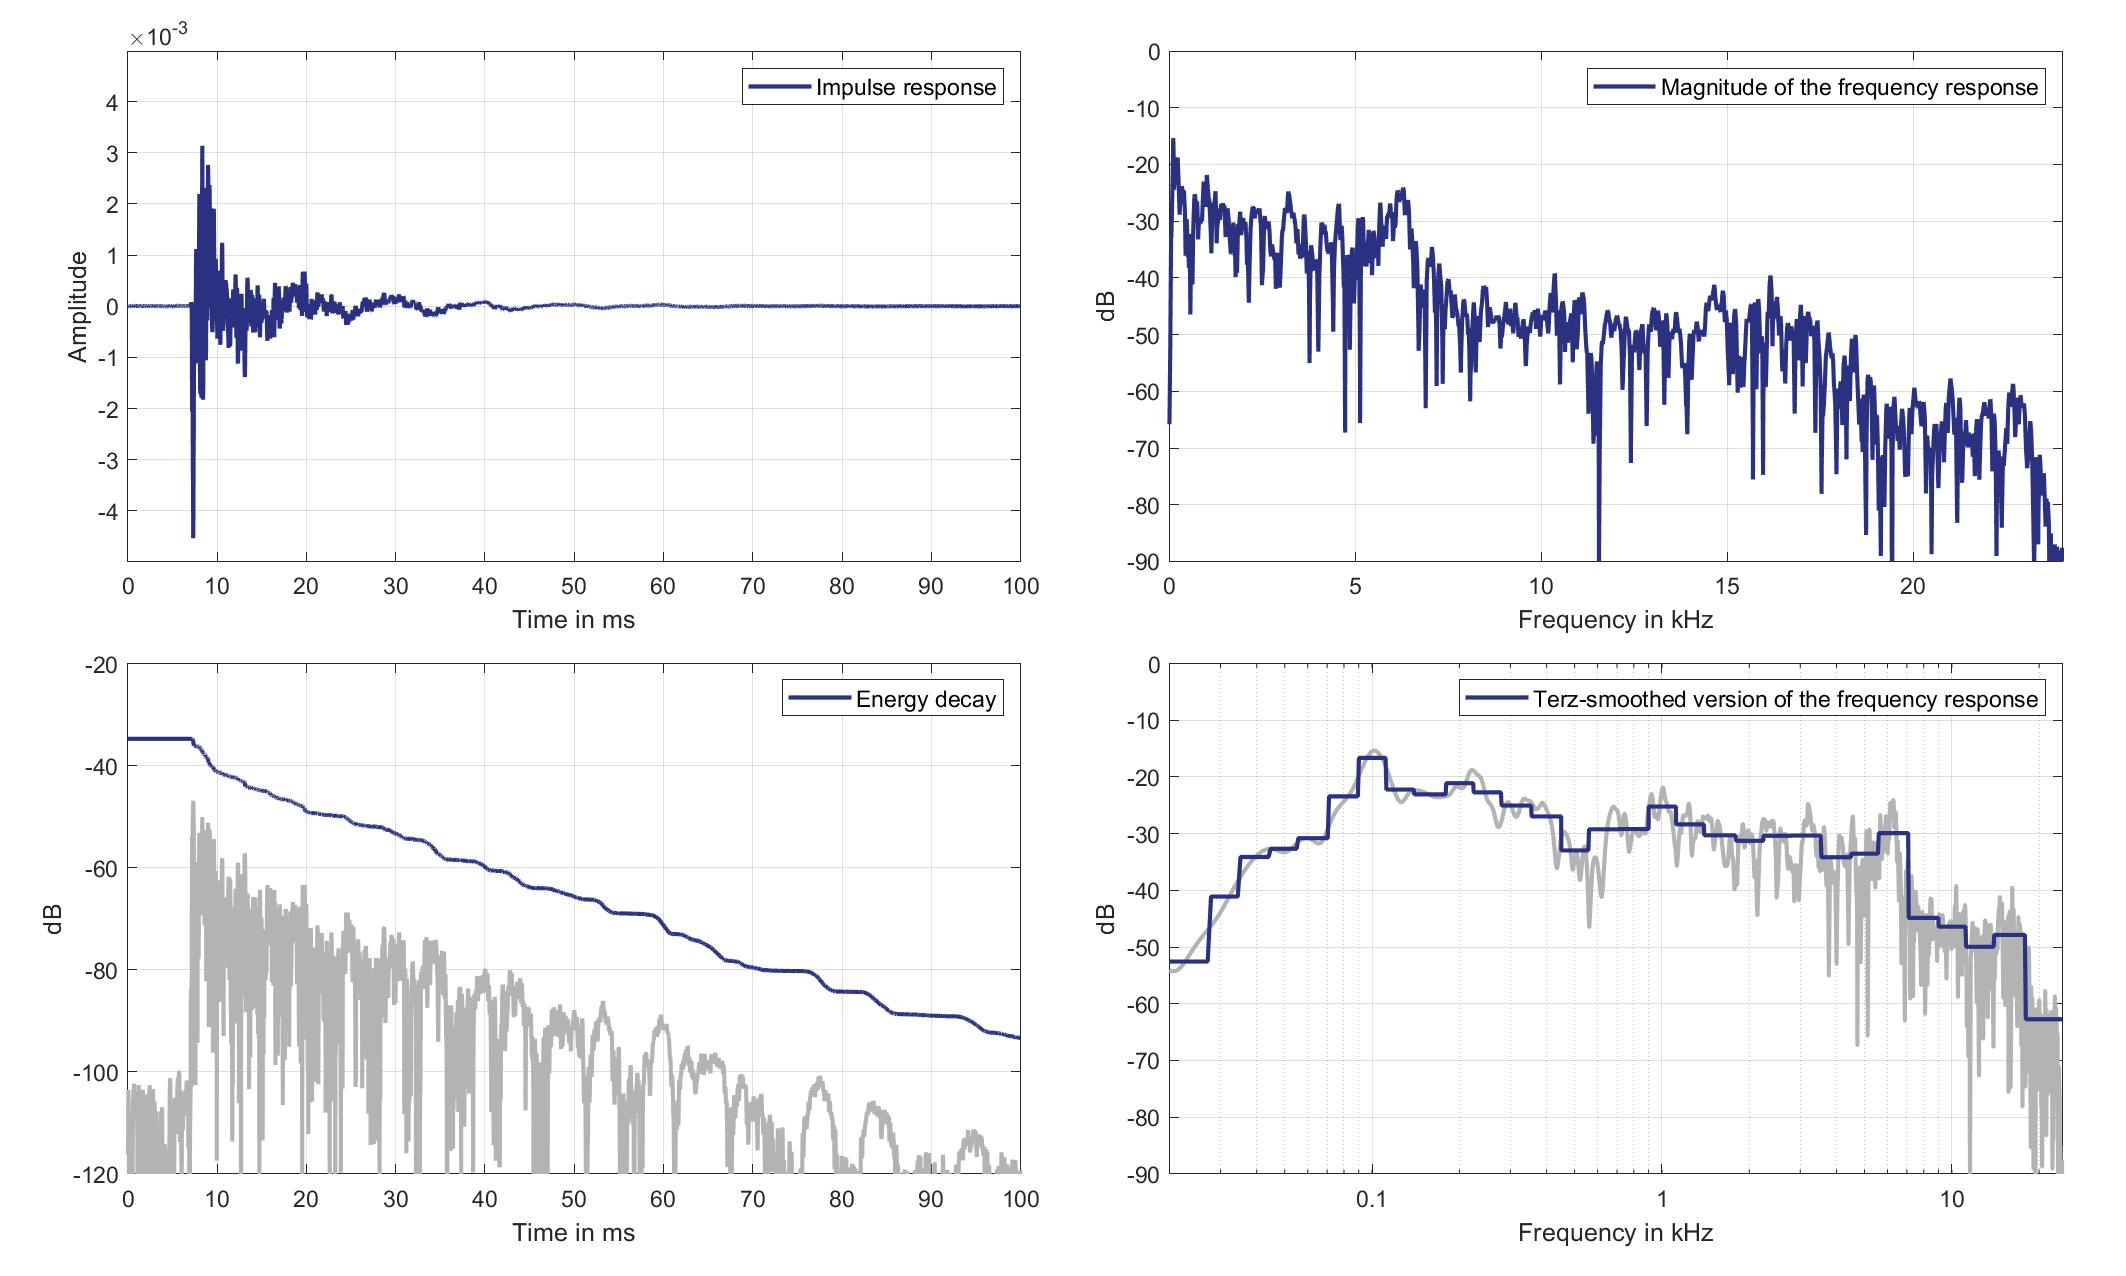
Download impulse response (in ".fir" format).
In the download section you can download all impulse response files as well as format explanation and Matlab as well as Python code examples for loading fir files.
Mic. 17
Standard Car Loudspeaker 2 (Lsp. 20) to Standard Car Microphone 17 (Mic. 17)
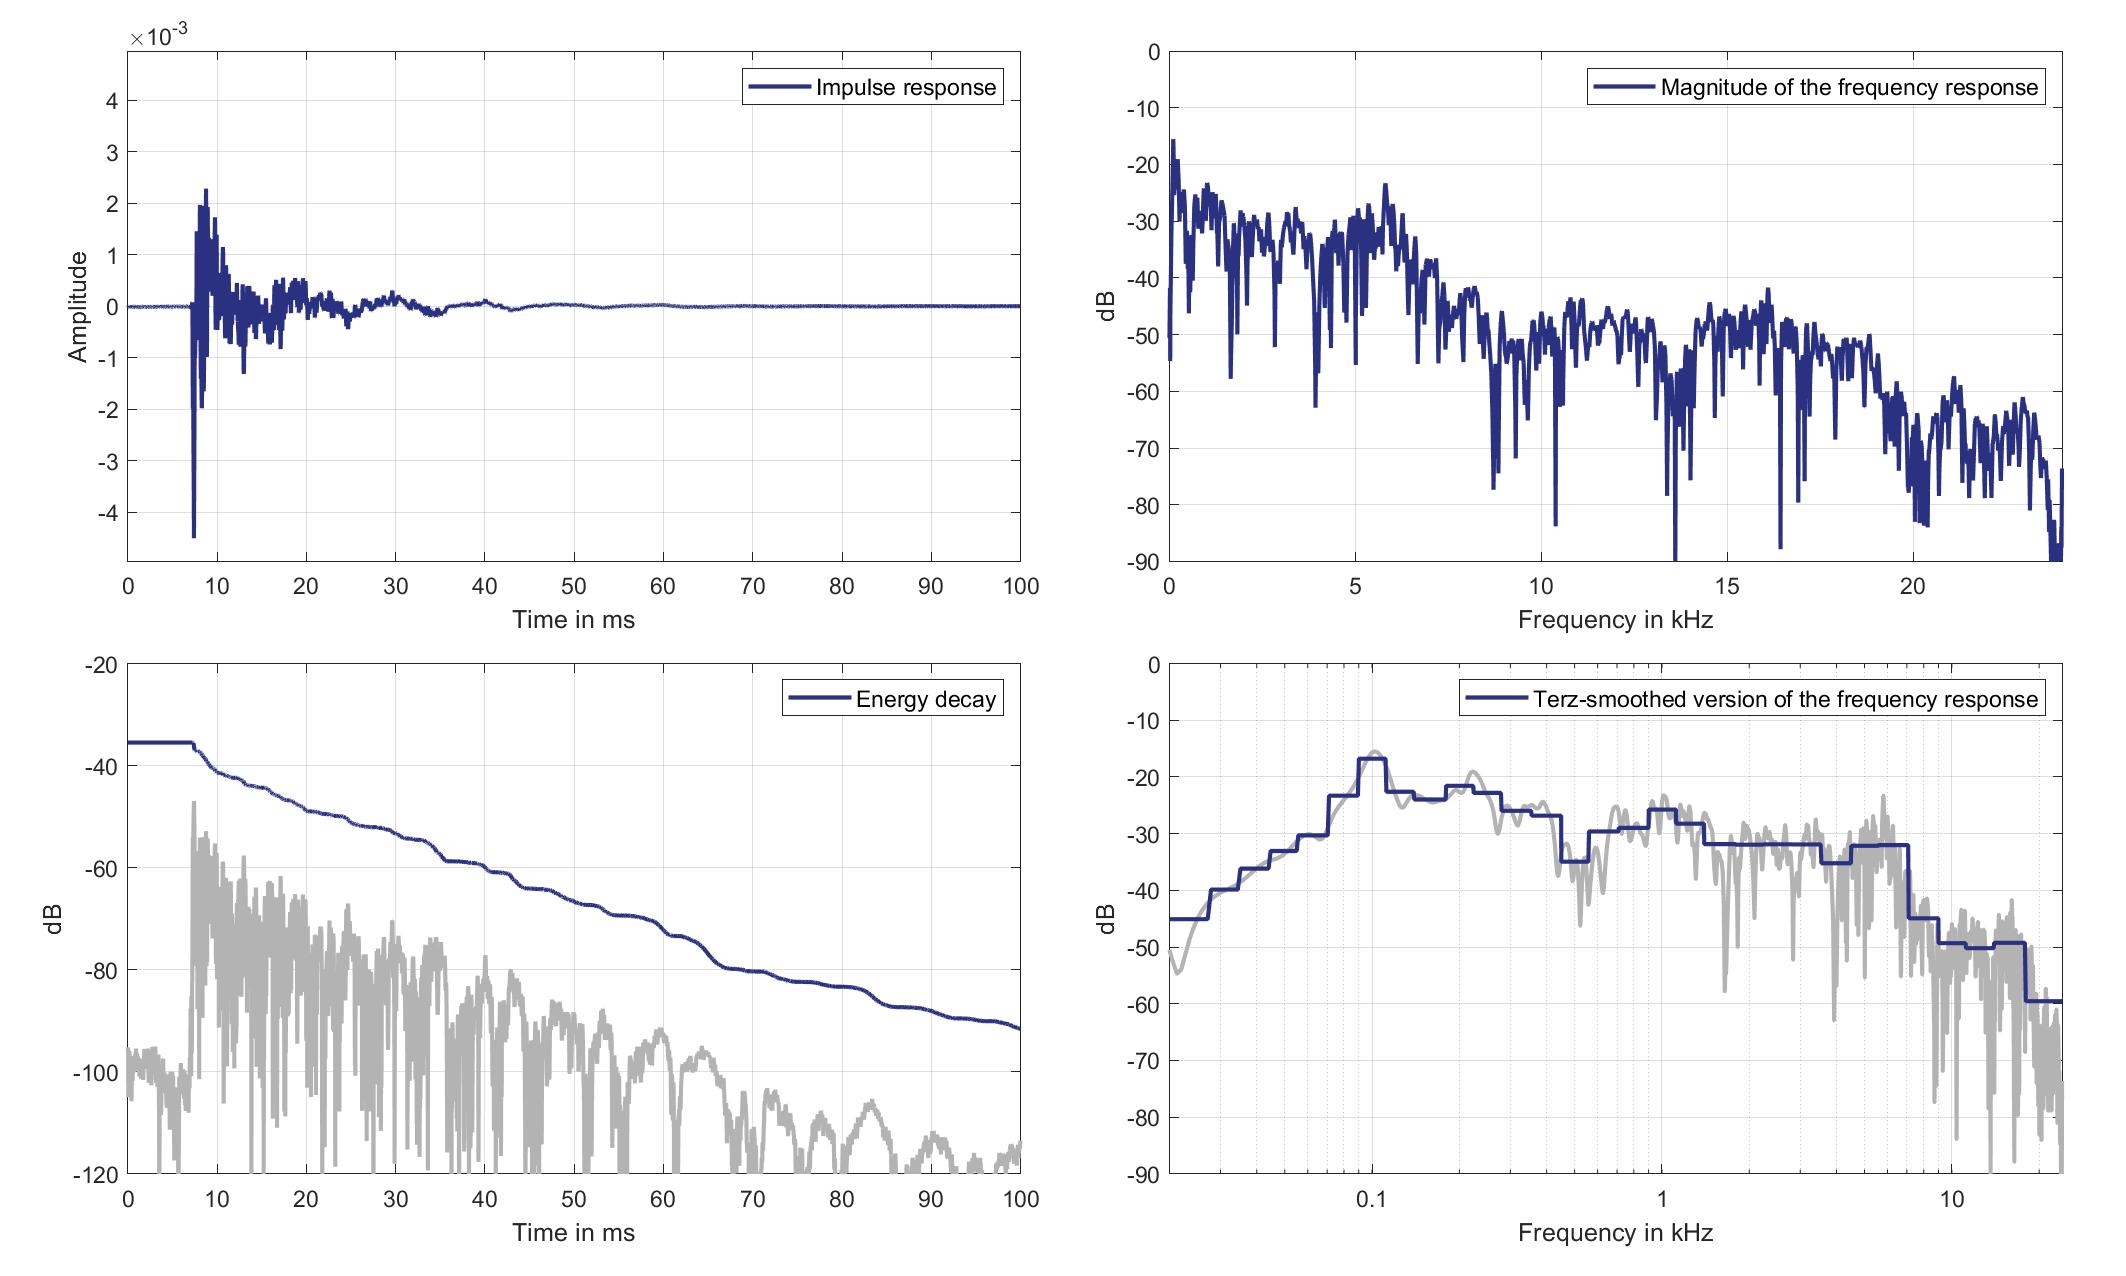
Download impulse response (in ".fir" format).
In the download section you can download all impulse response files as well as format explanation and Matlab as well as Python code examples for loading fir files.
Mic. 18
Standard Car Loudspeaker 2 (Lsp. 20) to Standard Car Microphone 18 (Mic. 18)

Download impulse response (in ".fir" format).
In the download section you can download all impulse response files as well as format explanation and Matlab as well as Python code examples for loading fir files.
Lsp. 21
Mic. 0
Standard Car Loudspeaker 3 (Lsp. 21) to Standard Car Microphone 0 (Mic. 0)
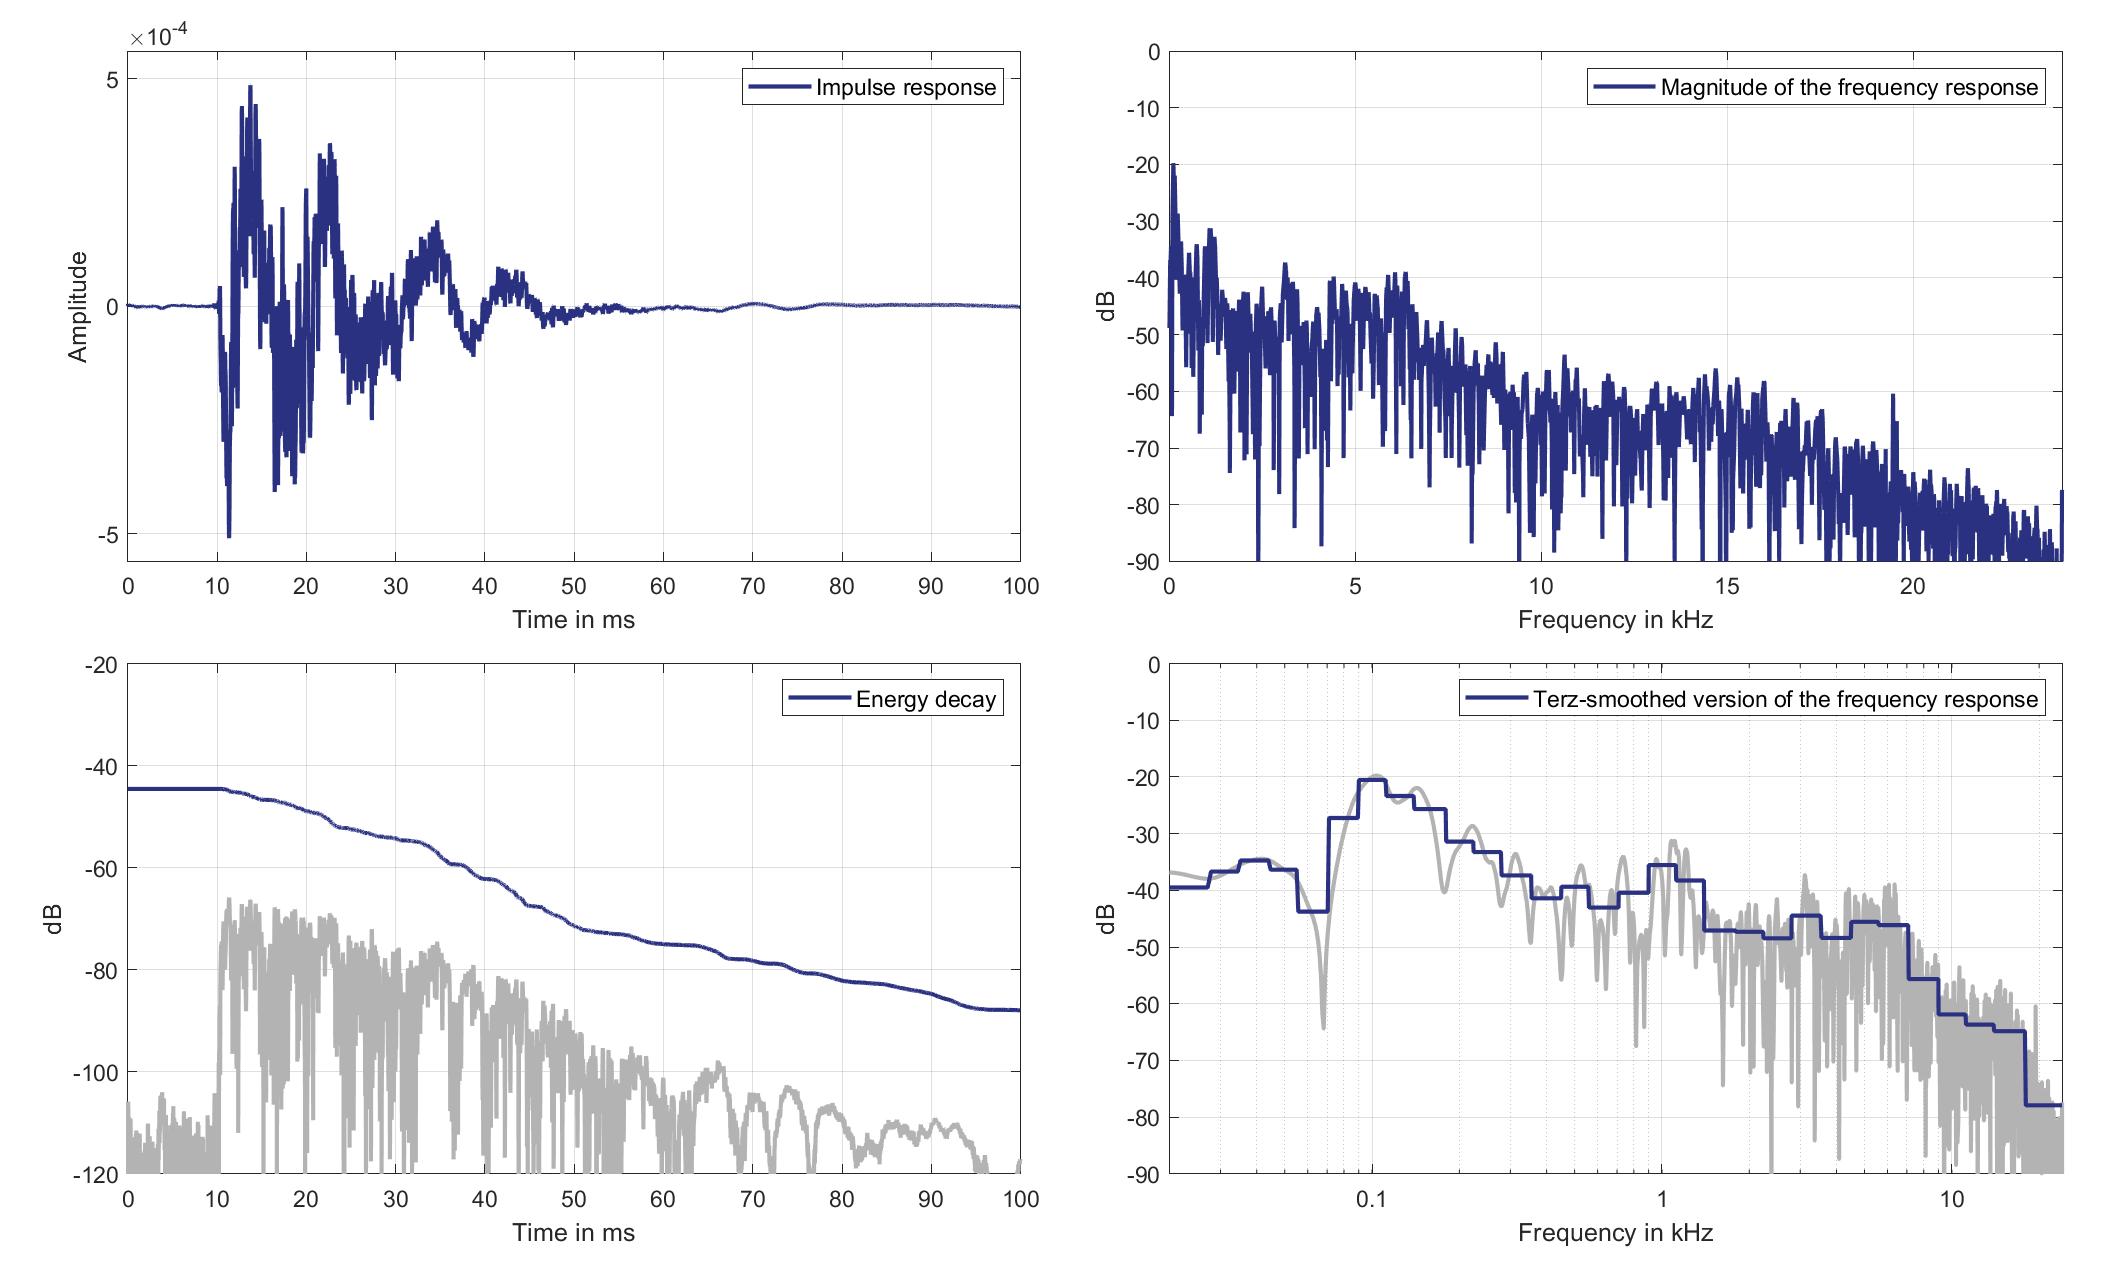
Download impulse response (in ".fir" format).
In the download section you can download all impulse response files as well as format explanation and Matlab as well as Python code examples for loading fir files.
Mic. 1
Standard Car Loudspeaker 3 (Lsp. 21) to Standard Car Microphone 1 (Mic. 1)
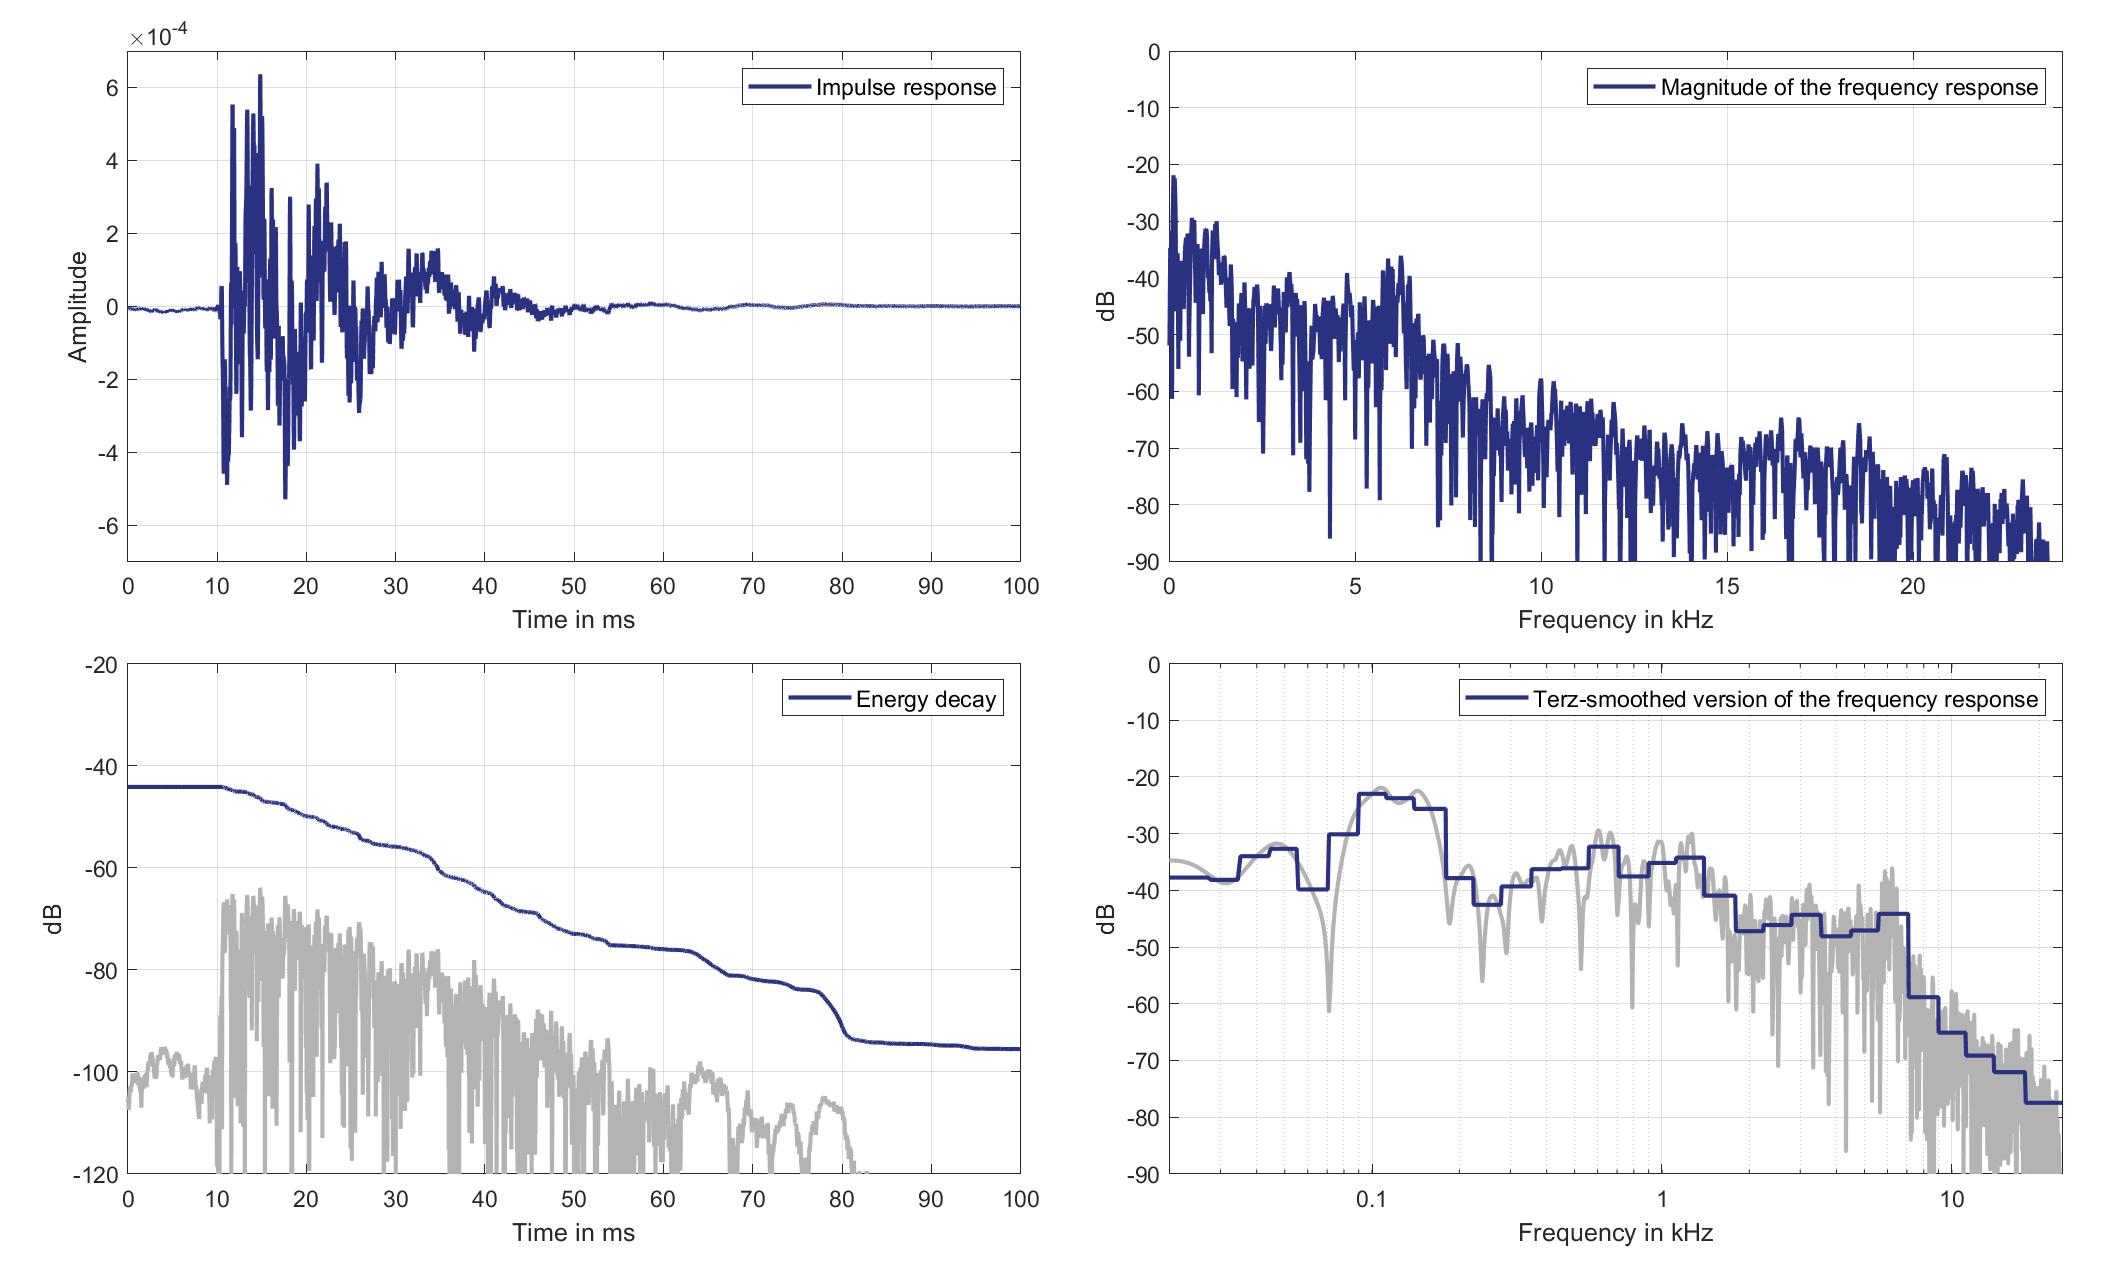
Download impulse response (in ".fir" format).
In the download section you can download all impulse response files as well as format explanation and Matlab as well as Python code examples for loading fir files.
Mic. 2
Standard Car Loudspeaker 3 (Lsp. 21) to Standard Car Microphone 2 (Mic. 2)
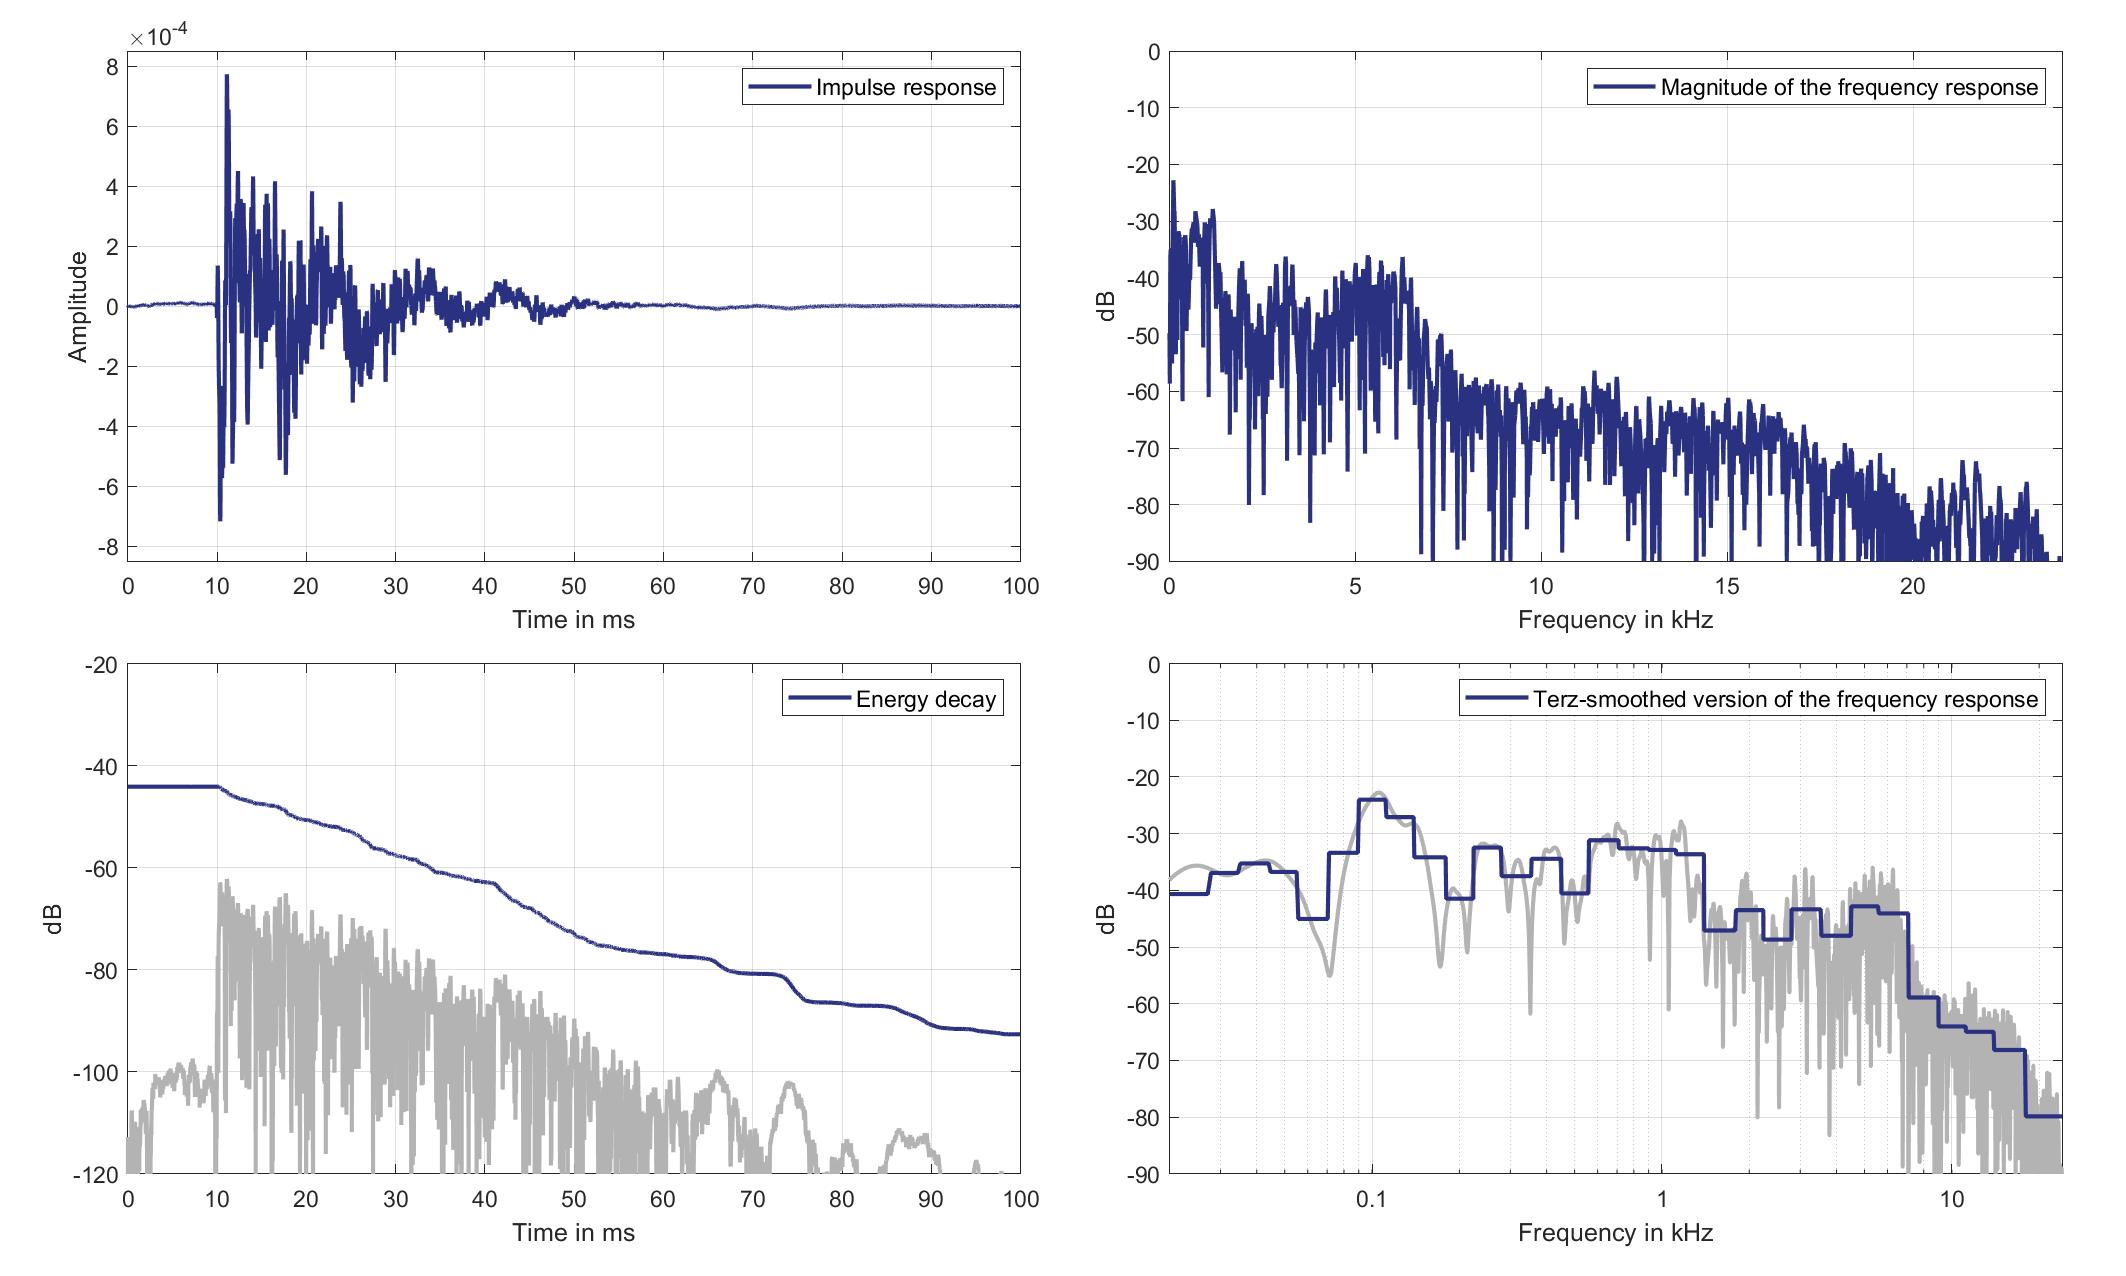
Download impulse response (in ".fir" format).
In the download section you can download all impulse response files as well as format explanation and Matlab as well as Python code examples for loading fir files.
Mic. 3
Standard Car Loudspeaker 3 (Lsp. 21) to Standard Car Microphone 3 (Mic. 3)
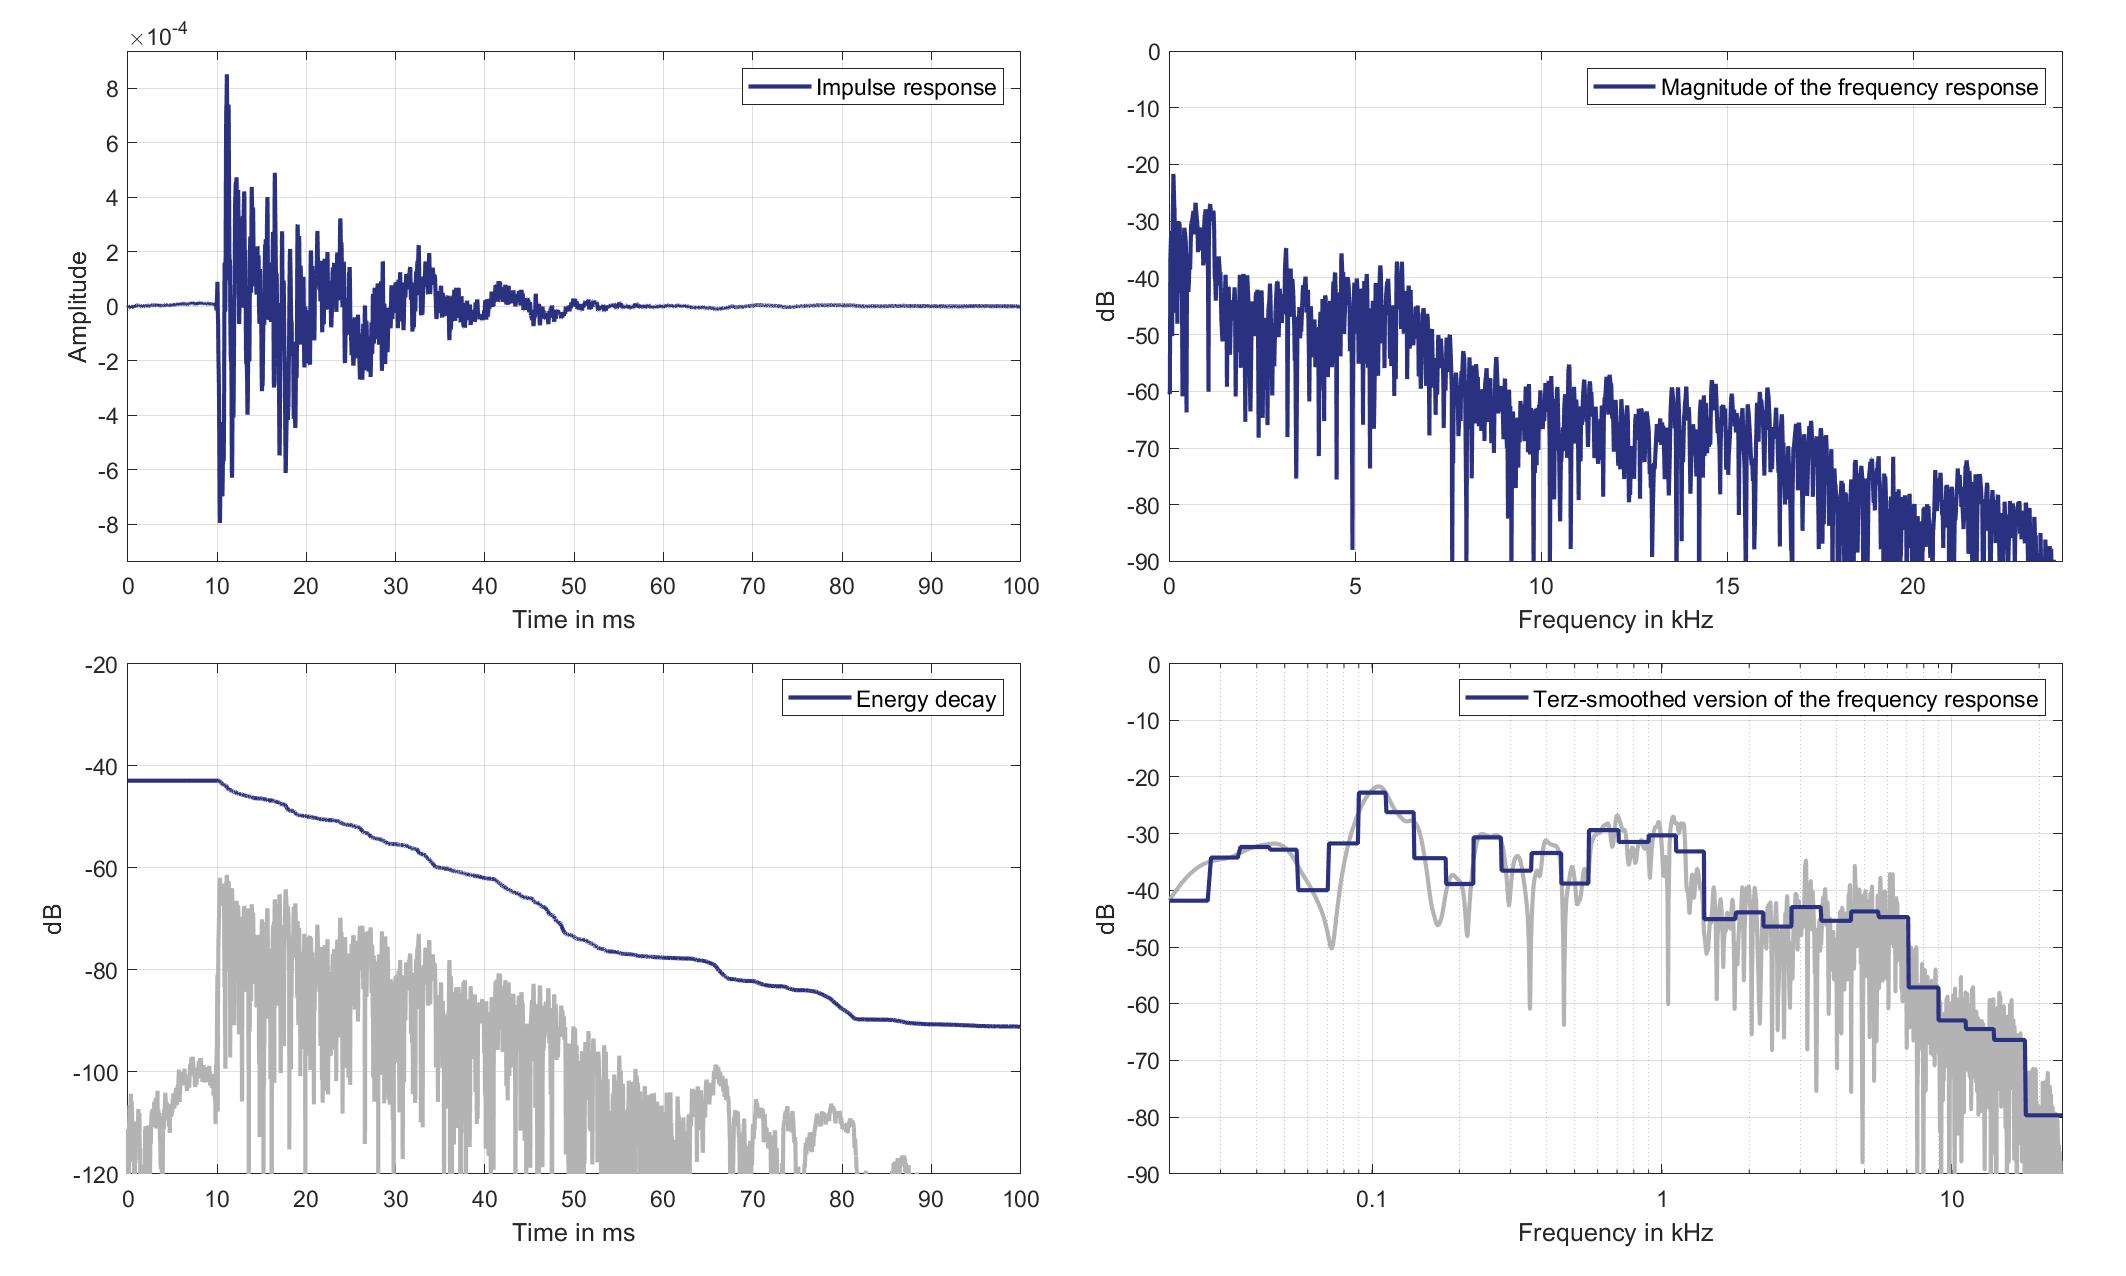
Download impulse response (in ".fir" format).
In the download section you can download all impulse response files as well as format explanation and Matlab as well as Python code examples for loading fir files.
Mic. 4
Standard Car Loudspeaker 3 (Lsp. 21) to Standard Car Microphone 4 (Mic. 4)
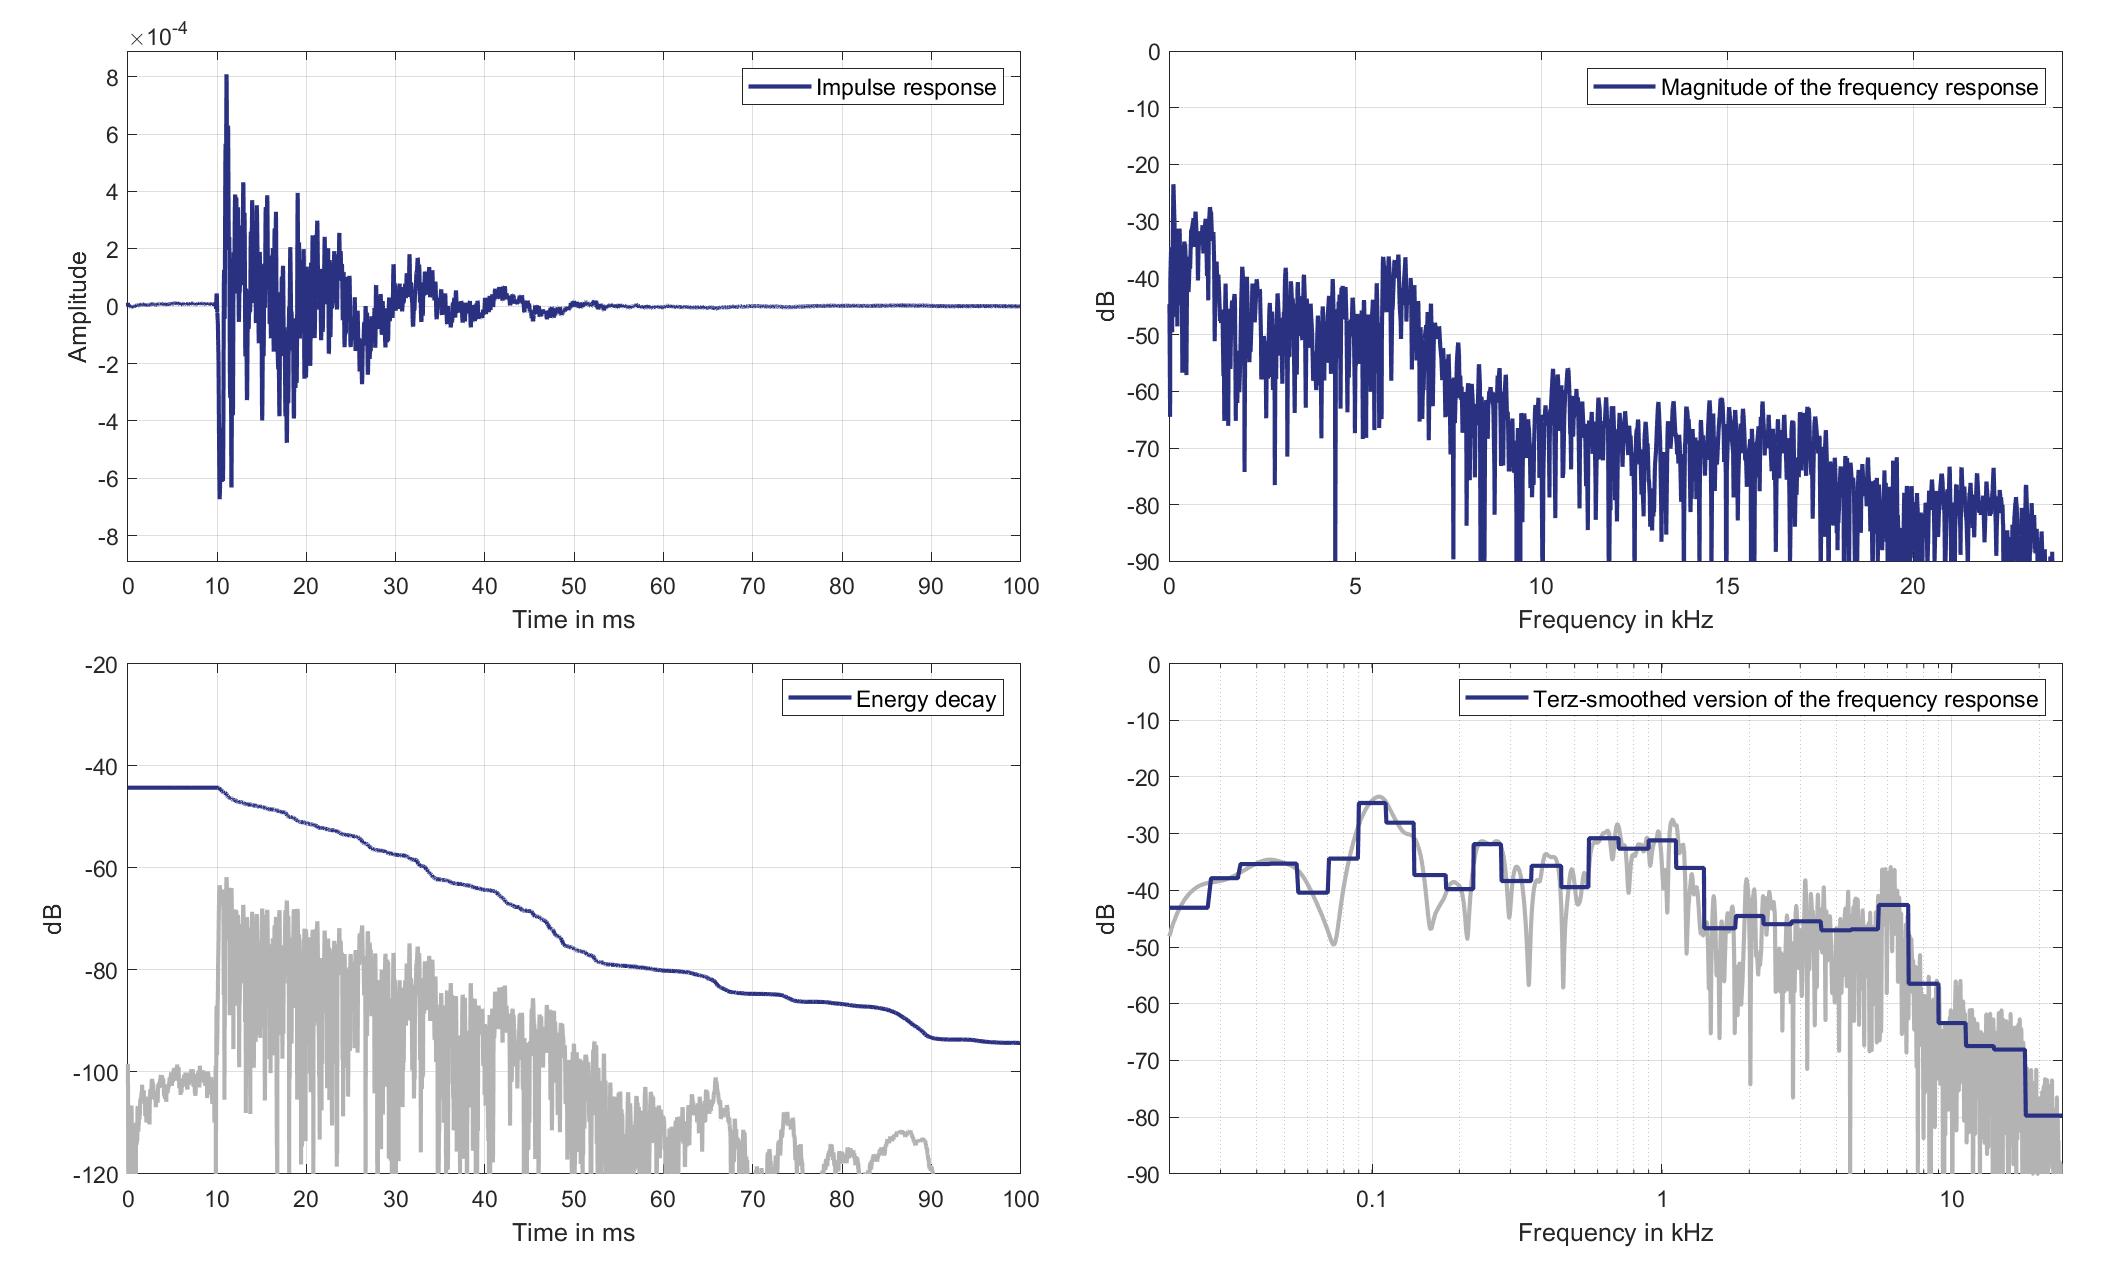
Download impulse response (in ".fir" format).
In the download section you can download all impulse response files as well as format explanation and Matlab as well as Python code examples for loading fir files.
Mic. 5
Standard Car Loudspeaker 3 (Lsp. 21) to Standard Car Microphone 5 (Mic. 5)

Download impulse response (in ".fir" format).
In the download section you can download all impulse response files as well as format explanation and Matlab as well as Python code examples for loading fir files.
Mic. 6
Standard Car Loudspeaker 3 (Lsp. 21) to Standard Car Microphone 6 (Mic. 6)
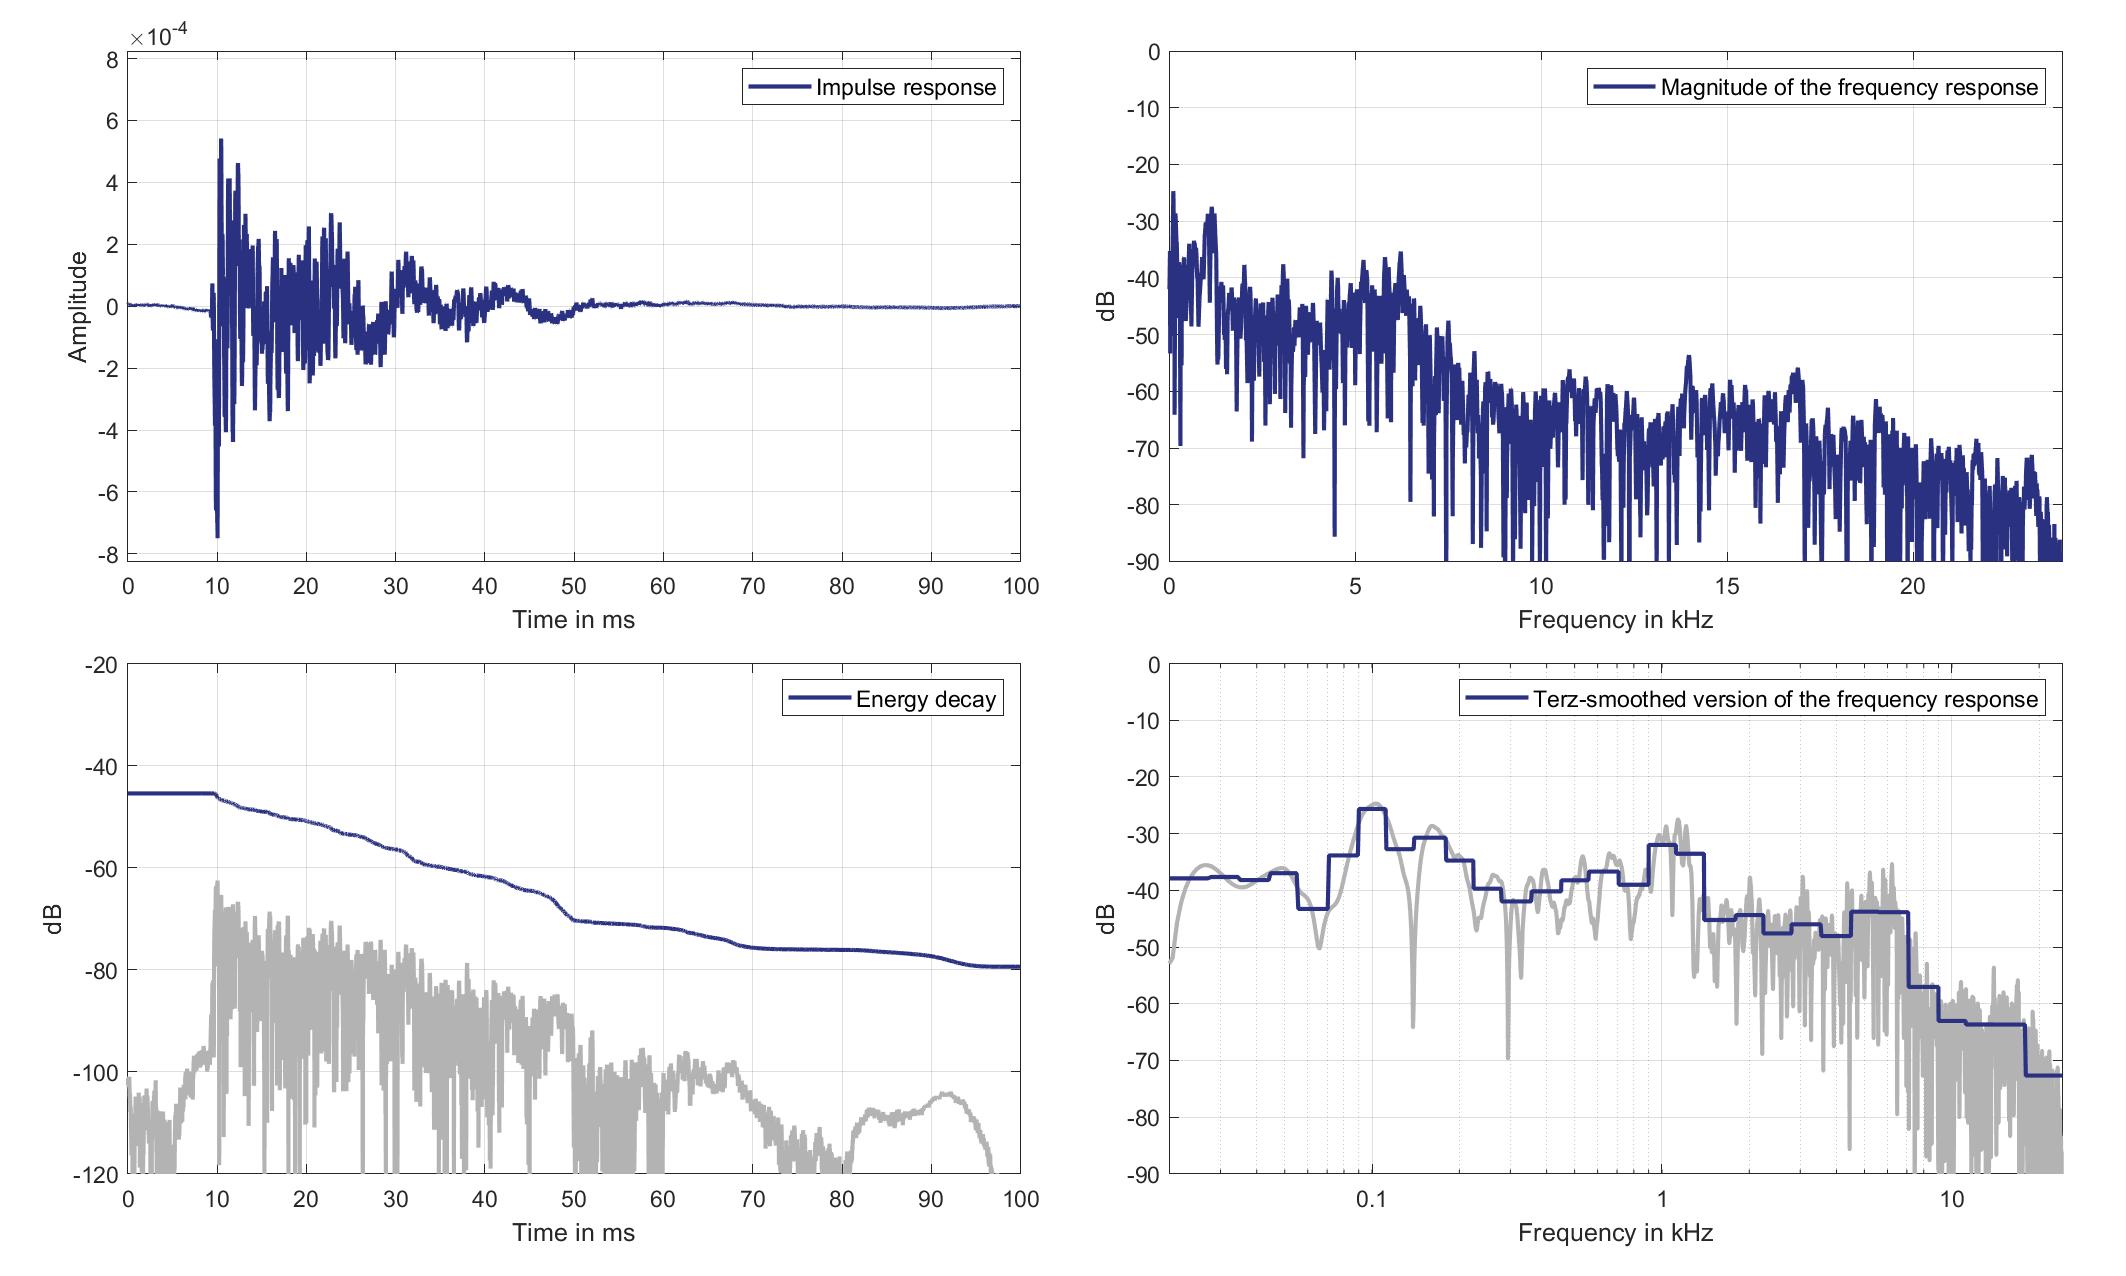
Download impulse response (in ".fir" format).
In the download section you can download all impulse response files as well as format explanation and Matlab as well as Python code examples for loading fir files.
Mic. 7
Standard Car Loudspeaker 3 (Lsp. 21) to Standard Car Microphone 7 (Mic. 7)
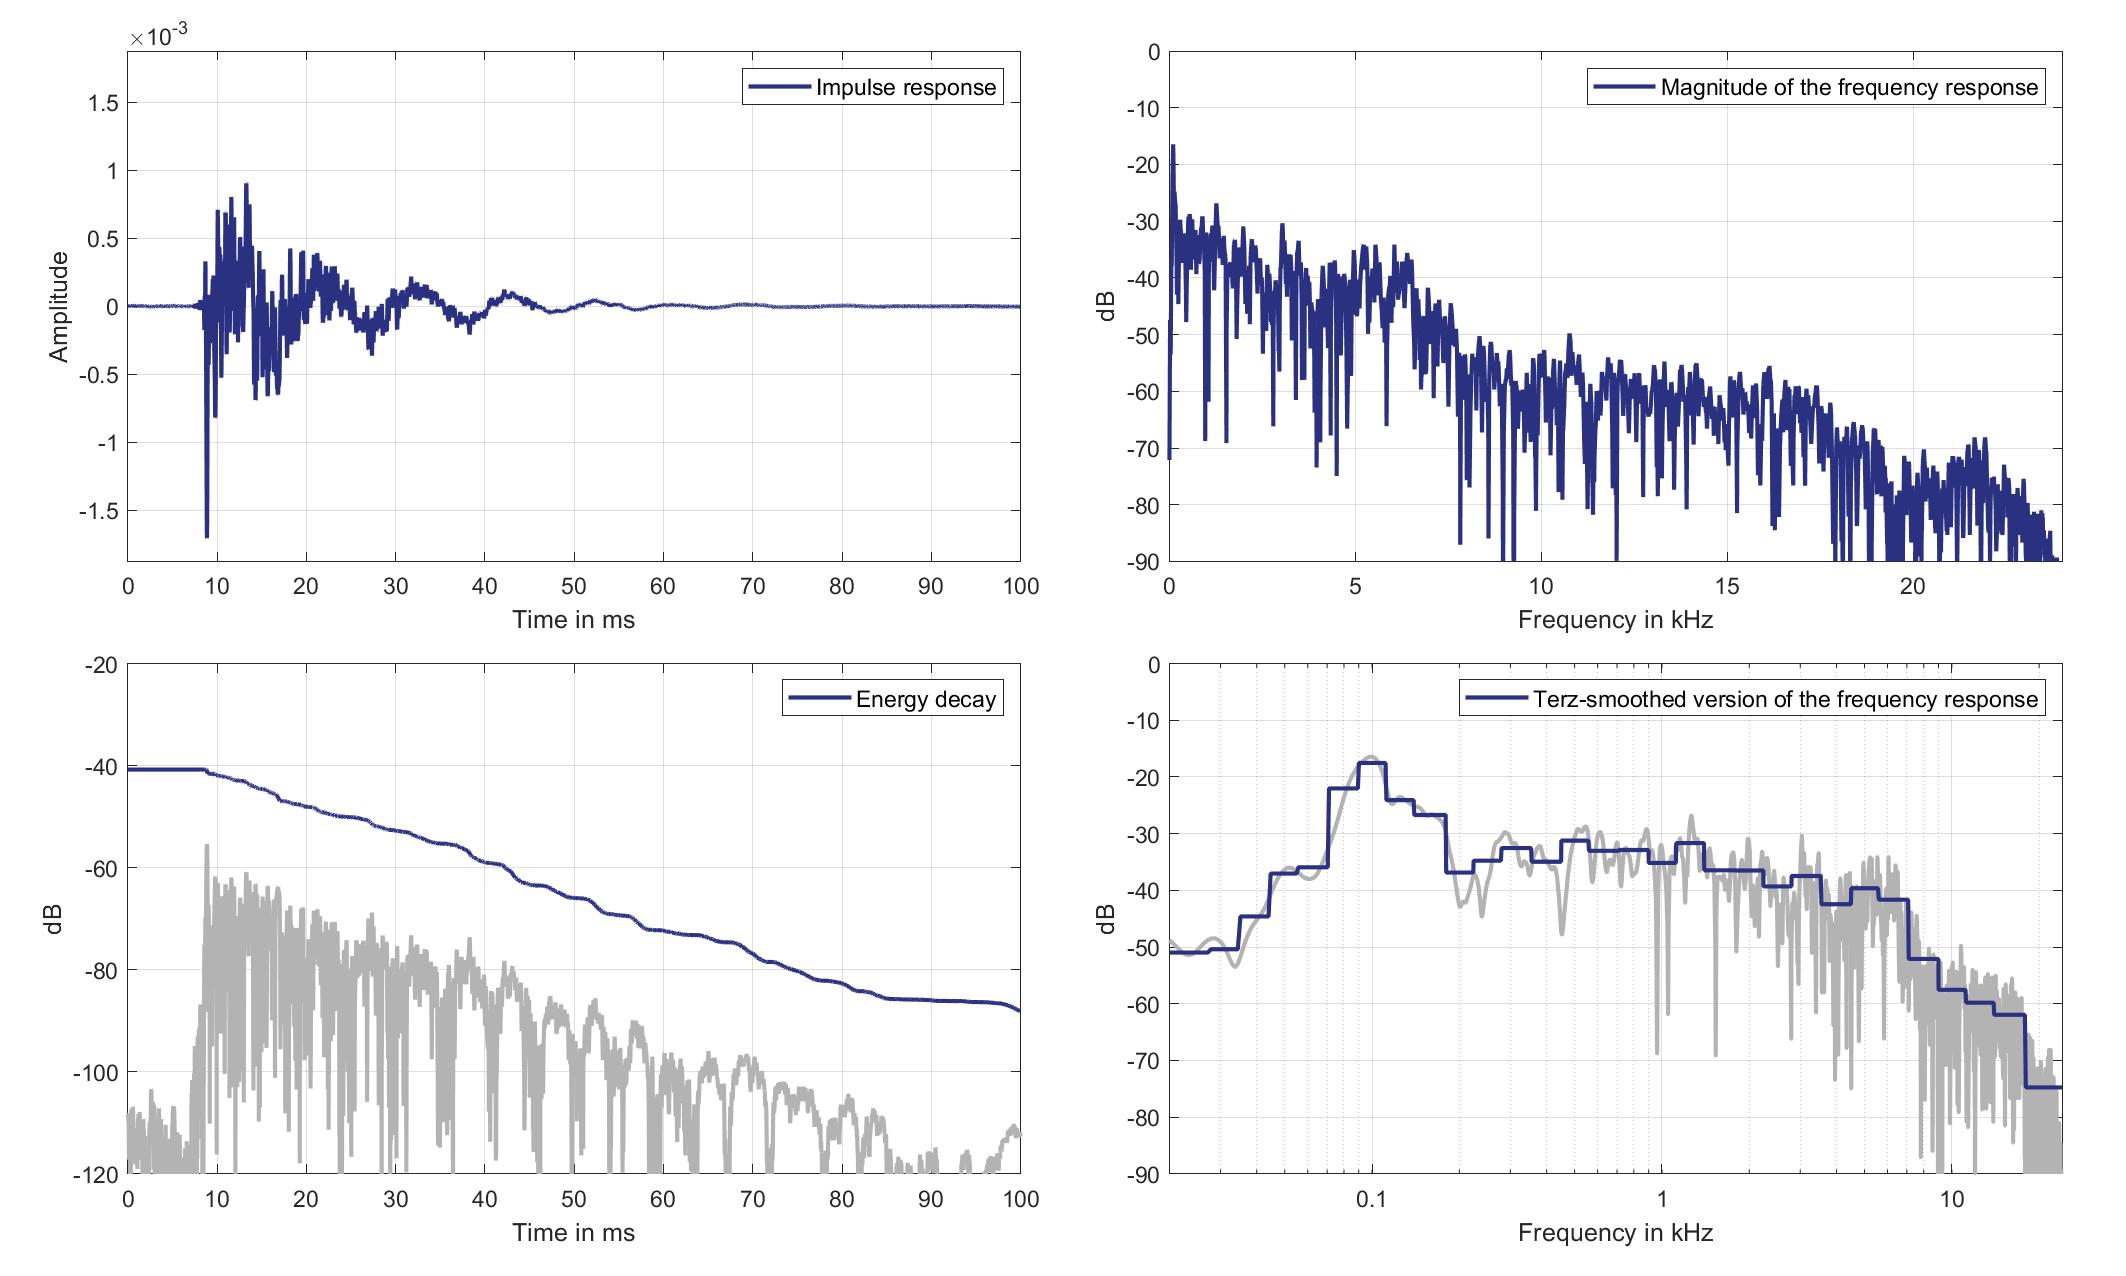
Download impulse response (in ".fir" format).
In the download section you can download all impulse response files as well as format explanation and Matlab as well as Python code examples for loading fir files.
Mic. 8
Standard Car Loudspeaker 3 (Lsp. 21) to Standard Car Microphone 8 (Mic. 8)
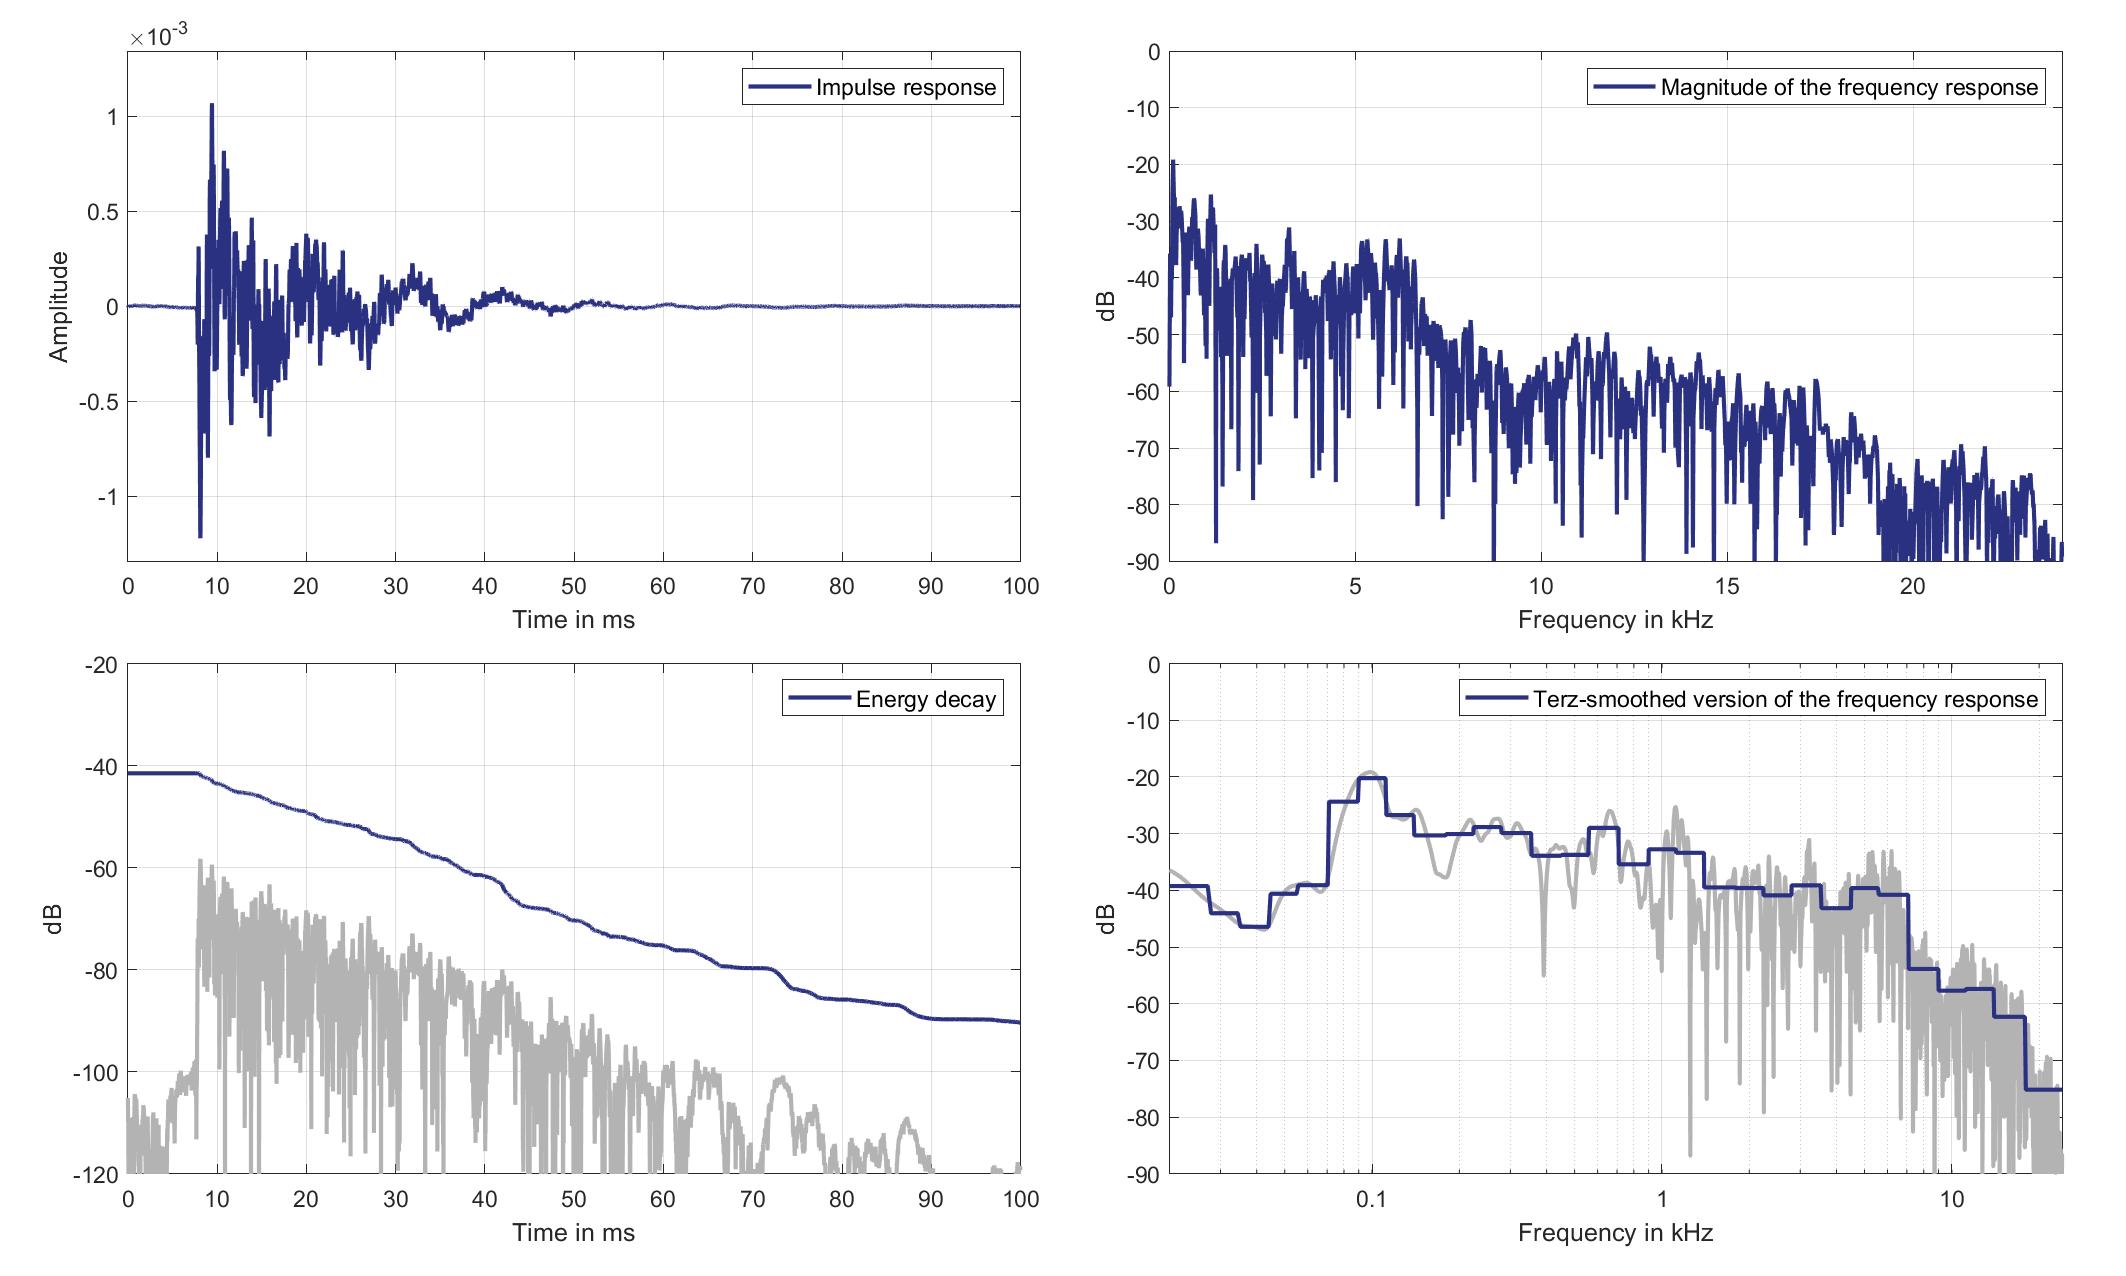
Download impulse response (in ".fir" format).
In the download section you can download all impulse response files as well as format explanation and Matlab as well as Python code examples for loading fir files.
Mic. 9
Standard Car Loudspeaker 3 (Lsp. 21) to Standard Car Microphone 9 (Mic. 9)
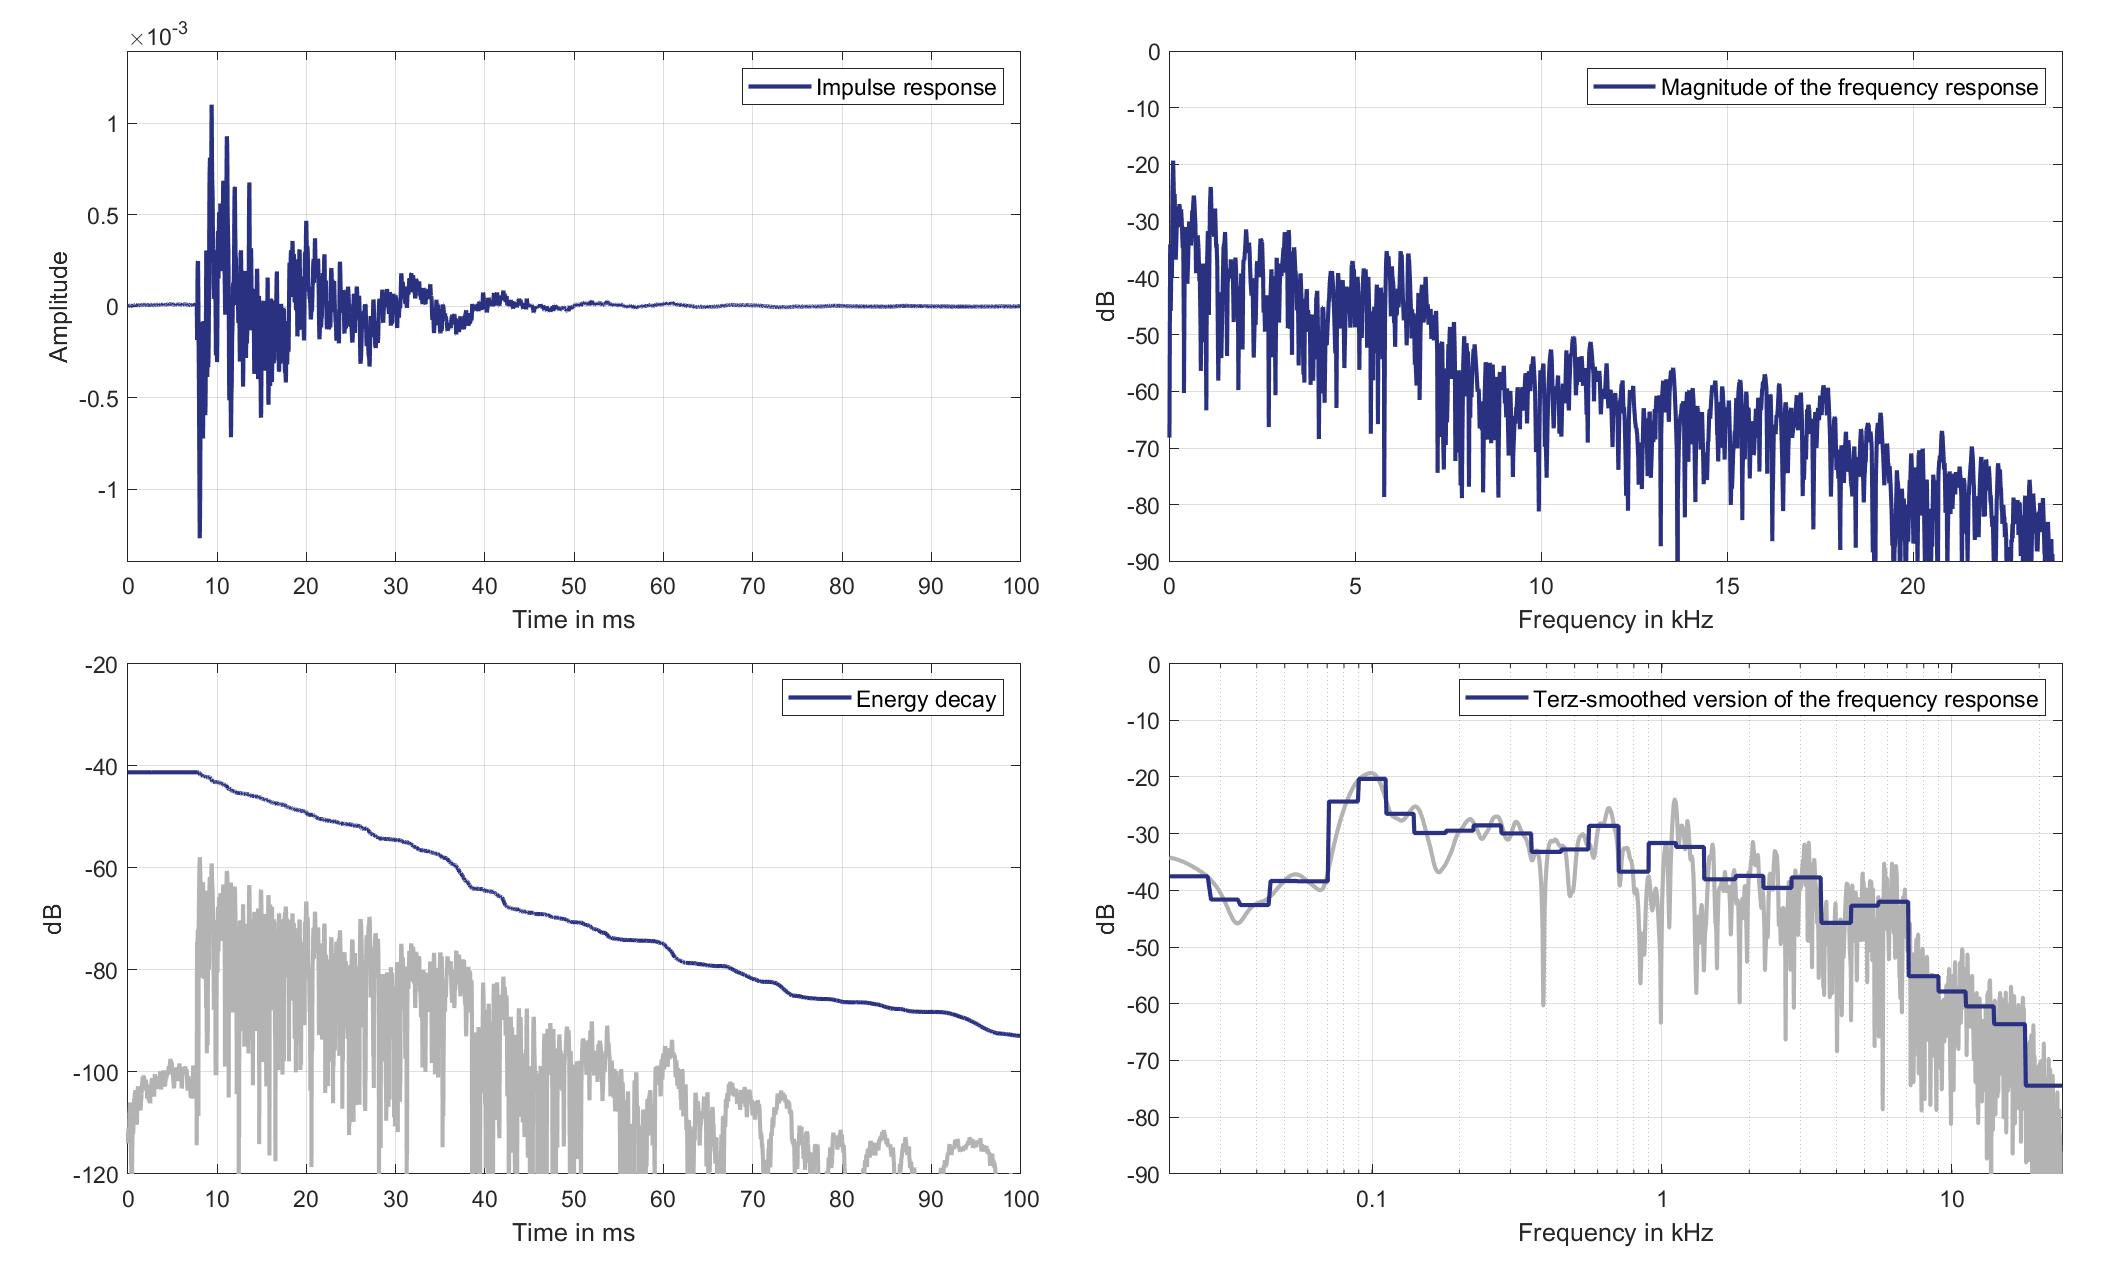
Download impulse response (in ".fir" format).
In the download section you can download all impulse response files as well as format explanation and Matlab as well as Python code examples for loading fir files.
Mic. 10
Standard Car Loudspeaker 3 (Lsp. 21) to Standard Car Microphone 10 (Mic. 10)

Download impulse response (in ".fir" format).
In the download section you can download all impulse response files as well as format explanation and Matlab as well as Python code examples for loading fir files.
Mic. 11
Standard Car Loudspeaker 3 (Lsp. 21) to Standard Car Microphone 11 (Mic. 11)

Download impulse response (in ".fir" format).
In the download section you can download all impulse response files as well as format explanation and Matlab as well as Python code examples for loading fir files.
Mic. 12
Standard Car Loudspeaker 3 (Lsp. 21) to Standard Car Microphone 12 (Mic. 12)
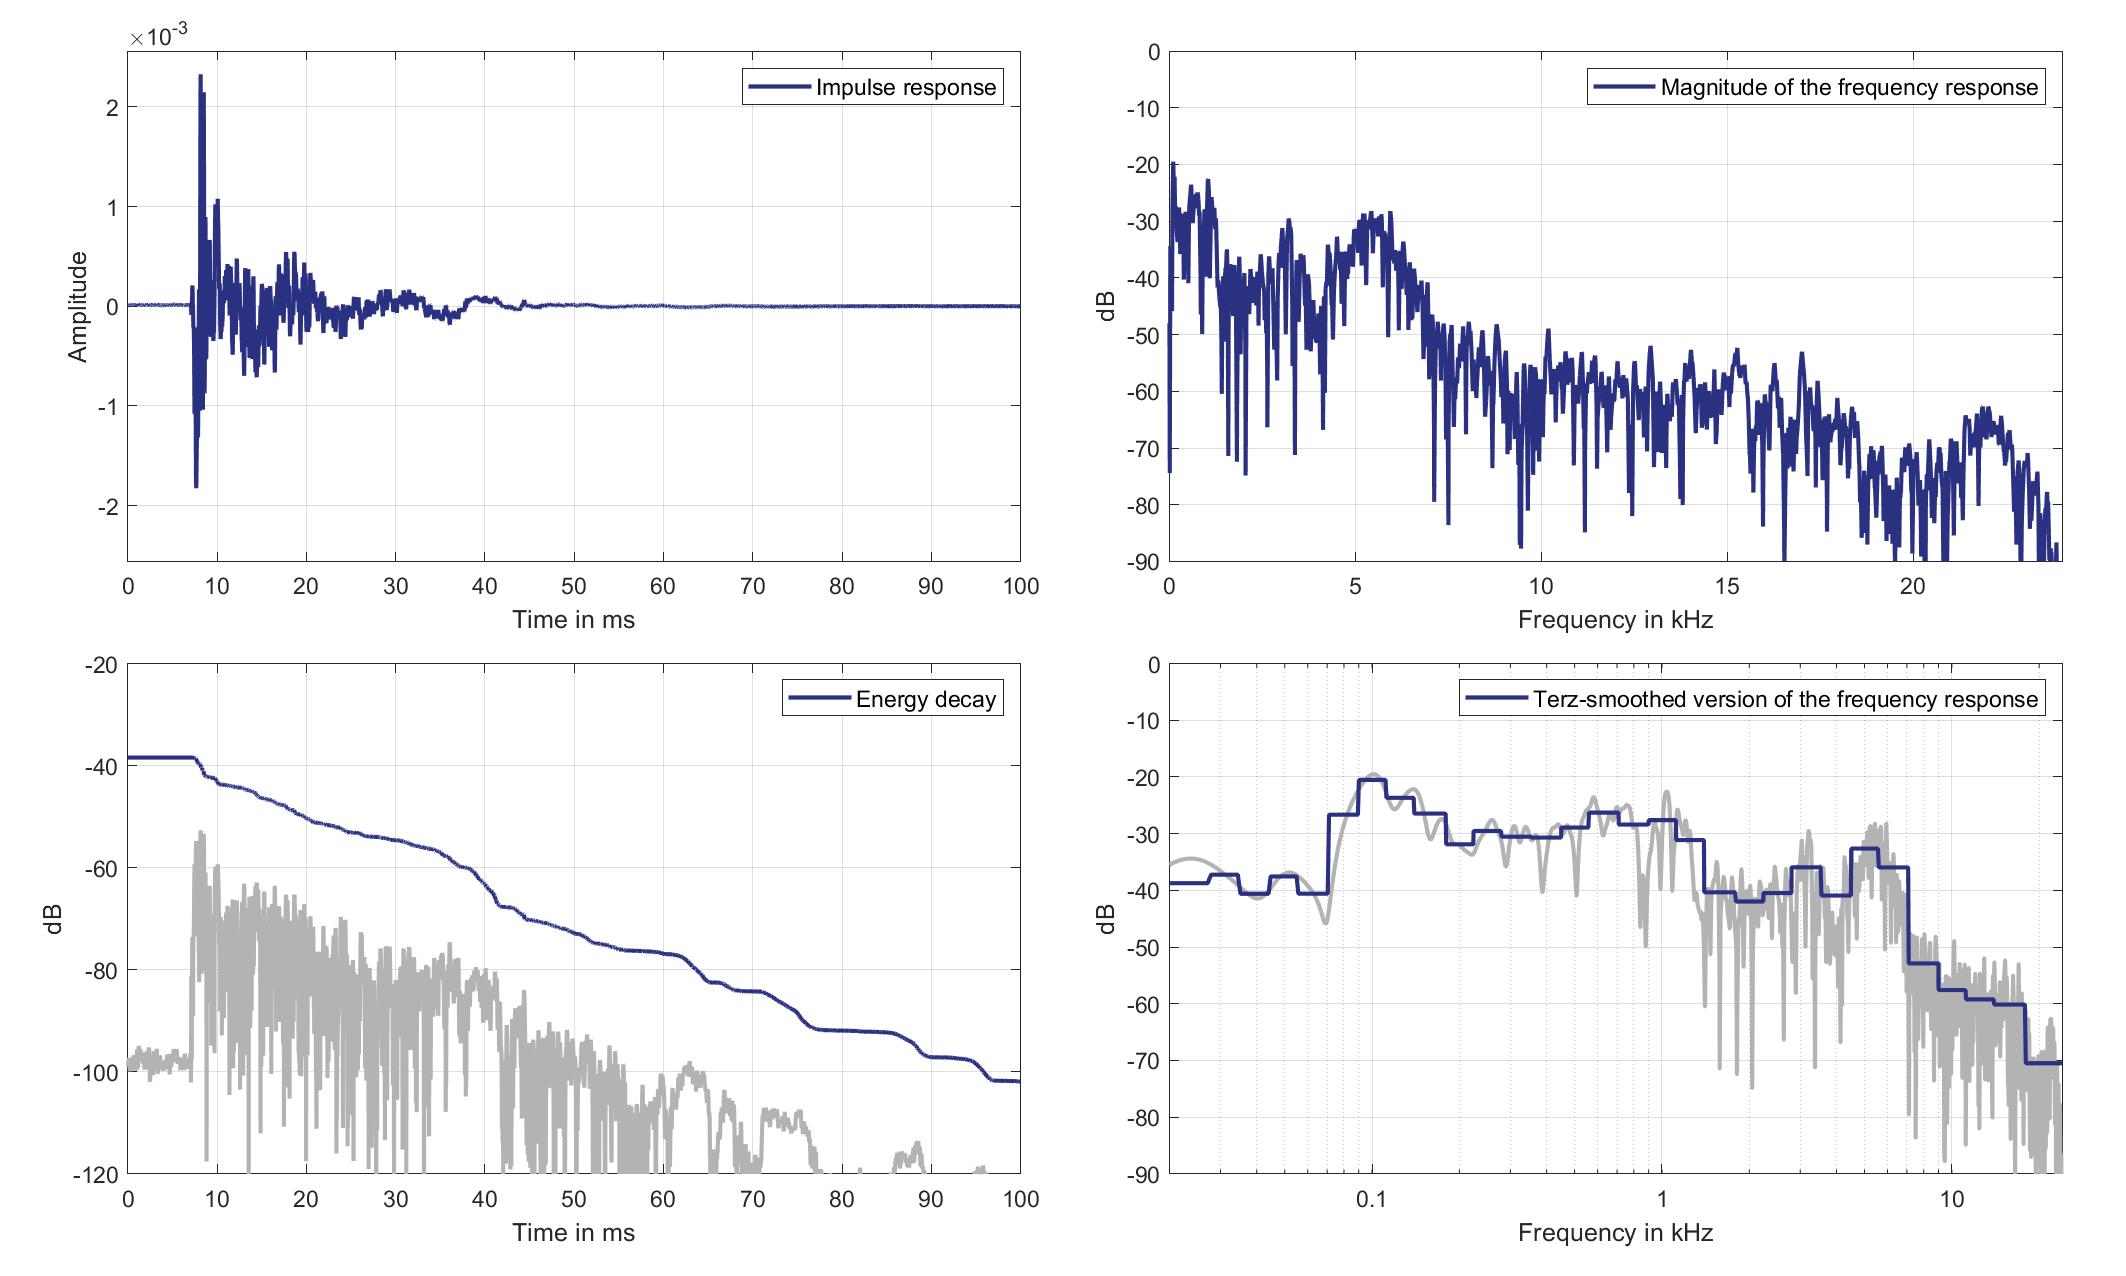
Download impulse response (in ".fir" format).
In the download section you can download all impulse response files as well as format explanation and Matlab as well as Python code examples for loading fir files.
Mic. 13
Standard Car Loudspeaker 3 (Lsp. 21) to Standard Car Microphone 13 (Mic. 13)
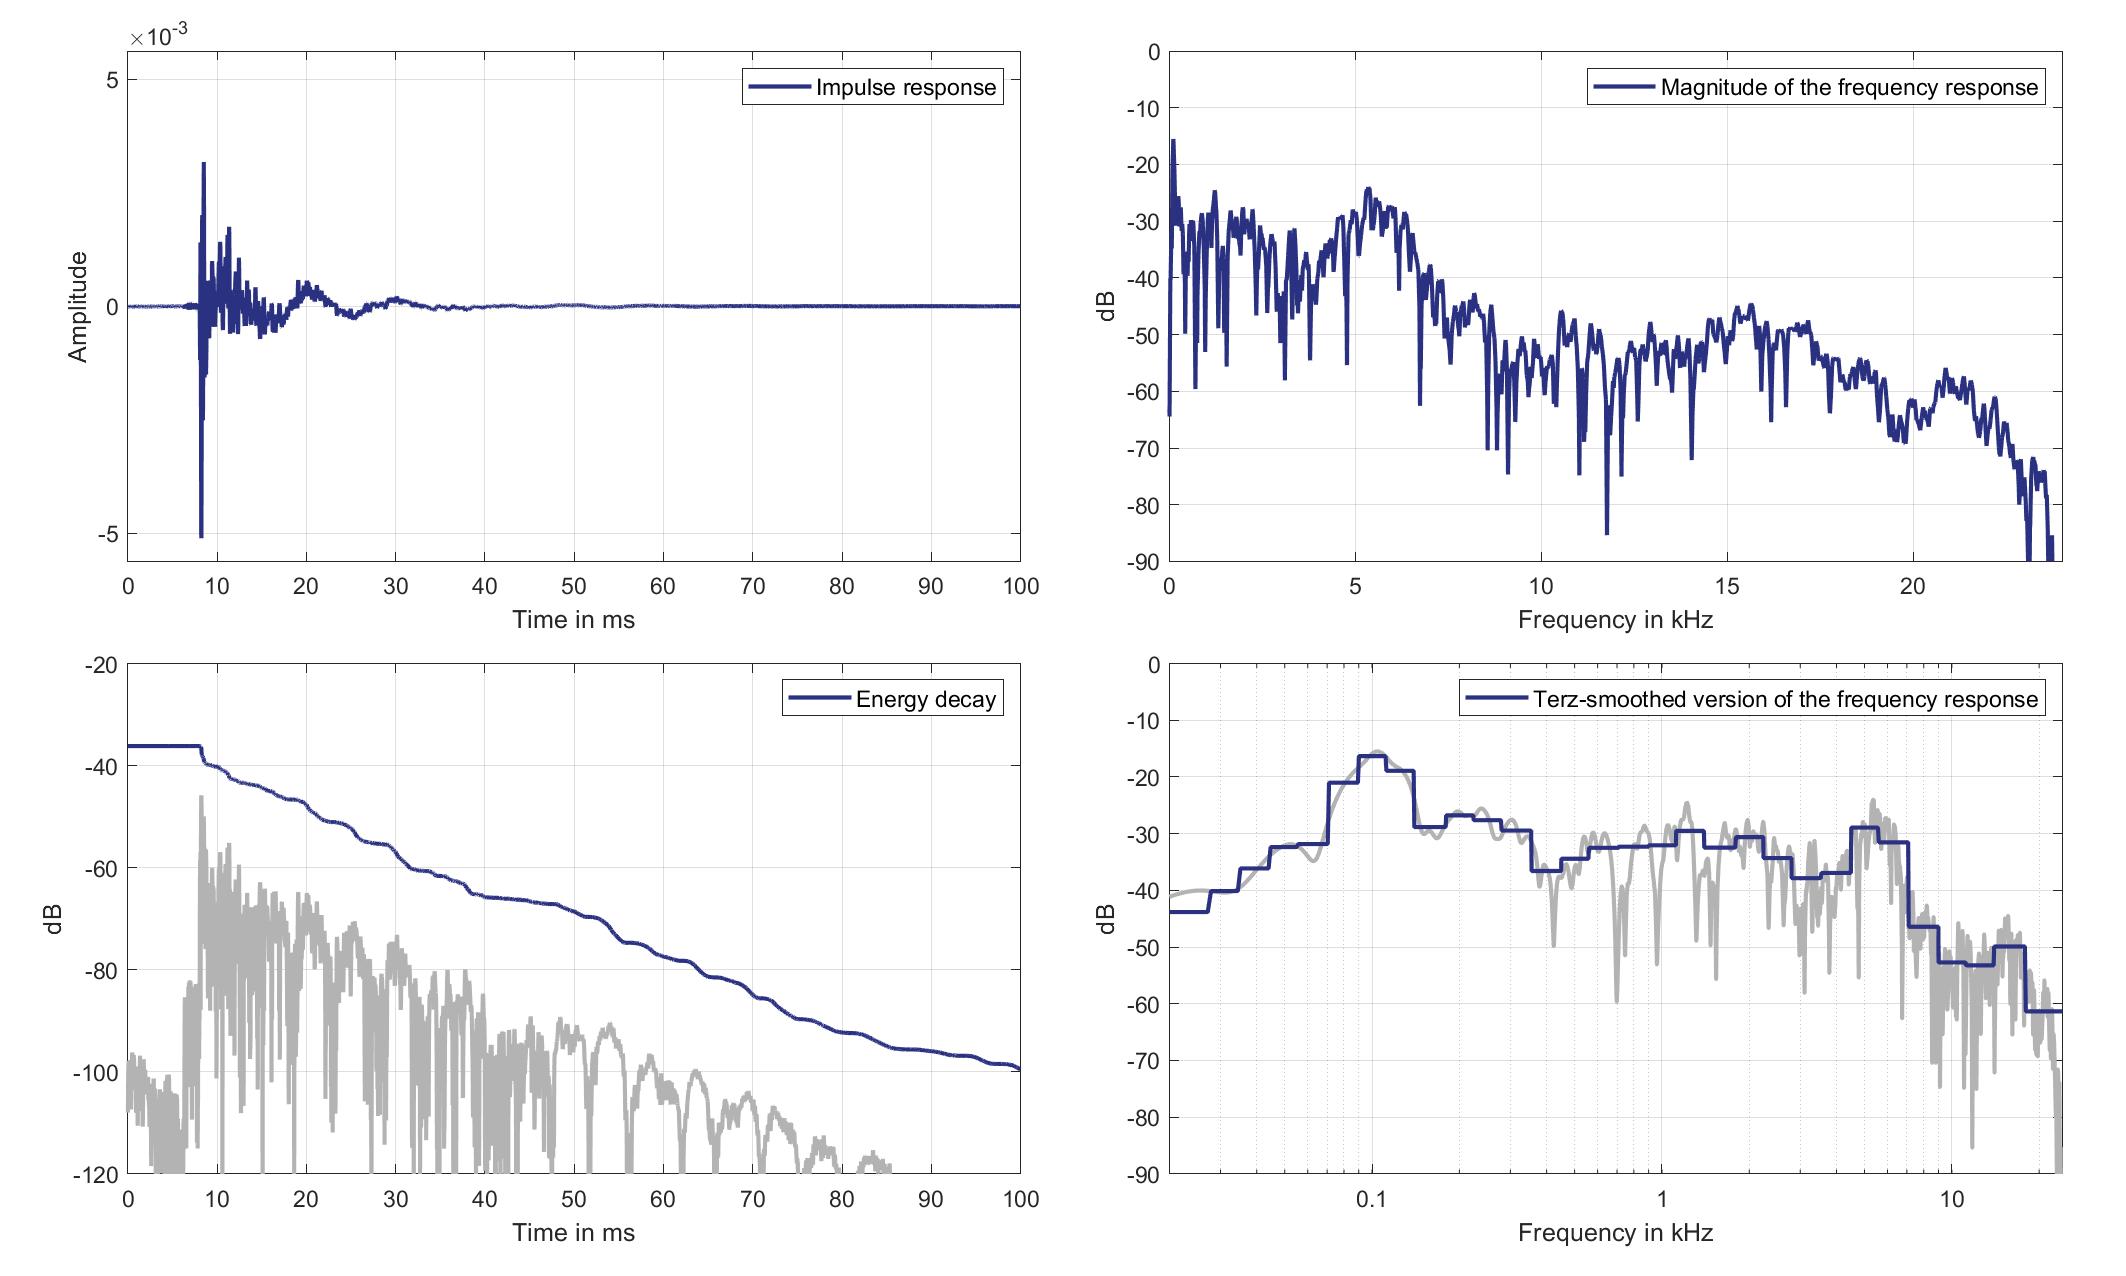
Download impulse response (in ".fir" format).
In the download section you can download all impulse response files as well as format explanation and Matlab as well as Python code examples for loading fir files.
Mic. 14
Standard Car Loudspeaker 3 (Lsp. 21) to Standard Car Microphone 14 (Mic. 14)
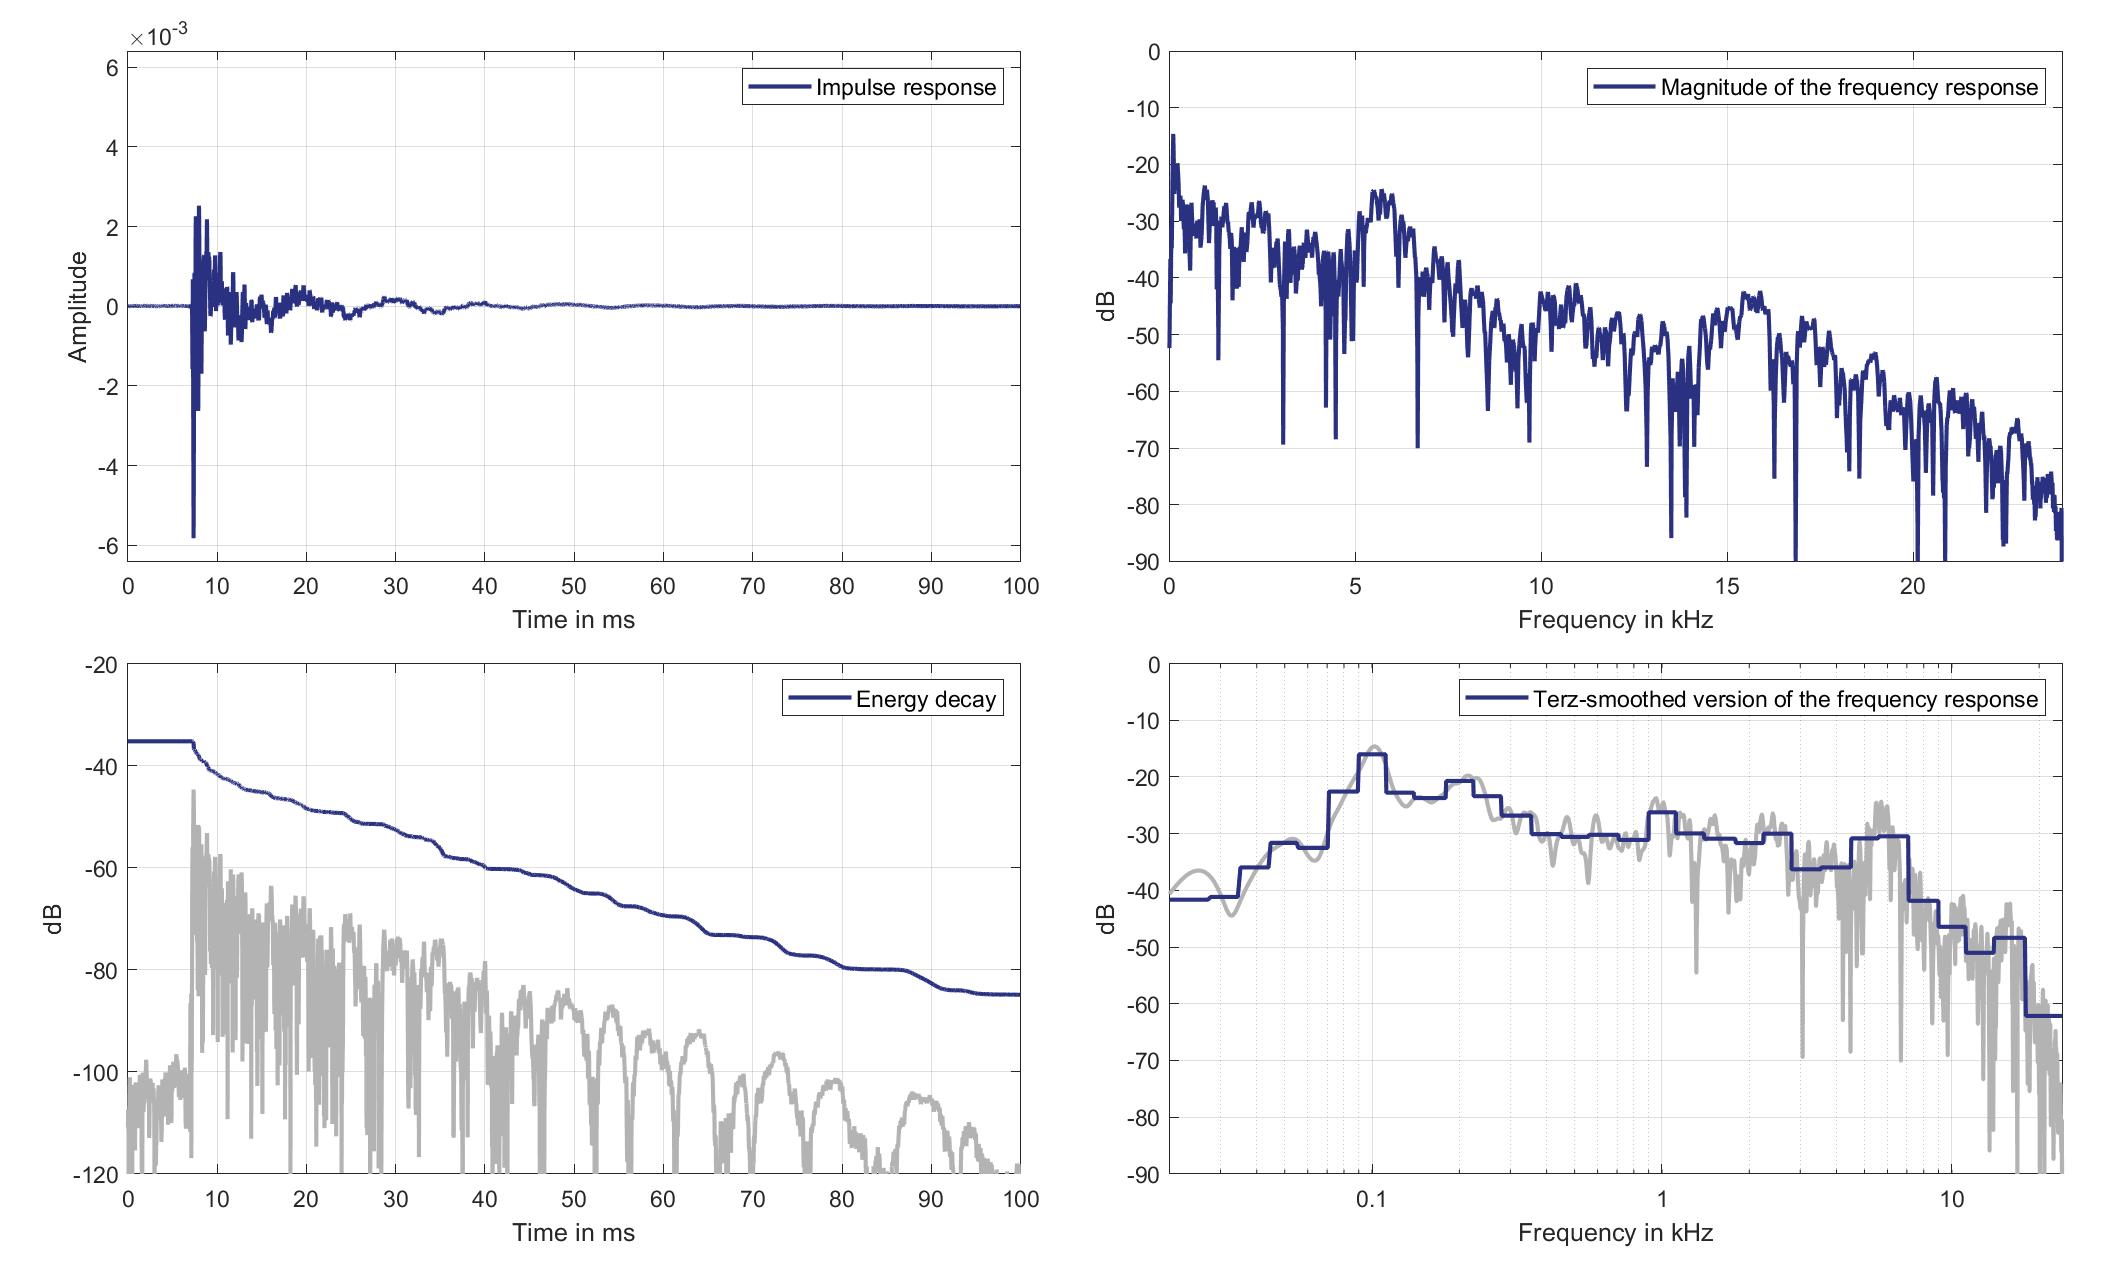
Download impulse response (in ".fir" format).
In the download section you can download all impulse response files as well as format explanation and Matlab as well as Python code examples for loading fir files.
Mic. 15
Standard Car Loudspeaker 3 (Lsp. 21) to Standard Car Microphone 15 (Mic. 15)
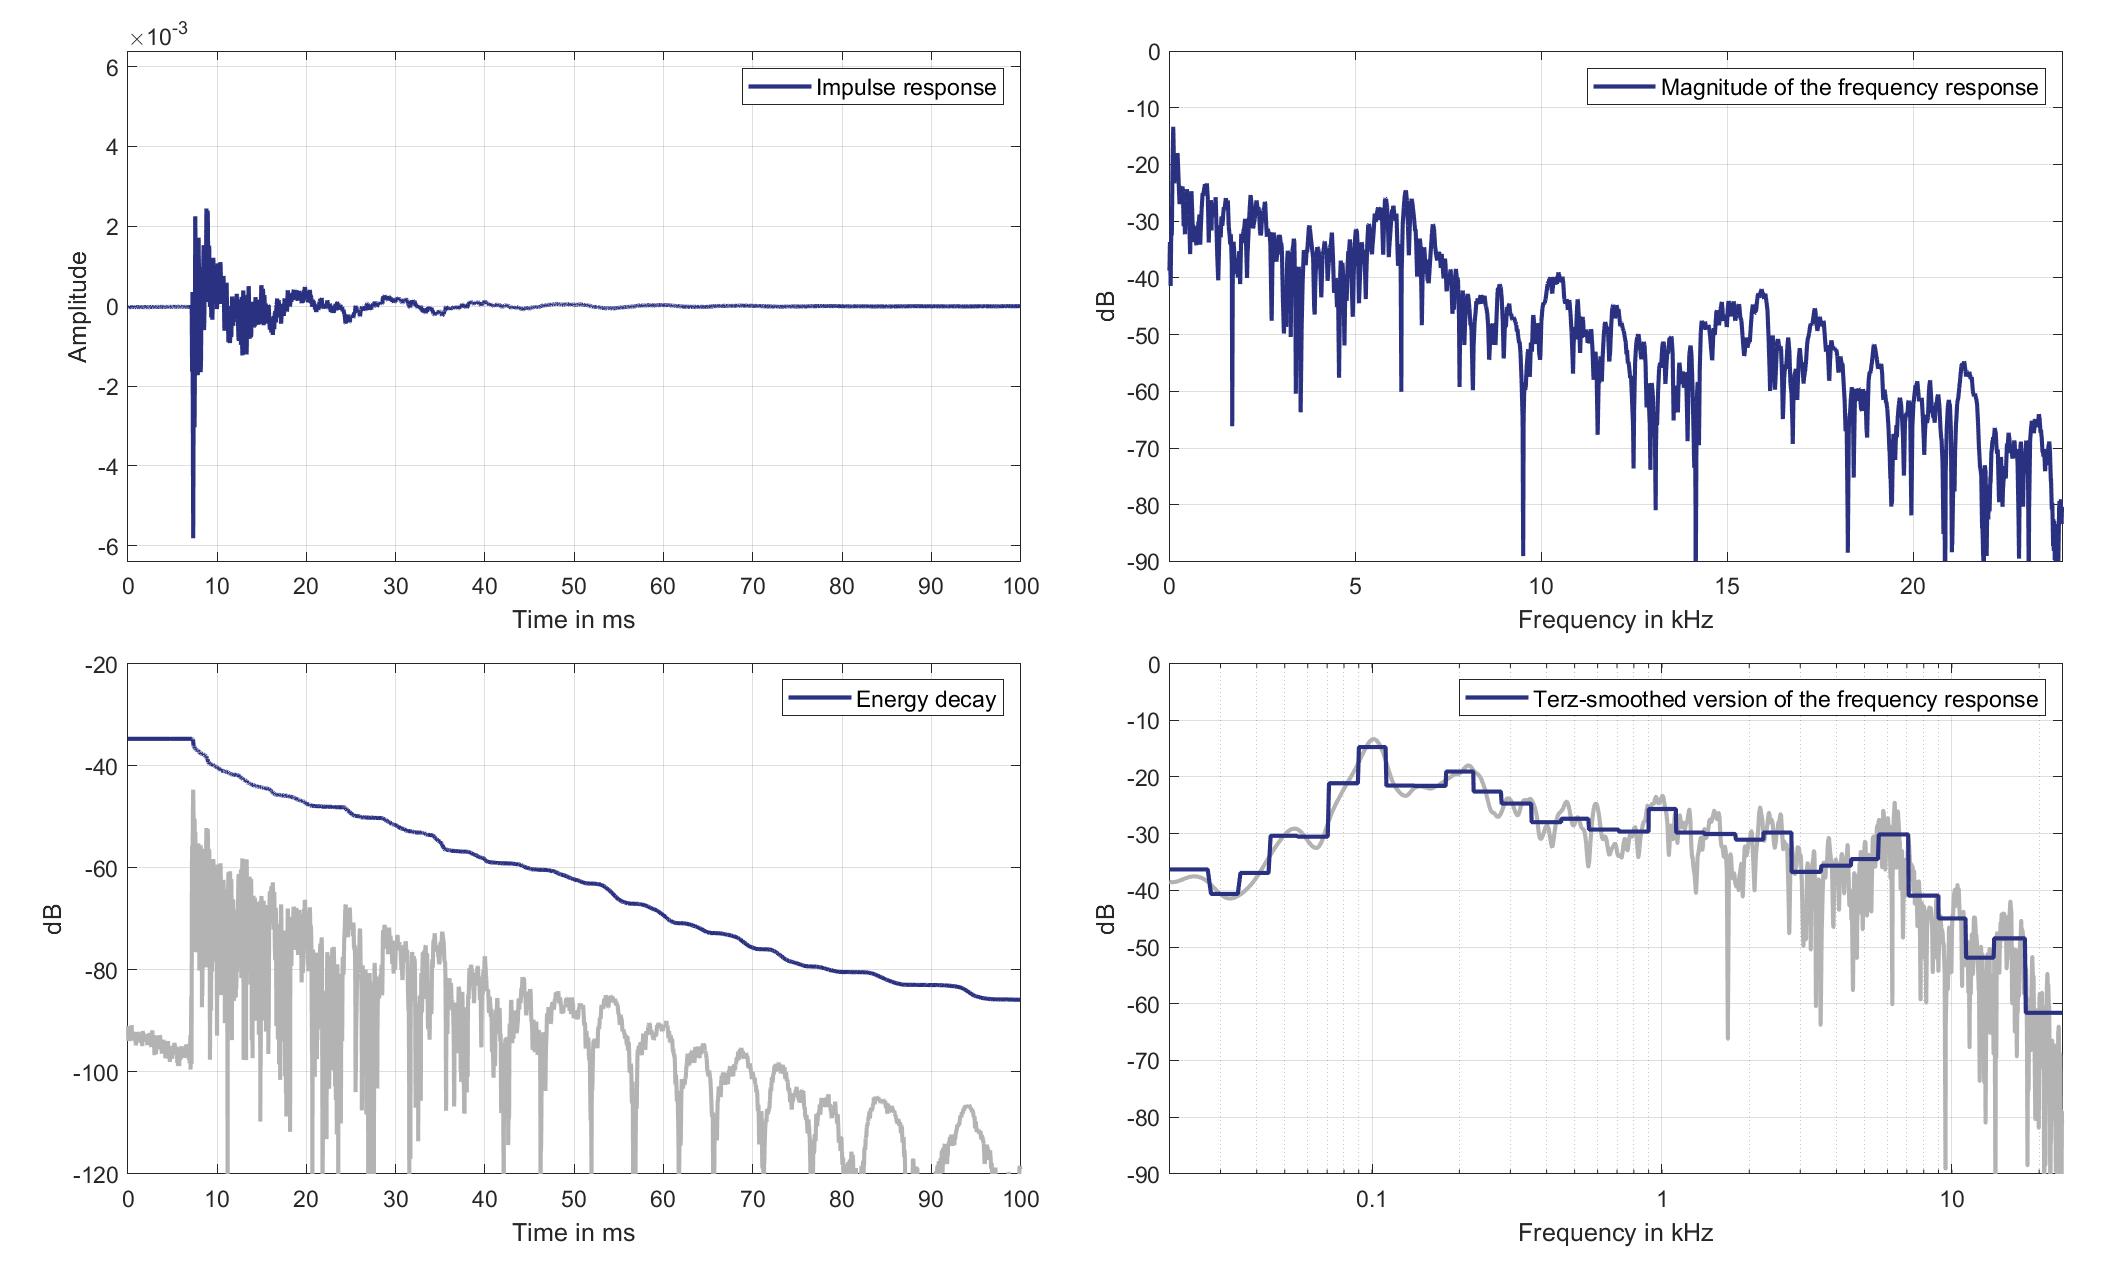
Download impulse response (in ".fir" format).
In the download section you can download all impulse response files as well as format explanation and Matlab as well as Python code examples for loading fir files.
Mic. 16
Standard Car Loudspeaker 3 (Lsp. 21) to Standard Car Microphone 16 (Mic. 16)
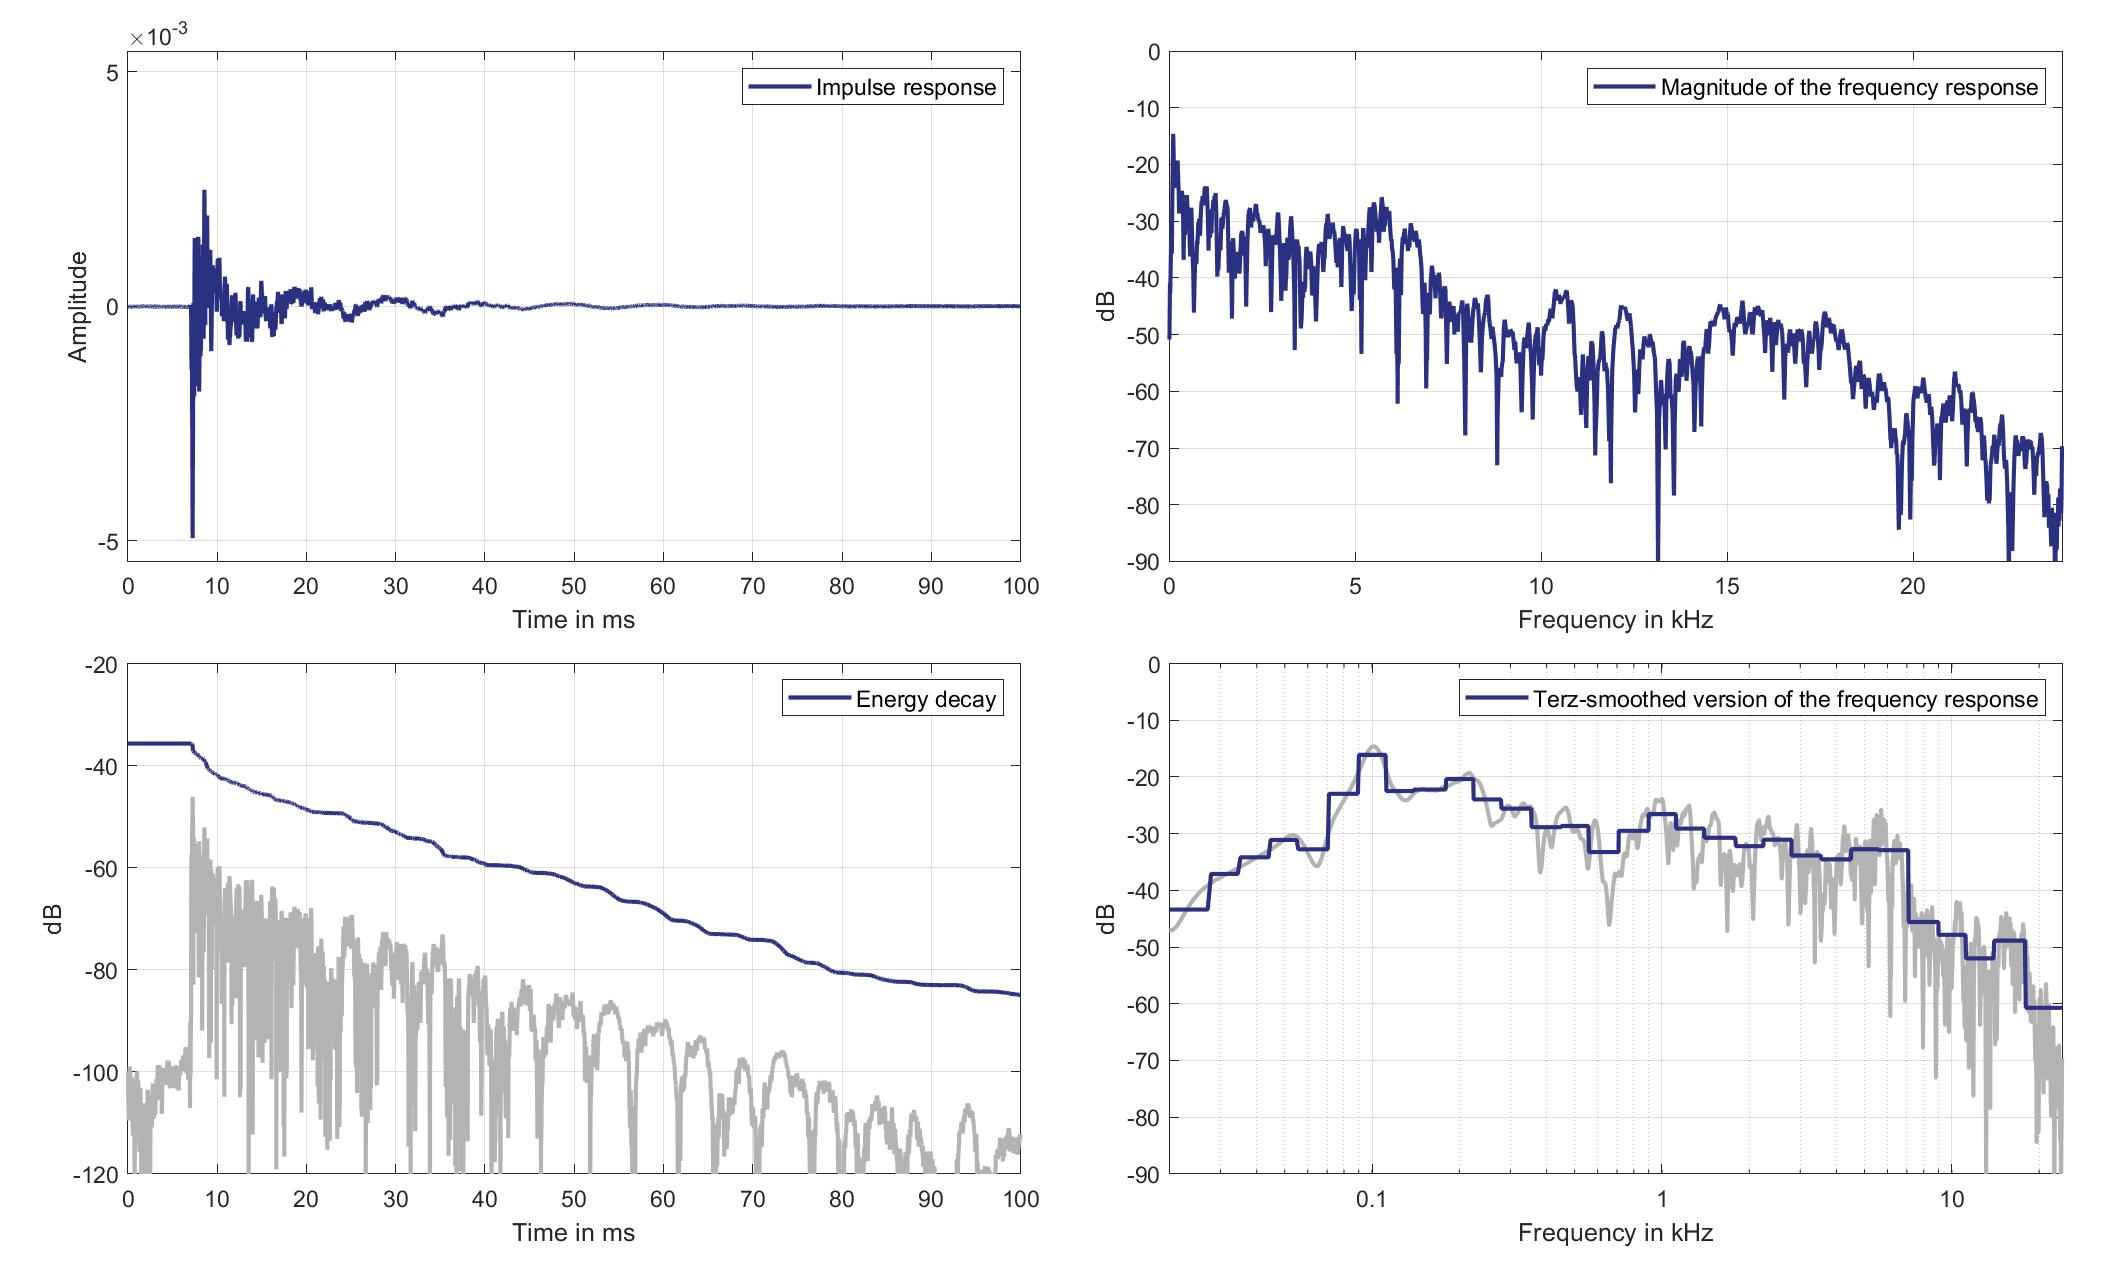
Download impulse response (in ".fir" format).
In the download section you can download all impulse response files as well as format explanation and Matlab as well as Python code examples for loading fir files.
Mic. 17
Standard Car Loudspeaker 3 (Lsp. 21) to Standard Car Microphone 17 (Mic. 17)
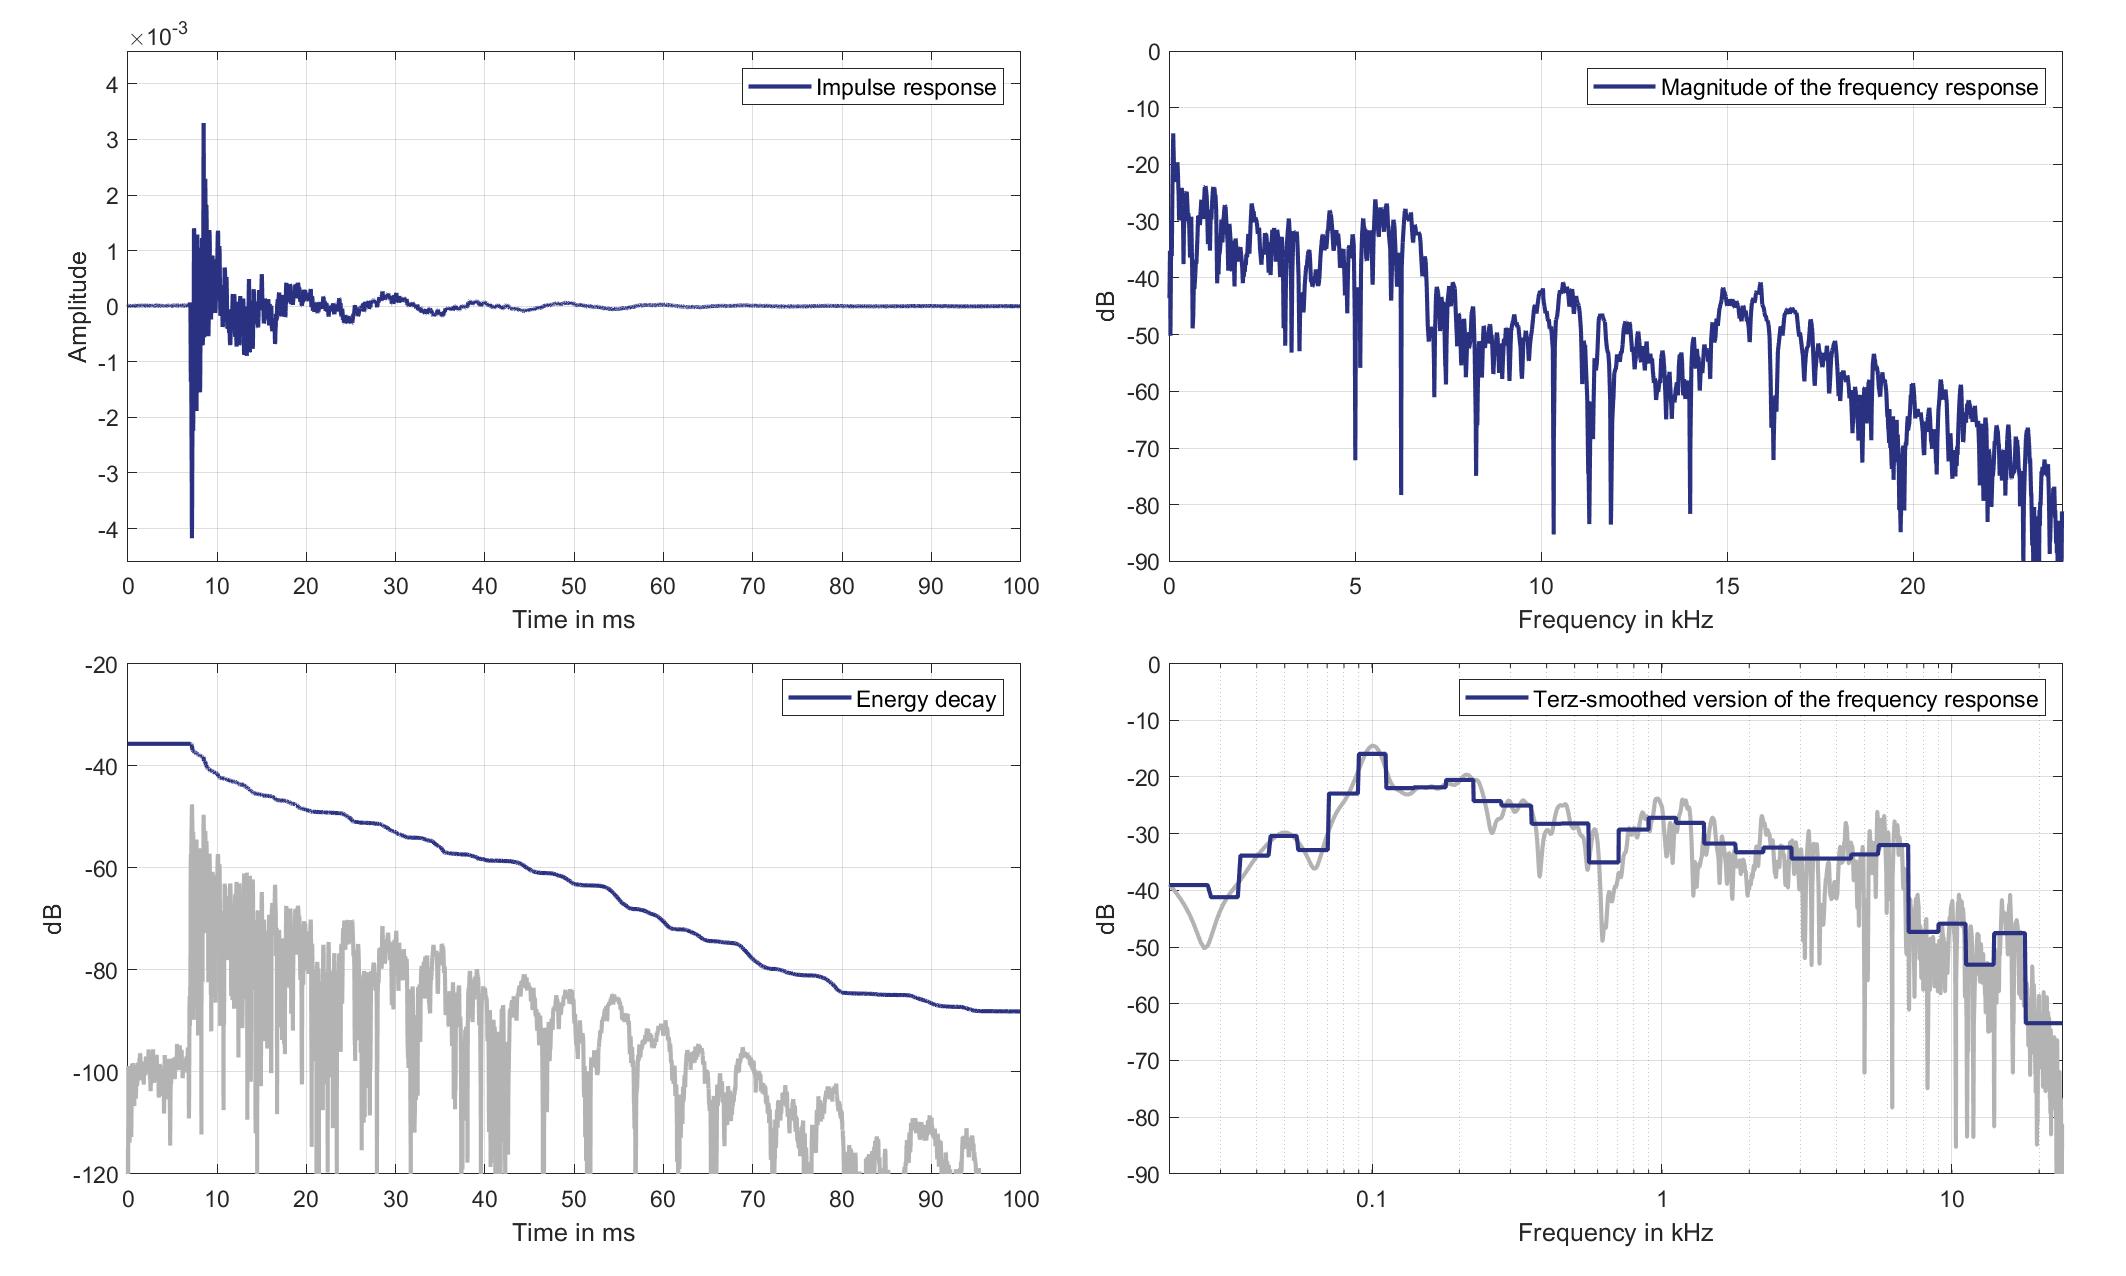
Download impulse response (in ".fir" format).
In the download section you can download all impulse response files as well as format explanation and Matlab as well as Python code examples for loading fir files.
Mic. 18
Standard Car Loudspeaker 3 (Lsp. 21) to Standard Car Microphone 18 (Mic. 18)
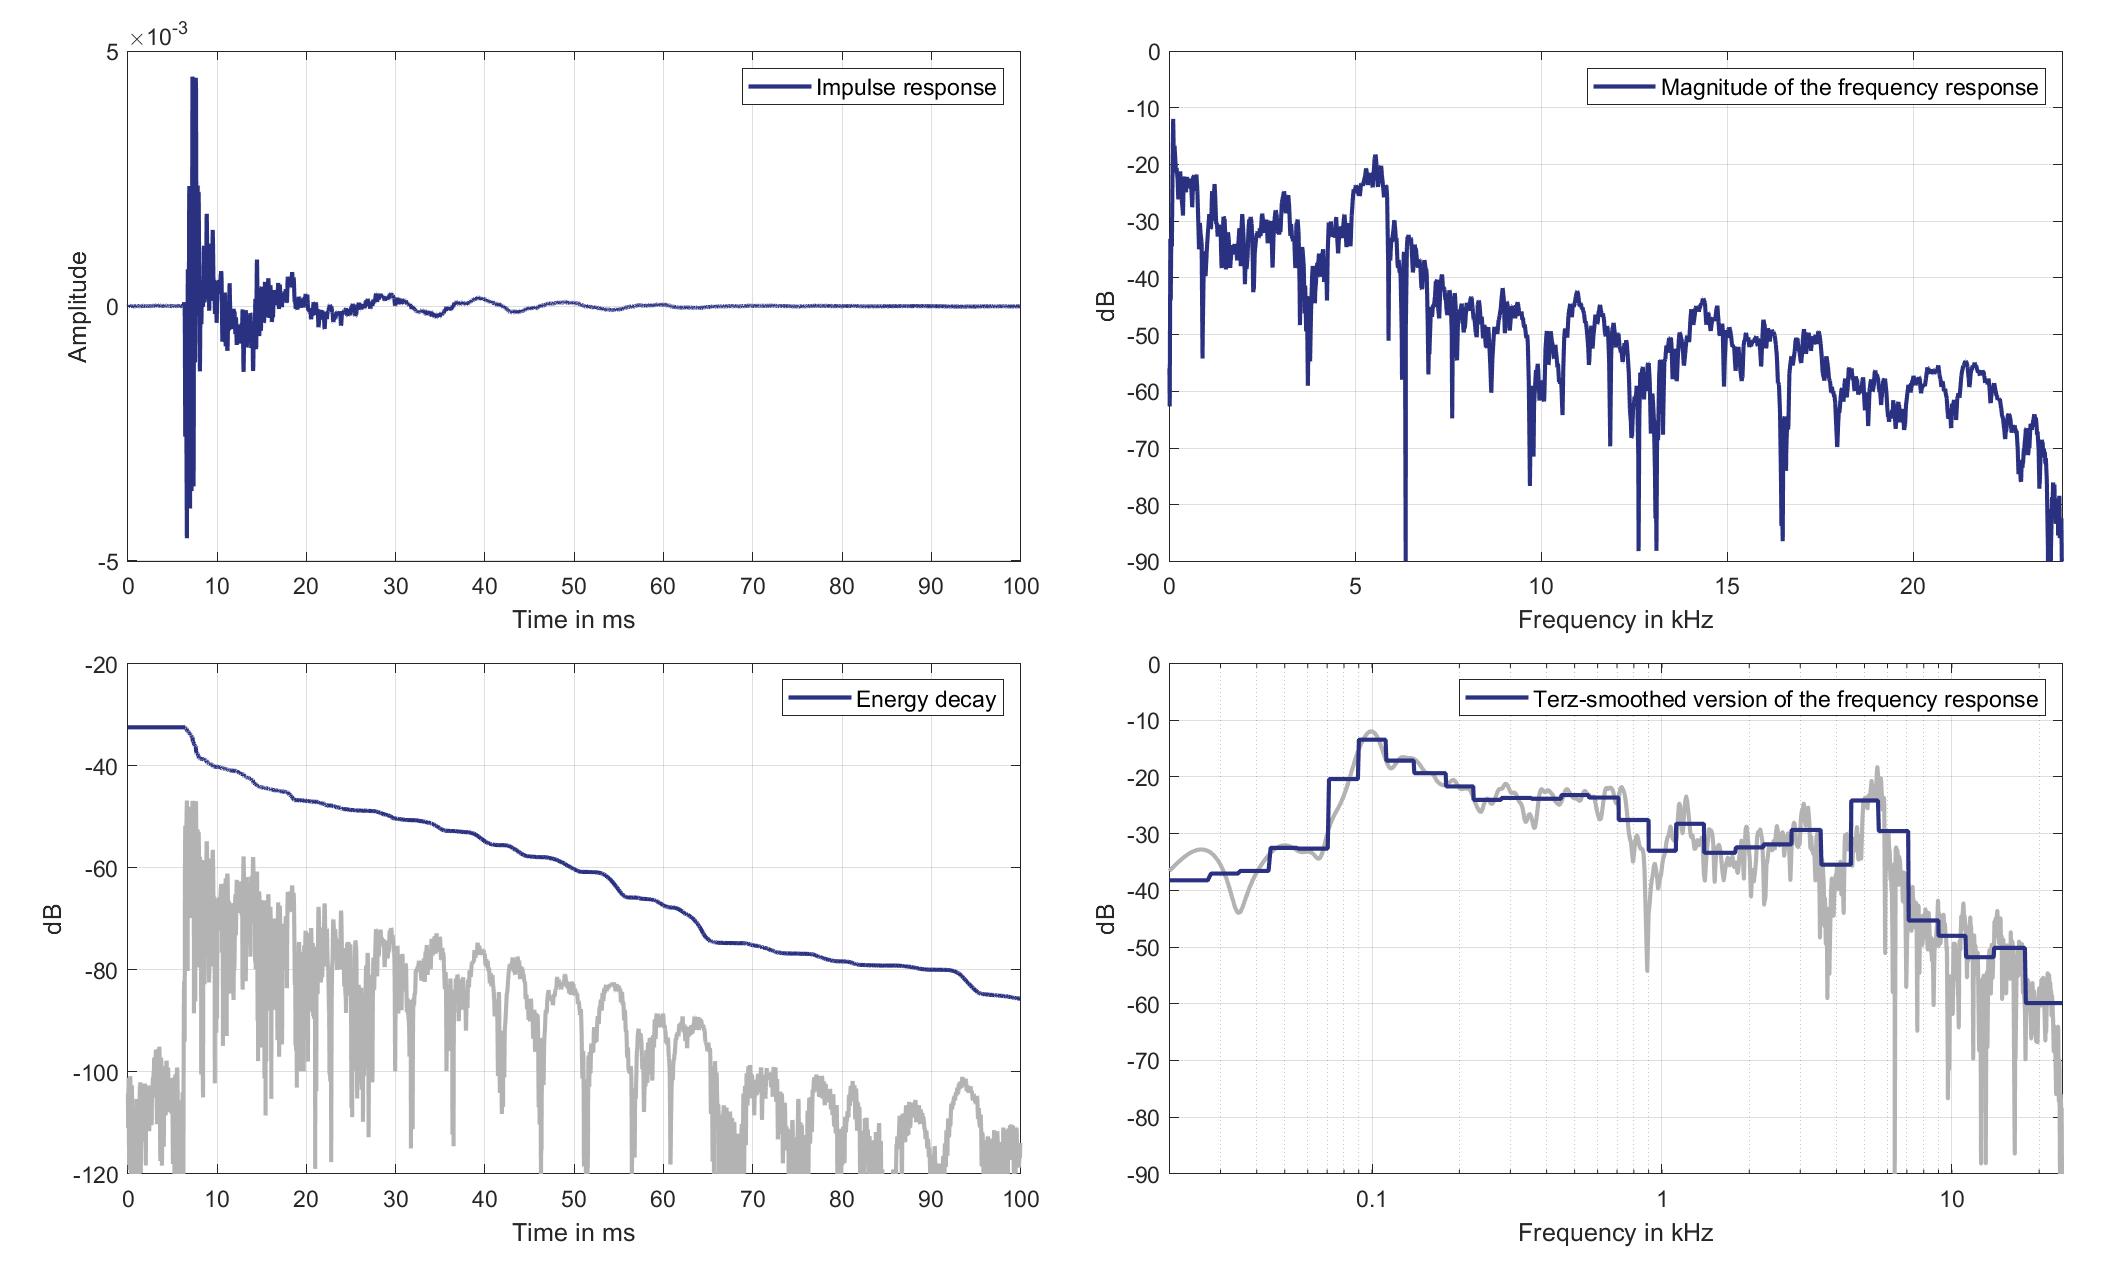
Download impulse response (in ".fir" format).
In the download section you can download all impulse response files as well as format explanation and Matlab as well as Python code examples for loading fir files.
Standard Car Loudspeakers to Ear Microphones
Lsp. 18
Mics. 19/20
Left Ear Microphone
Standard Car Loudspeaker 0 (Lsp. 18) to Left Ear Microphone of Zone 1 (Mic. 19)
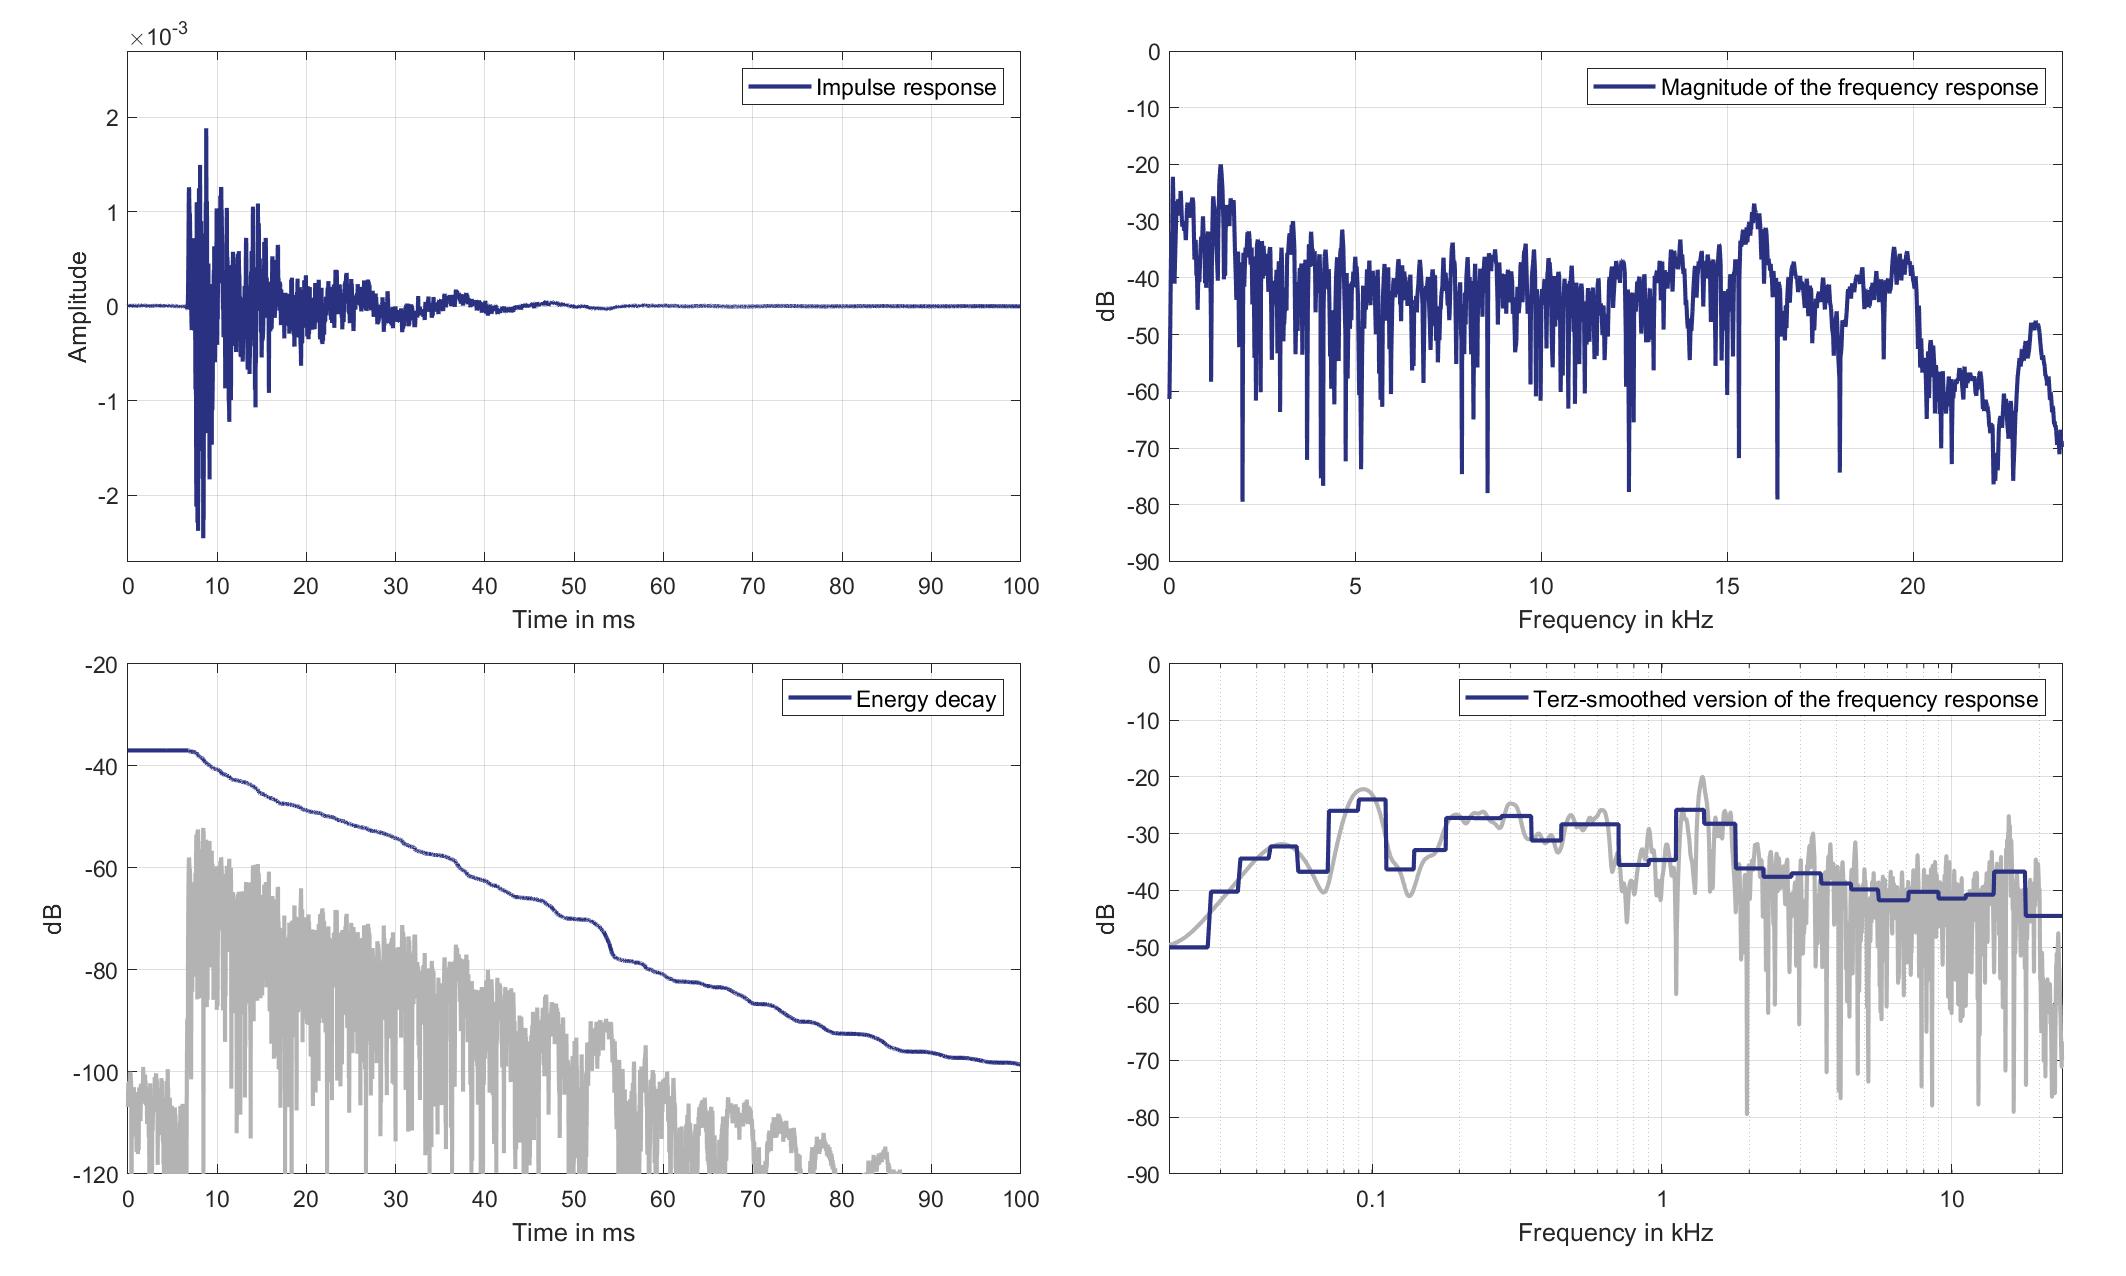
Download impulse response (in ".fir" format).
In the download section you can download all impulse response files as well as format explanation and Matlab as well as Python code examples for loading fir files.
Right Ear Microphone
Standard Car Loudspeaker 0 (Lsp. 18) to Right Ear Microphone of Zone 1 (Mic. 20)
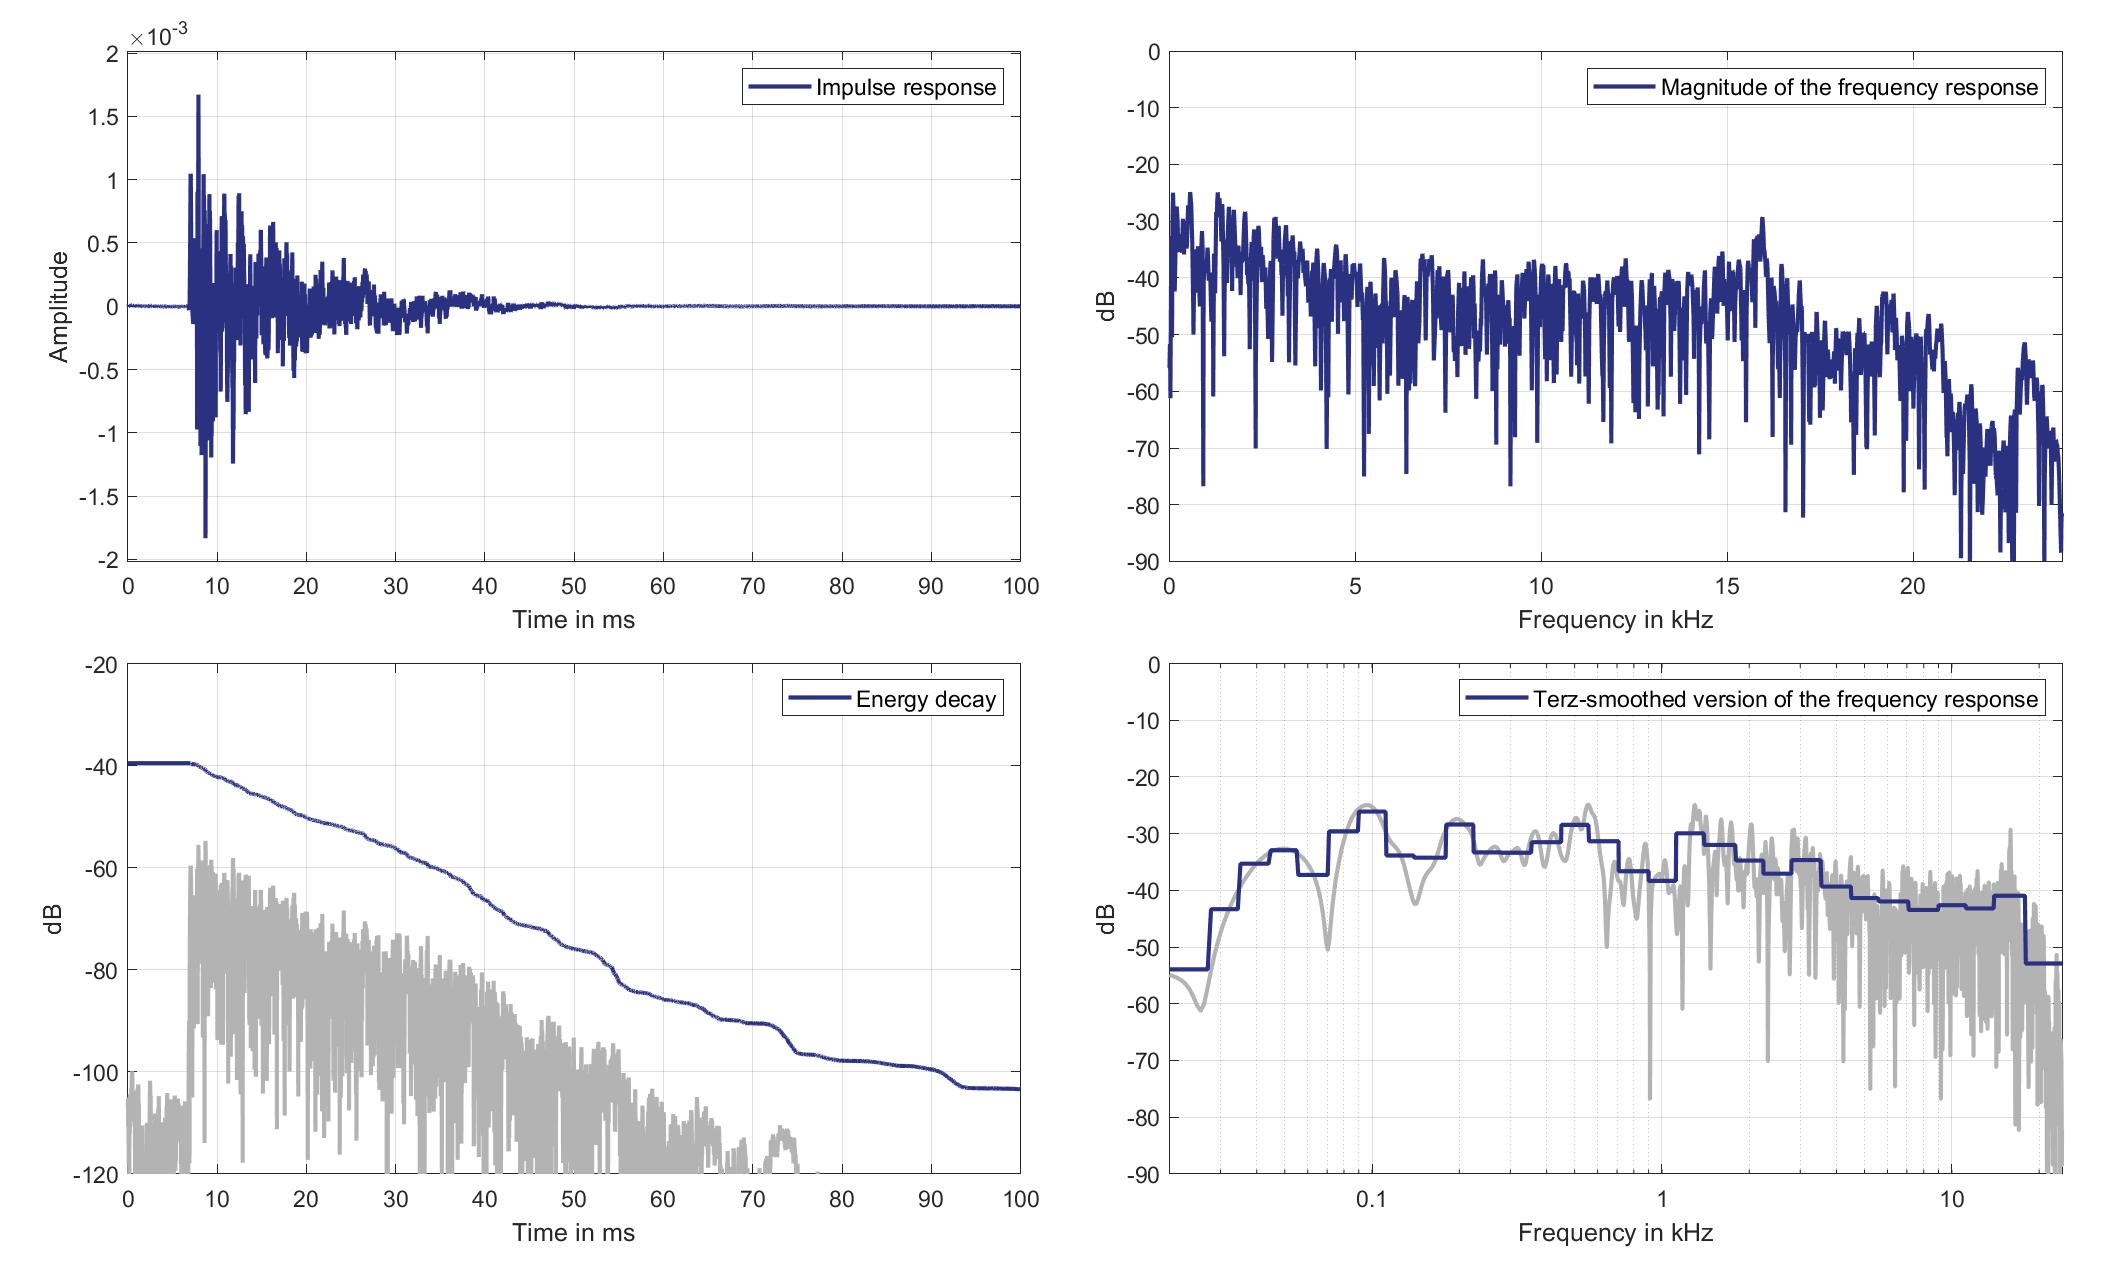
Download impulse response (in ".fir" format).
In the download section you can download all impulse response files as well as format explanation and Matlab as well as Python code examples for loading fir files.
Mics. 21/22
Left Ear Microphone
Standard Car Loudspeaker 0 (Lsp. 18) to Left Ear Microphone of Zone 2 (Mic. 21)
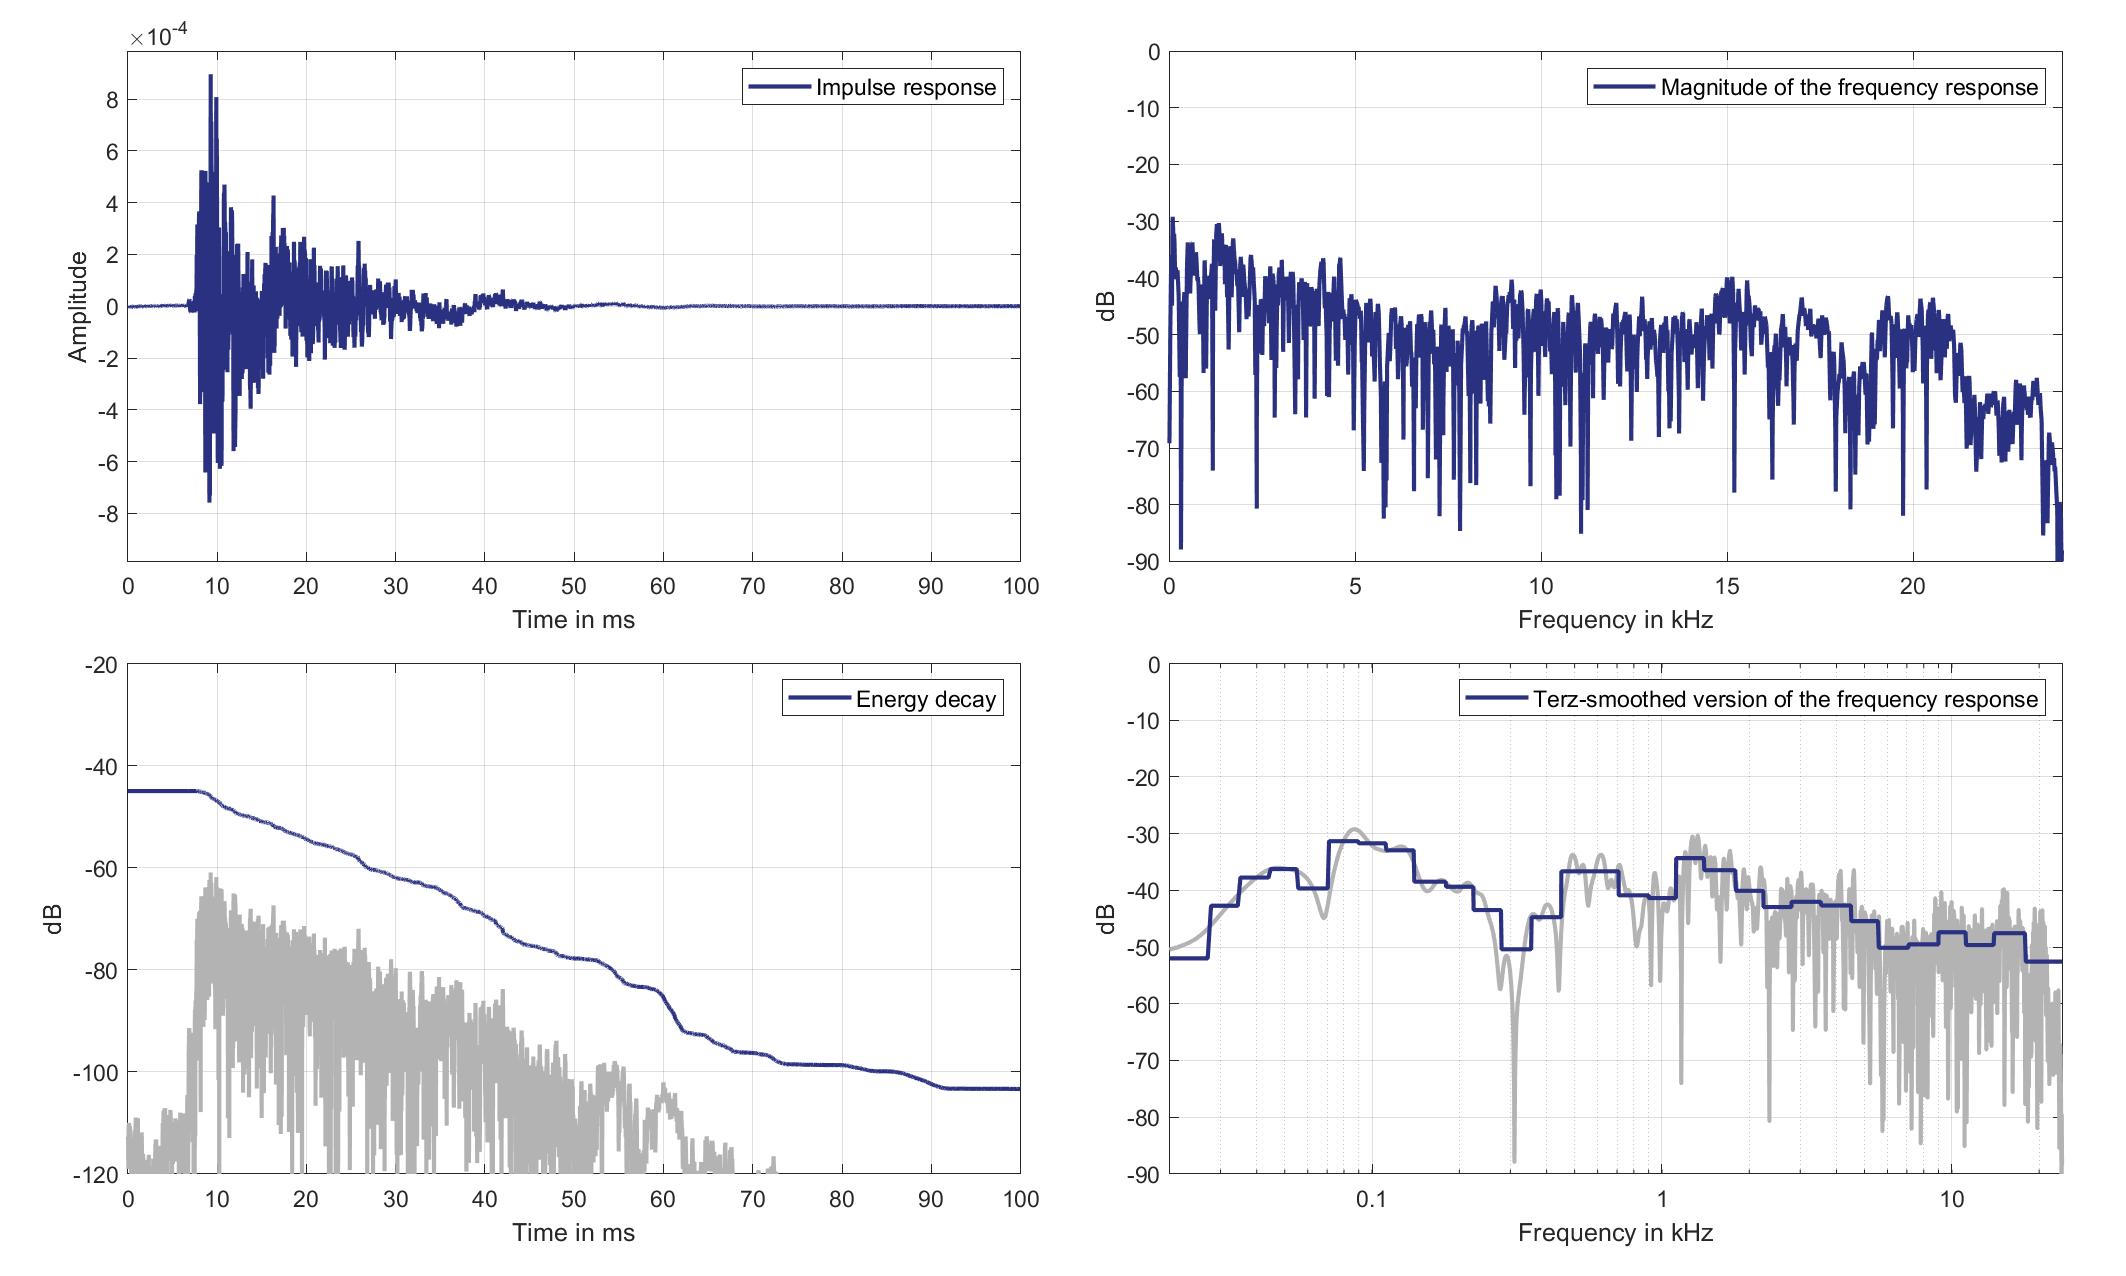
Download impulse response (in ".fir" format).
In the download section you can download all impulse response files as well as format explanation and Matlab as well as Python code examples for loading fir files.
Right Ear Microphone
Standard Car Loudspeaker 0 (Lsp. 18) to Right Ear Microphone of Zone 2 (Mic. 22)
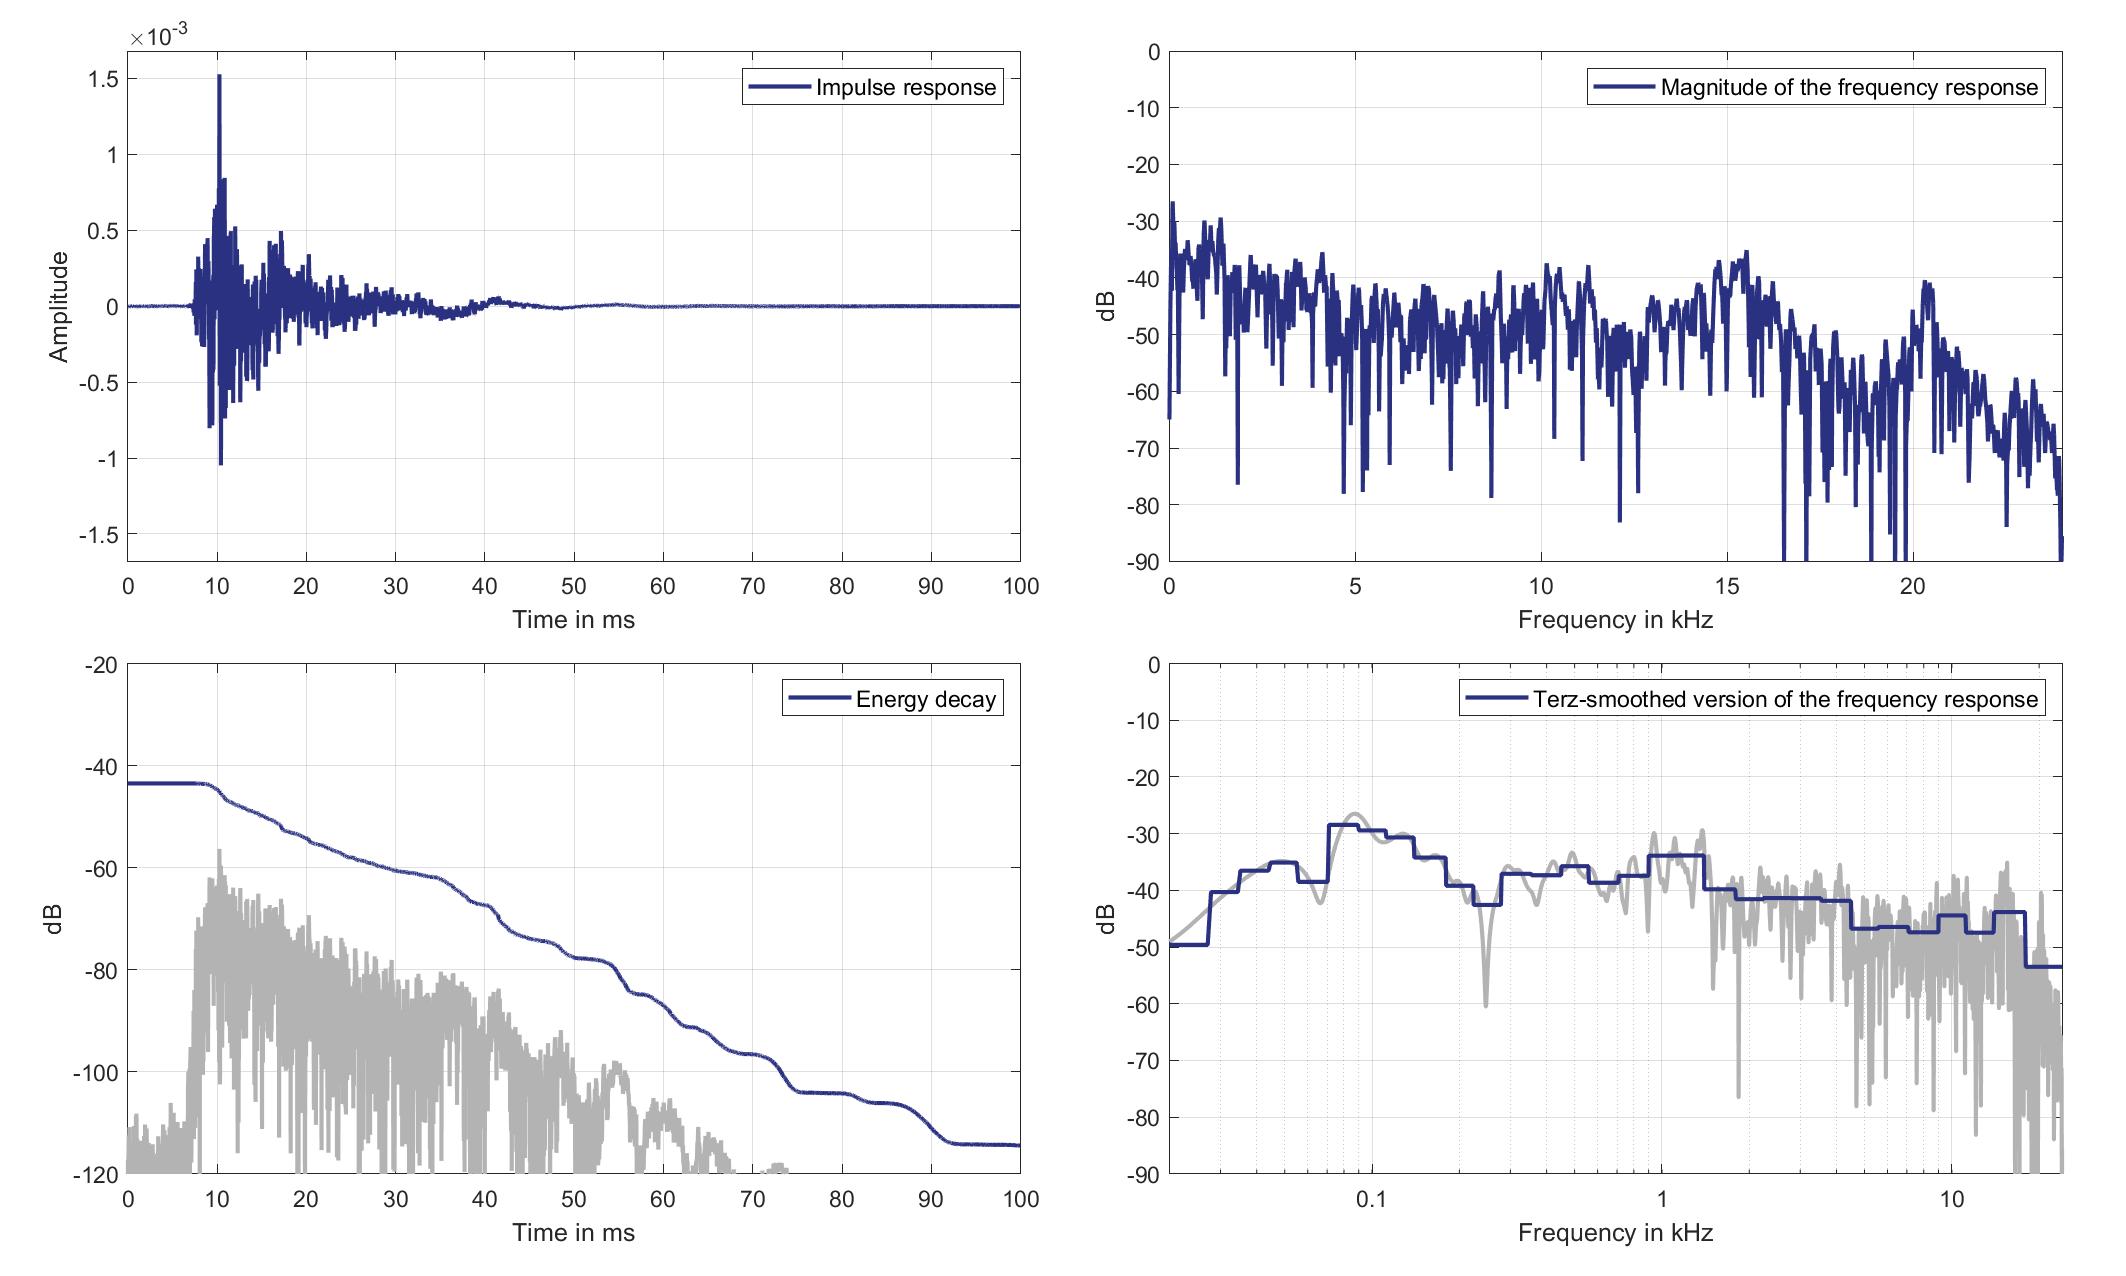
Download impulse response (in ".fir" format).
In the download section you can download all impulse response files as well as format explanation and Matlab as well as Python code examples for loading fir files.
Mics. 23/24
Left Ear Microphone
Standard Car Loudspeaker 0 (Lsp. 18) to Left Ear Microphone of Zone 3 (Mic. 23)
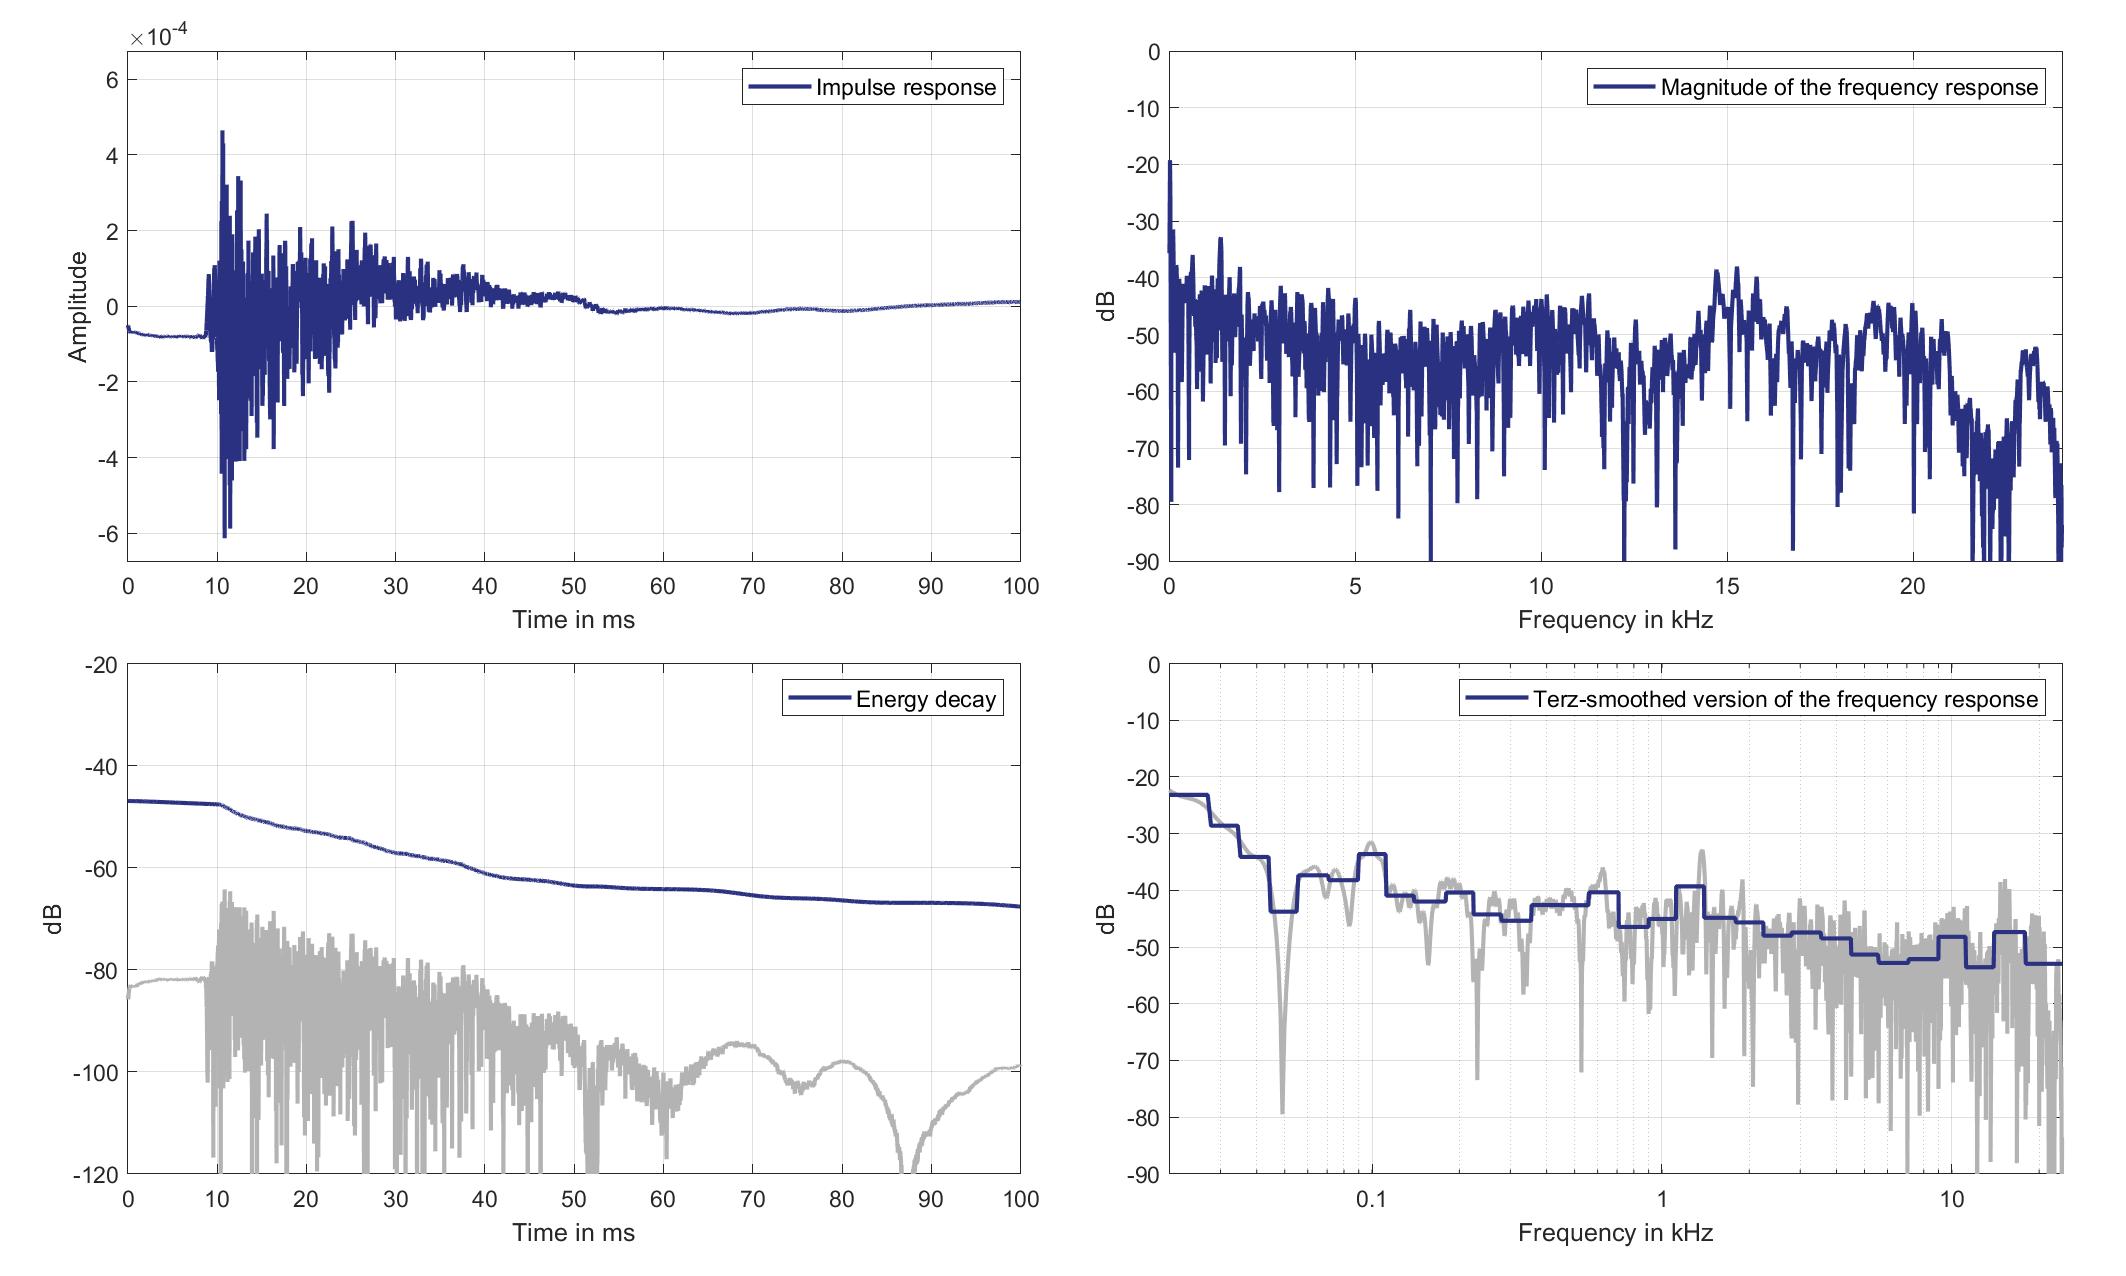
Download impulse response (in ".fir" format).
In the download section you can download all impulse response files as well as format explanation and Matlab as well as Python code examples for loading fir files.
Right Ear Microphone
Standard Car Loudspeaker 0 (Lsp. 18) to Right Ear Microphone of Zone 3 (Mic. 24)
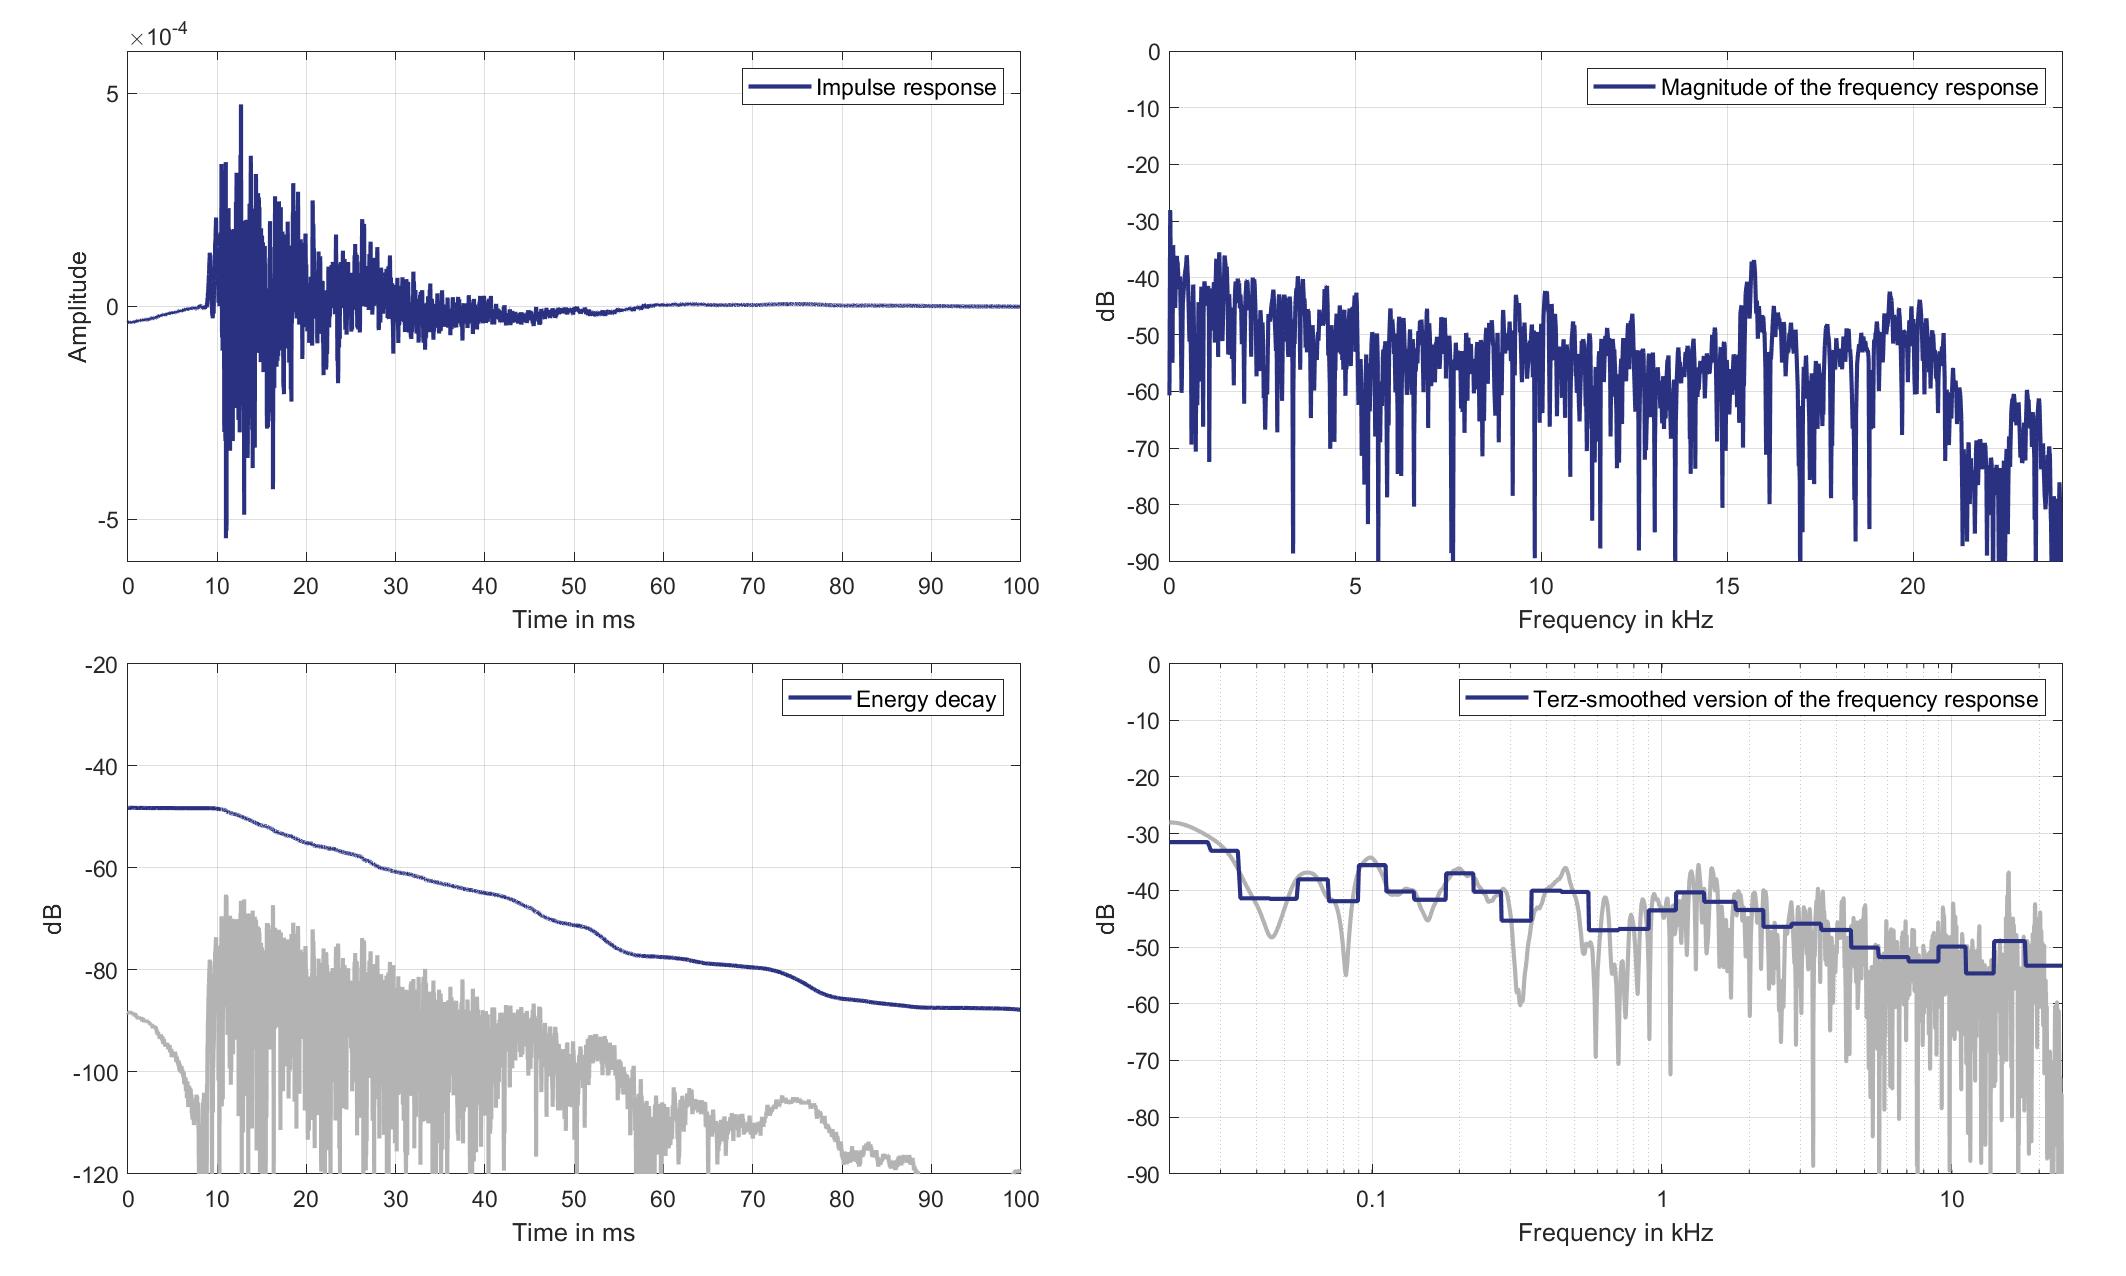
Download impulse response (in ".fir" format).
In the download section you can download all impulse response files as well as format explanation and Matlab as well as Python code examples for loading fir files.
Mics. 25/26
Left Ear Microphone
Standard Car Loudspeaker 0 (Lsp. 18) to Left Ear Microphone of Zone 5 (Mic. 25)
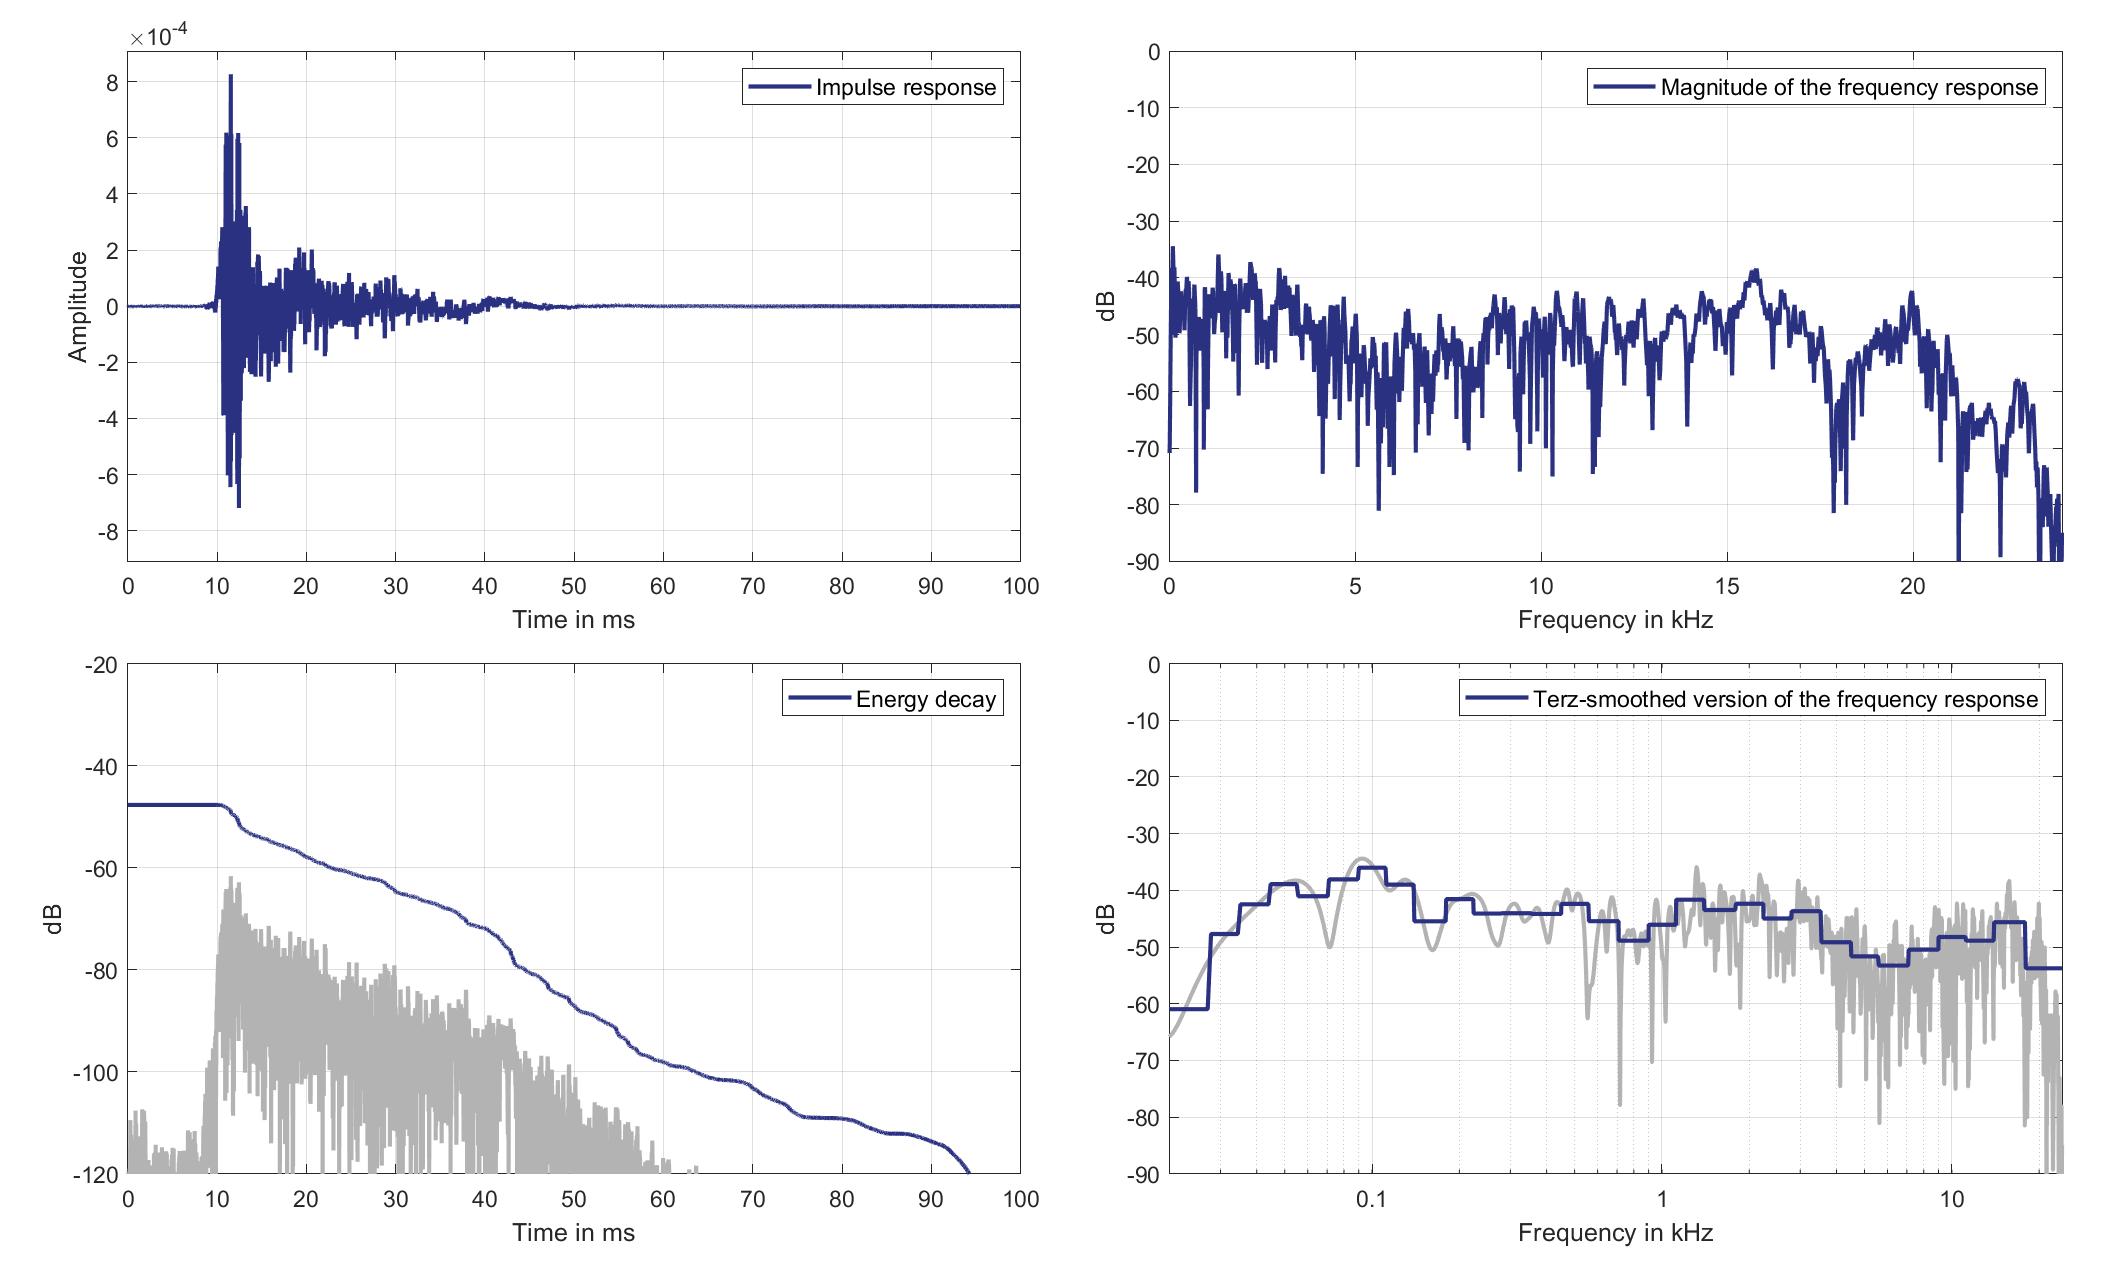
Download impulse response (in ".fir" format).
In the download section you can download all impulse response files as well as format explanation and Matlab as well as Python code examples for loading fir files.
Right Ear Microphone
Standard Car Loudspeaker 0 (Lsp. 18) to Right Ear Microphone of Zone 5 (Mic. 26)

Download impulse response (in ".fir" format).
In the download section you can download all impulse response files as well as format explanation and Matlab as well as Python code examples for loading fir files.
Mics. 27/28
Left Ear Microphone
Standard Car Loudspeaker 0 (Lsp. 18) to Left Ear Microphone of Zone 6 (Mic. 27)
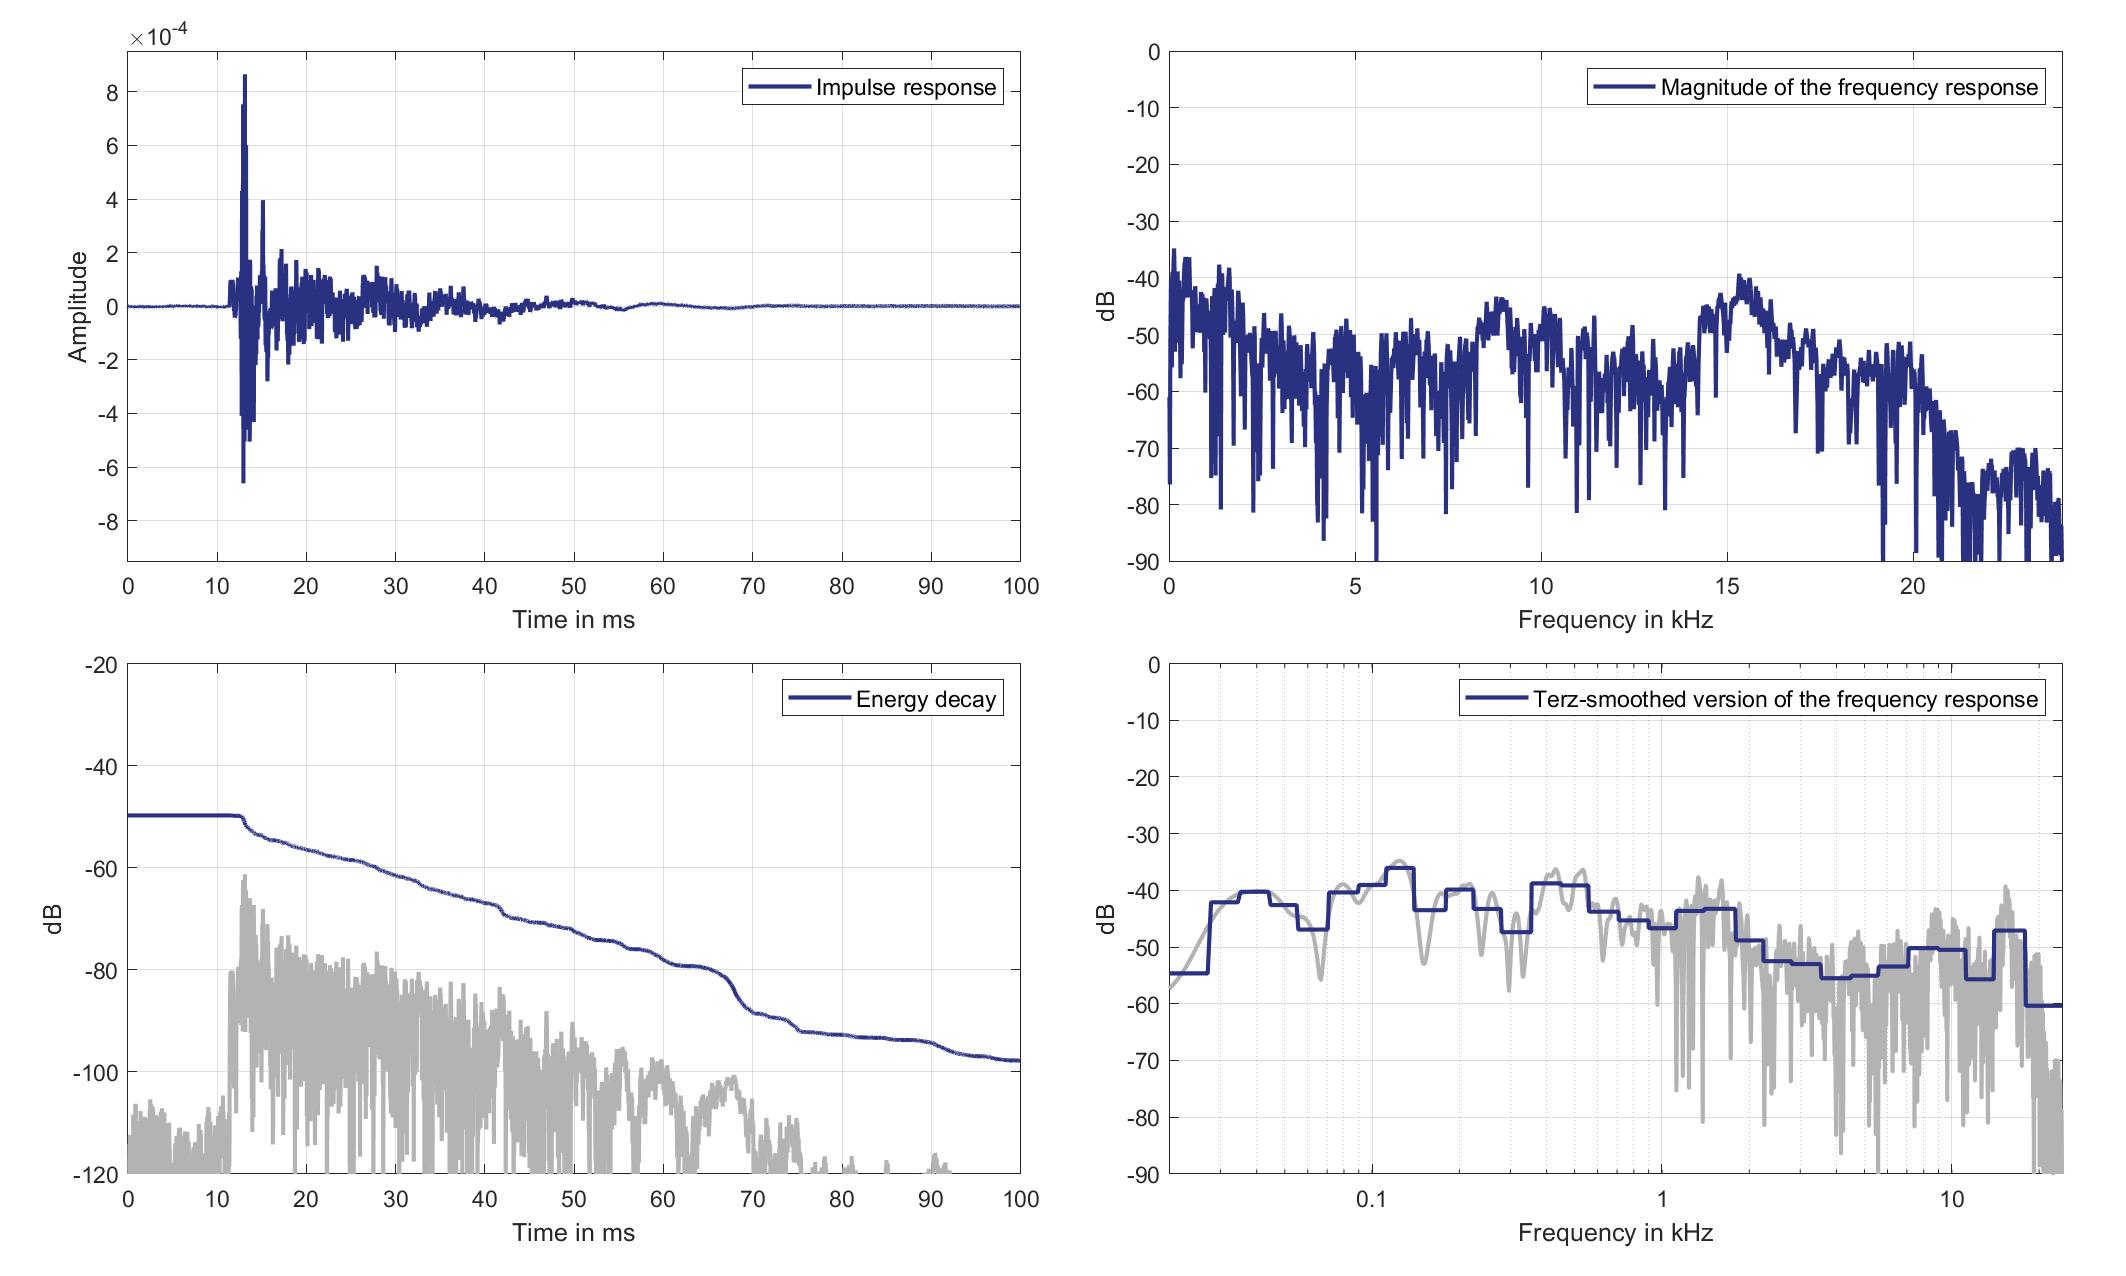
Download impulse response (in ".fir" format).
In the download section you can download all impulse response files as well as format explanation and Matlab as well as Python code examples for loading fir files.
Right Ear Microphone
Standard Car Loudspeaker 0 (Lsp. 18) to Right Ear Microphone of Zone 6 (Mic. 28)
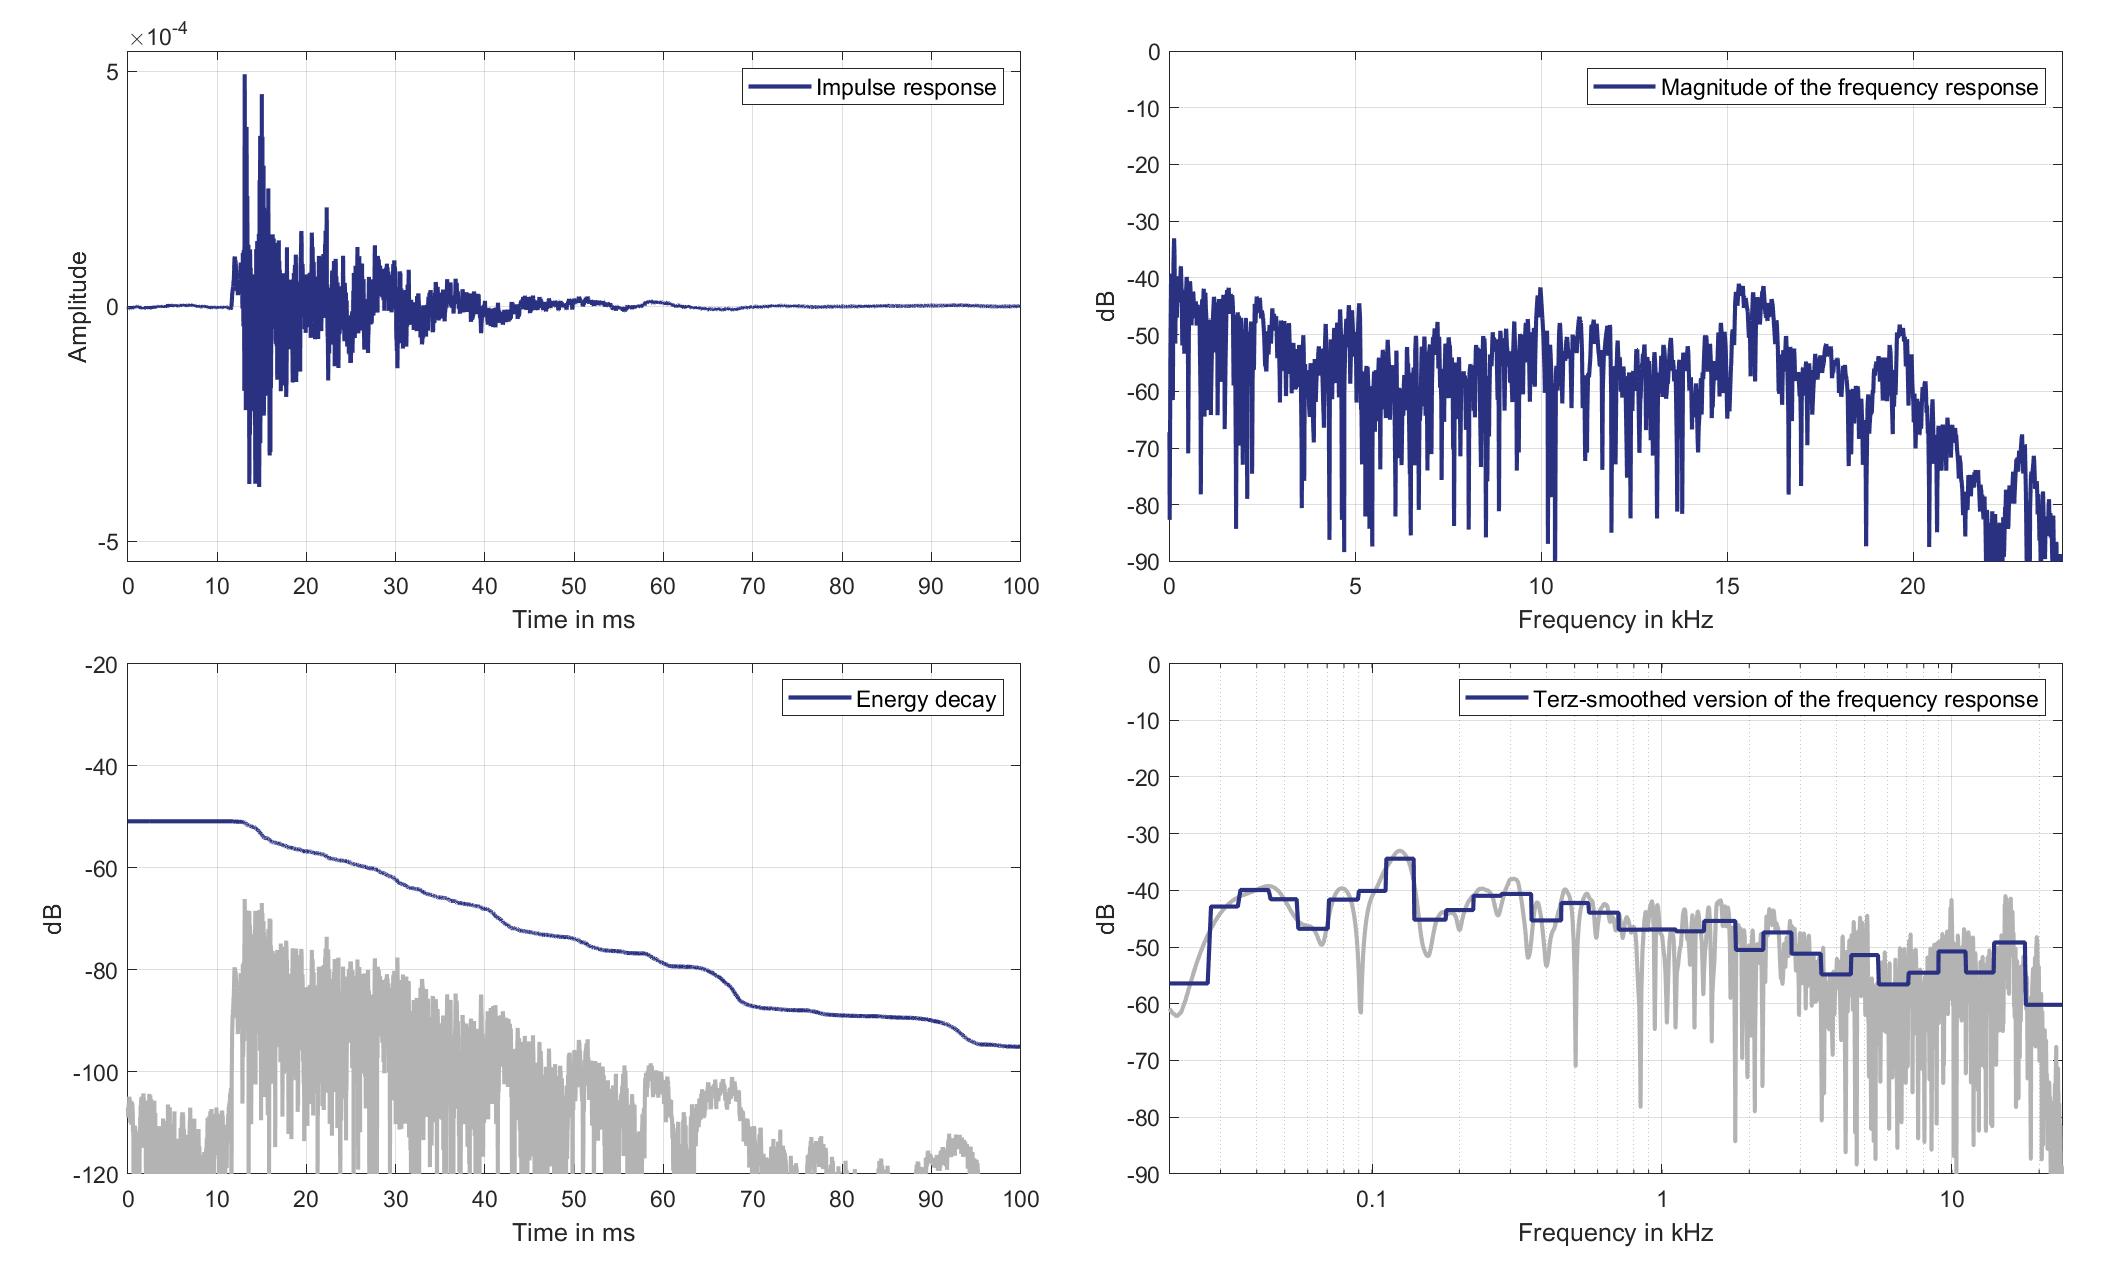
Download impulse response (in ".fir" format).
In the download section you can download all impulse response files as well as format explanation and Matlab as well as Python code examples for loading fir files.
Mics. 29/30
Left Ear Microphone
Standard Car Loudspeaker 0 (Lsp. 18) to Left Ear Microphone of Zone 8 (Mic. 29)
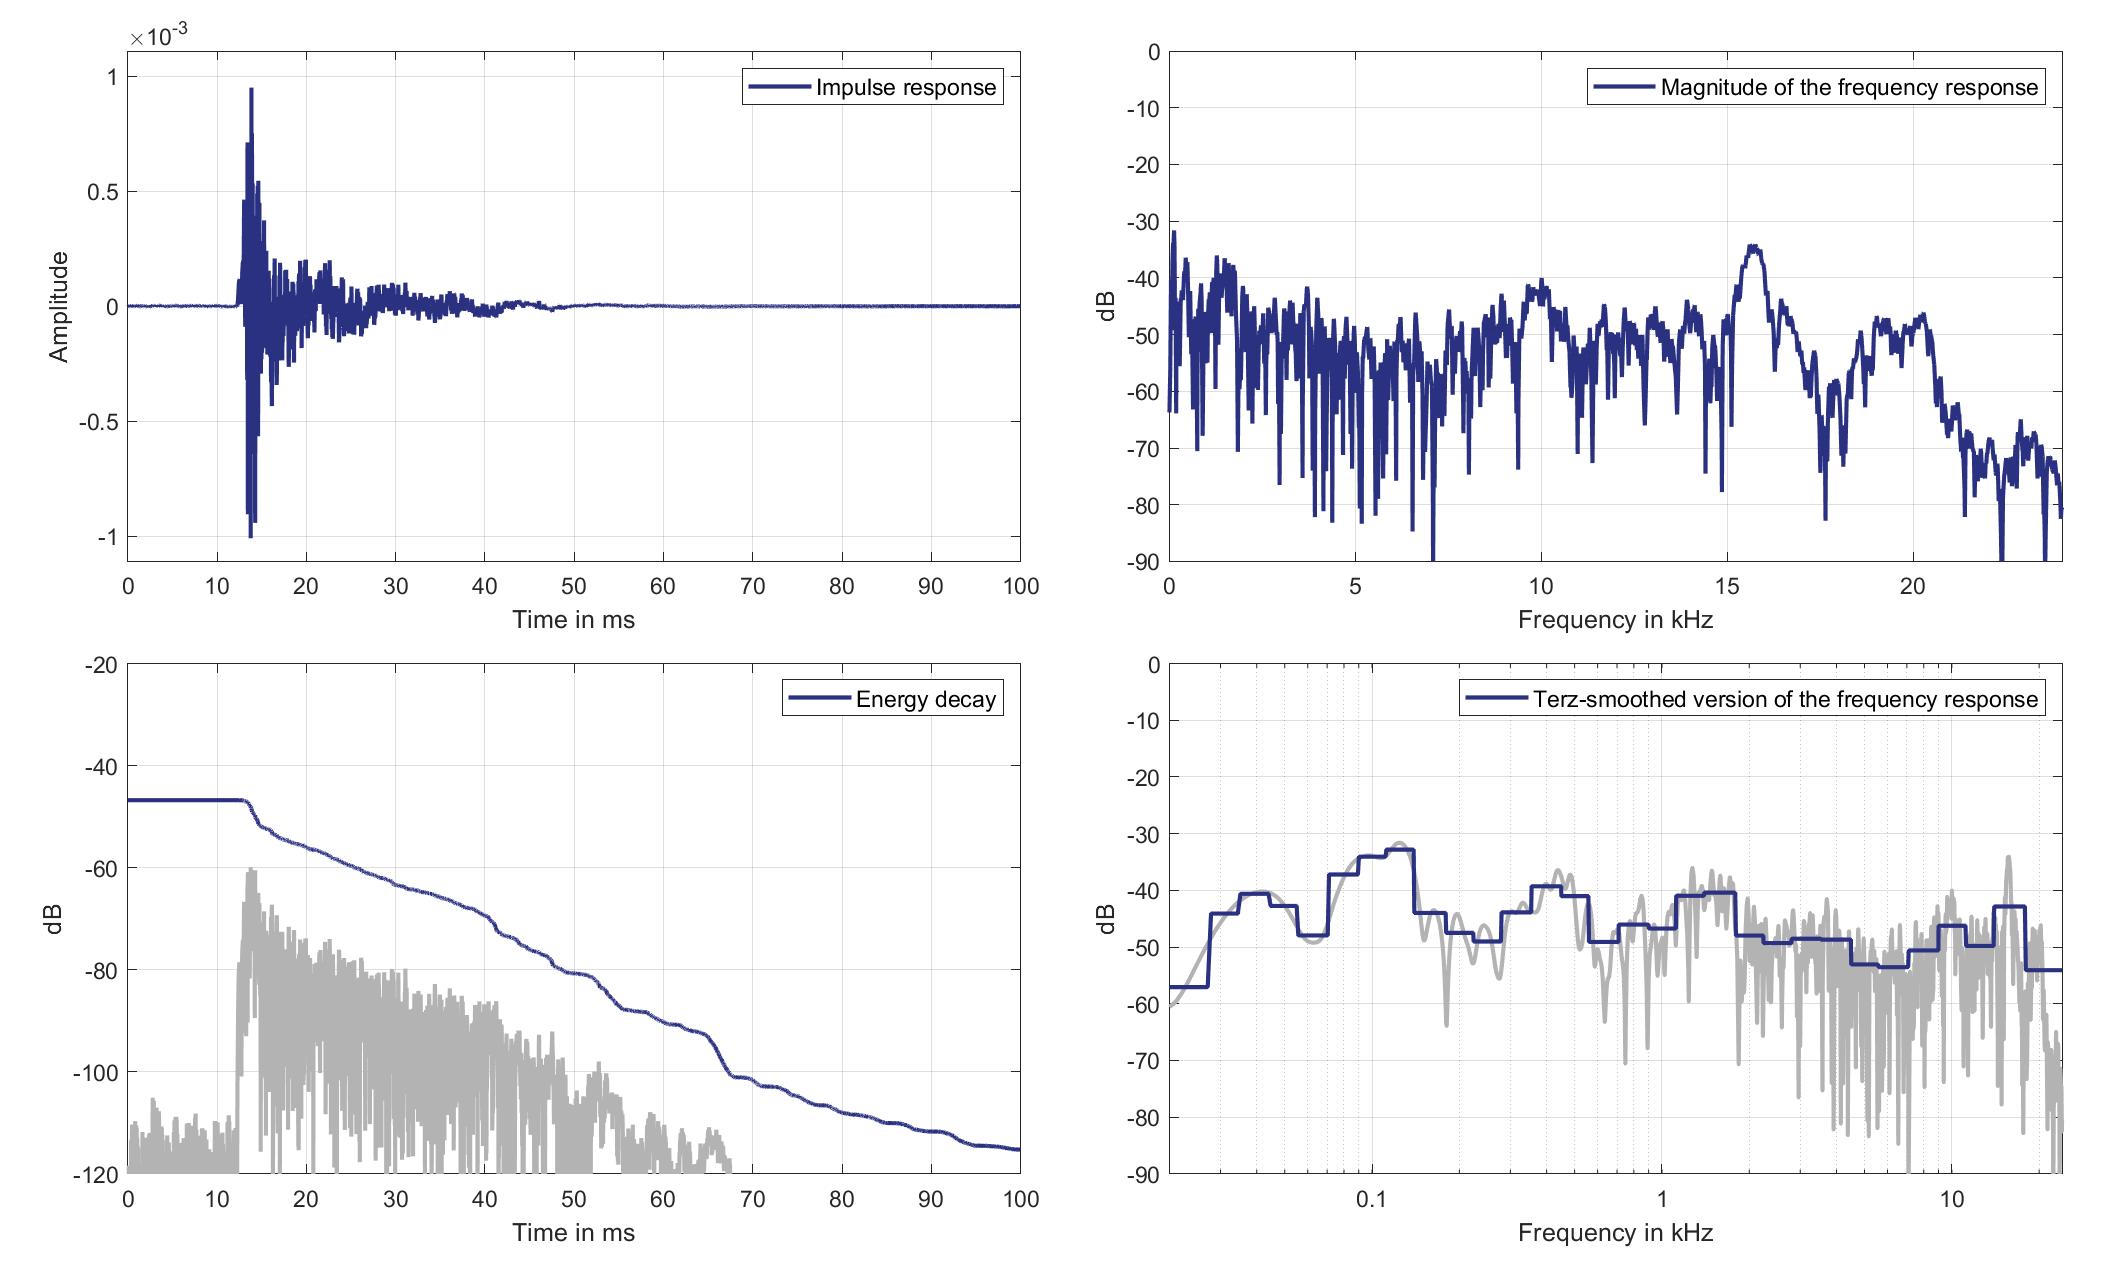
Download impulse response (in ".fir" format).
In the download section you can download all impulse response files as well as format explanation and Matlab as well as Python code examples for loading fir files.
Right Ear Microphone
Standard Car Loudspeaker 0 (Lsp. 18) to Right Ear Microphone of Zone 8 (Mic. 30)
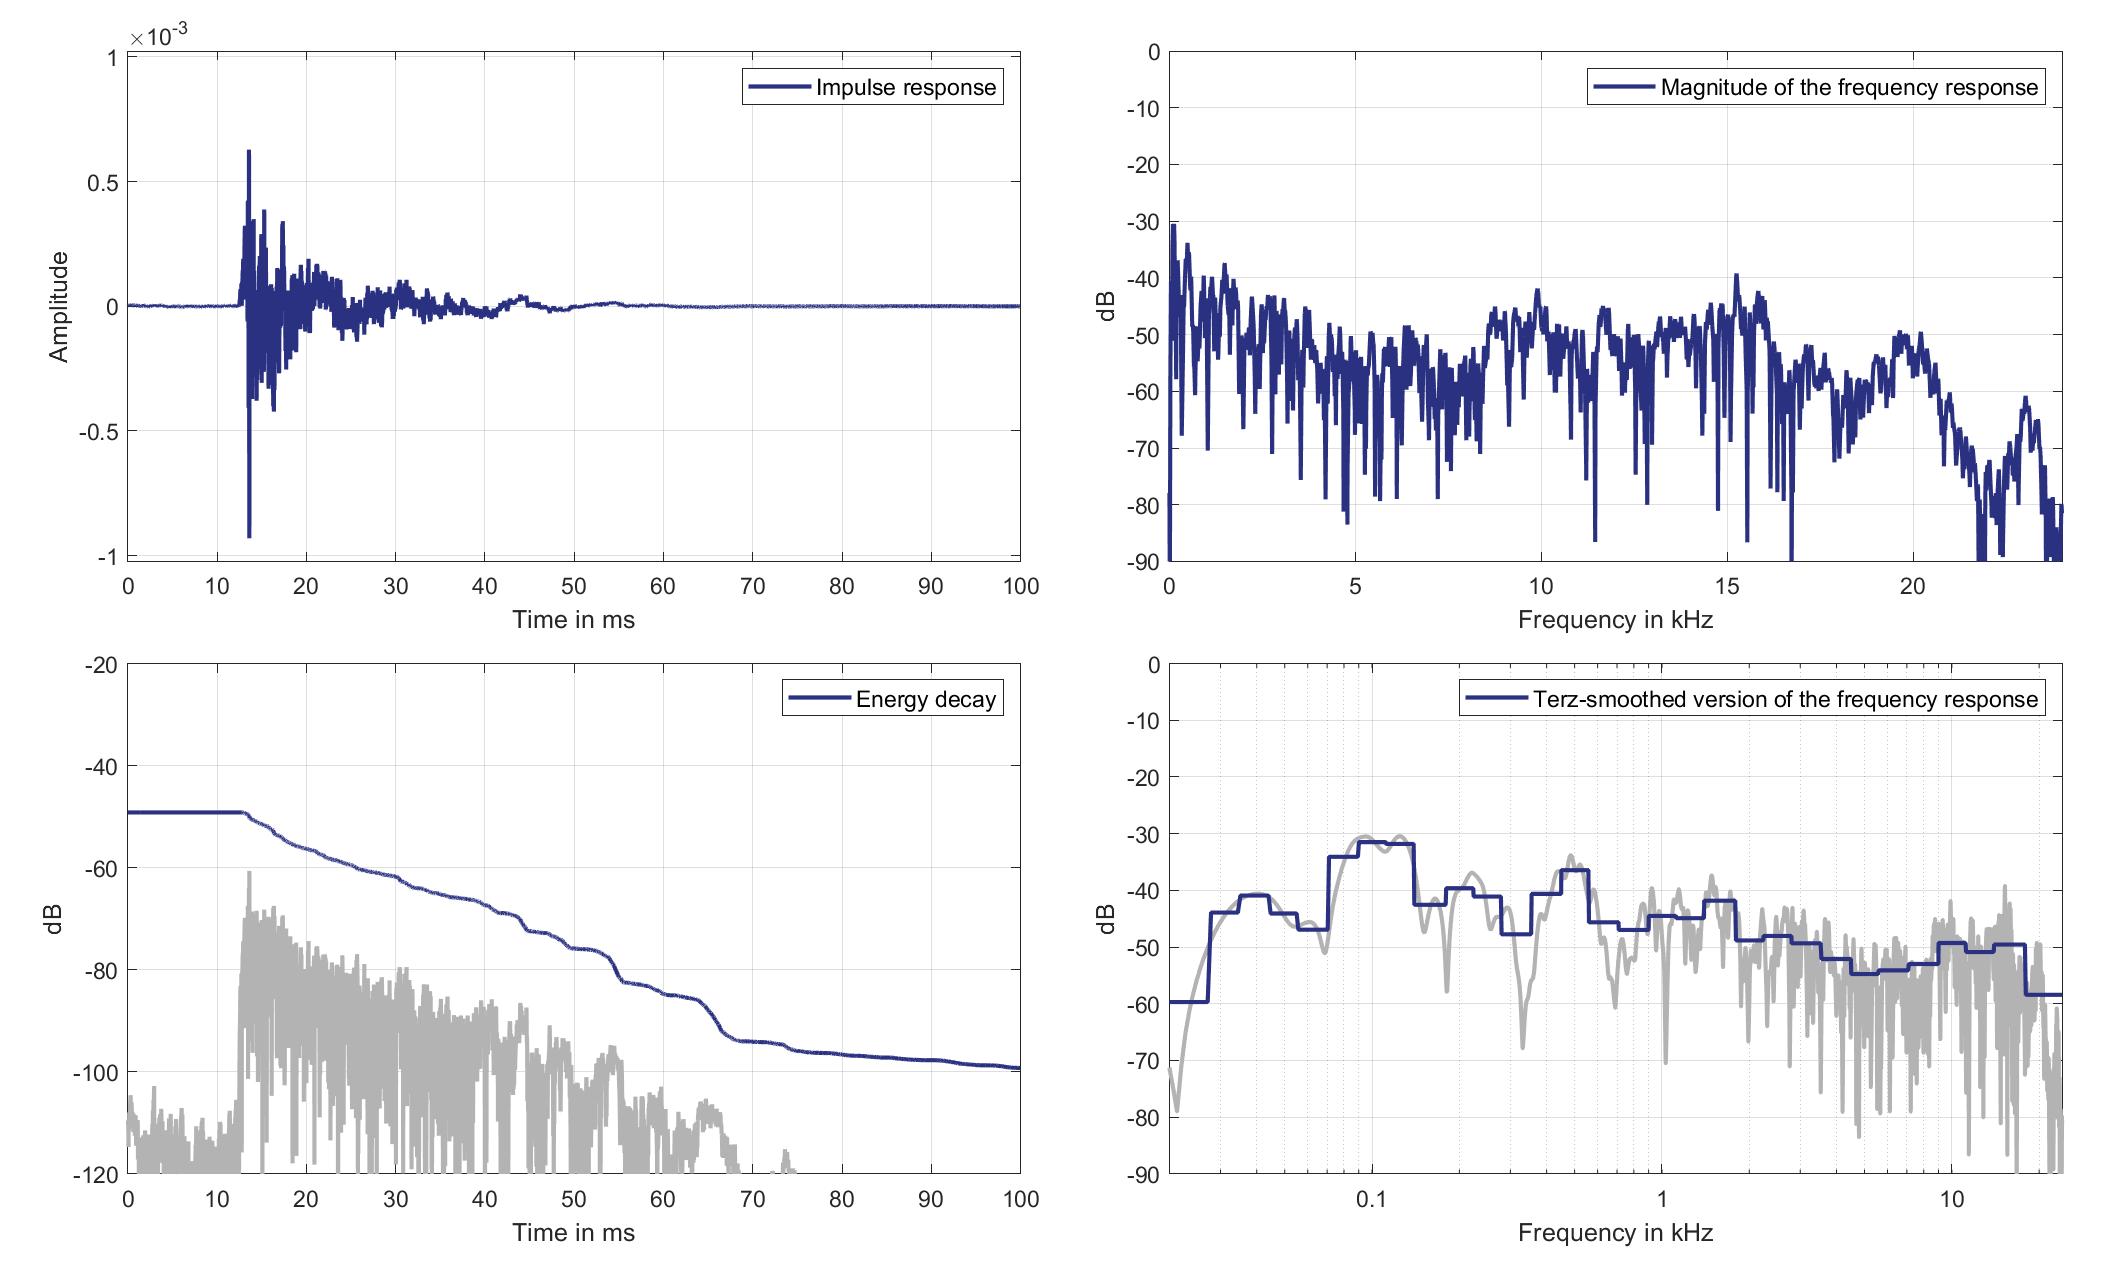
Download impulse response (in ".fir" format).
In the download section you can download all impulse response files as well as format explanation and Matlab as well as Python code examples for loading fir files.
Lsp. 19
Mics. 19/20
Left Ear Microphone
Standard Car Loudspeaker 1 (Lsp. 19) to Left Ear Microphone of Zone 1 (Mic. 19)
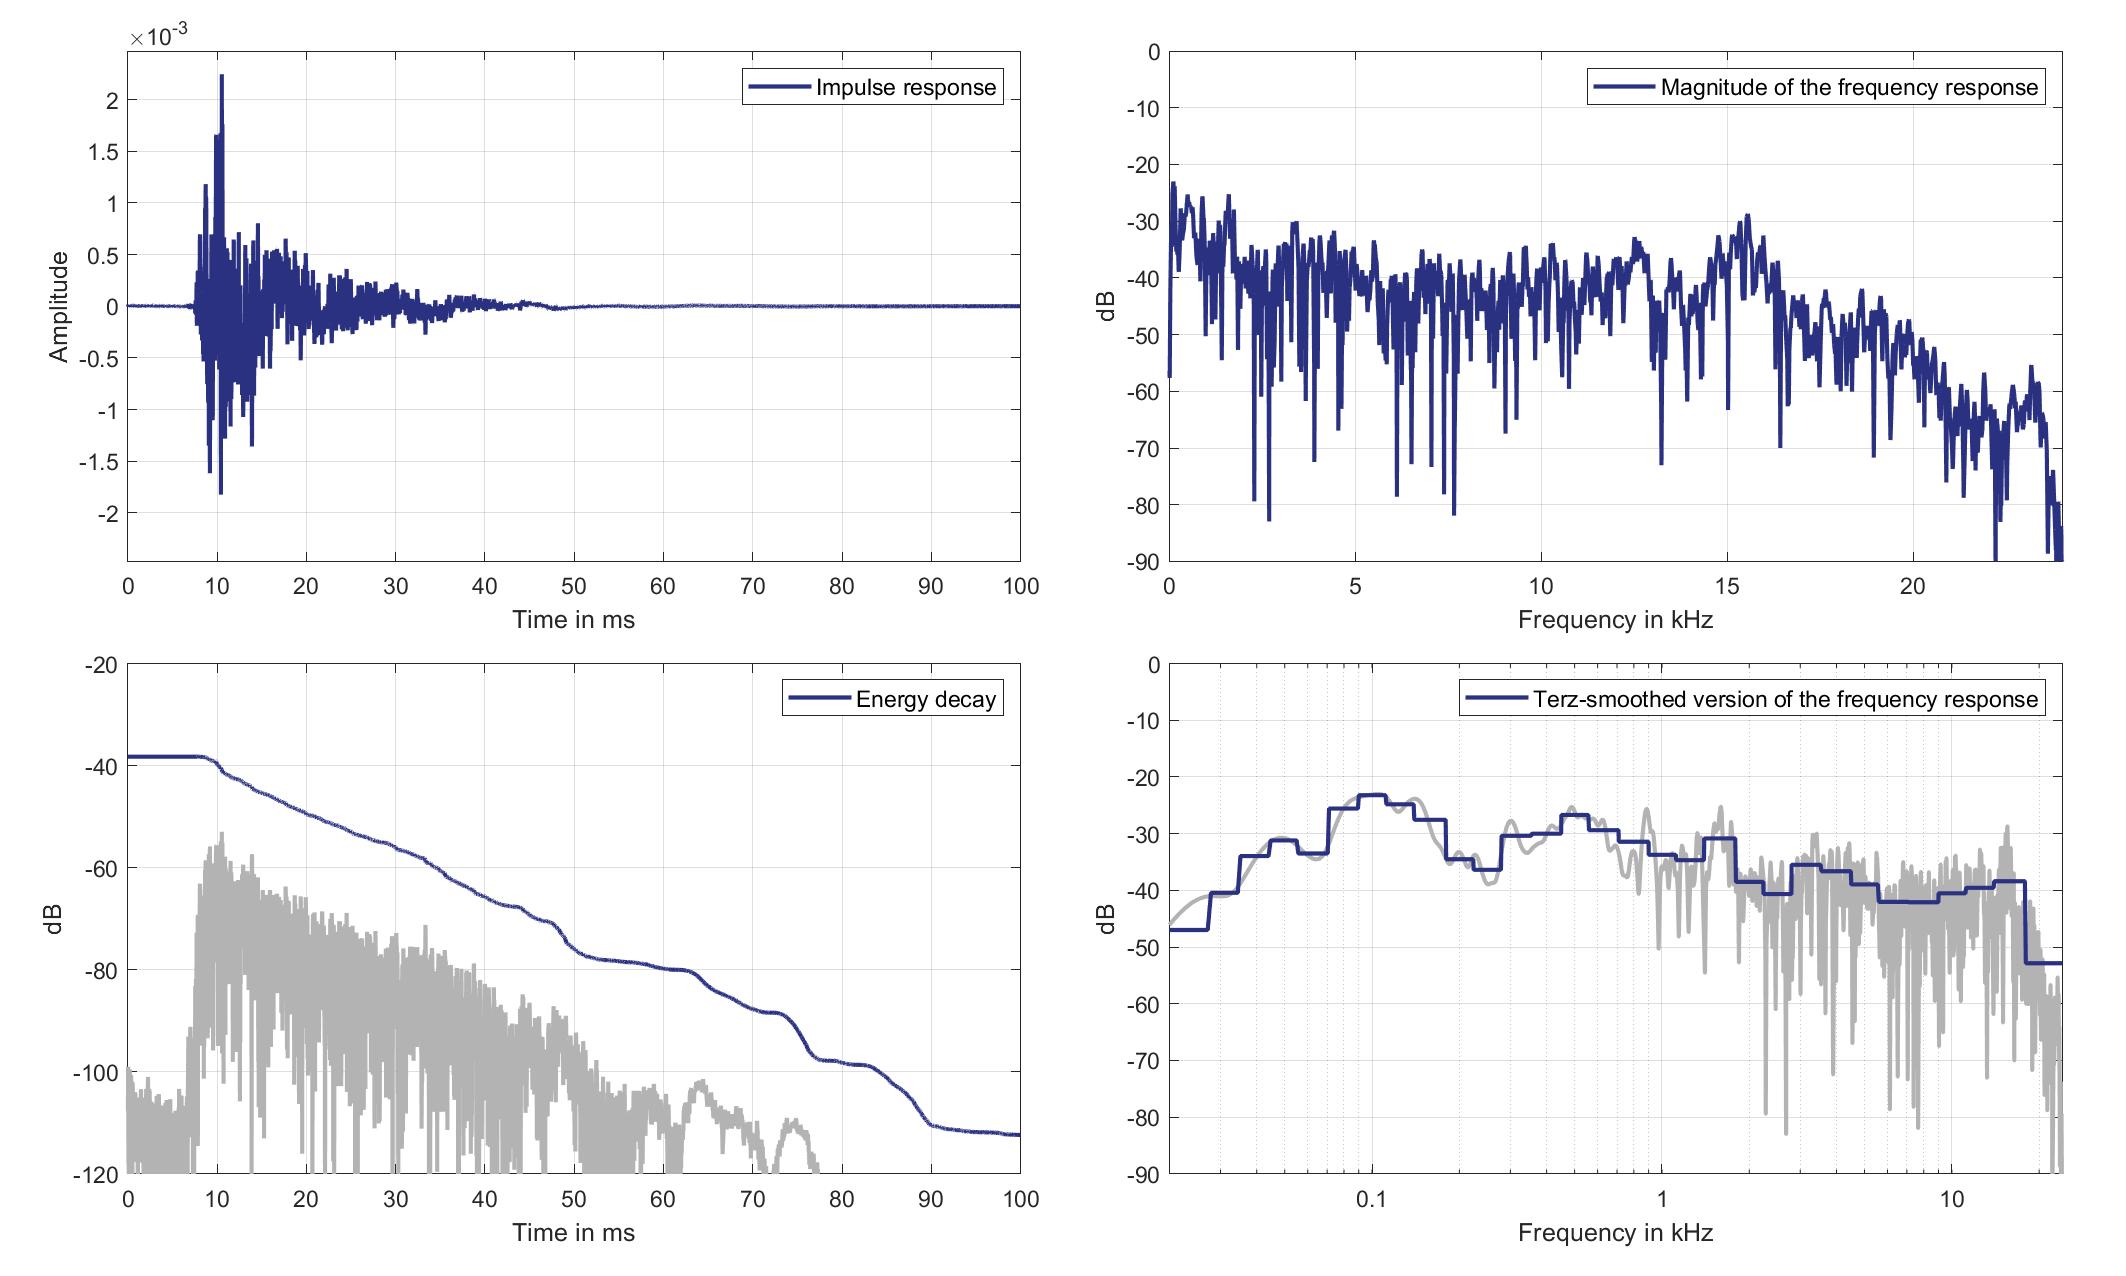
Download impulse response (in ".fir" format).
In the download section you can download all impulse response files as well as format explanation and Matlab as well as Python code examples for loading fir files.
Right Ear Microphone
Standard Car Loudspeaker 1 (Lsp. 19) to Right Ear Microphone of Zone 1 (Mic. 20)
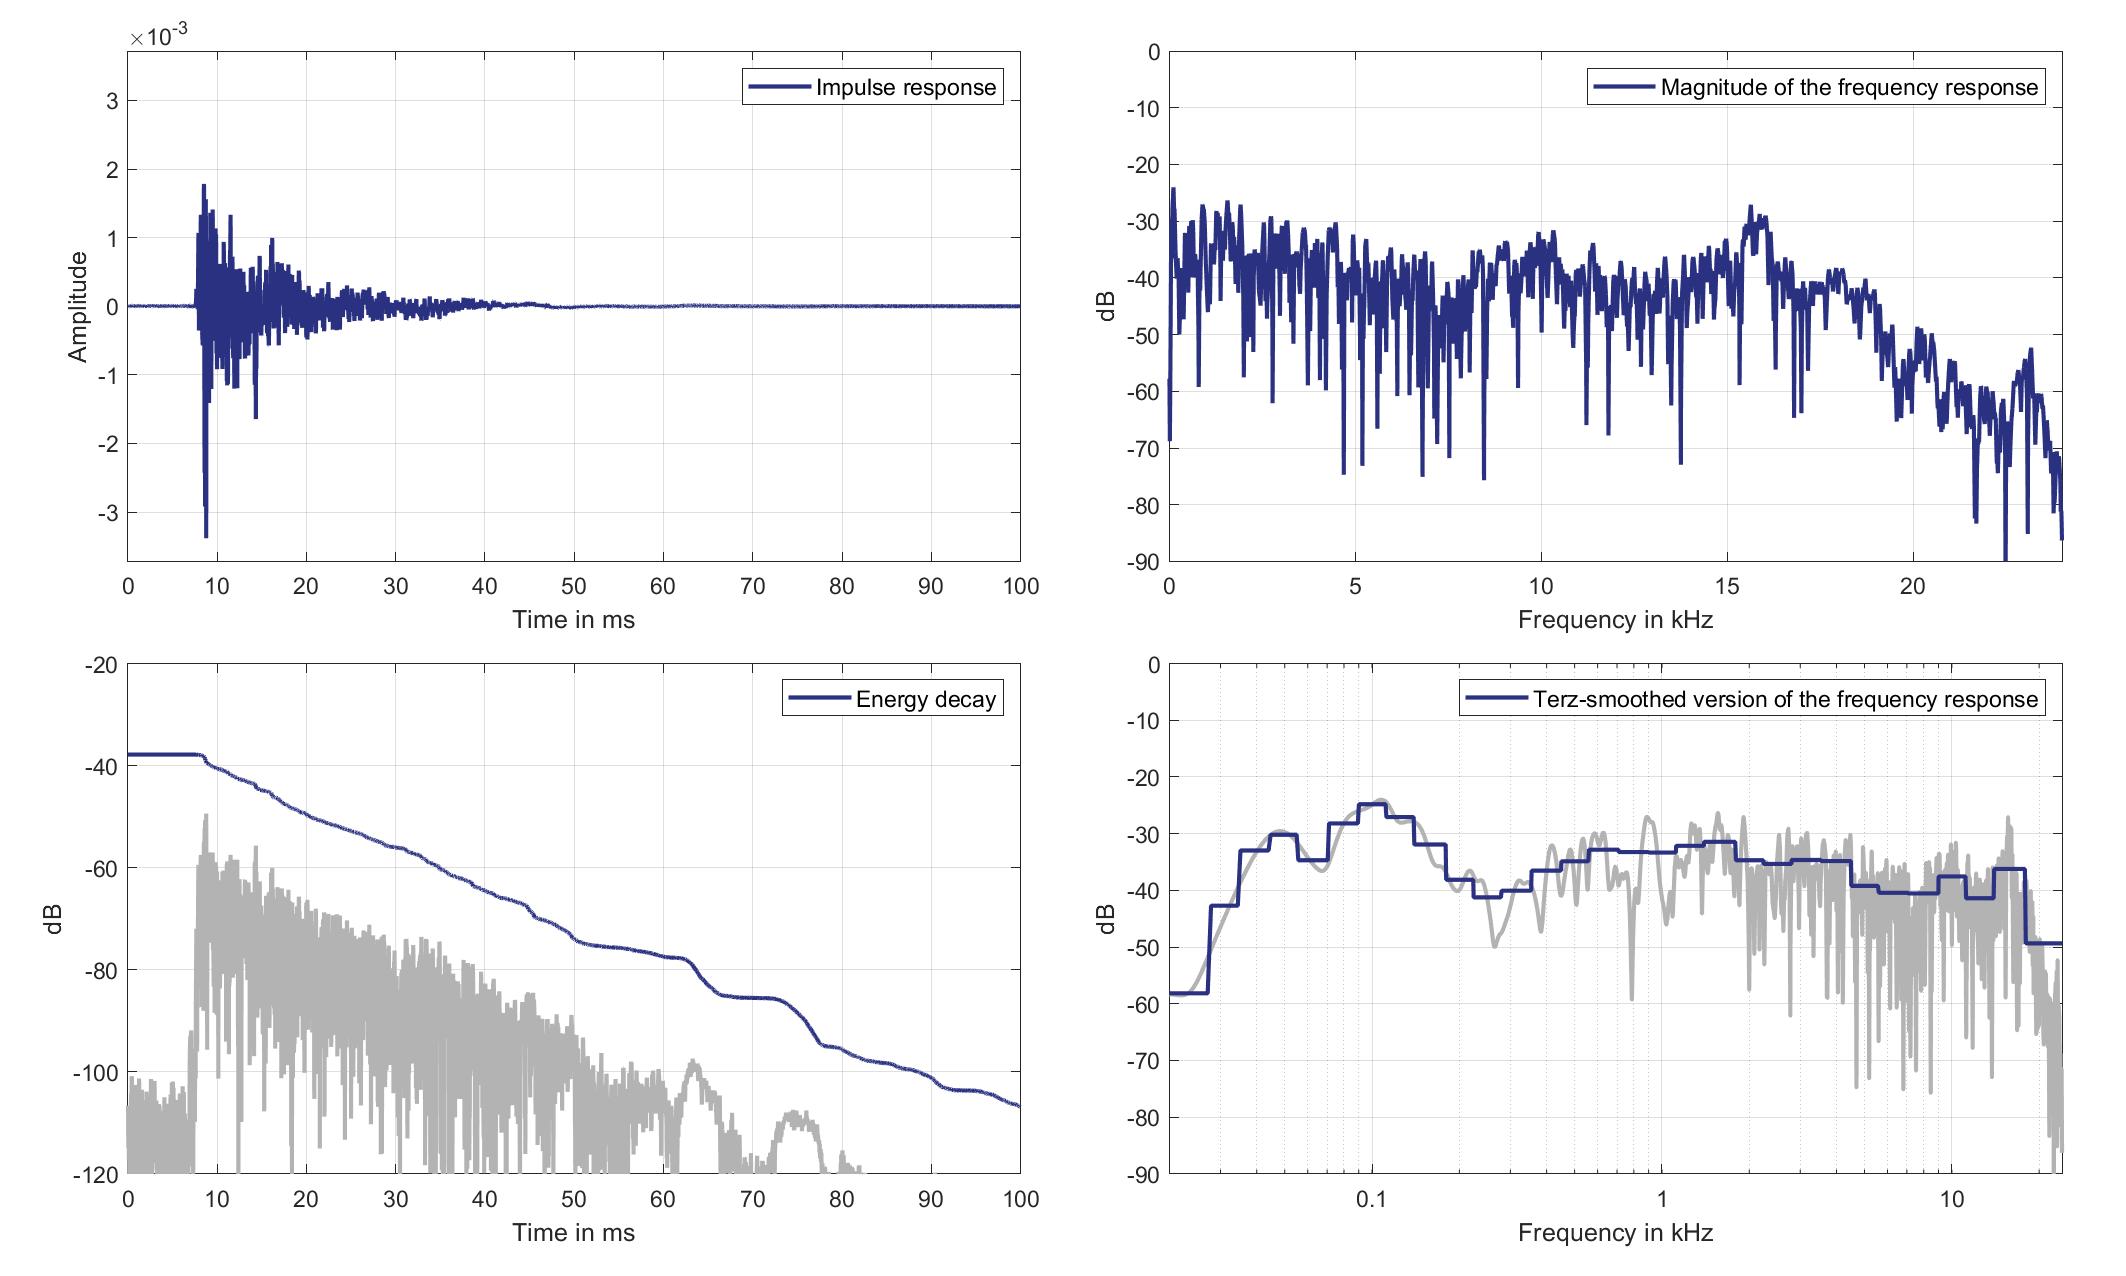
Download impulse response (in ".fir" format).
In the download section you can download all impulse response files as well as format explanation and Matlab as well as Python code examples for loading fir files.
Mics. 21/22
Left Ear Microphone
Standard Car Loudspeaker 1 (Lsp. 19) to Left Ear Microphone of Zone 2 (Mic. 21)
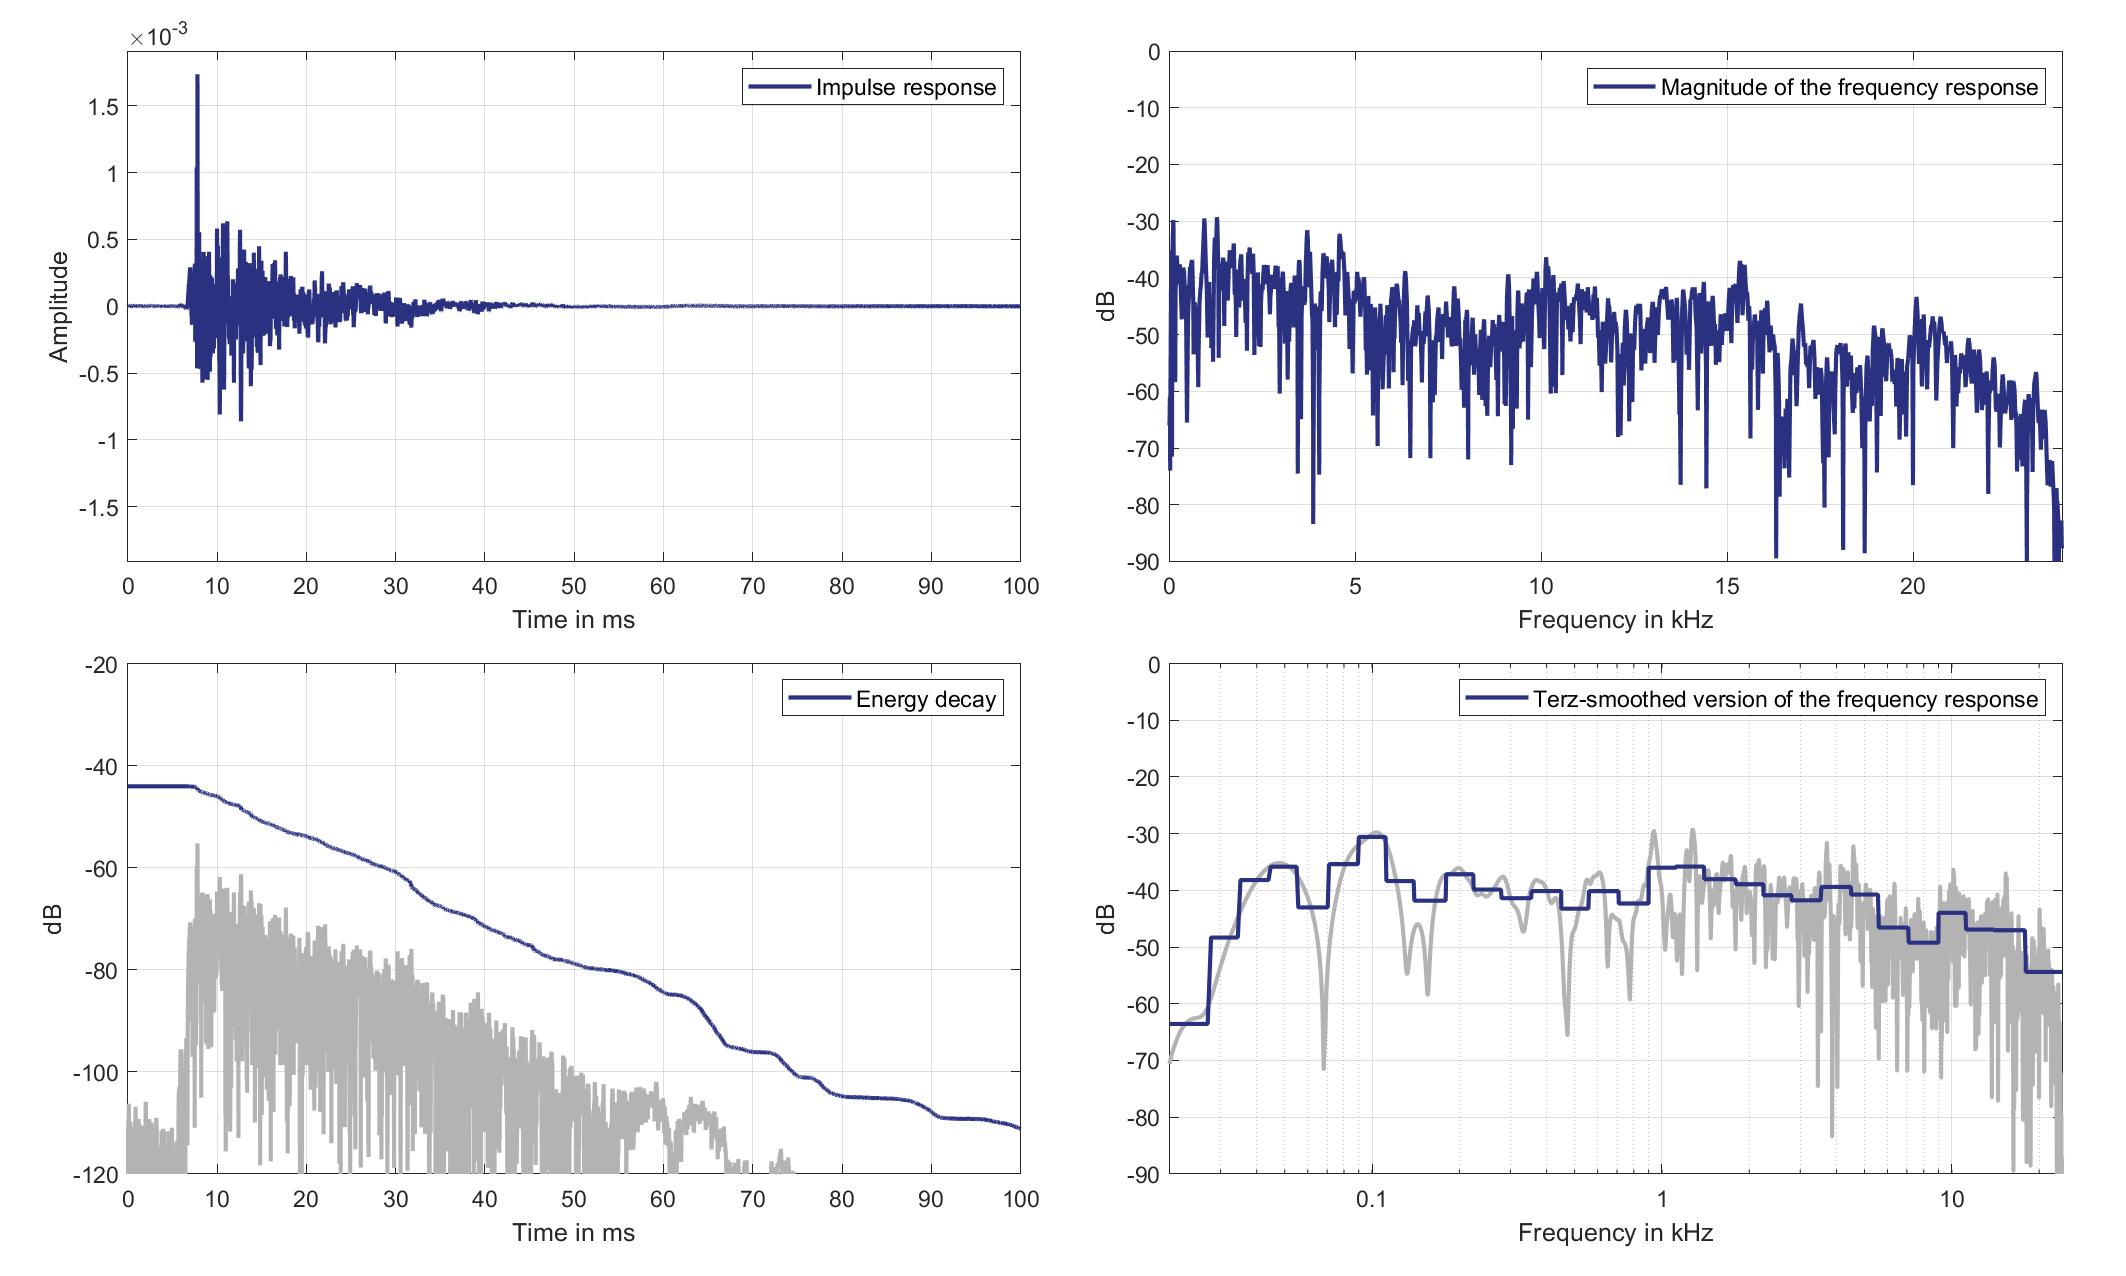
Download impulse response (in ".fir" format).
In the download section you can download all impulse response files as well as format explanation and Matlab as well as Python code examples for loading fir files.
Right Ear Microphone
Standard Car Loudspeaker 1 (Lsp. 19) to Right Ear Microphone of Zone 2 (Mic. 22)
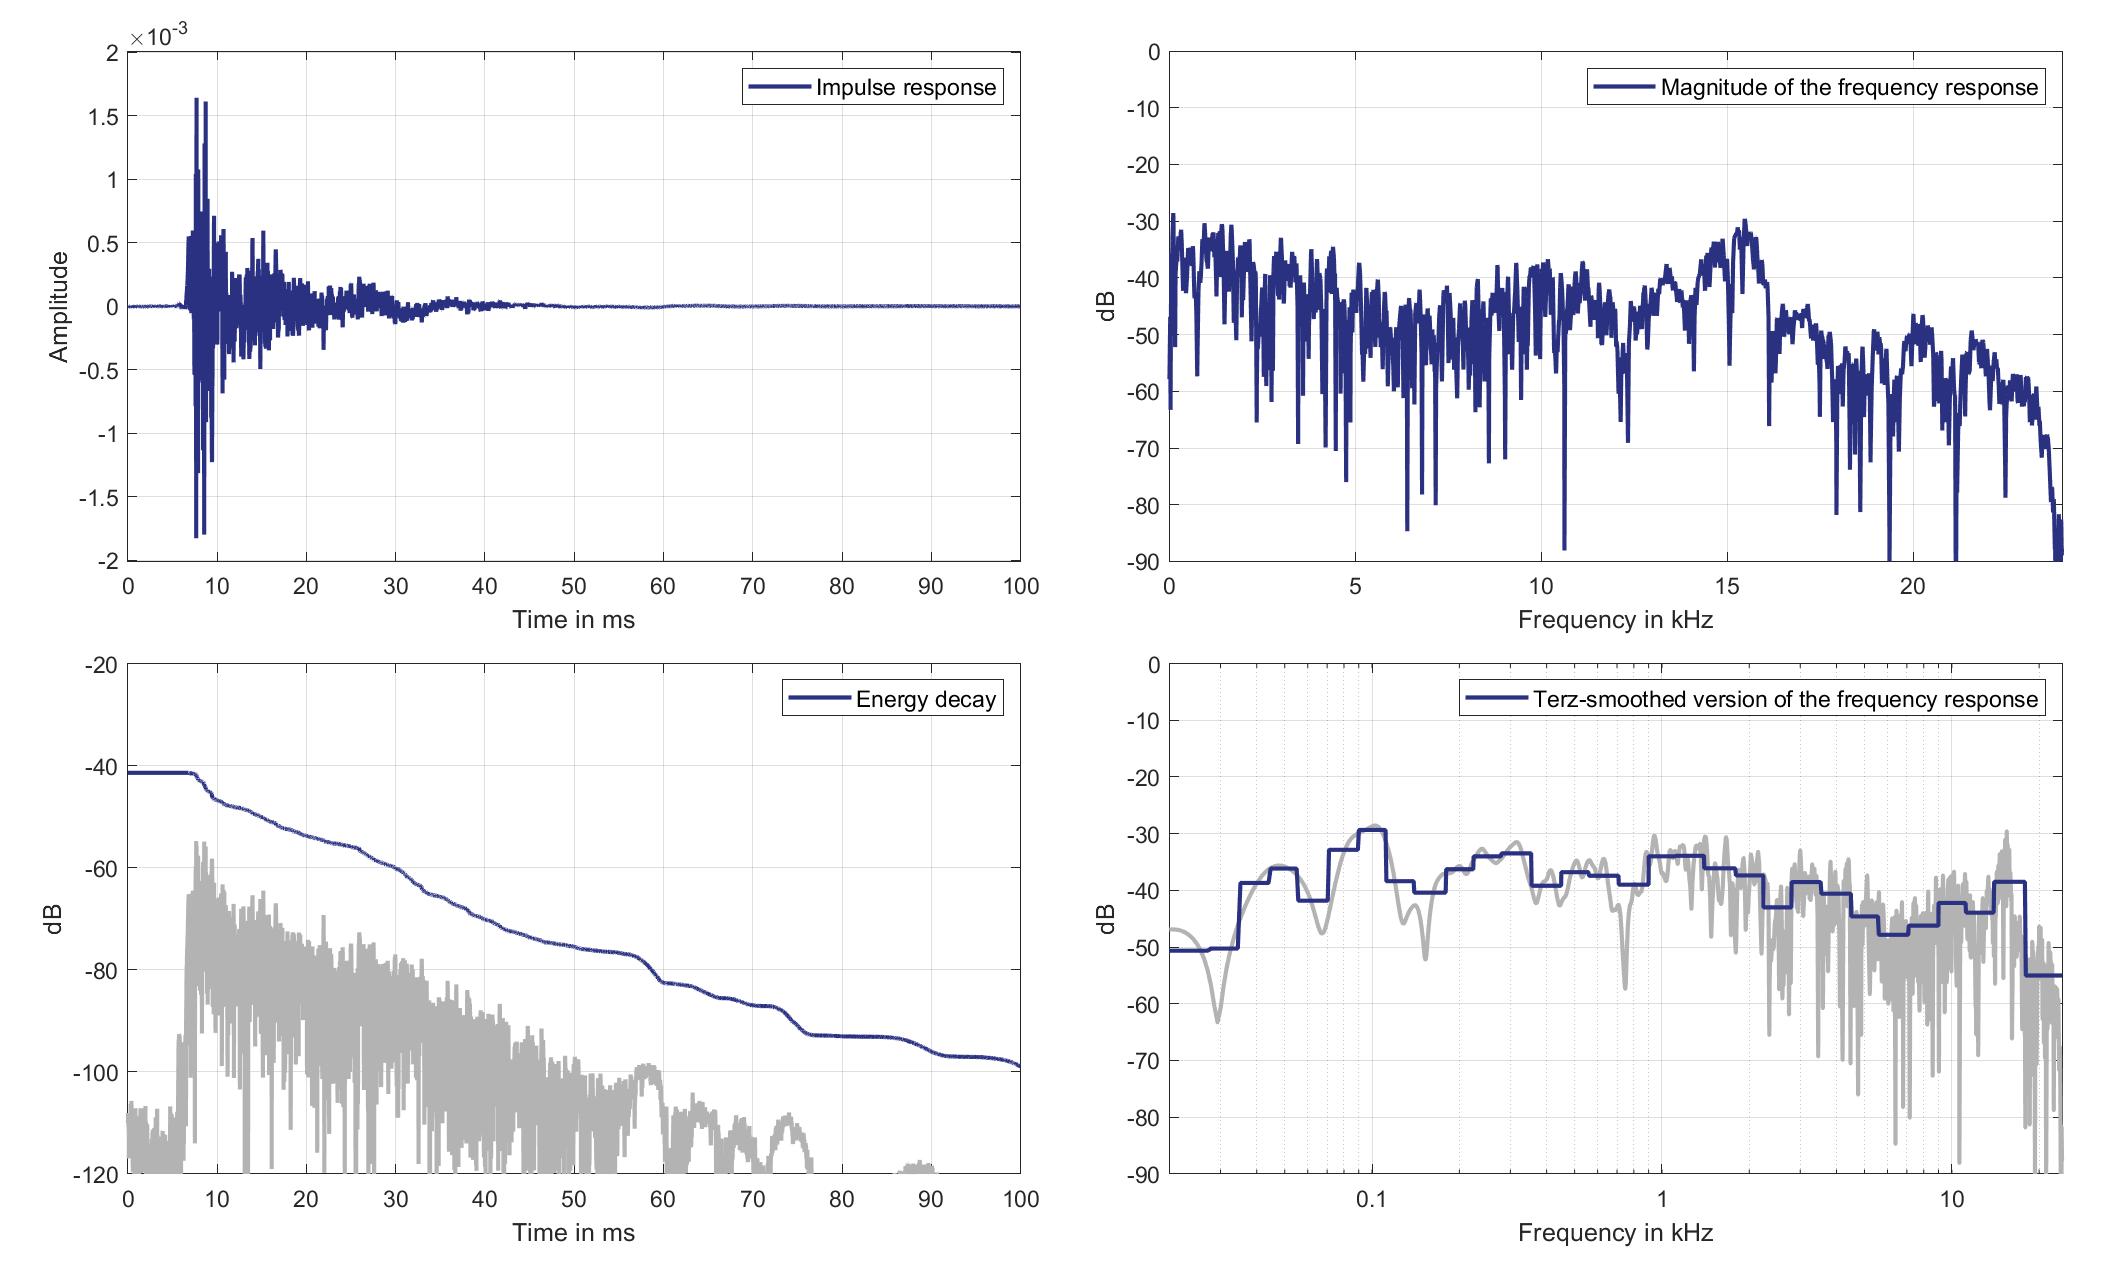
Download impulse response (in ".fir" format).
In the download section you can download all impulse response files as well as format explanation and Matlab as well as Python code examples for loading fir files.
Mics. 23/24
Left Ear Microphone
Standard Car Loudspeaker 1 (Lsp. 19) to Left Ear Microphone of Zone 3 (Mic. 23)
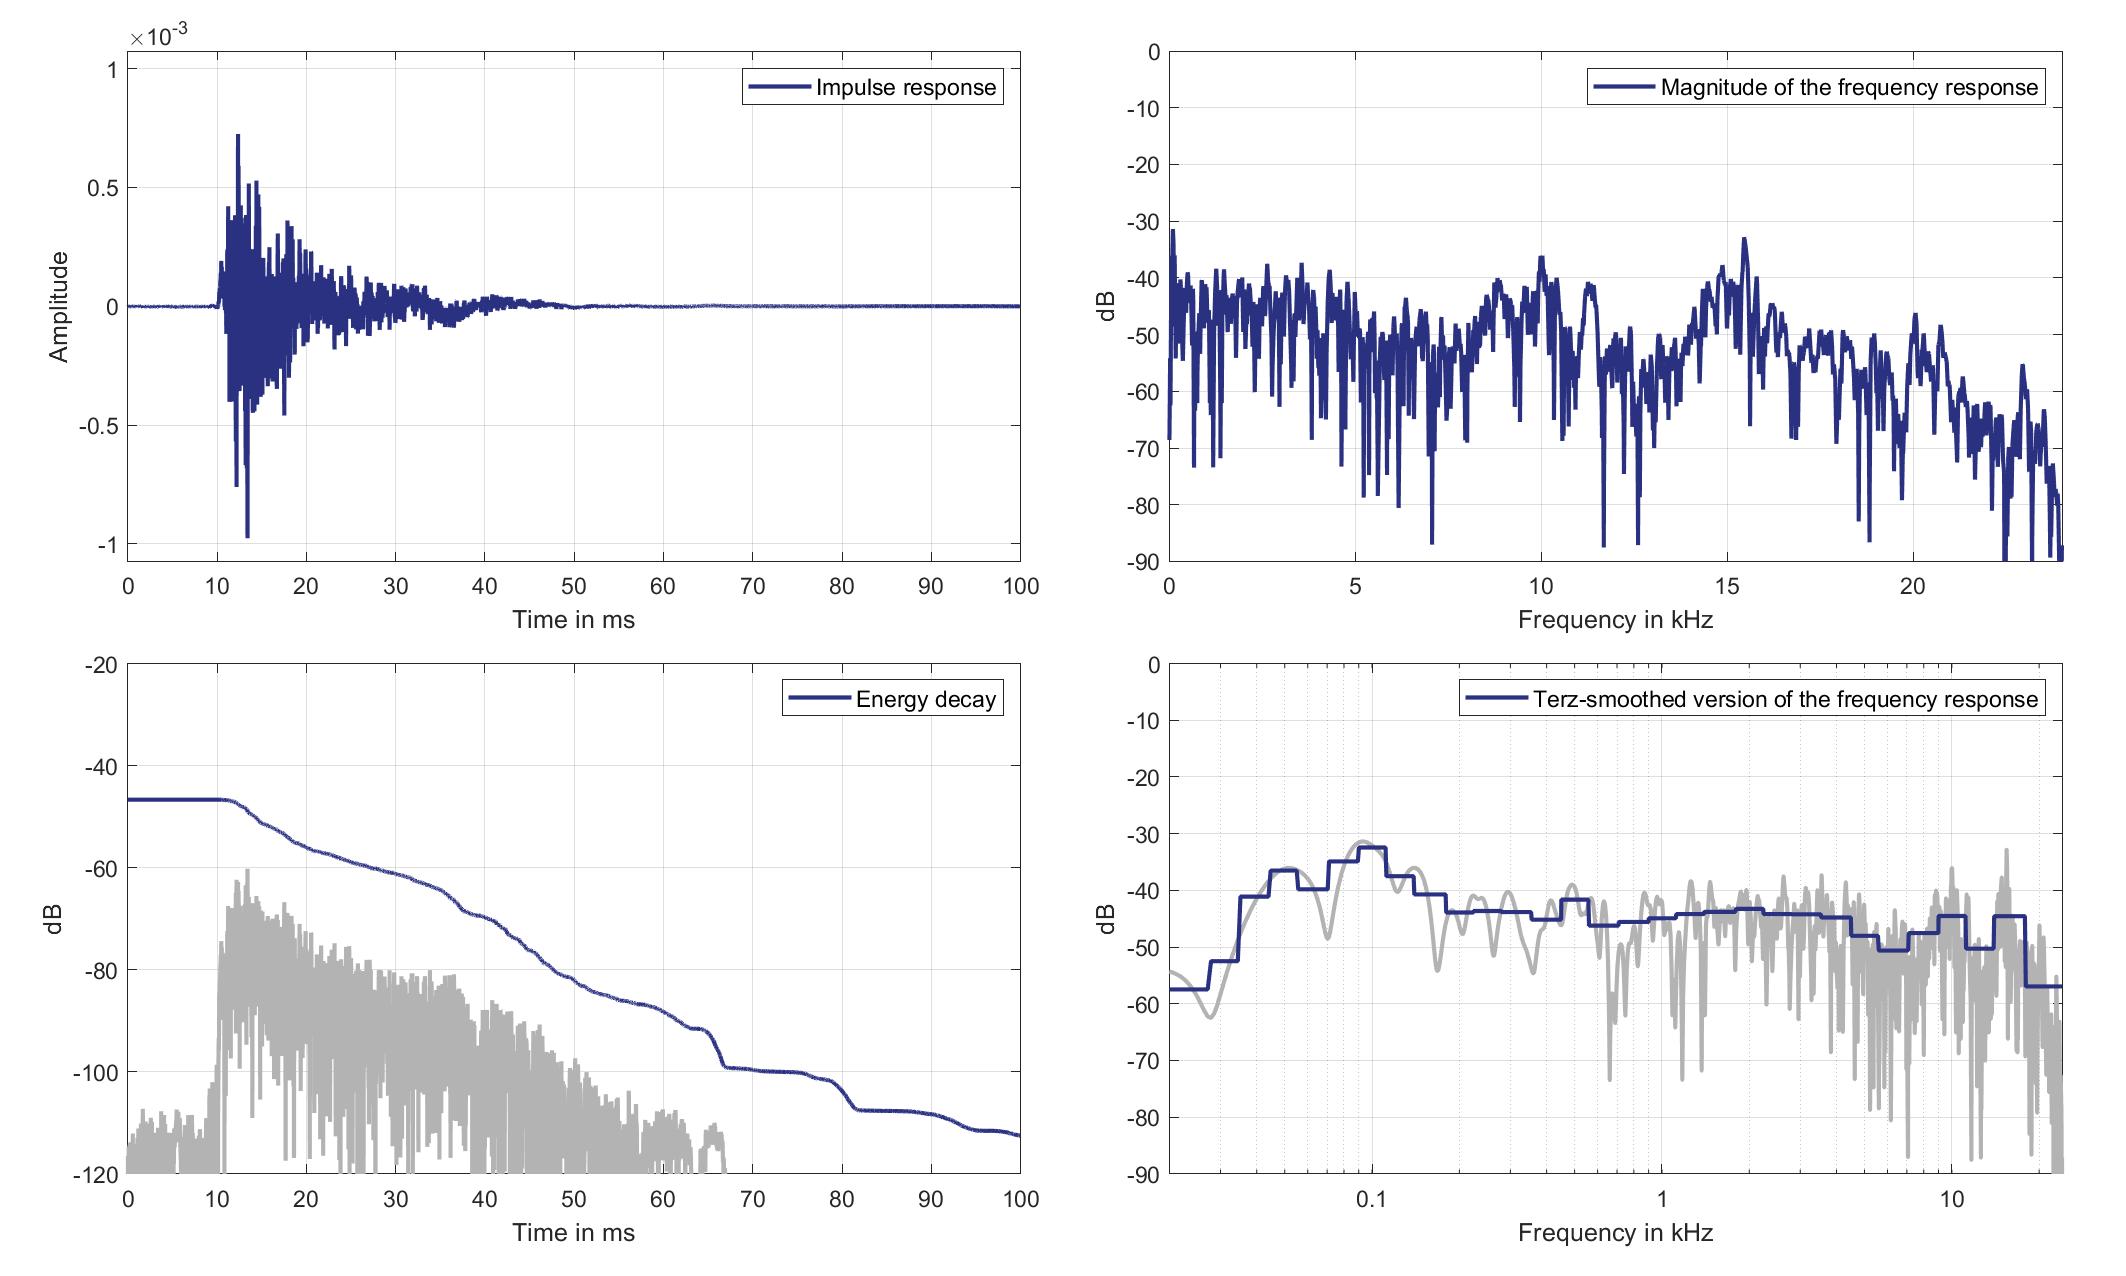
Download impulse response (in ".fir" format).
In the download section you can download all impulse response files as well as format explanation and Matlab as well as Python code examples for loading fir files.
Right Ear Microphone
Standard Car Loudspeaker 1 (Lsp. 19) to Right Ear Microphone of Zone 3 (Mic. 24)
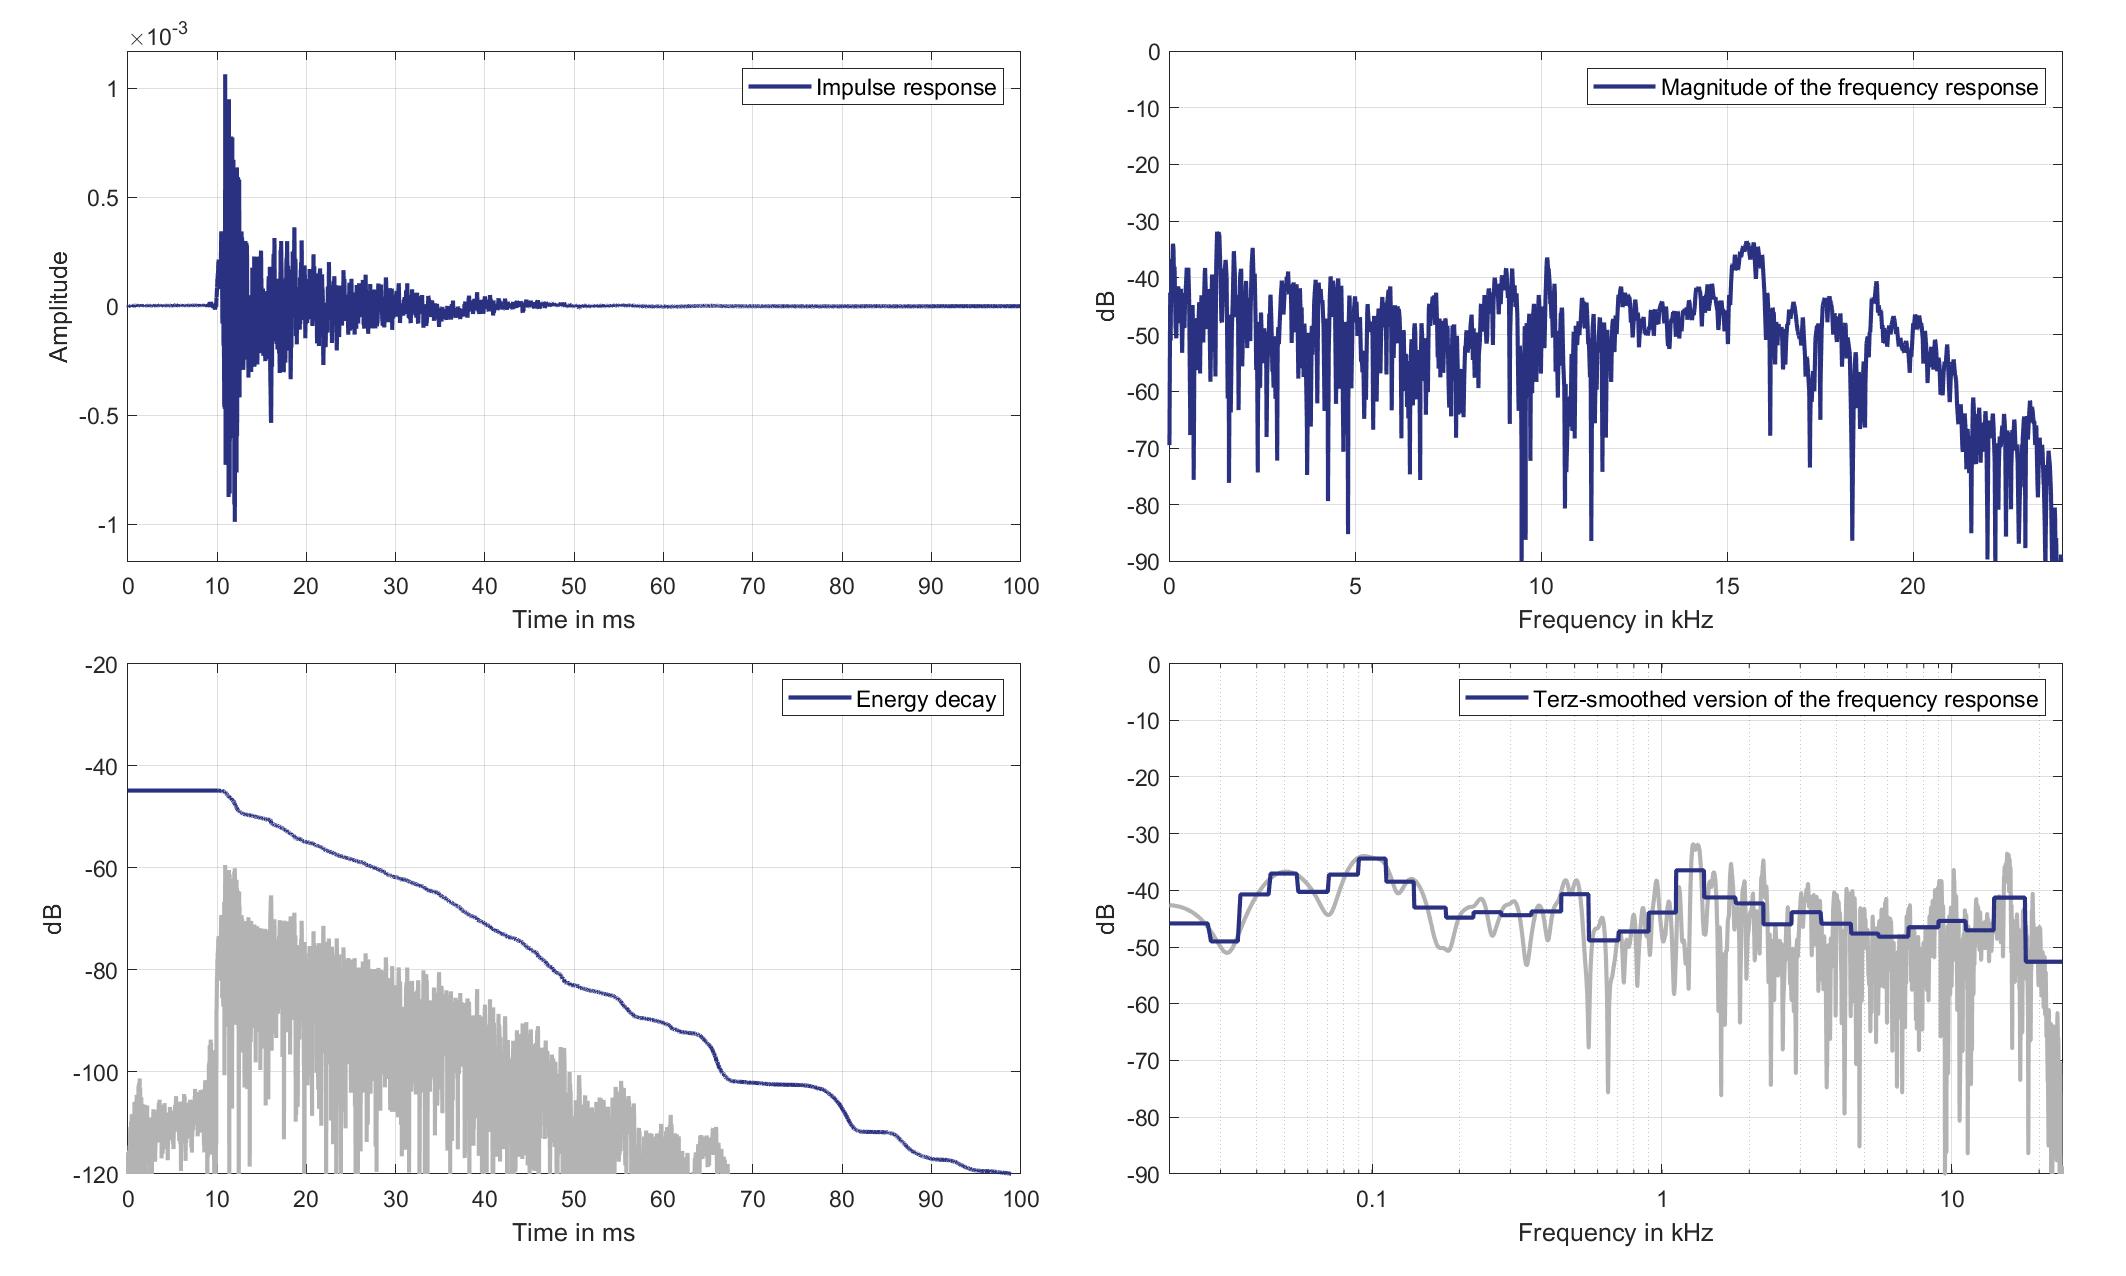
Download impulse response (in ".fir" format).
In the download section you can download all impulse response files as well as format explanation and Matlab as well as Python code examples for loading fir files.
Mics. 25/26
Left Ear Microphone
Standard Car Loudspeaker 1 (Lsp. 19) to Left Ear Microphone of Zone 5 (Mic. 25)
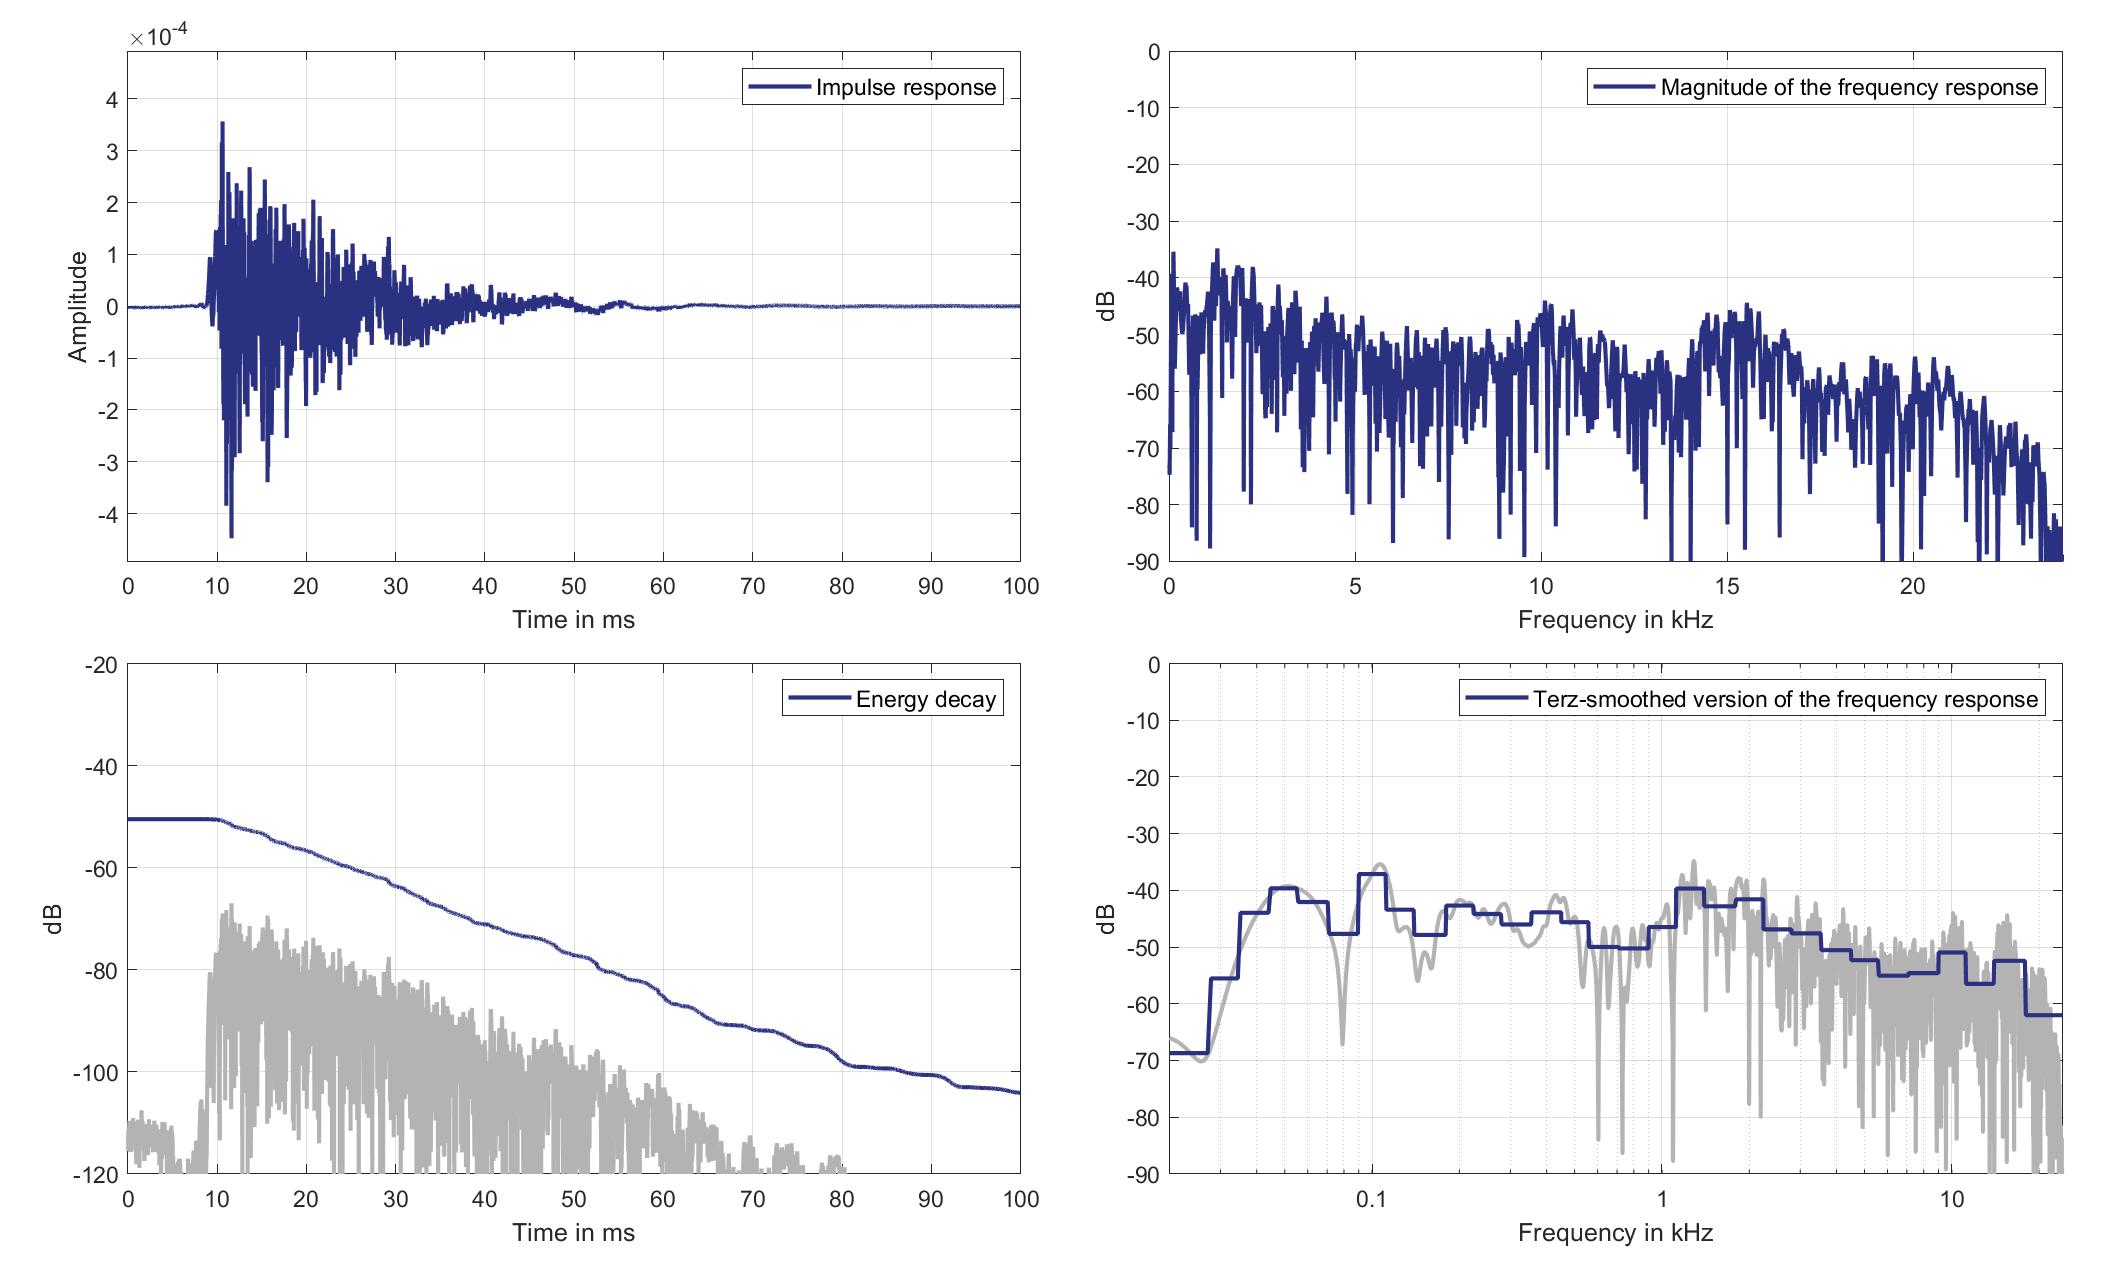
Download impulse response (in ".fir" format).
In the download section you can download all impulse response files as well as format explanation and Matlab as well as Python code examples for loading fir files.
Right Ear Microphone
Standard Car Loudspeaker 1 (Lsp. 19) to Right Ear Microphone of Zone 5 (Mic. 26)
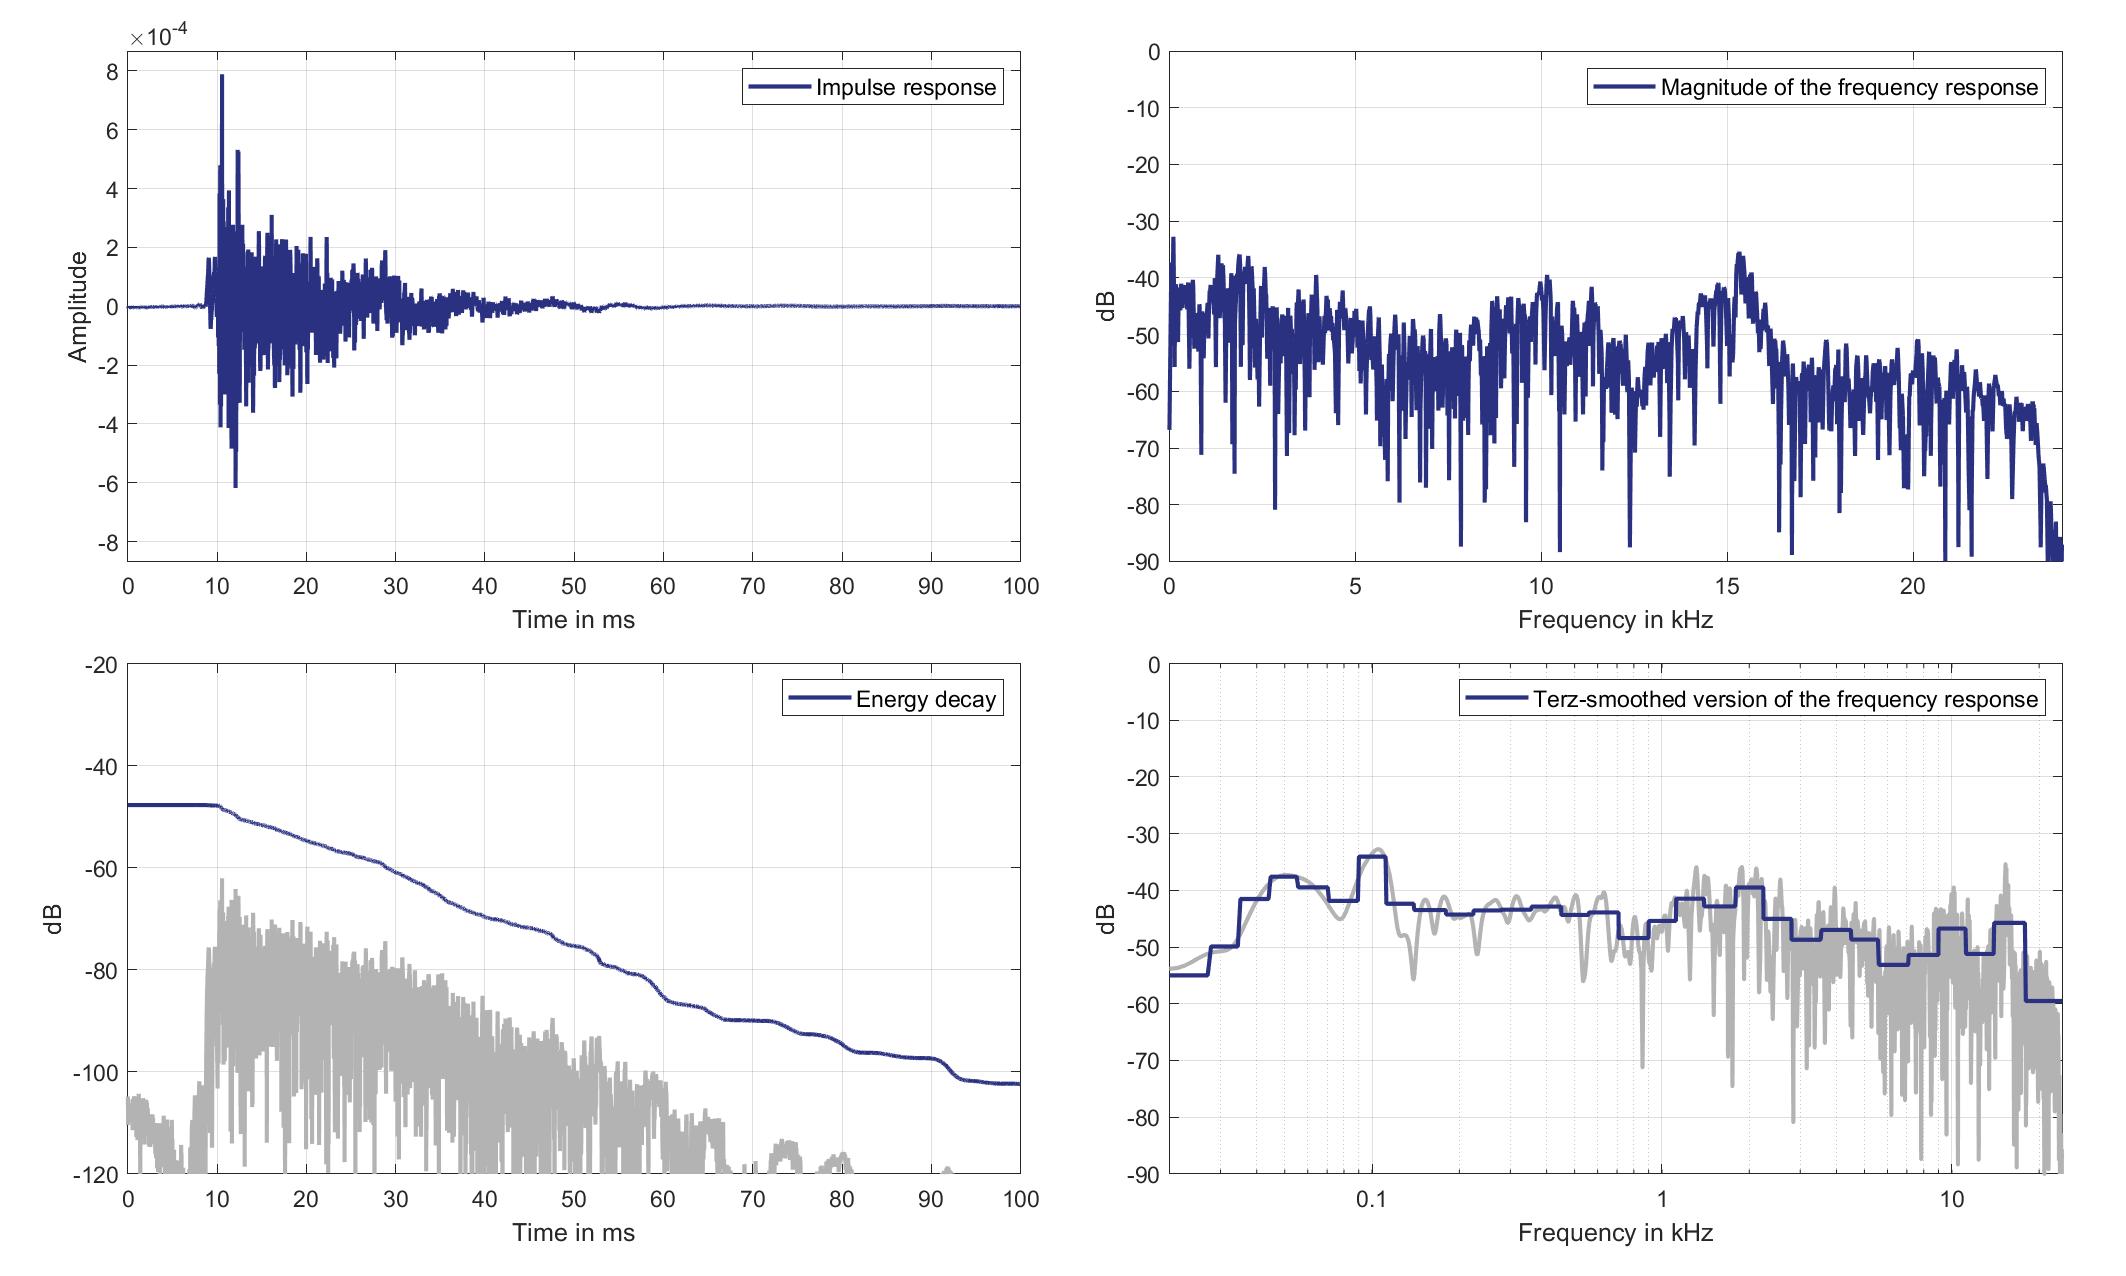
Download impulse response (in ".fir" format).
In the download section you can download all impulse response files as well as format explanation and Matlab as well as Python code examples for loading fir files.
Mics. 27/28
Left Ear Microphone
Standard Car Loudspeaker 1 (Lsp. 19) to Left Ear Microphone of Zone 6 (Mic. 27)
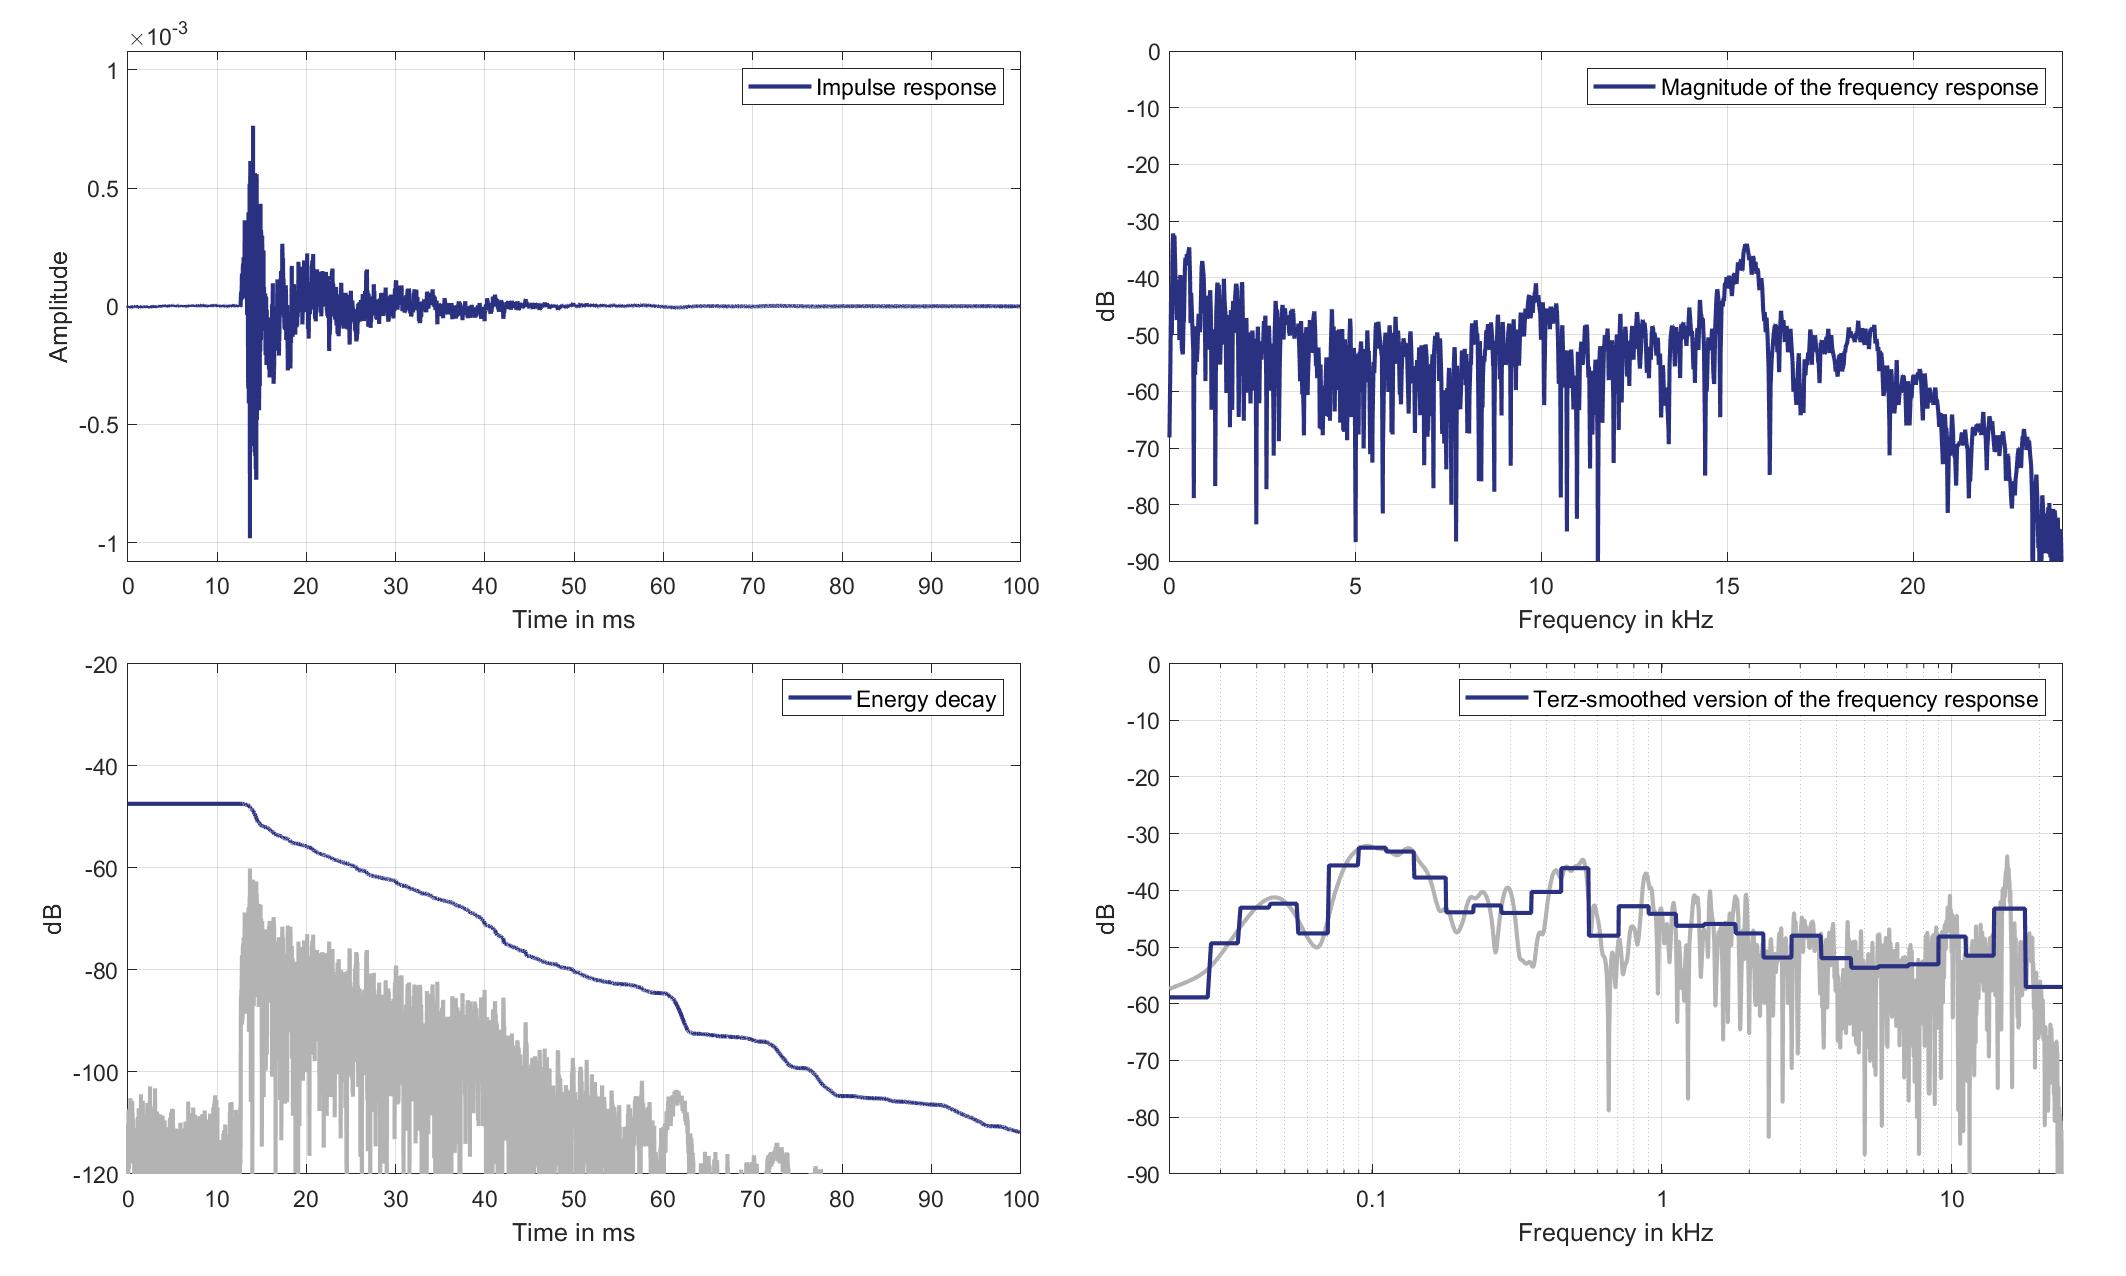
Download impulse response (in ".fir" format).
In the download section you can download all impulse response files as well as format explanation and Matlab as well as Python code examples for loading fir files.
Right Ear Microphone
Standard Car Loudspeaker 1 (Lsp. 19) to Right Ear Microphone of Zone 6 (Mic. 28)
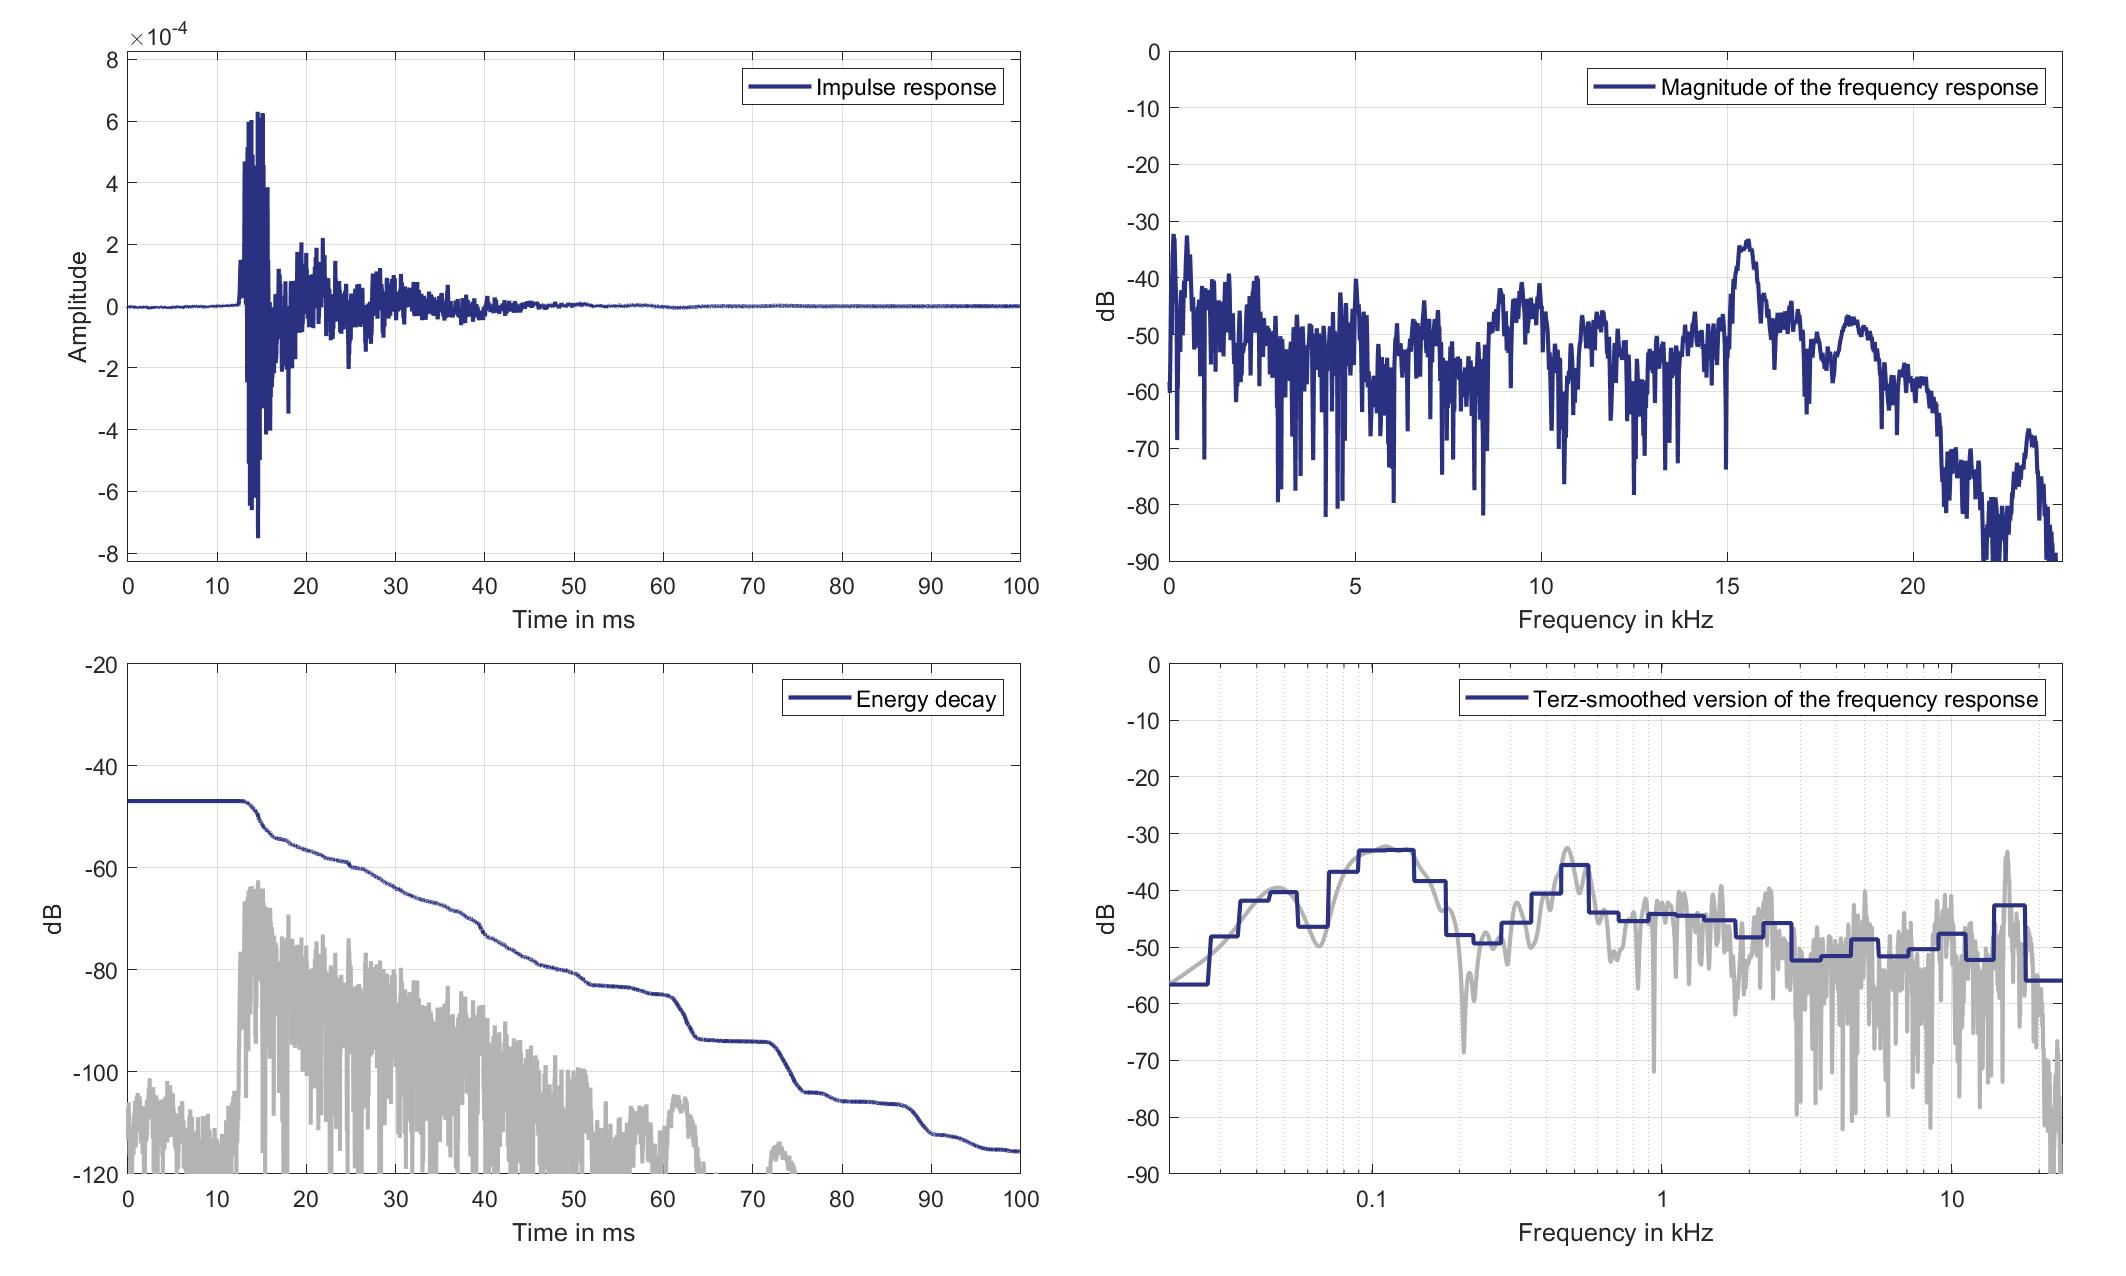
Download impulse response (in ".fir" format).
In the download section you can download all impulse response files as well as format explanation and Matlab as well as Python code examples for loading fir files.
Mics. 29/30
Left Ear Microphone
Standard Car Loudspeaker 1 (Lsp. 19) to Left Ear Microphone of Zone 8 (Mic. 29)
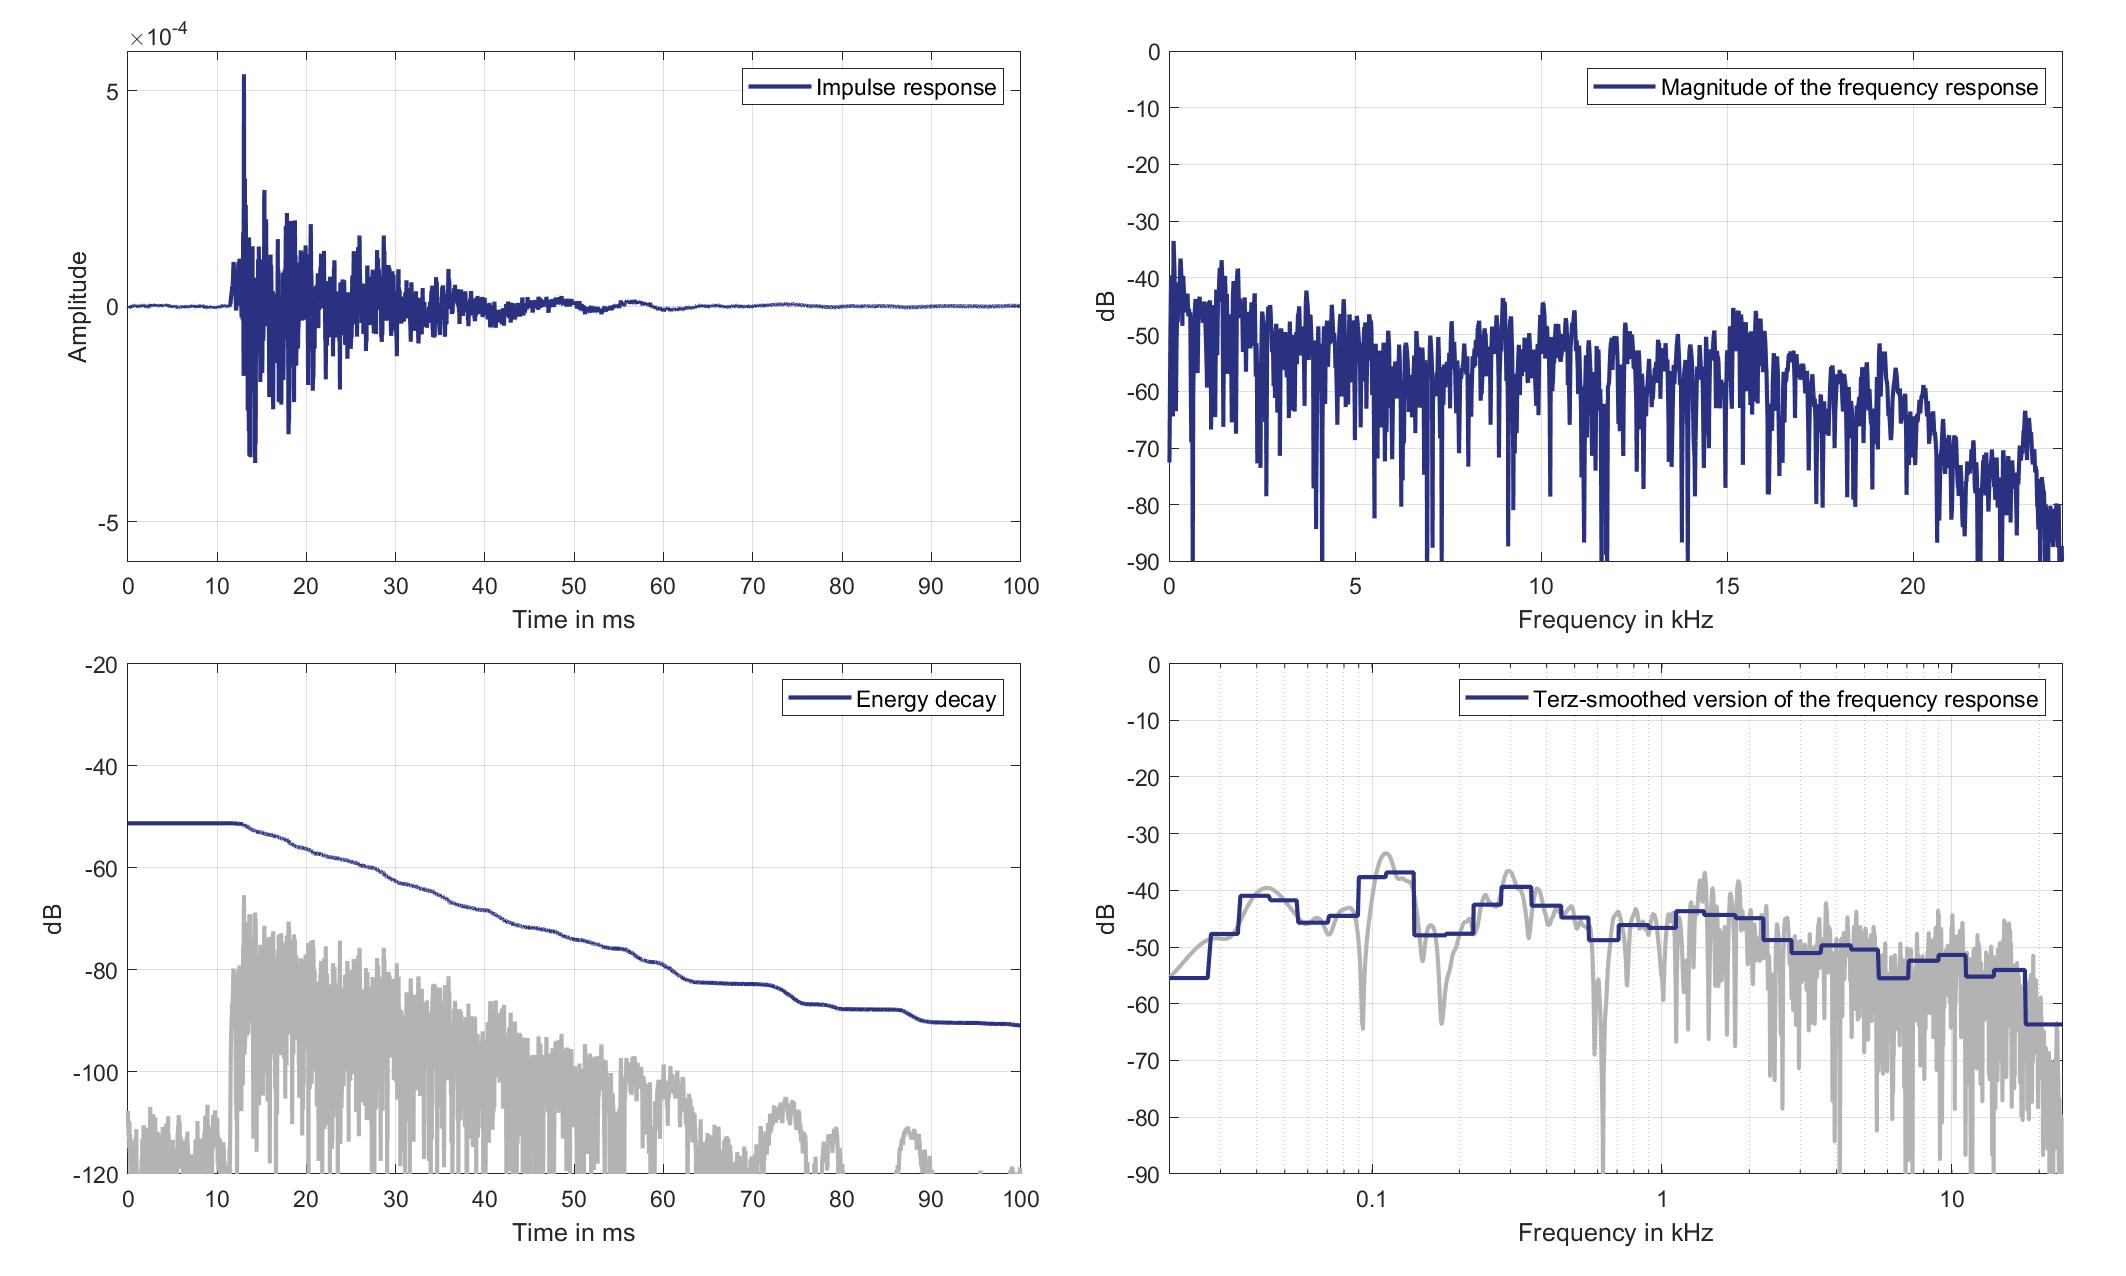
Download impulse response (in ".fir" format).
In the download section you can download all impulse response files as well as format explanation and Matlab as well as Python code examples for loading fir files.
Right Ear Microphone
Standard Car Loudspeaker 1 (Lsp. 19) to Right Ear Microphone of Zone 8 (Mic. 30)
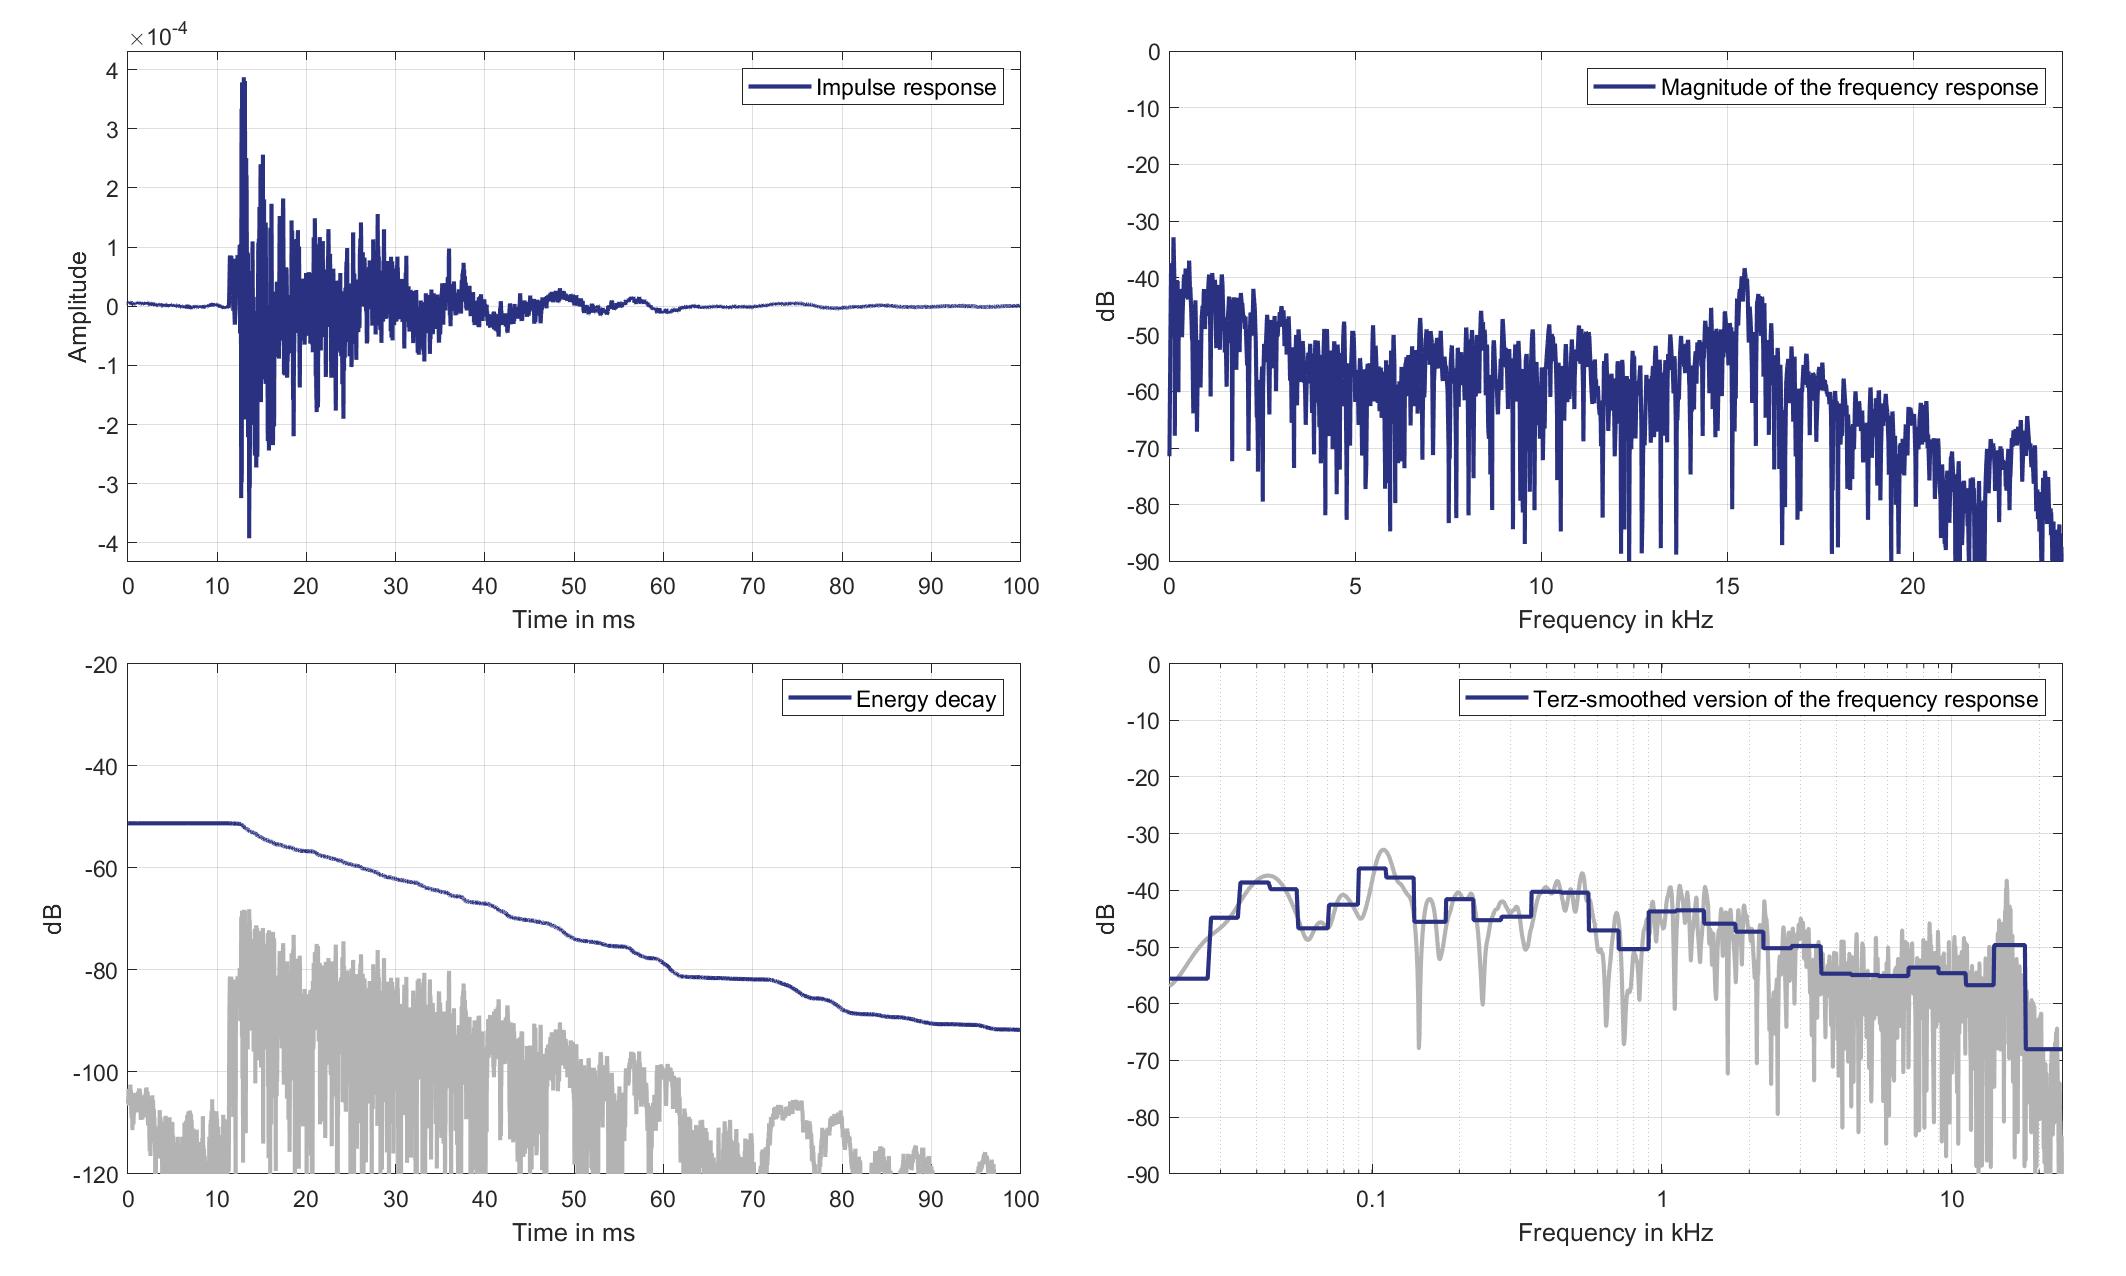
Download impulse response (in ".fir" format).
In the download section you can download all impulse response files as well as format explanation and Matlab as well as Python code examples for loading fir files.
Lsp. 20
Mics. 19/20
Left Ear Microphone
Standard Car Loudspeaker 2 (Lsp. 20) to Left Ear Microphone of Zone 1 (Mic. 19)
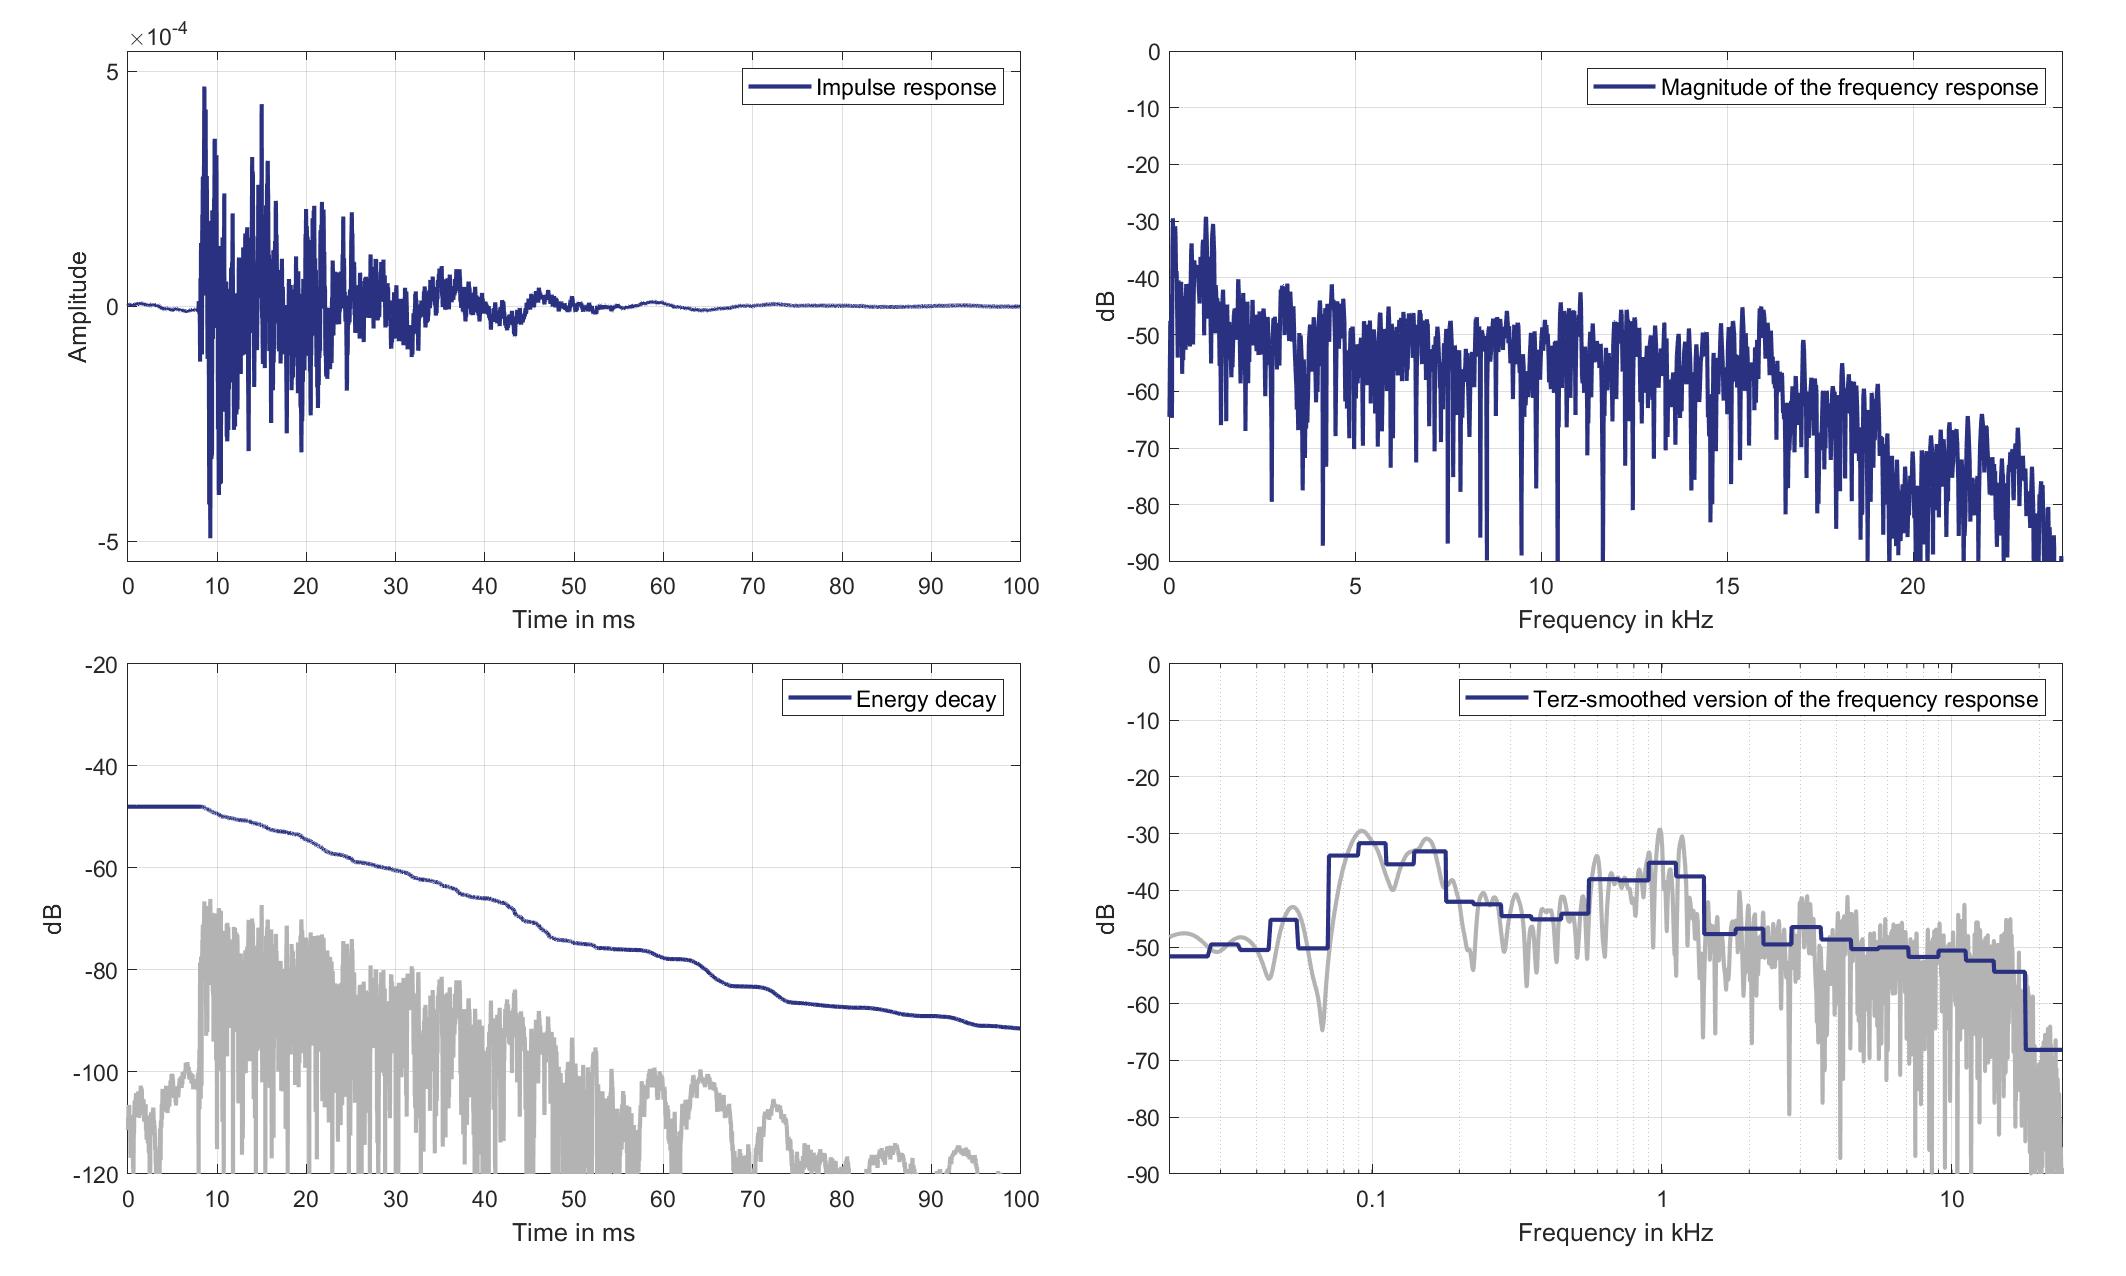
Download impulse response (in ".fir" format).
In the download section you can download all impulse response files as well as format explanation and Matlab as well as Python code examples for loading fir files.
Right Ear Microphone
Standard Car Loudspeaker 2 (Lsp. 20) to Right Ear Microphone of Zone 1 (Mic. 20)
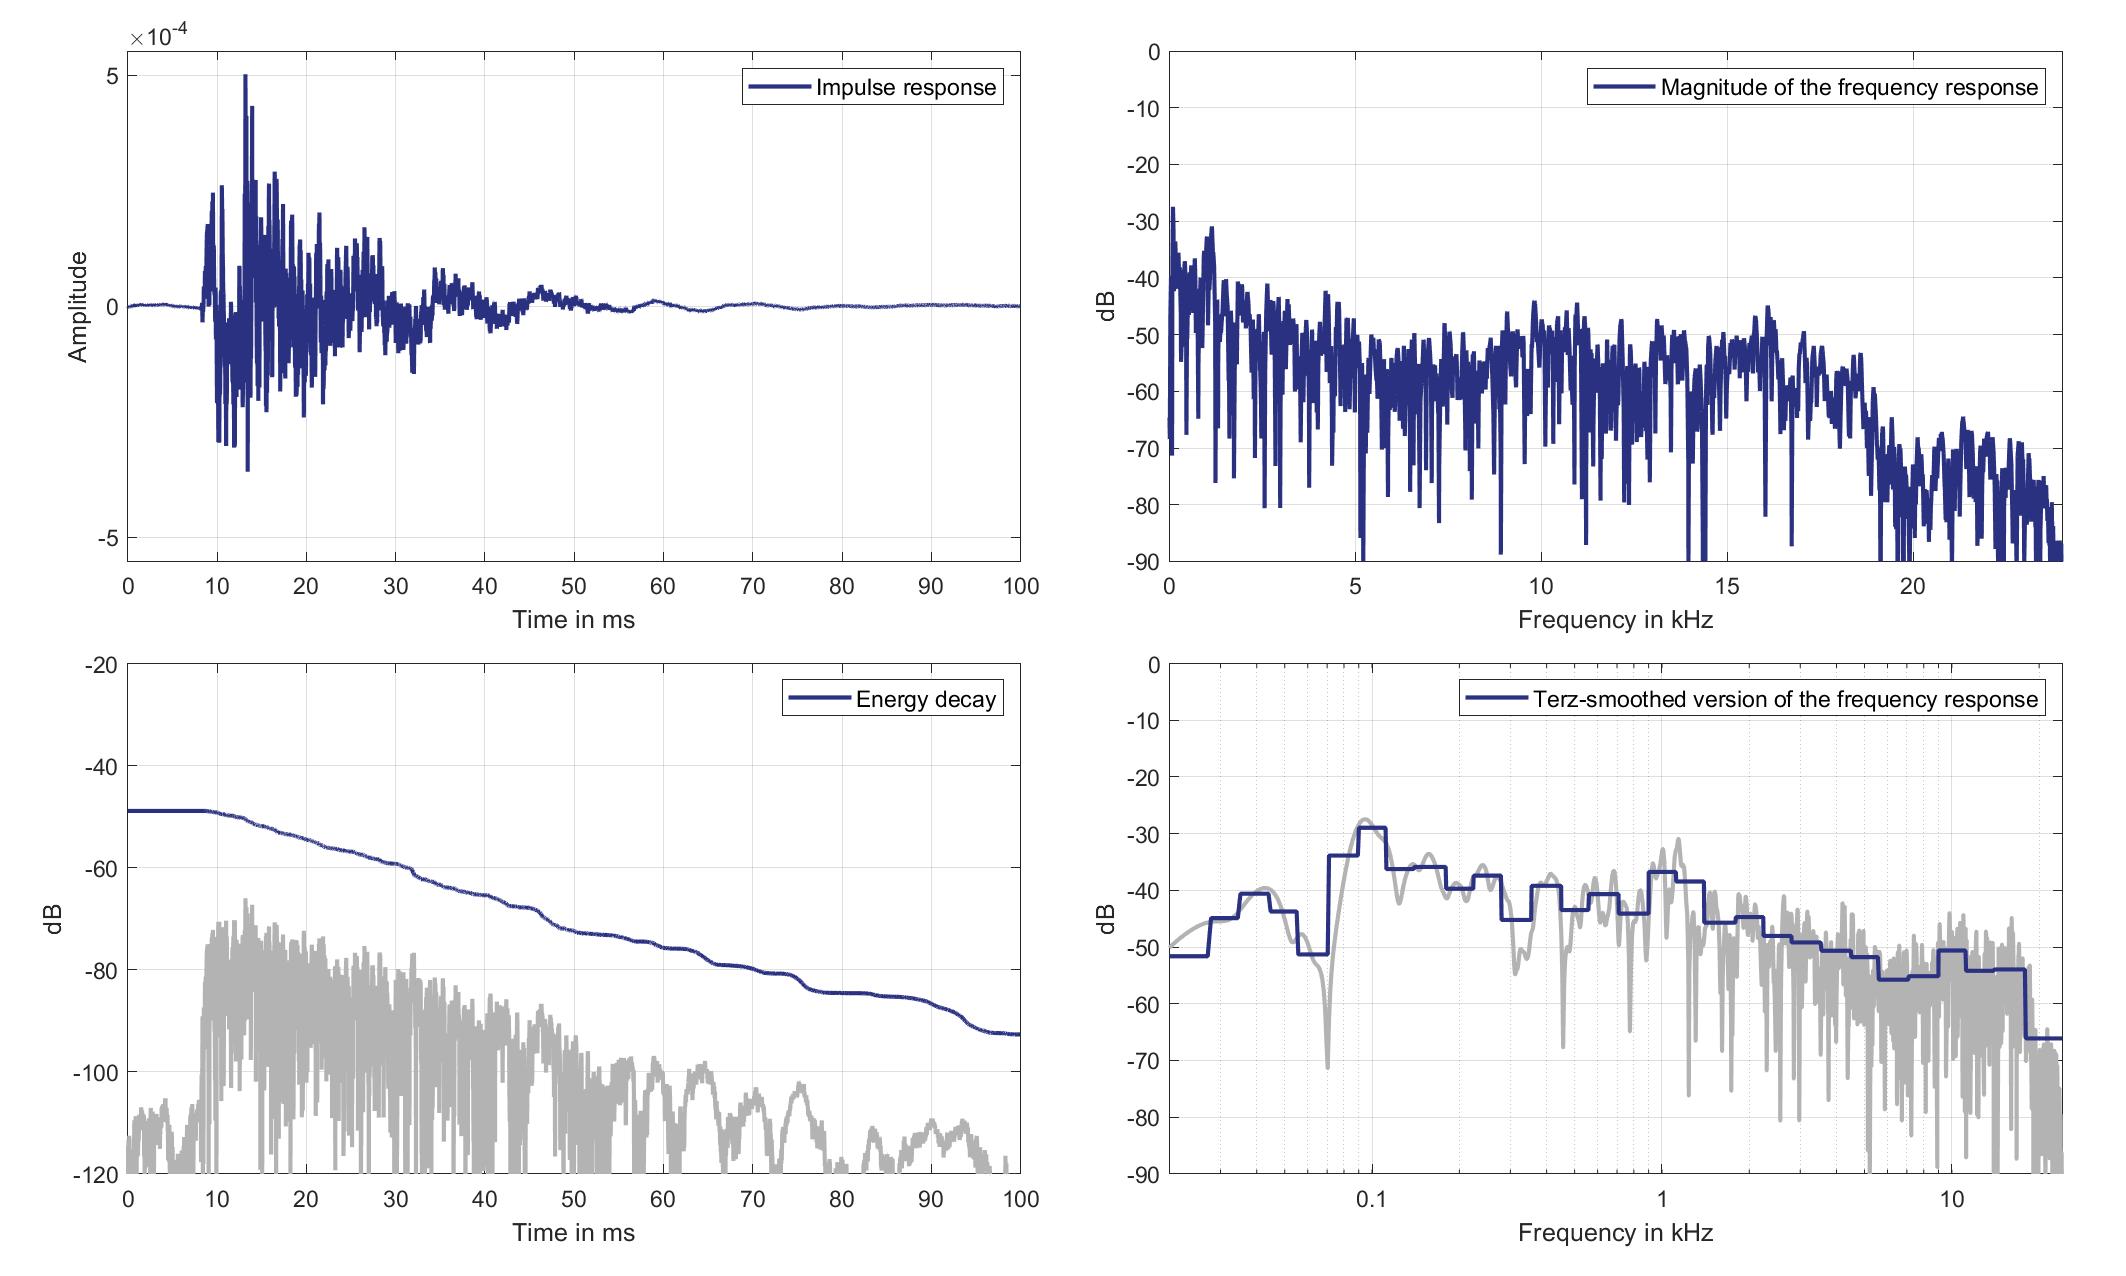
Download impulse response (in ".fir" format).
In the download section you can download all impulse response files as well as format explanation and Matlab as well as Python code examples for loading fir files.
Mics. 21/22
Left Ear Microphone
Standard Car Loudspeaker 2 (Lsp. 20) to Left Ear Microphone of Zone 2 (Mic. 21)
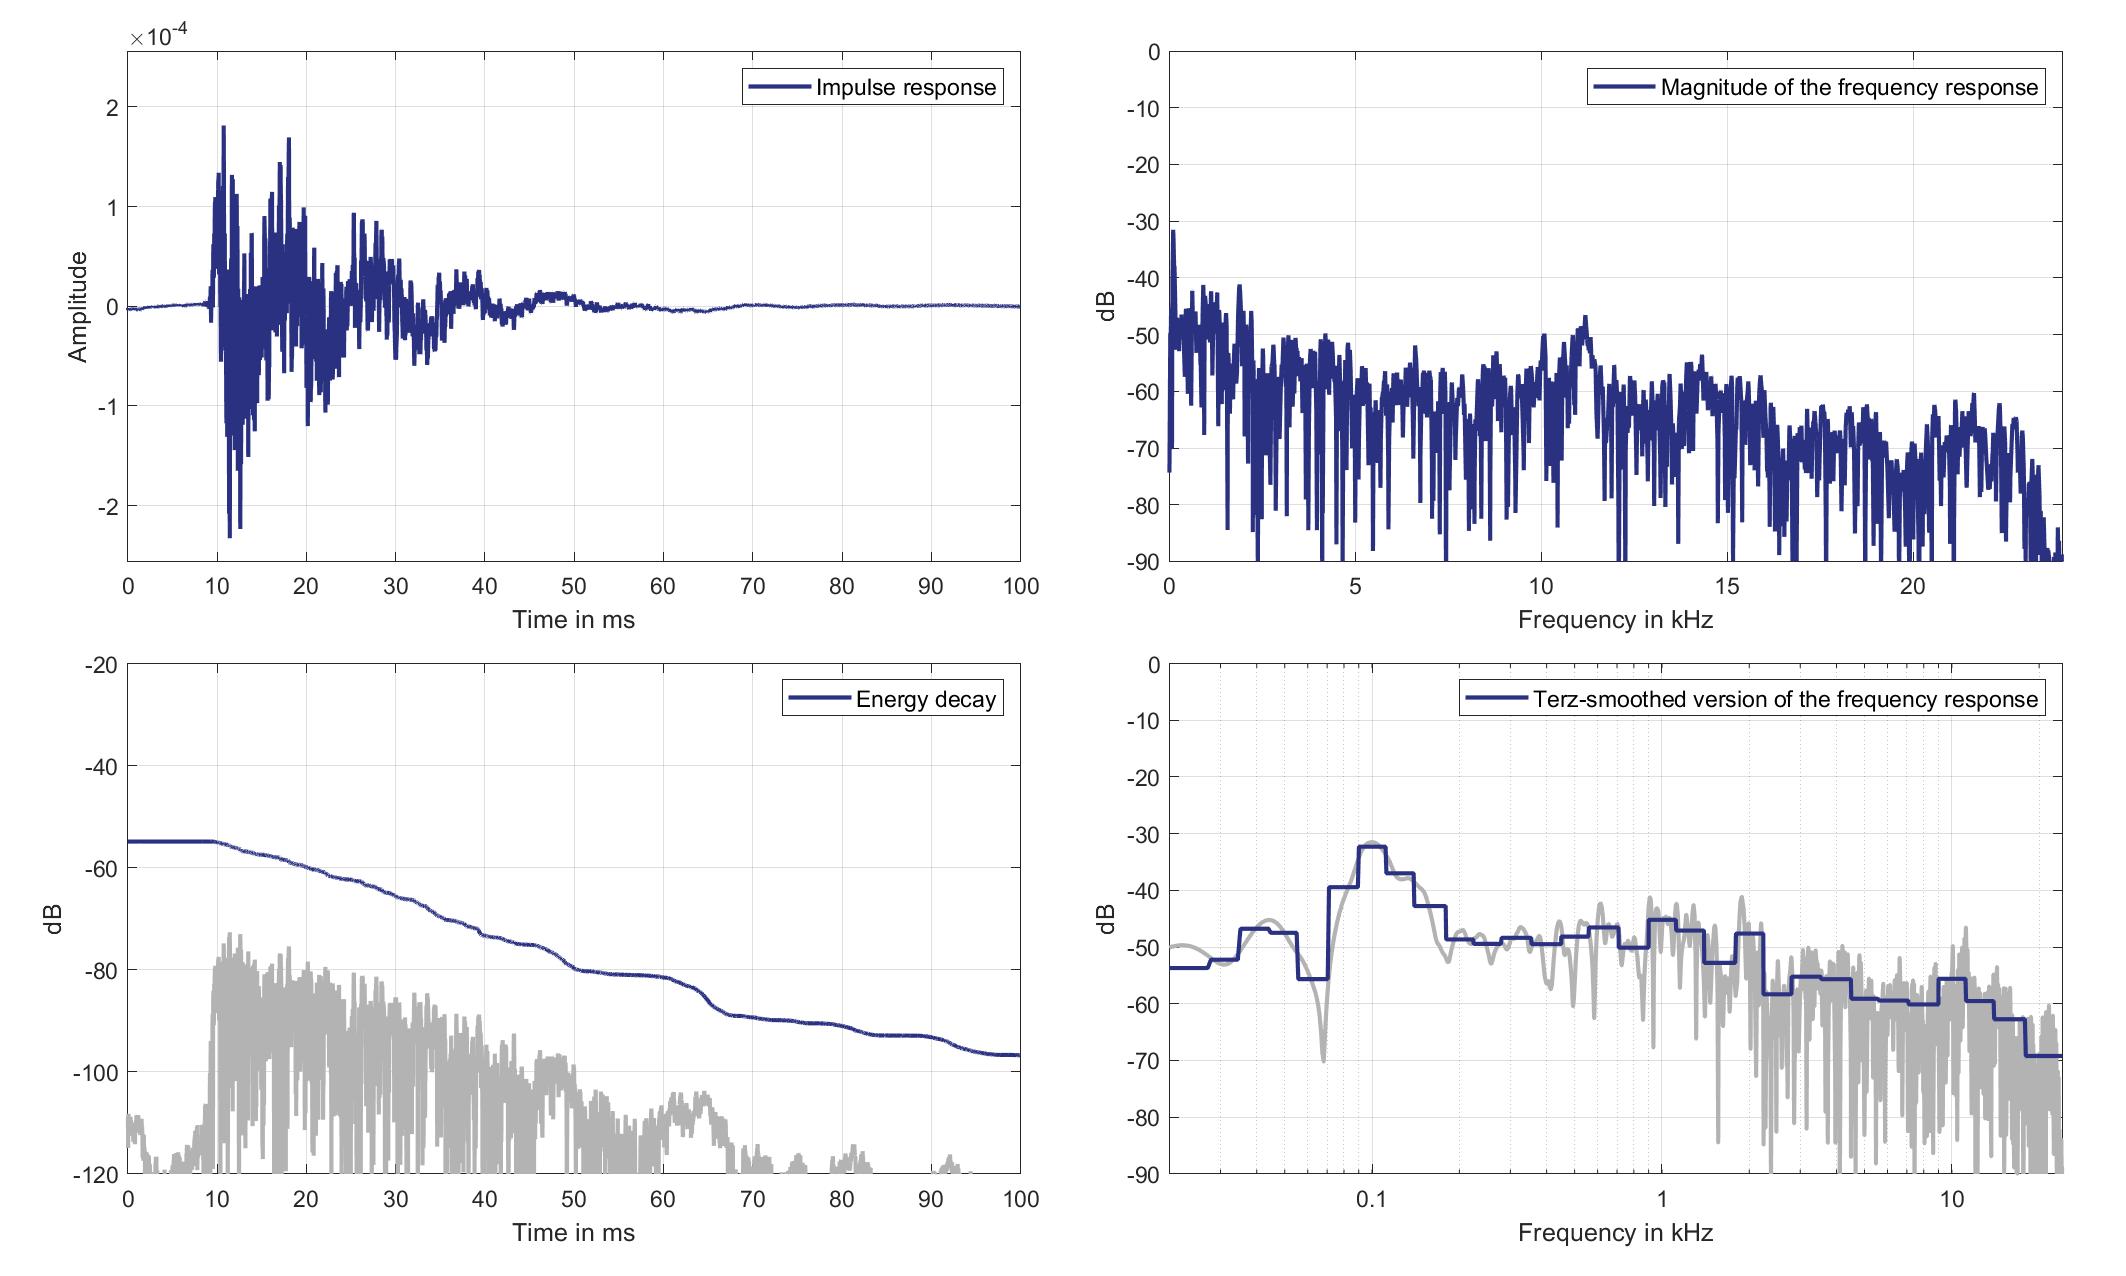
Download impulse response (in ".fir" format).
In the download section you can download all impulse response files as well as format explanation and Matlab as well as Python code examples for loading fir files.
Right Ear Microphone
Standard Car Loudspeaker 2 (Lsp. 20) to Right Ear Microphone of Zone 2 (Mic. 22)
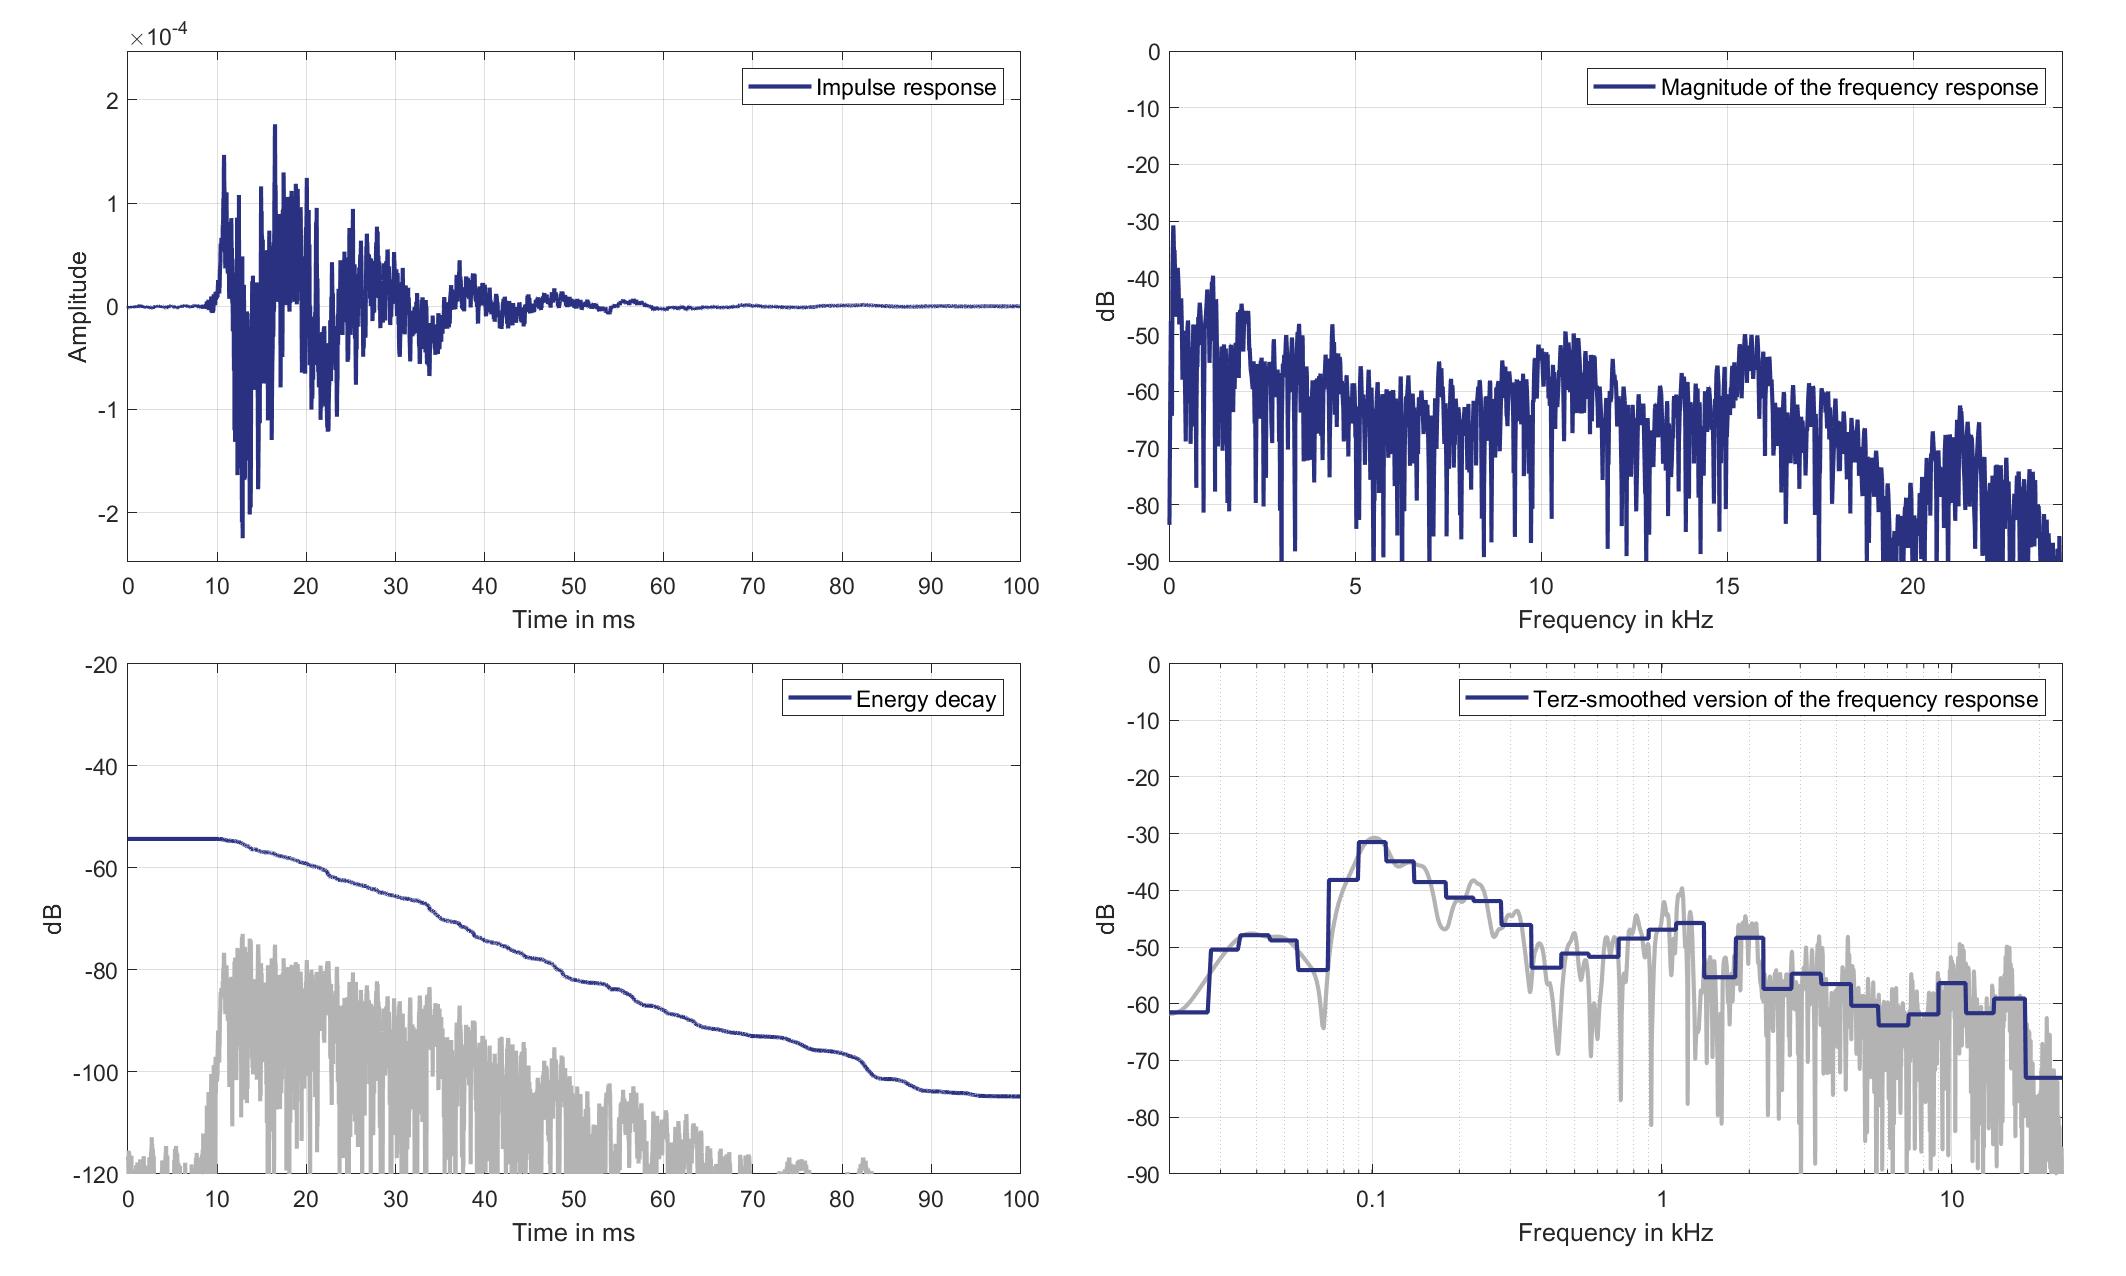
Download impulse response (in ".fir" format).
In the download section you can download all impulse response files as well as format explanation and Matlab as well as Python code examples for loading fir files.
Mics. 23/24
Left Ear Microphone
Standard Car Loudspeaker 2 (Lsp. 20) to Left Ear Microphone of Zone 3 (Mic. 23)
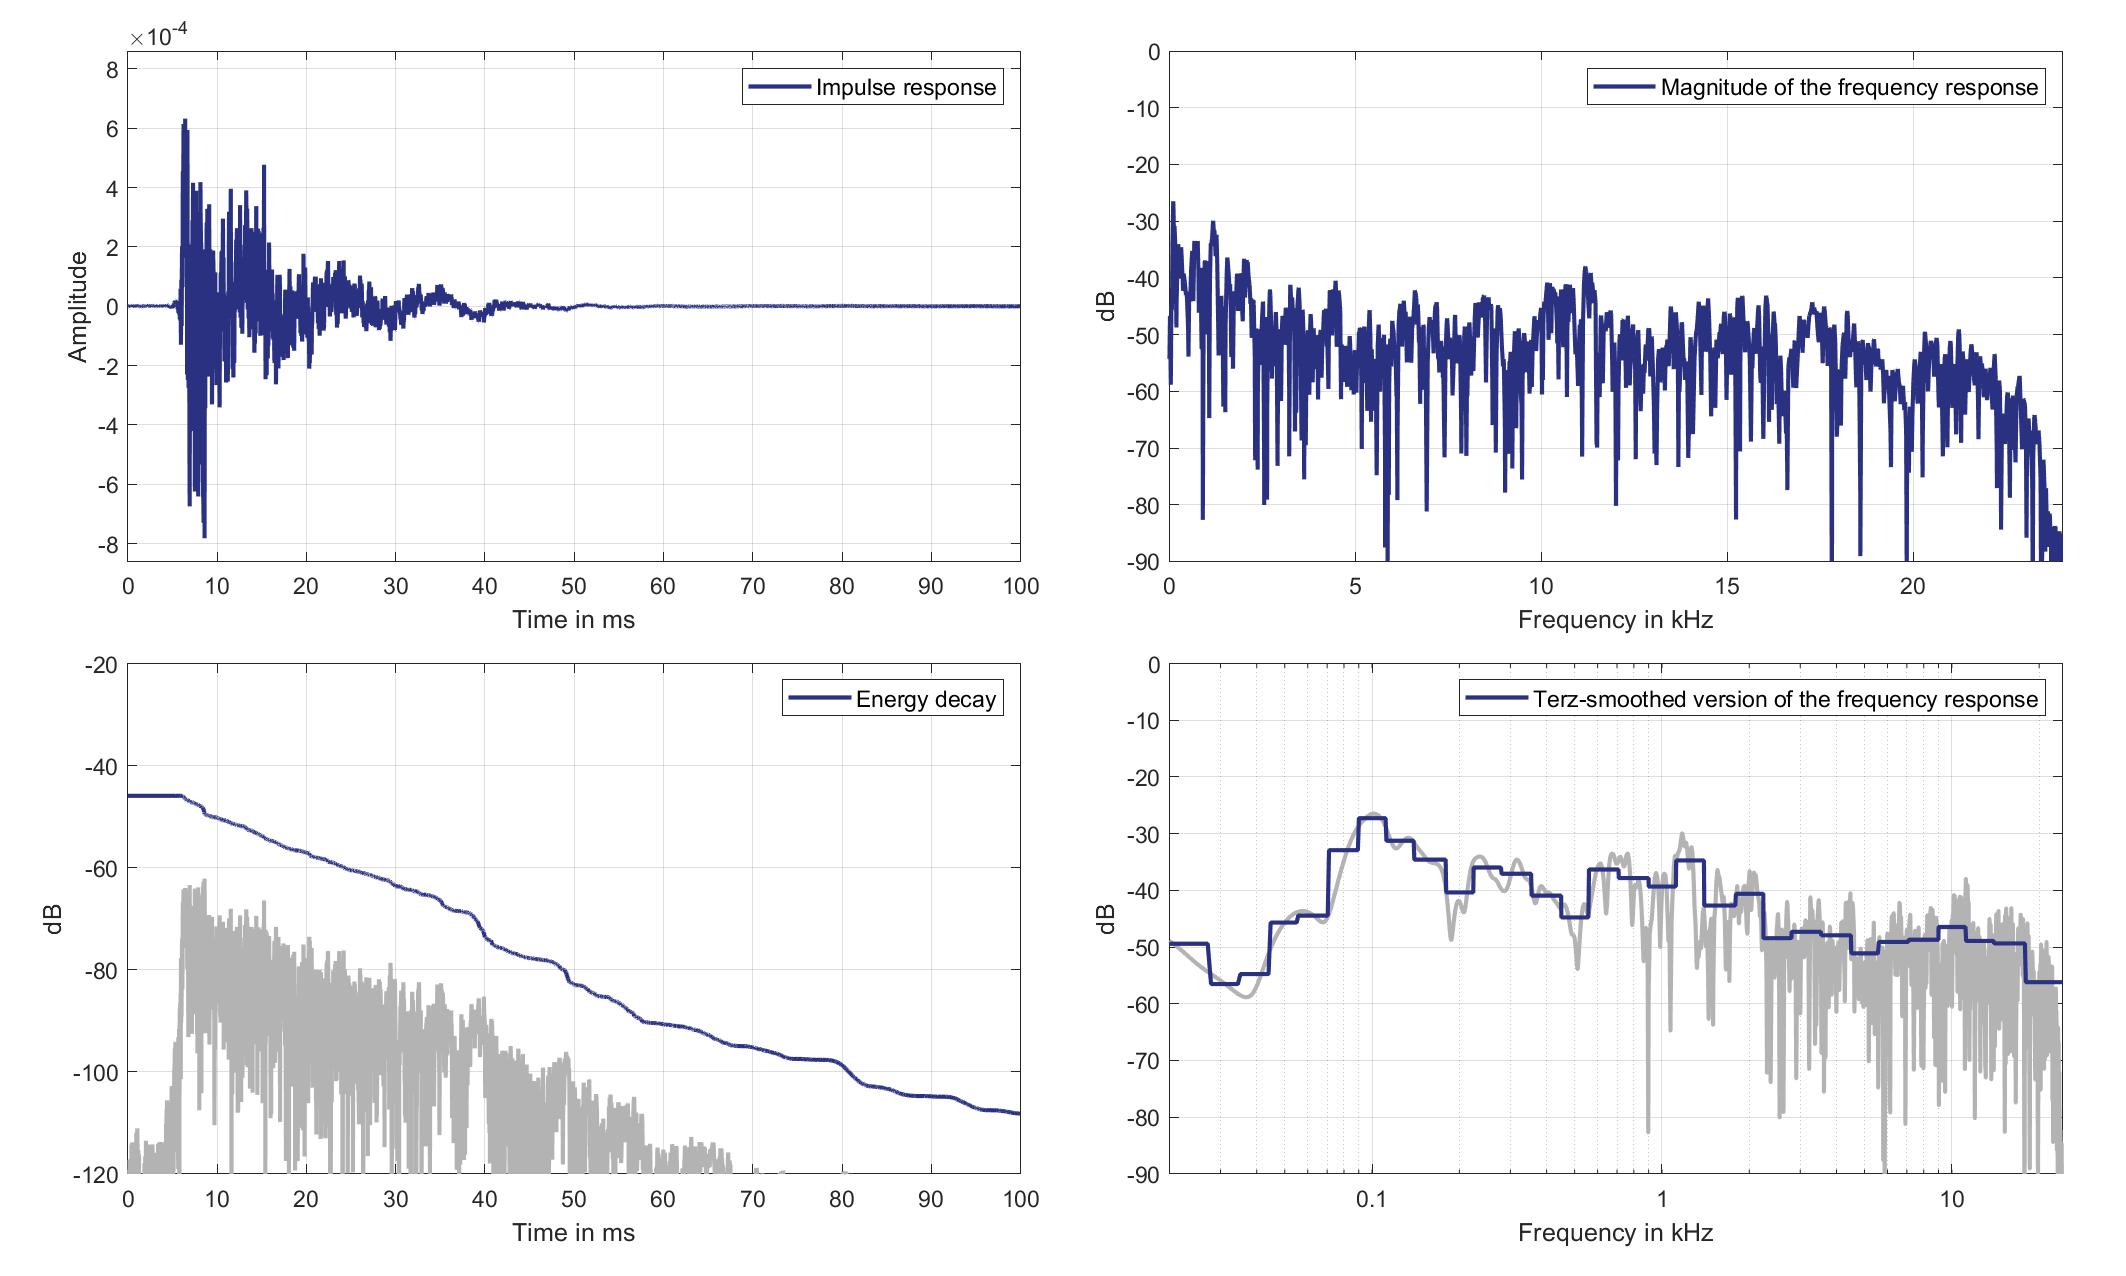
Download impulse response (in ".fir" format).
In the download section you can download all impulse response files as well as format explanation and Matlab as well as Python code examples for loading fir files.
Right Ear Microphone
Standard Car Loudspeaker 2 (Lsp. 20) to Right Ear Microphone of Zone 3 (Mic. 24)
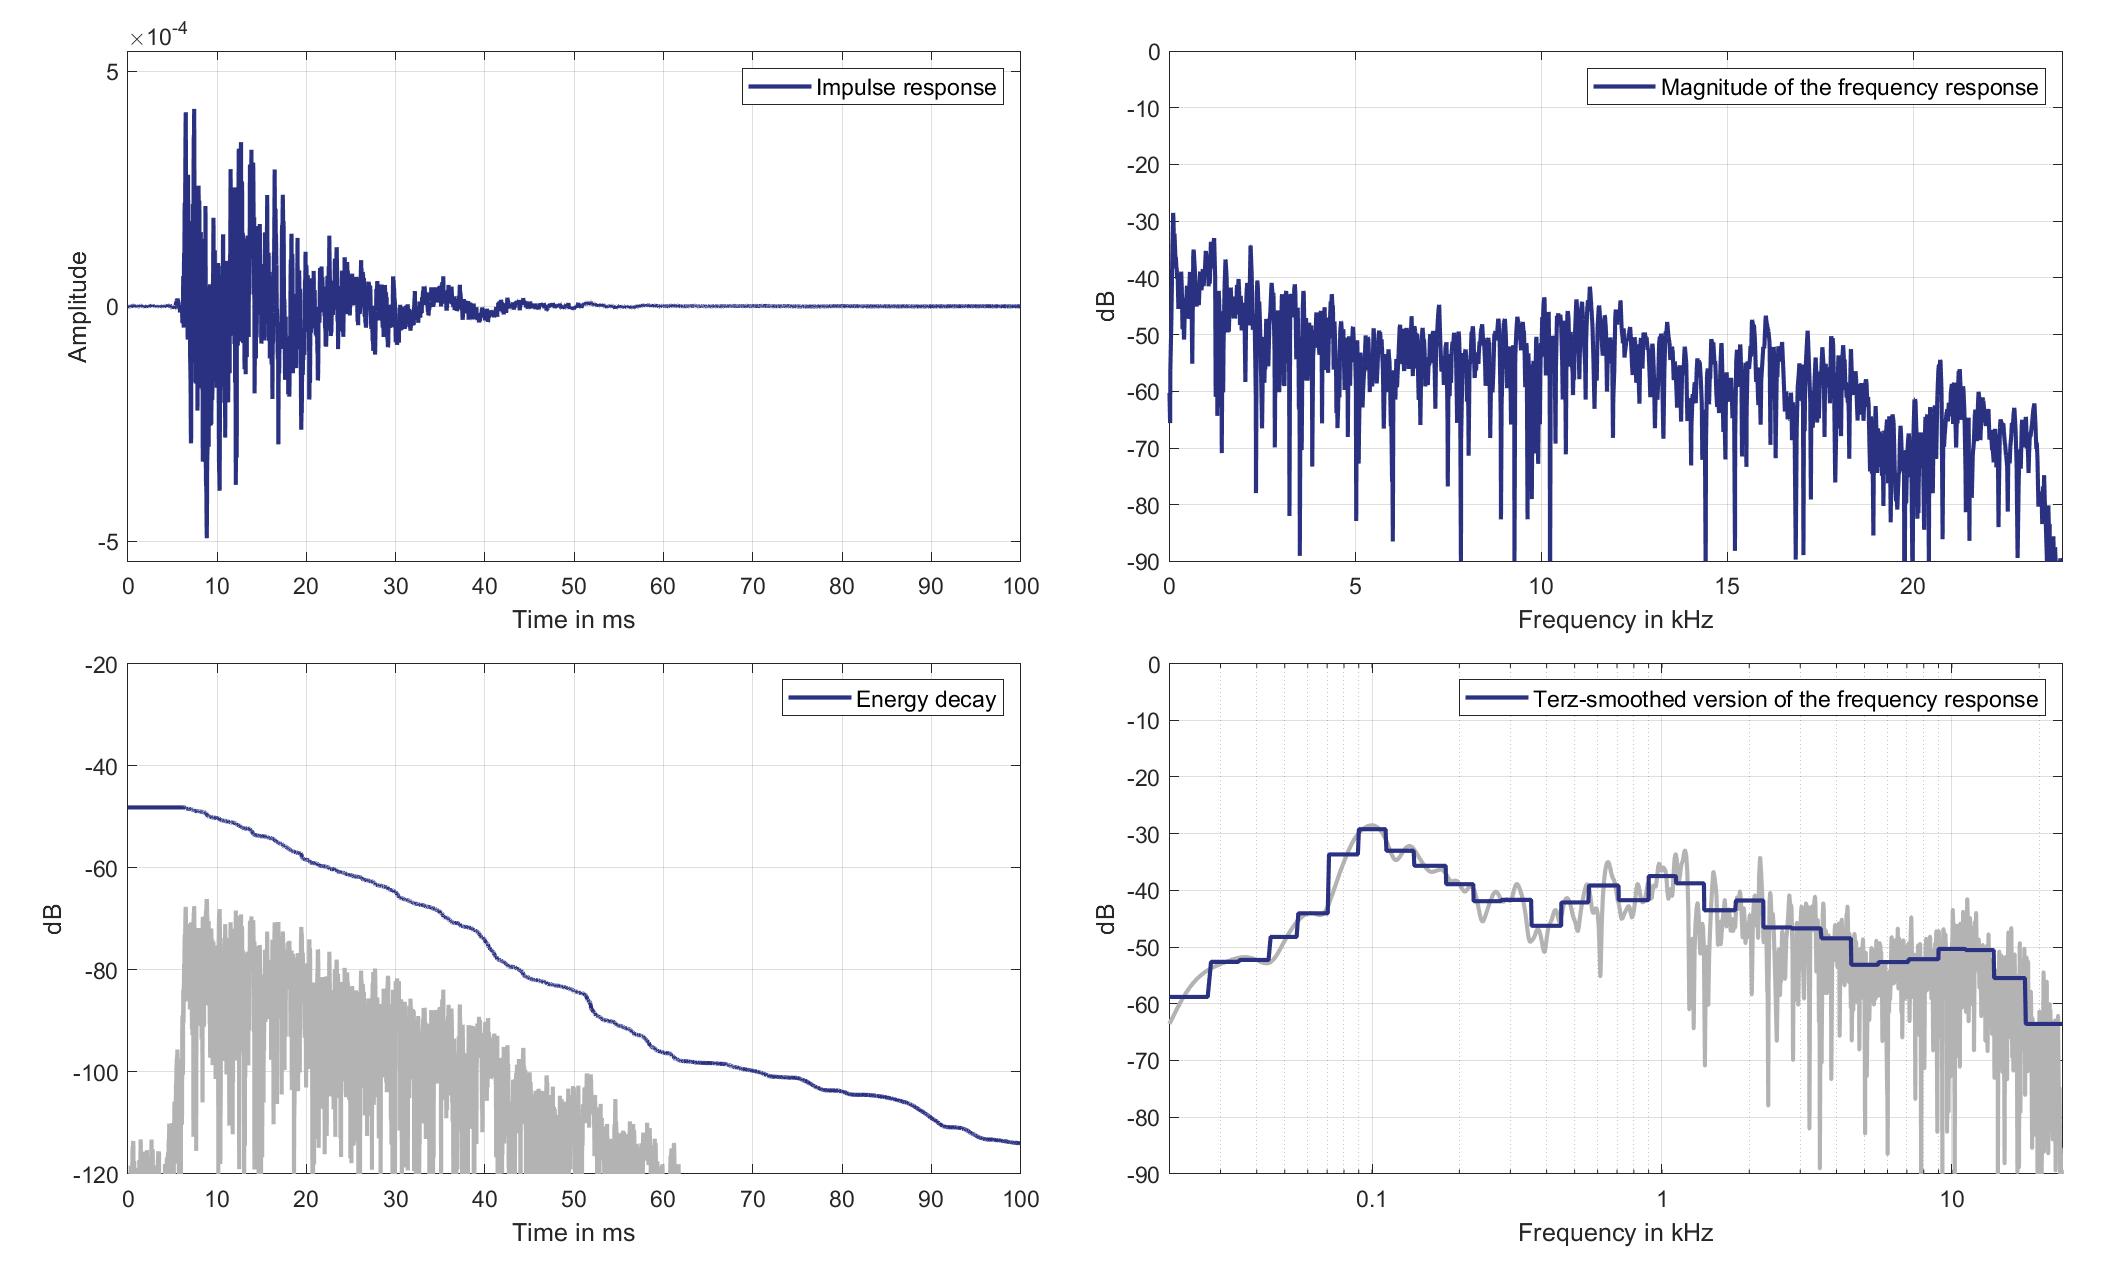
Download impulse response (in ".fir" format).
In the download section you can download all impulse response files as well as format explanation and Matlab as well as Python code examples for loading fir files.
Mics. 25/26
Left Ear Microphone
Standard Car Loudspeaker 2 (Lsp. 20) to Left Ear Microphone of Zone 5 (Mic. 25)
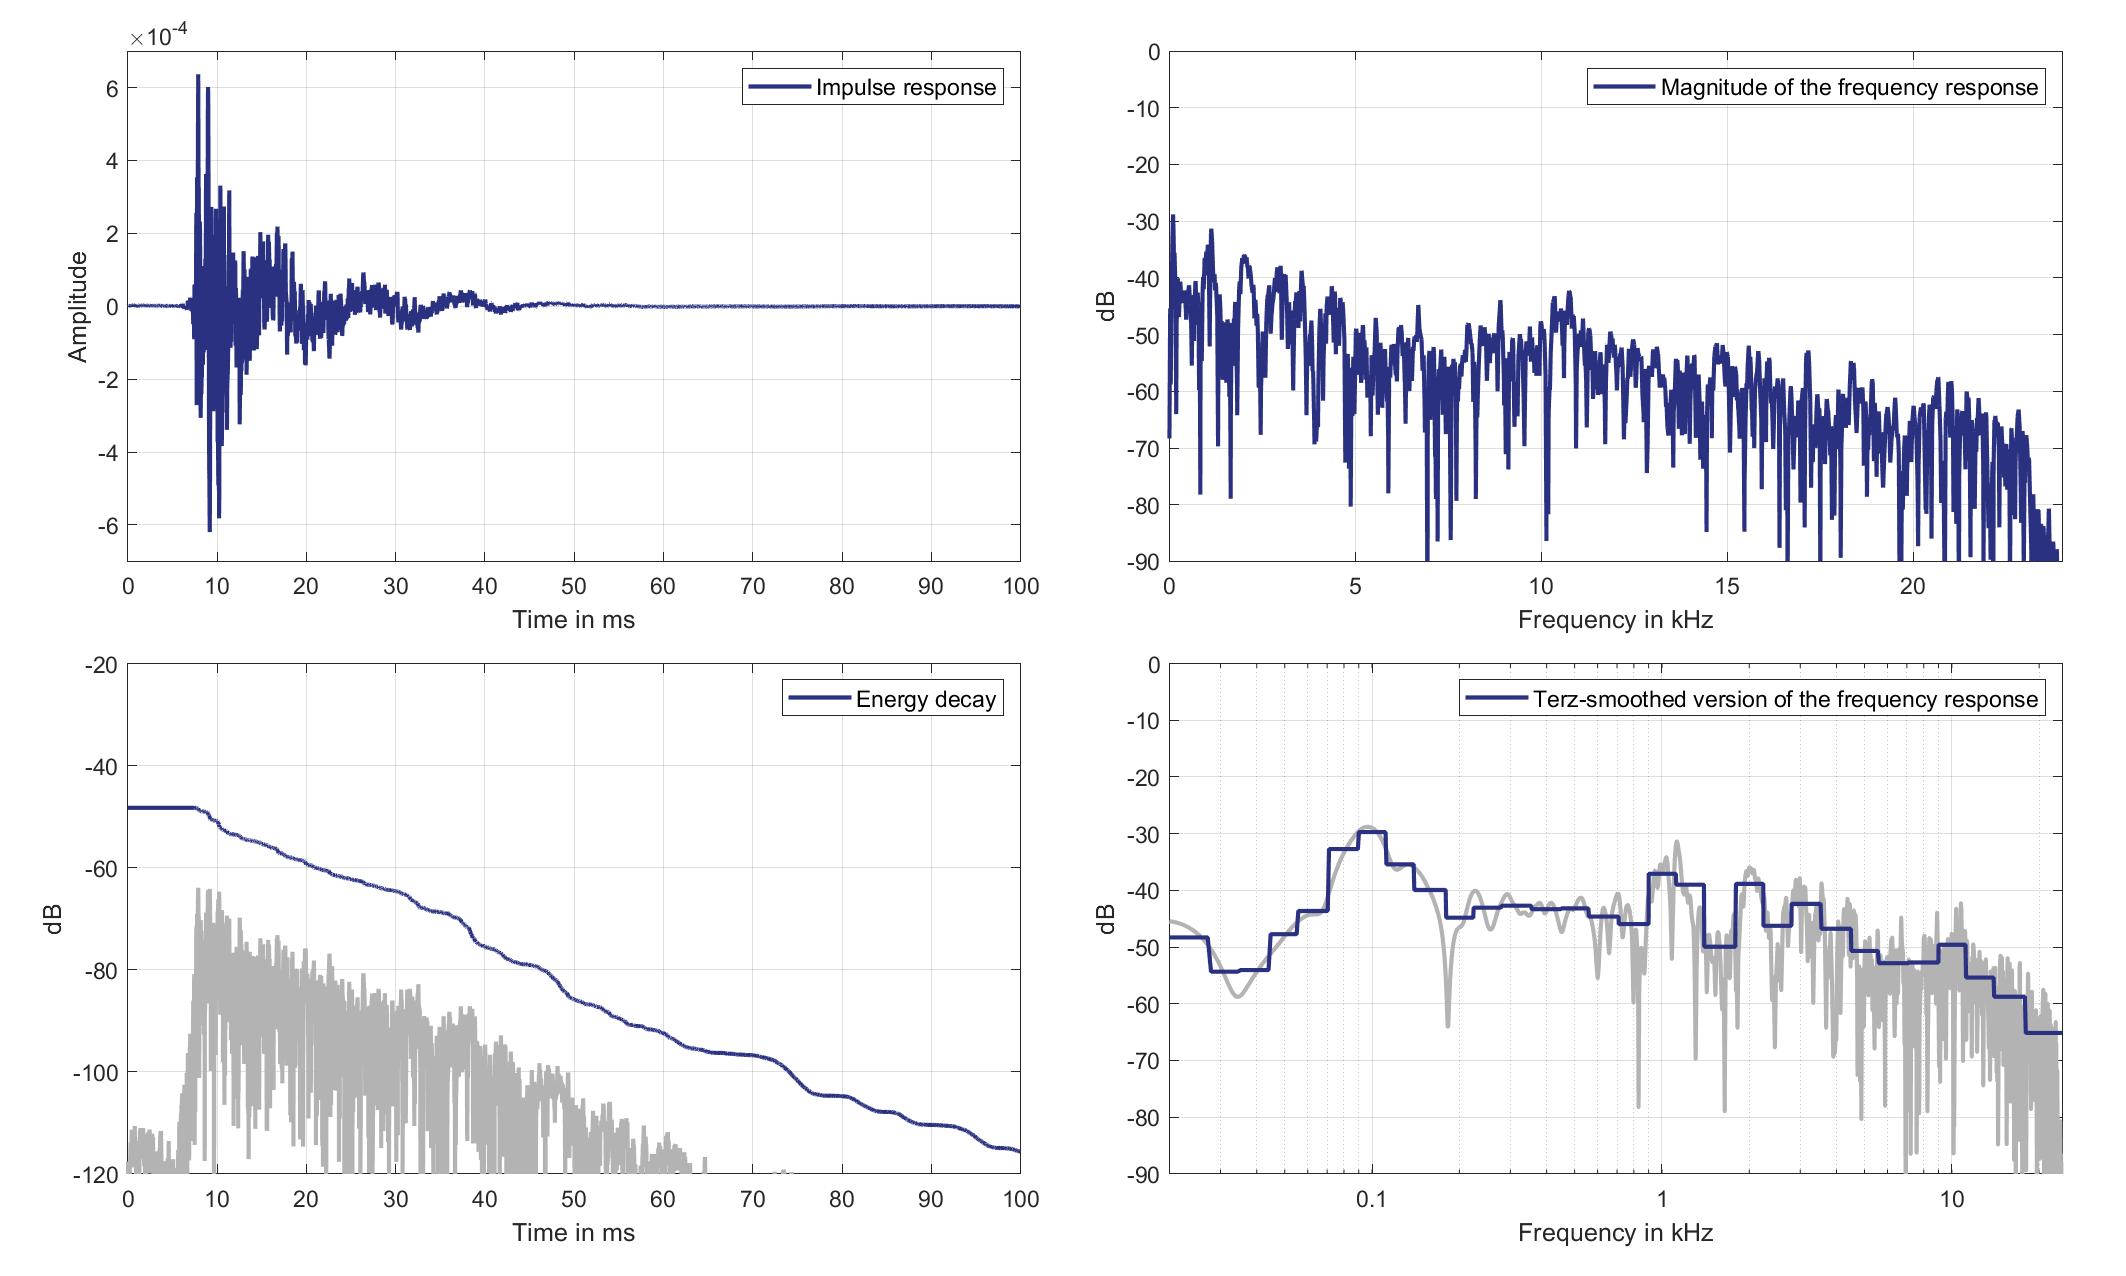
Download impulse response (in ".fir" format).
In the download section you can download all impulse response files as well as format explanation and Matlab as well as Python code examples for loading fir files.
Right Ear Microphone
Standard Car Loudspeaker 2 (Lsp. 20) to Right Ear Microphone of Zone 5 (Mic. 26)
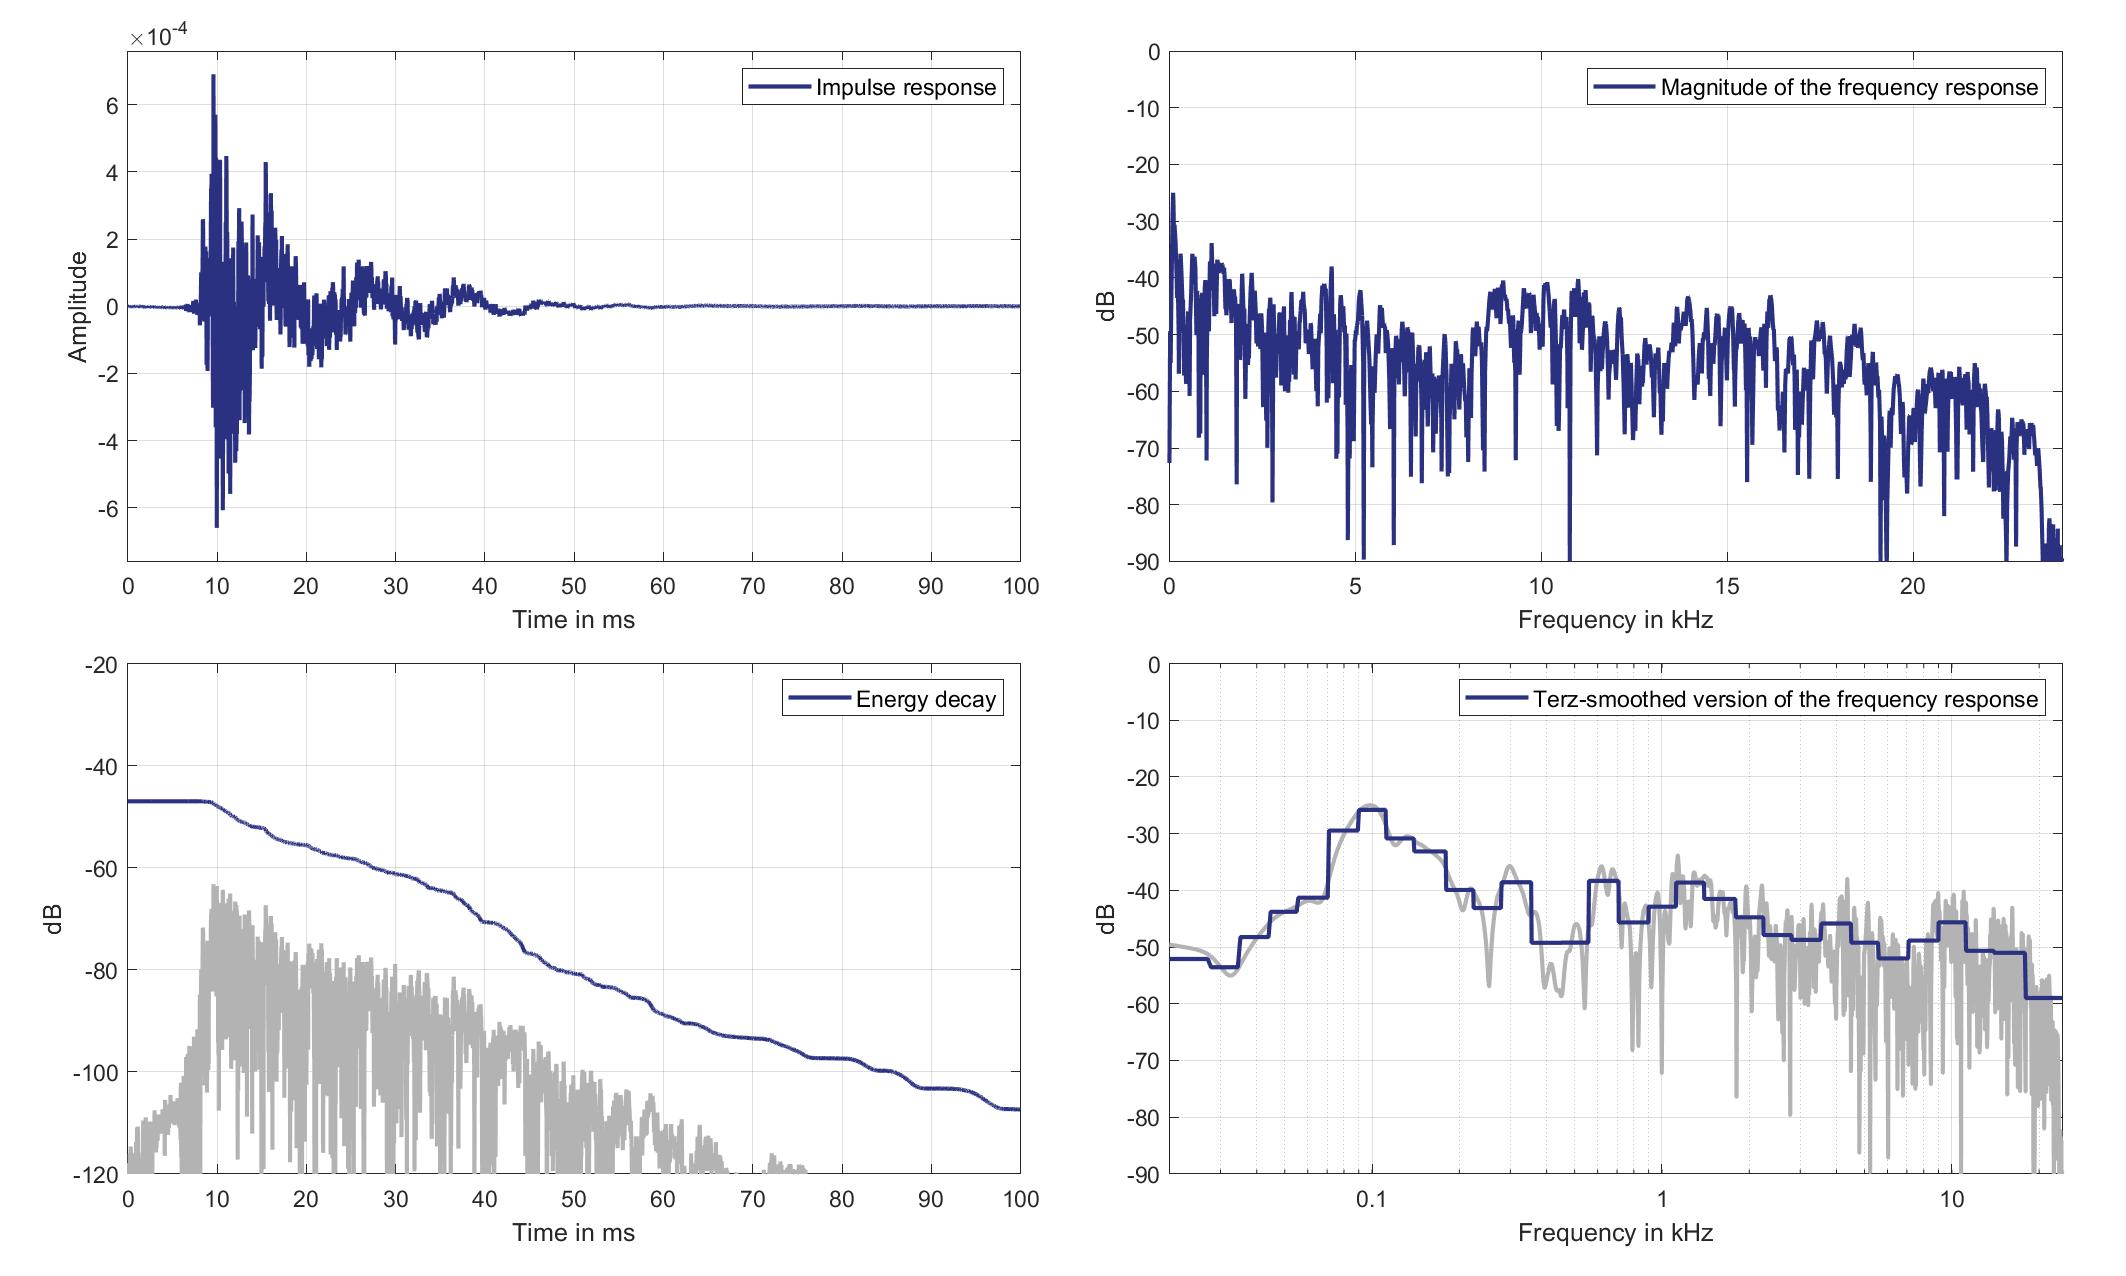
Download impulse response (in ".fir" format).
In the download section you can download all impulse response files as well as format explanation and Matlab as well as Python code examples for loading fir files.
Mics. 27/28
Left Ear Microphone
Standard Car Loudspeaker 2 (Lsp. 20) to Left Ear Microphone of Zone 6 (Mic. 27)
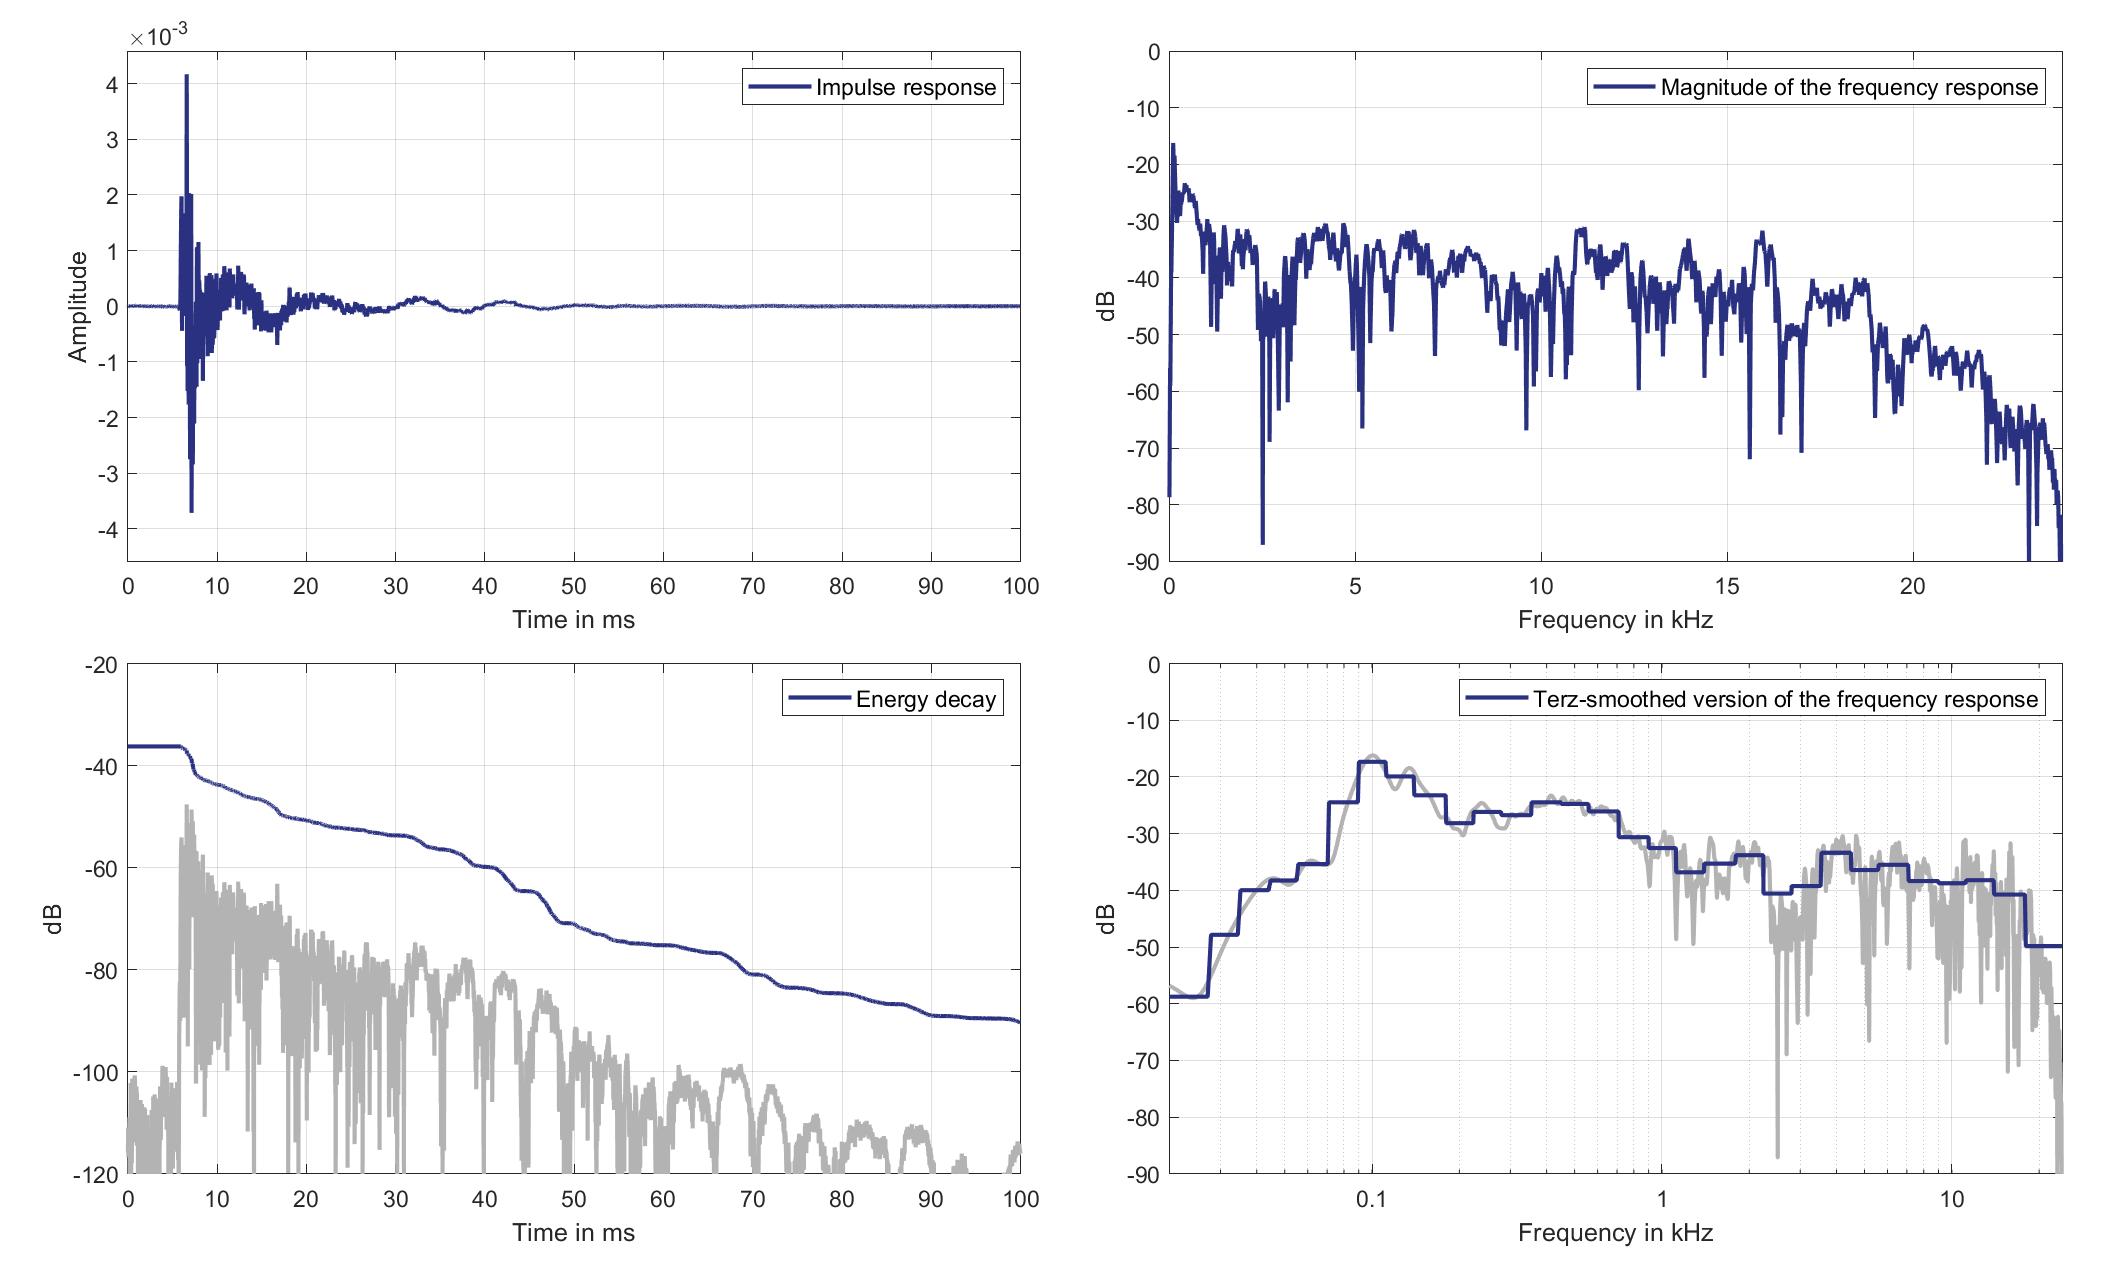
Download impulse response (in ".fir" format).
In the download section you can download all impulse response files as well as format explanation and Matlab as well as Python code examples for loading fir files.
Right Ear Microphone
Standard Car Loudspeaker 2 (Lsp. 20) to Right Ear Microphone of Zone 6 (Mic. 28)
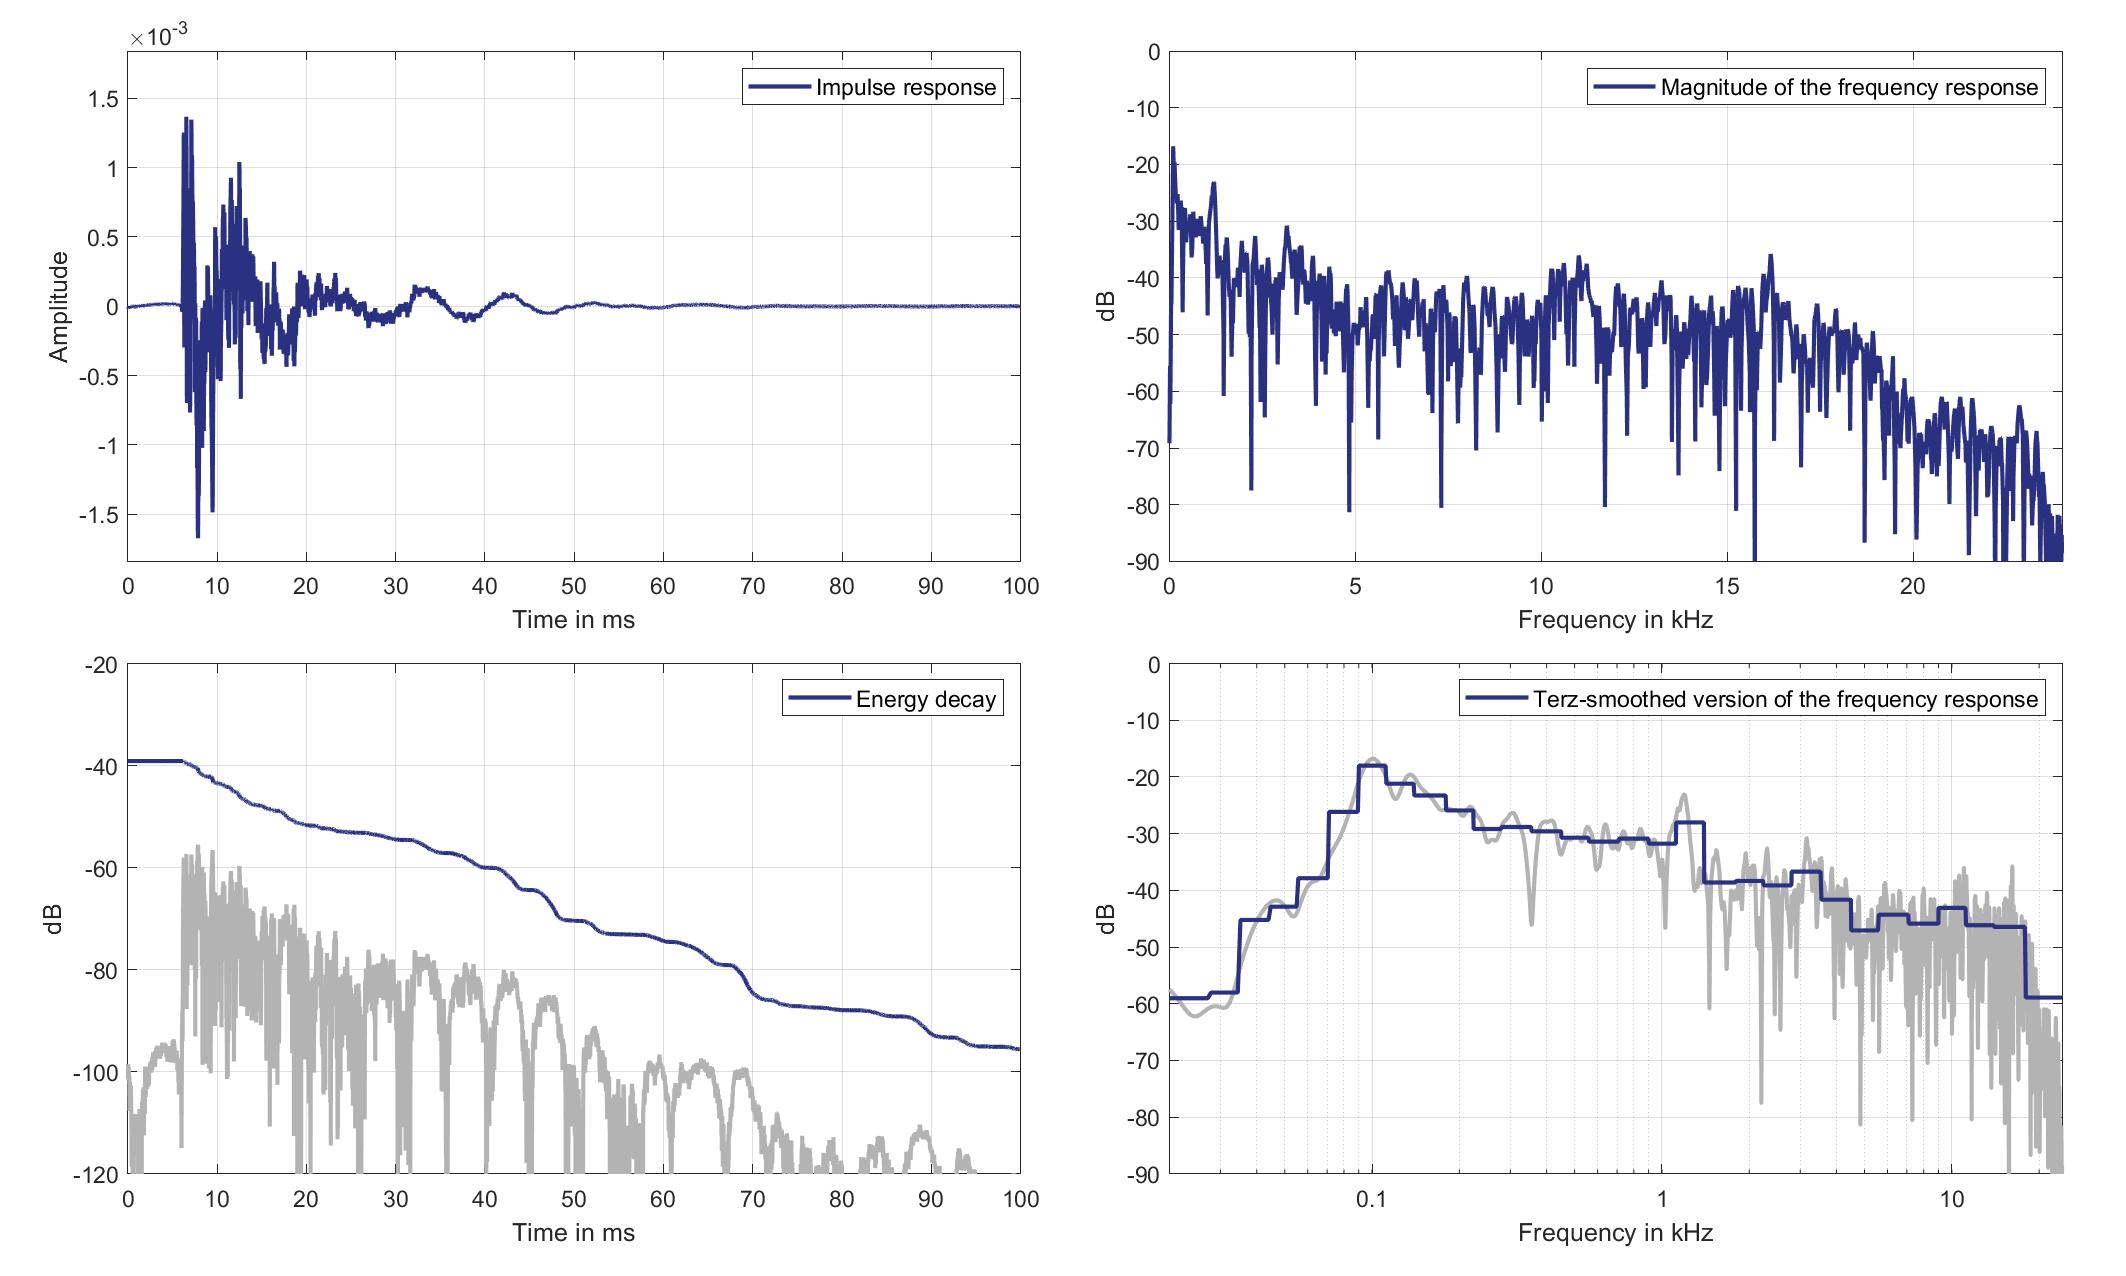
Download impulse response (in ".fir" format).
In the download section you can download all impulse response files as well as format explanation and Matlab as well as Python code examples for loading fir files.
Mics. 29/30
Left Ear Microphone
Standard Car Loudspeaker 2 (Lsp. 20) to Left Ear Microphone of Zone 8 (Mic. 29)
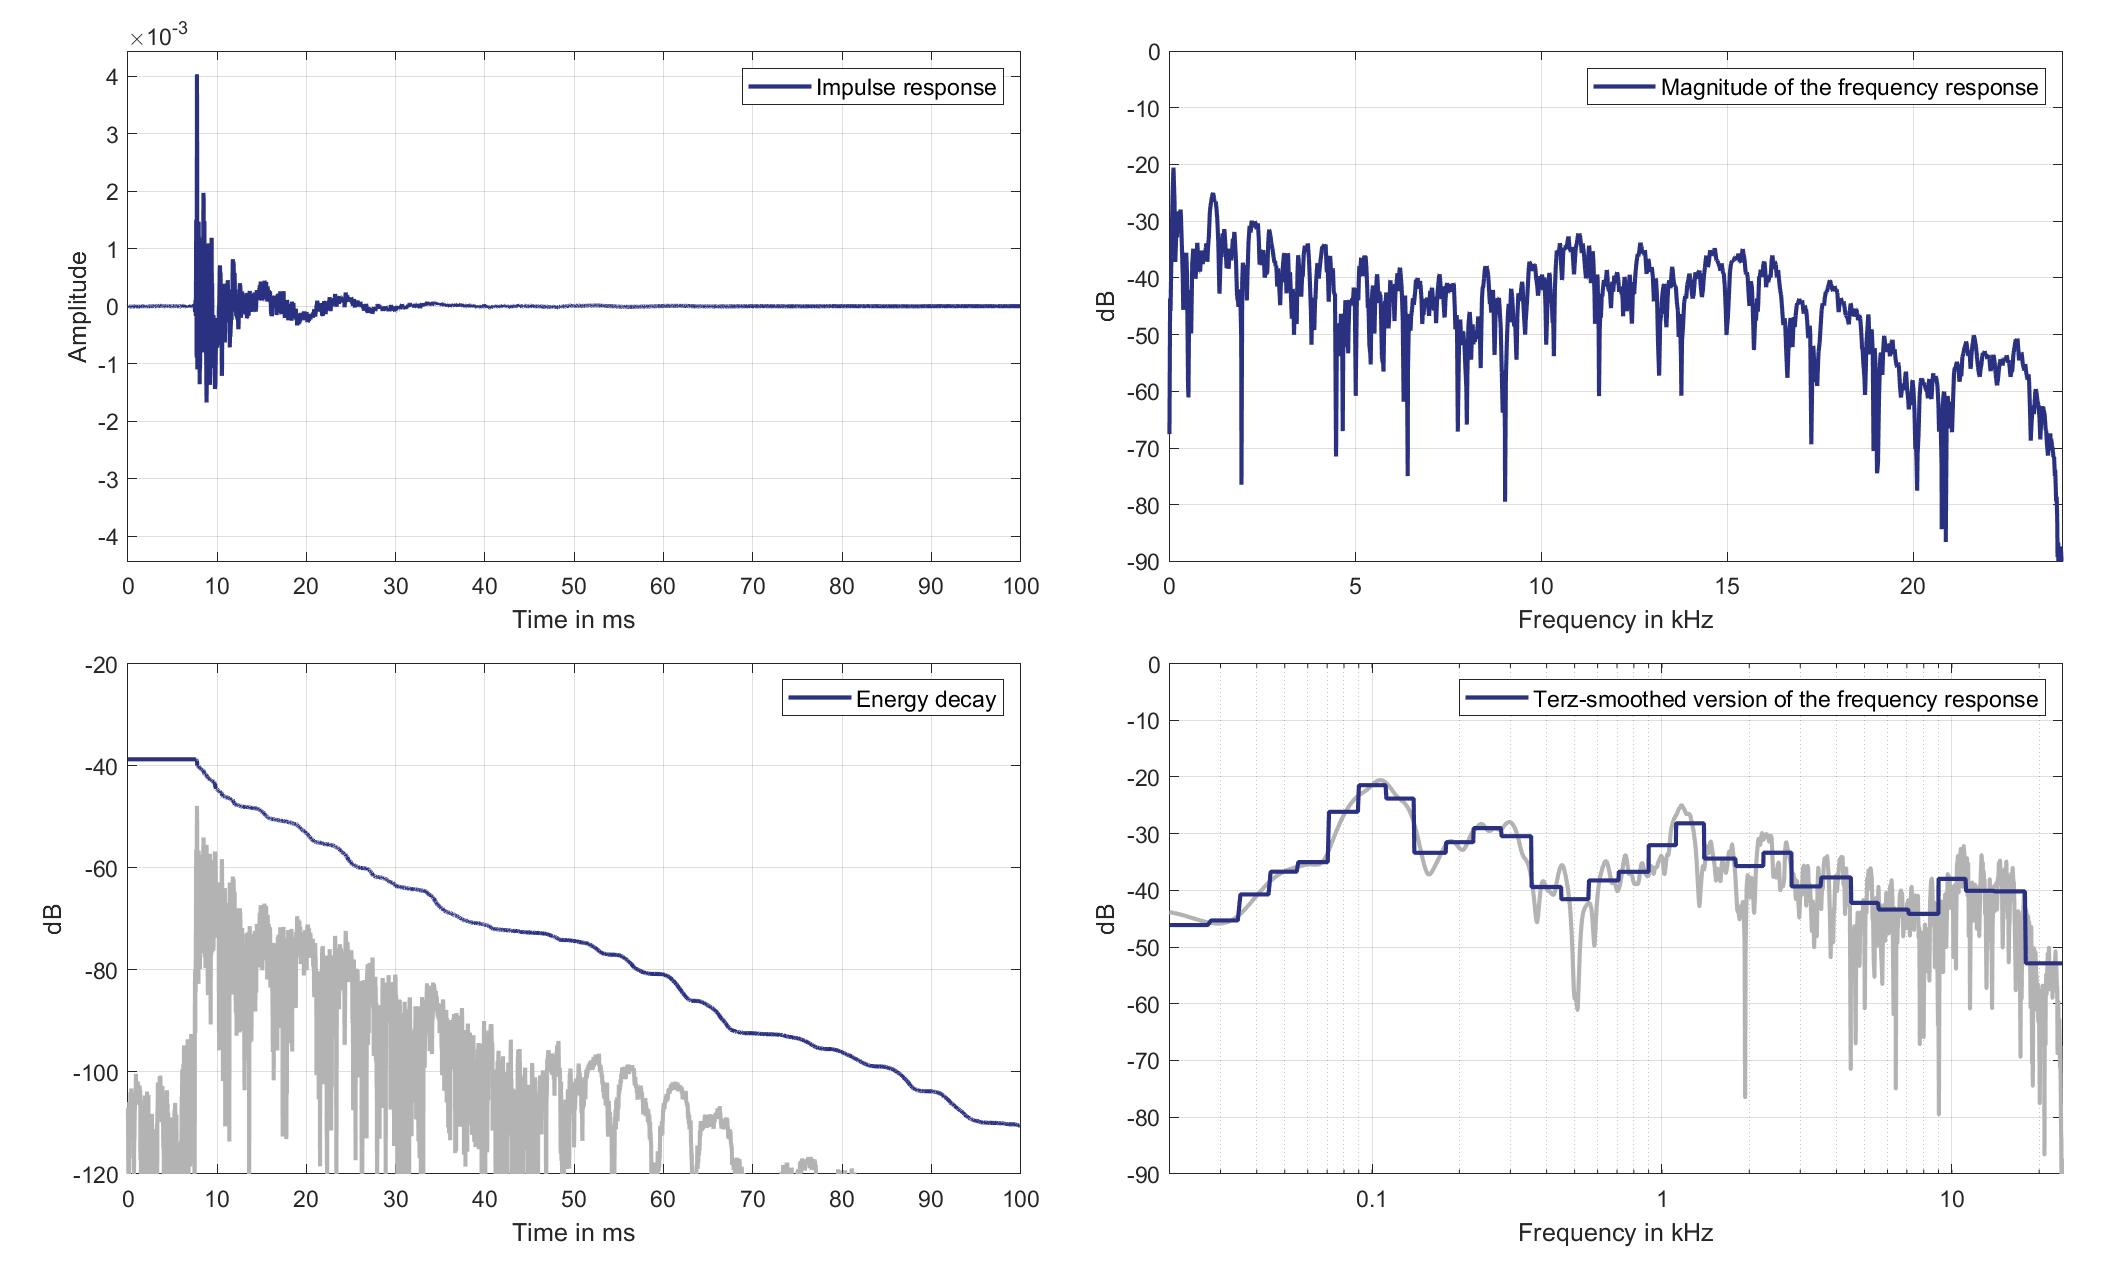
Download impulse response (in ".fir" format).
In the download section you can download all impulse response files as well as format explanation and Matlab as well as Python code examples for loading fir files.
Right Ear Microphone
Standard Car Loudspeaker 2 (Lsp. 20) to Right Ear Microphone of Zone 8 (Mic. 30)
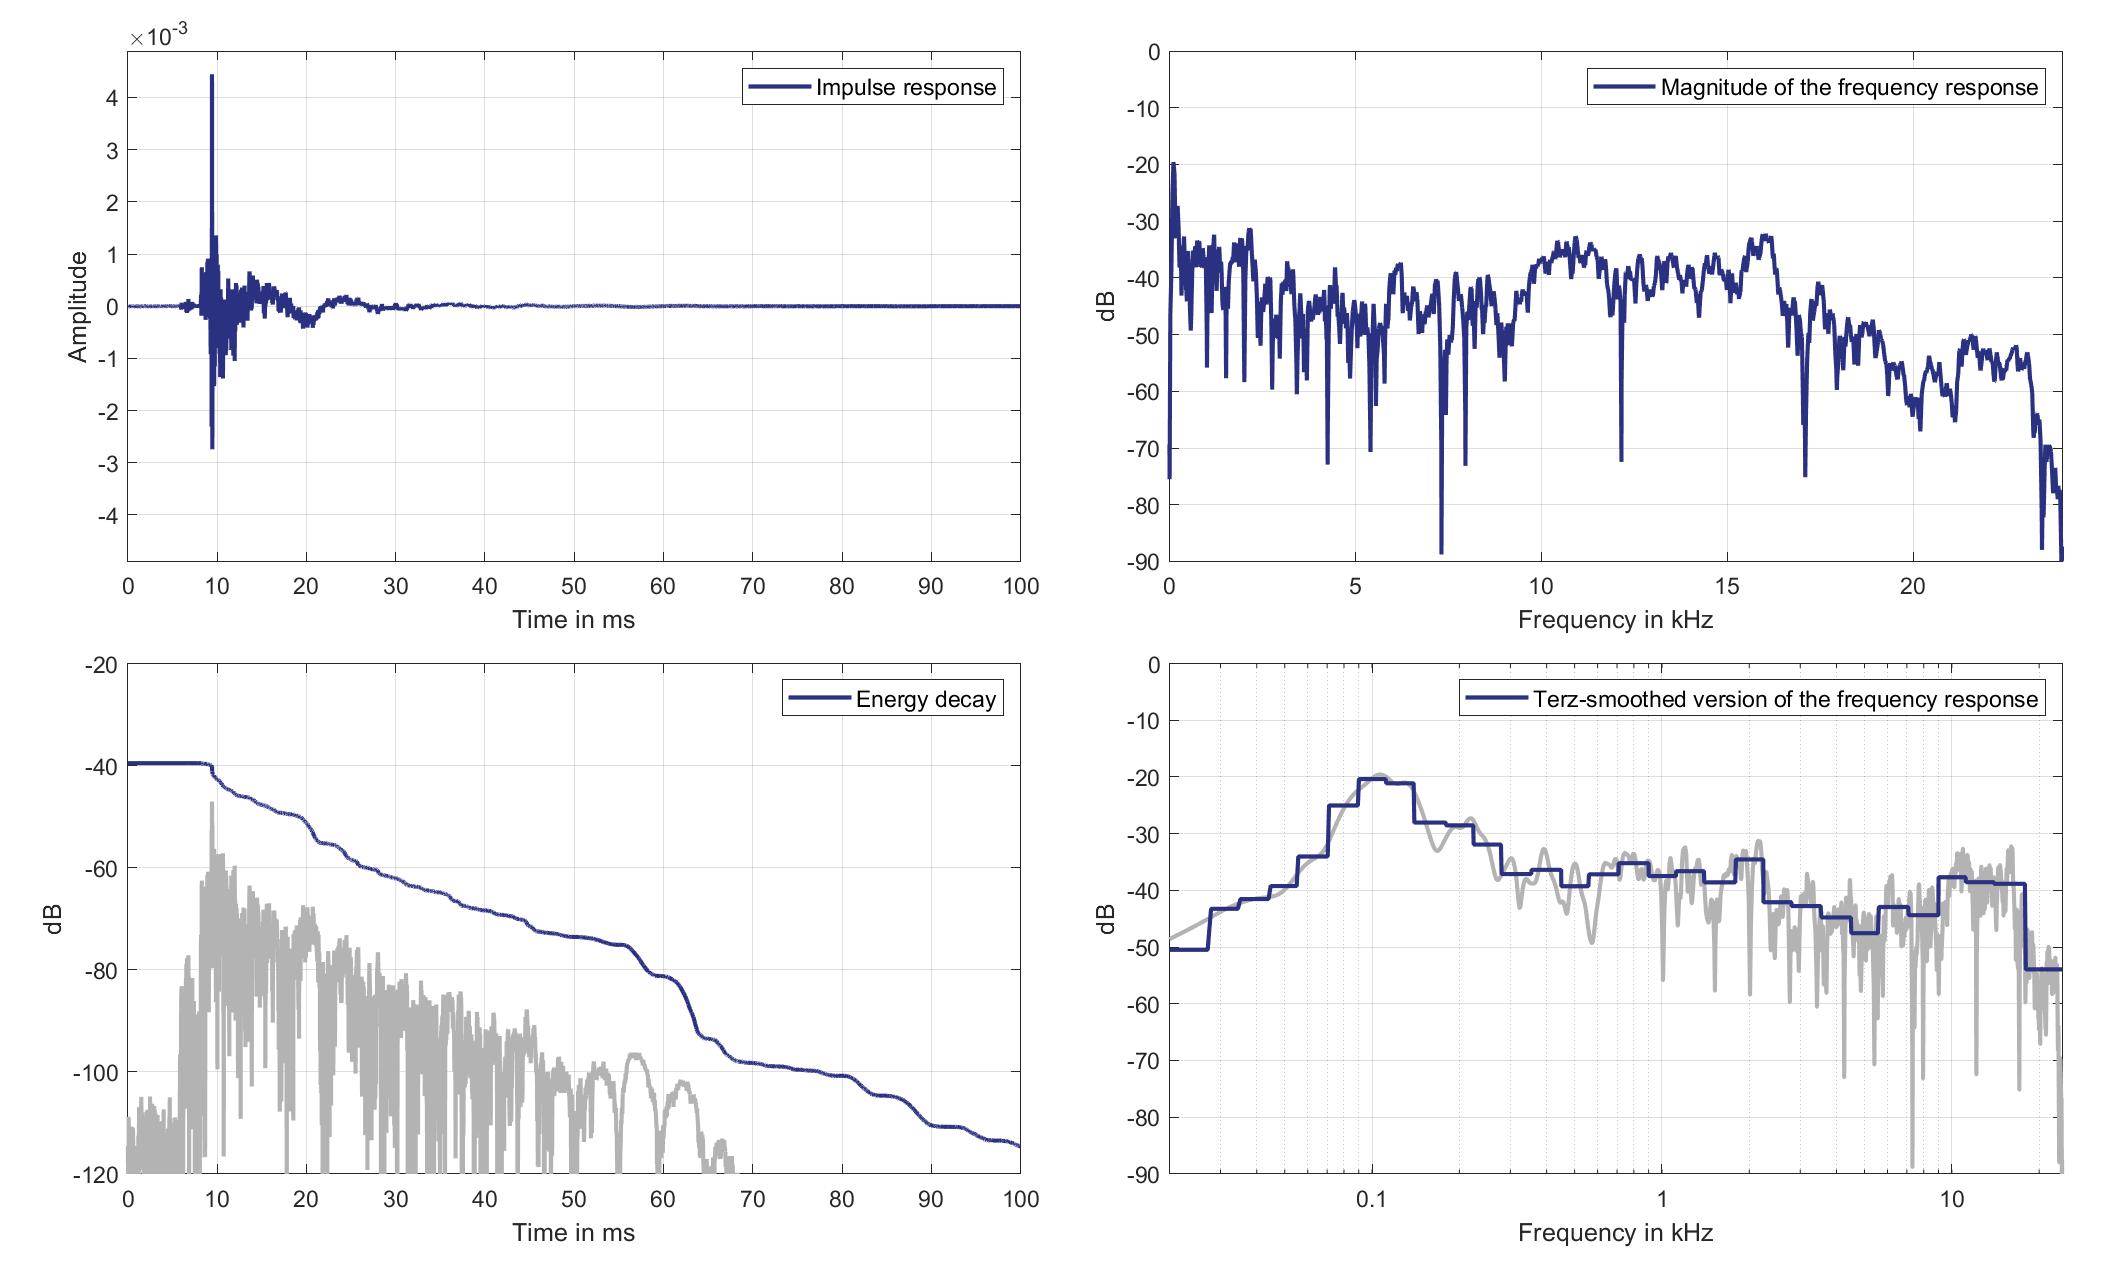
Download impulse response (in ".fir" format).
In the download section you can download all impulse response files as well as format explanation and Matlab as well as Python code examples for loading fir files.
Lsp. 21
Mics. 19/20
Left Ear Microphone
Standard Car Loudspeaker 3 (Lsp. 21) to Left Ear Microphone of Zone 1 (Mic. 19)
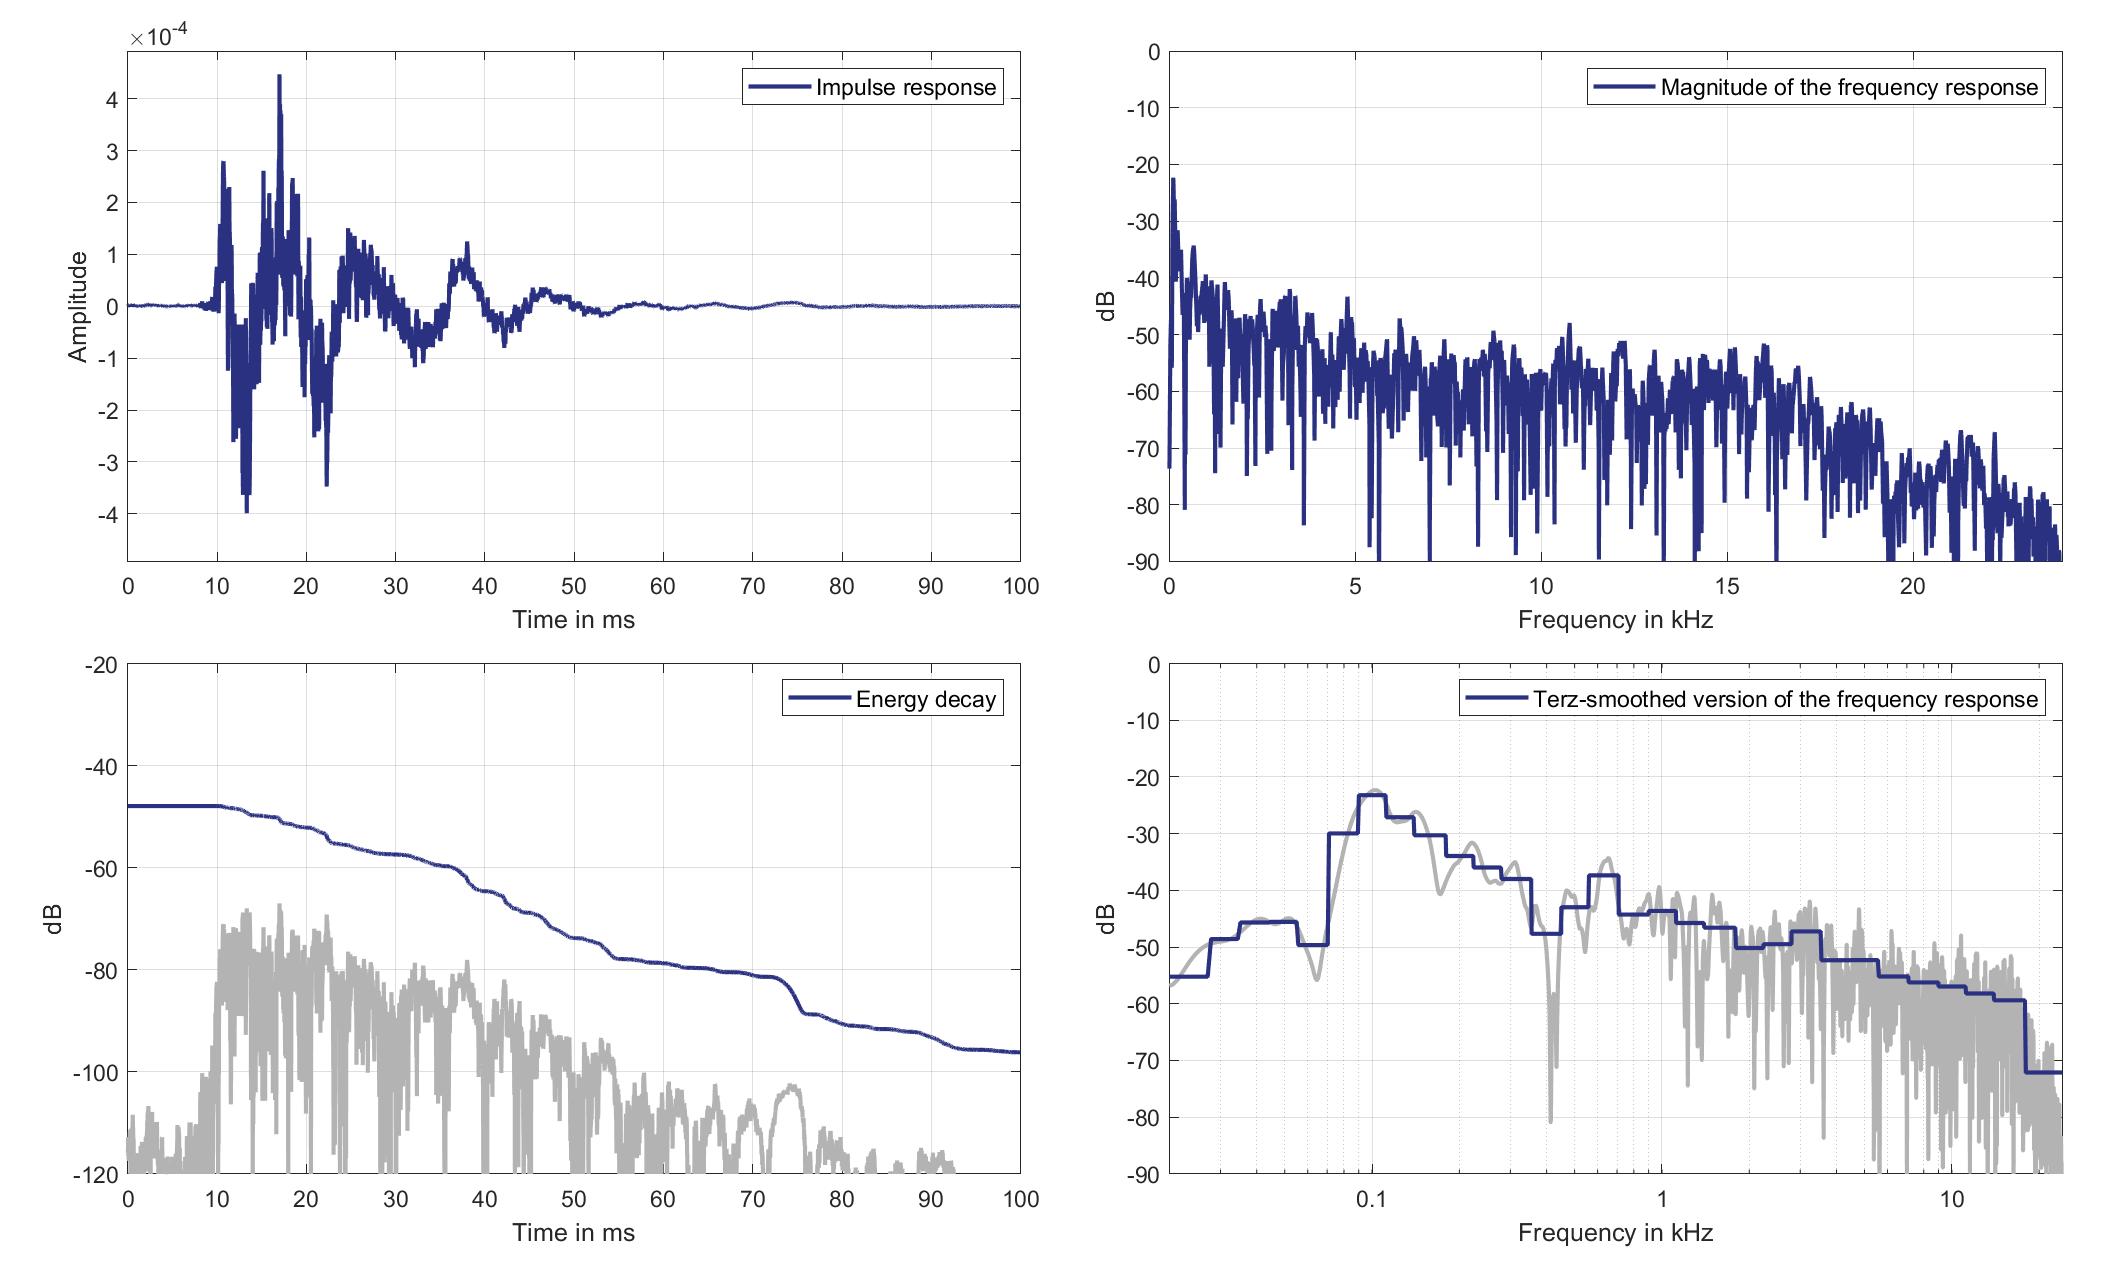
Download impulse response (in ".fir" format).
In the download section you can download all impulse response files as well as format explanation and Matlab as well as Python code examples for loading fir files.
Right Ear Microphone
Standard Car Loudspeaker 3 (Lsp. 21) to Right Ear Microphone of Zone 1 (Mic. 20)
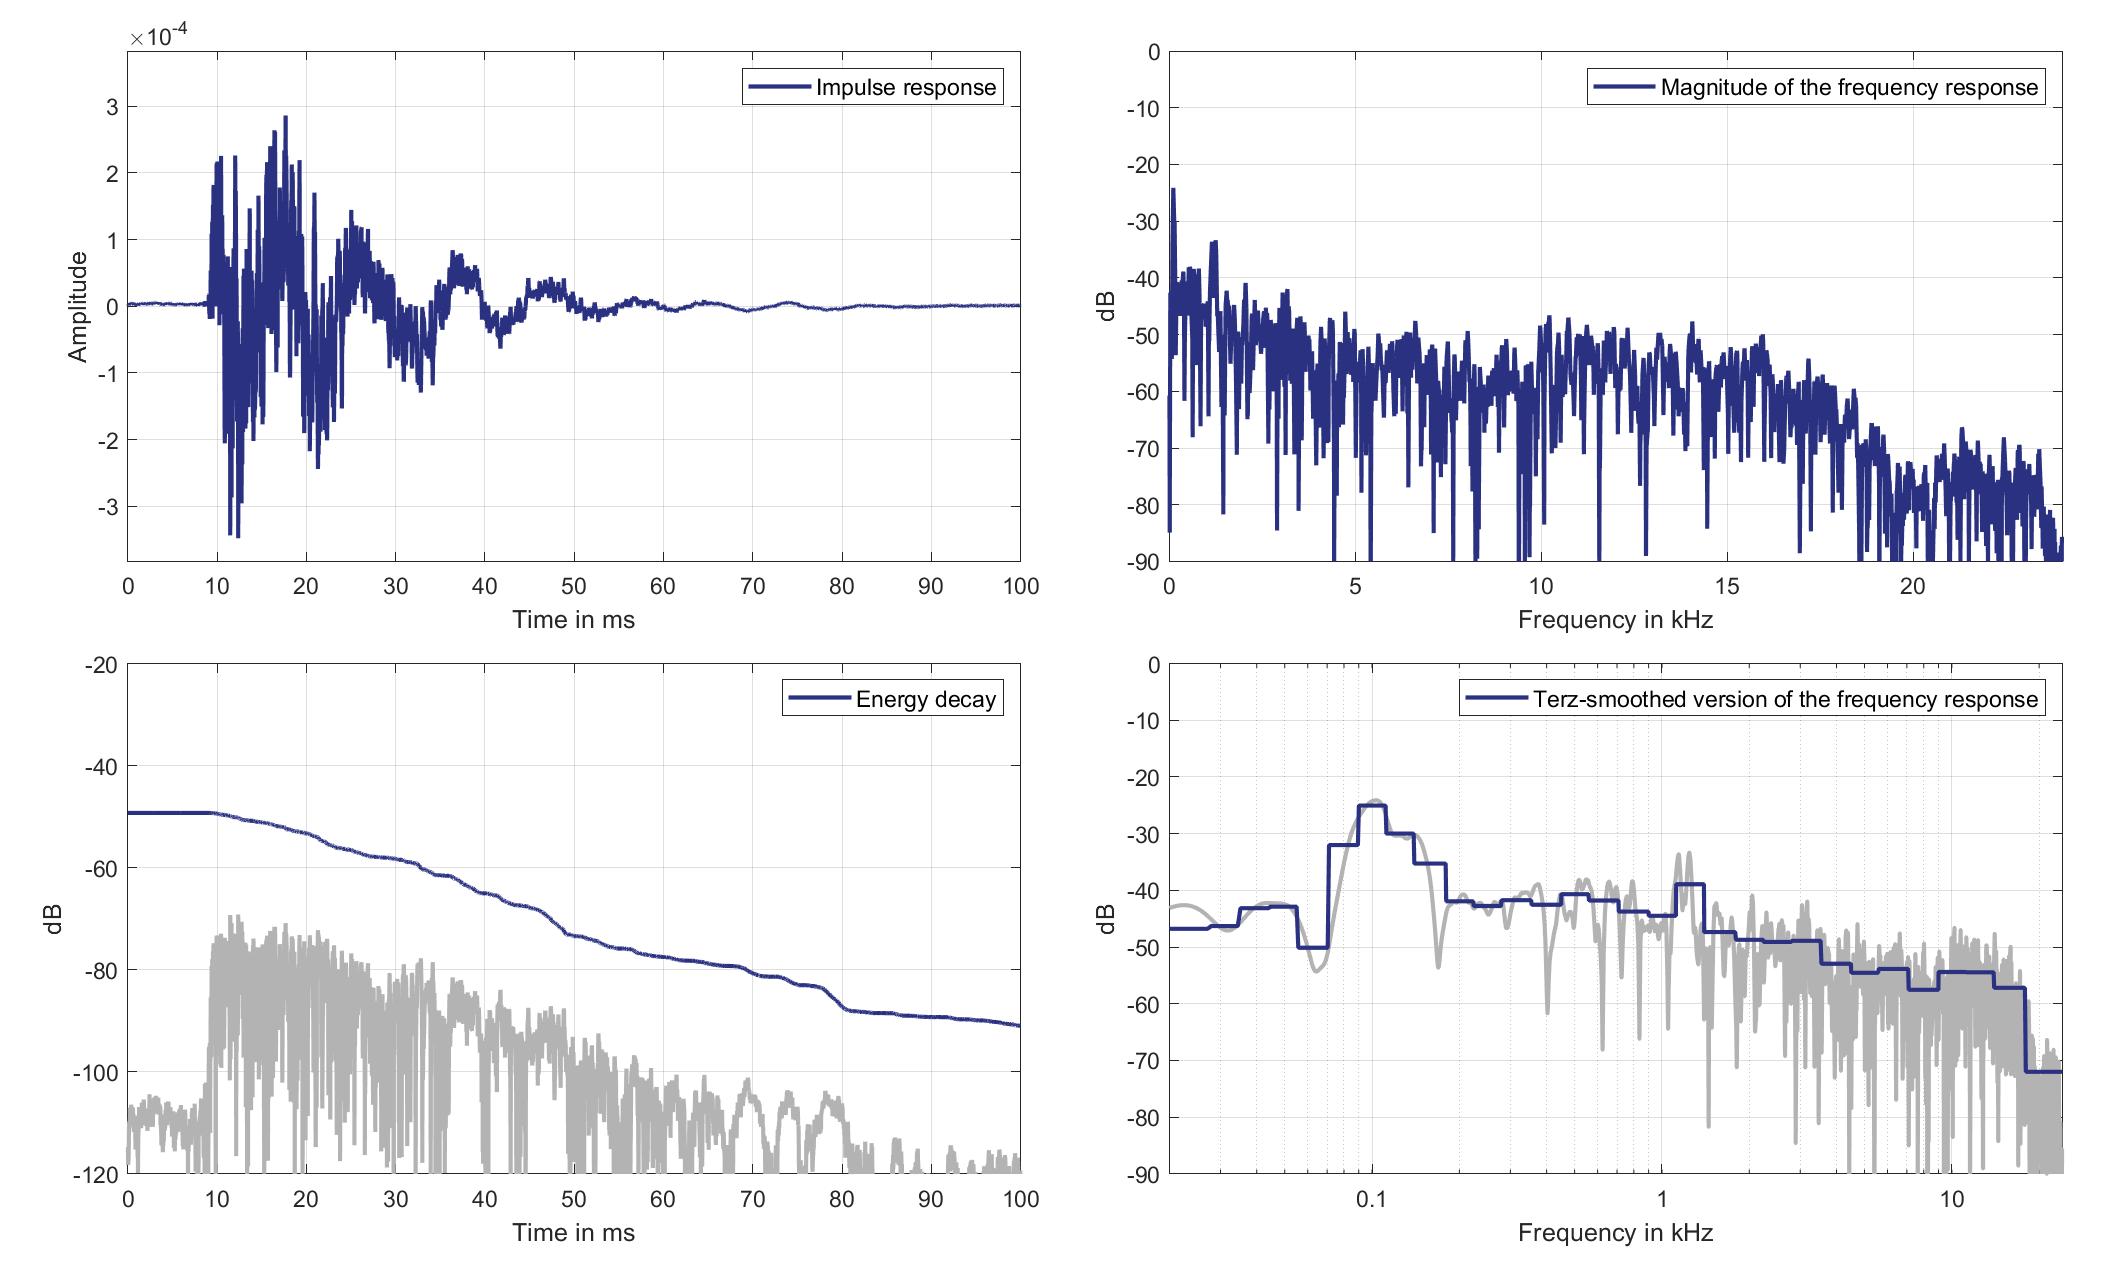
Download impulse response (in ".fir" format).
In the download section you can download all impulse response files as well as format explanation and Matlab as well as Python code examples for loading fir files.
Mics. 21/22
Left Ear Microphone
Standard Car Loudspeaker 3 (Lsp. 21) to Left Ear Microphone of Zone 2 (Mic. 21)
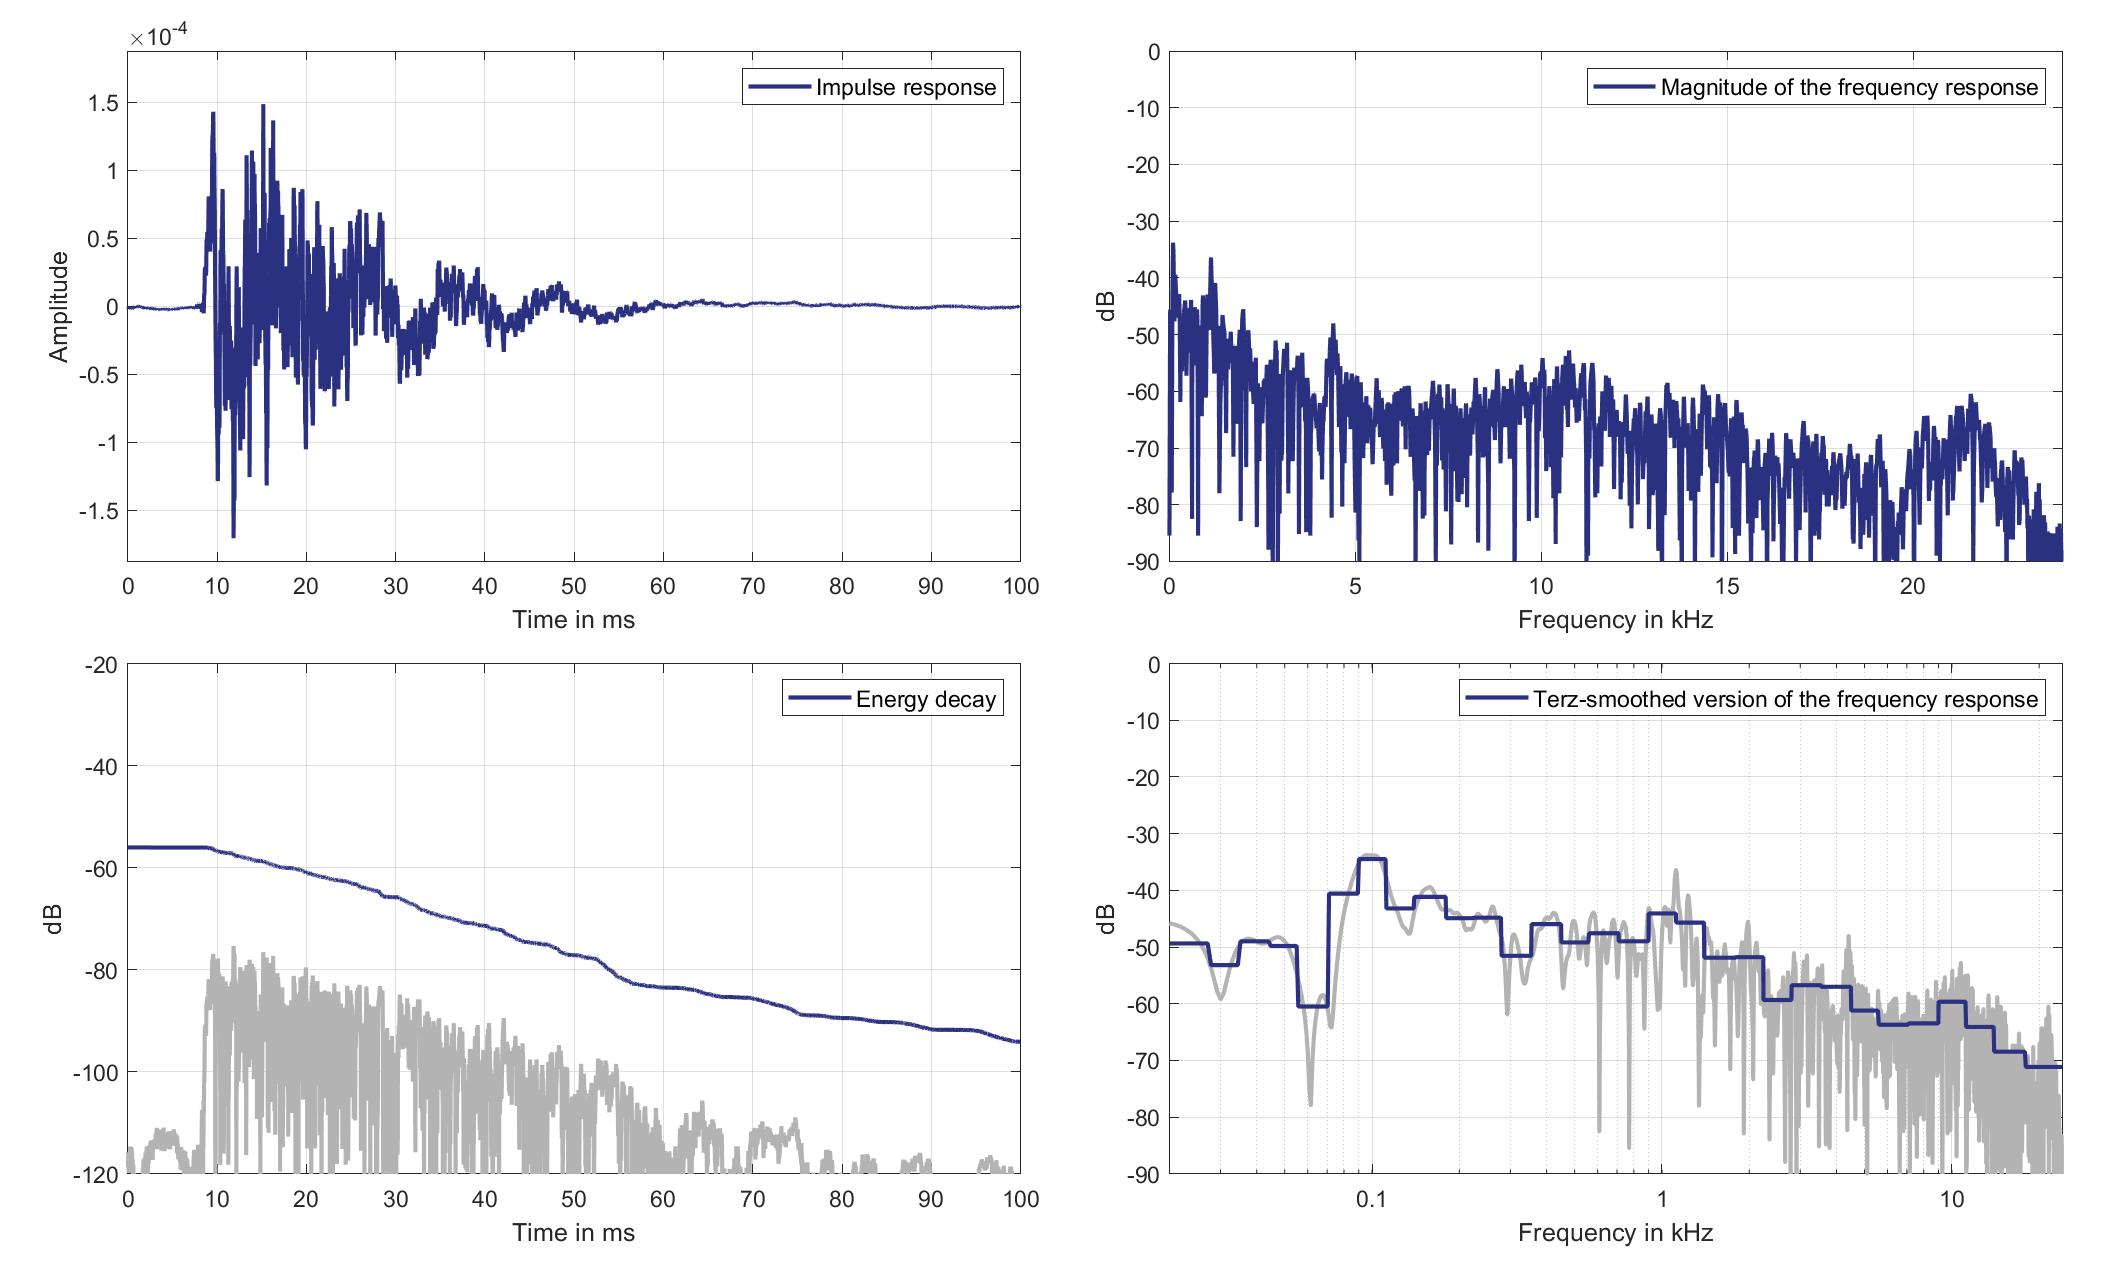
Download impulse response (in ".fir" format).
In the download section you can download all impulse response files as well as format explanation and Matlab as well as Python code examples for loading fir files.
Right Ear Microphone
Standard Car Loudspeaker 3 (Lsp. 21) to Right Ear Microphone of Zone 2 (Mic. 22)
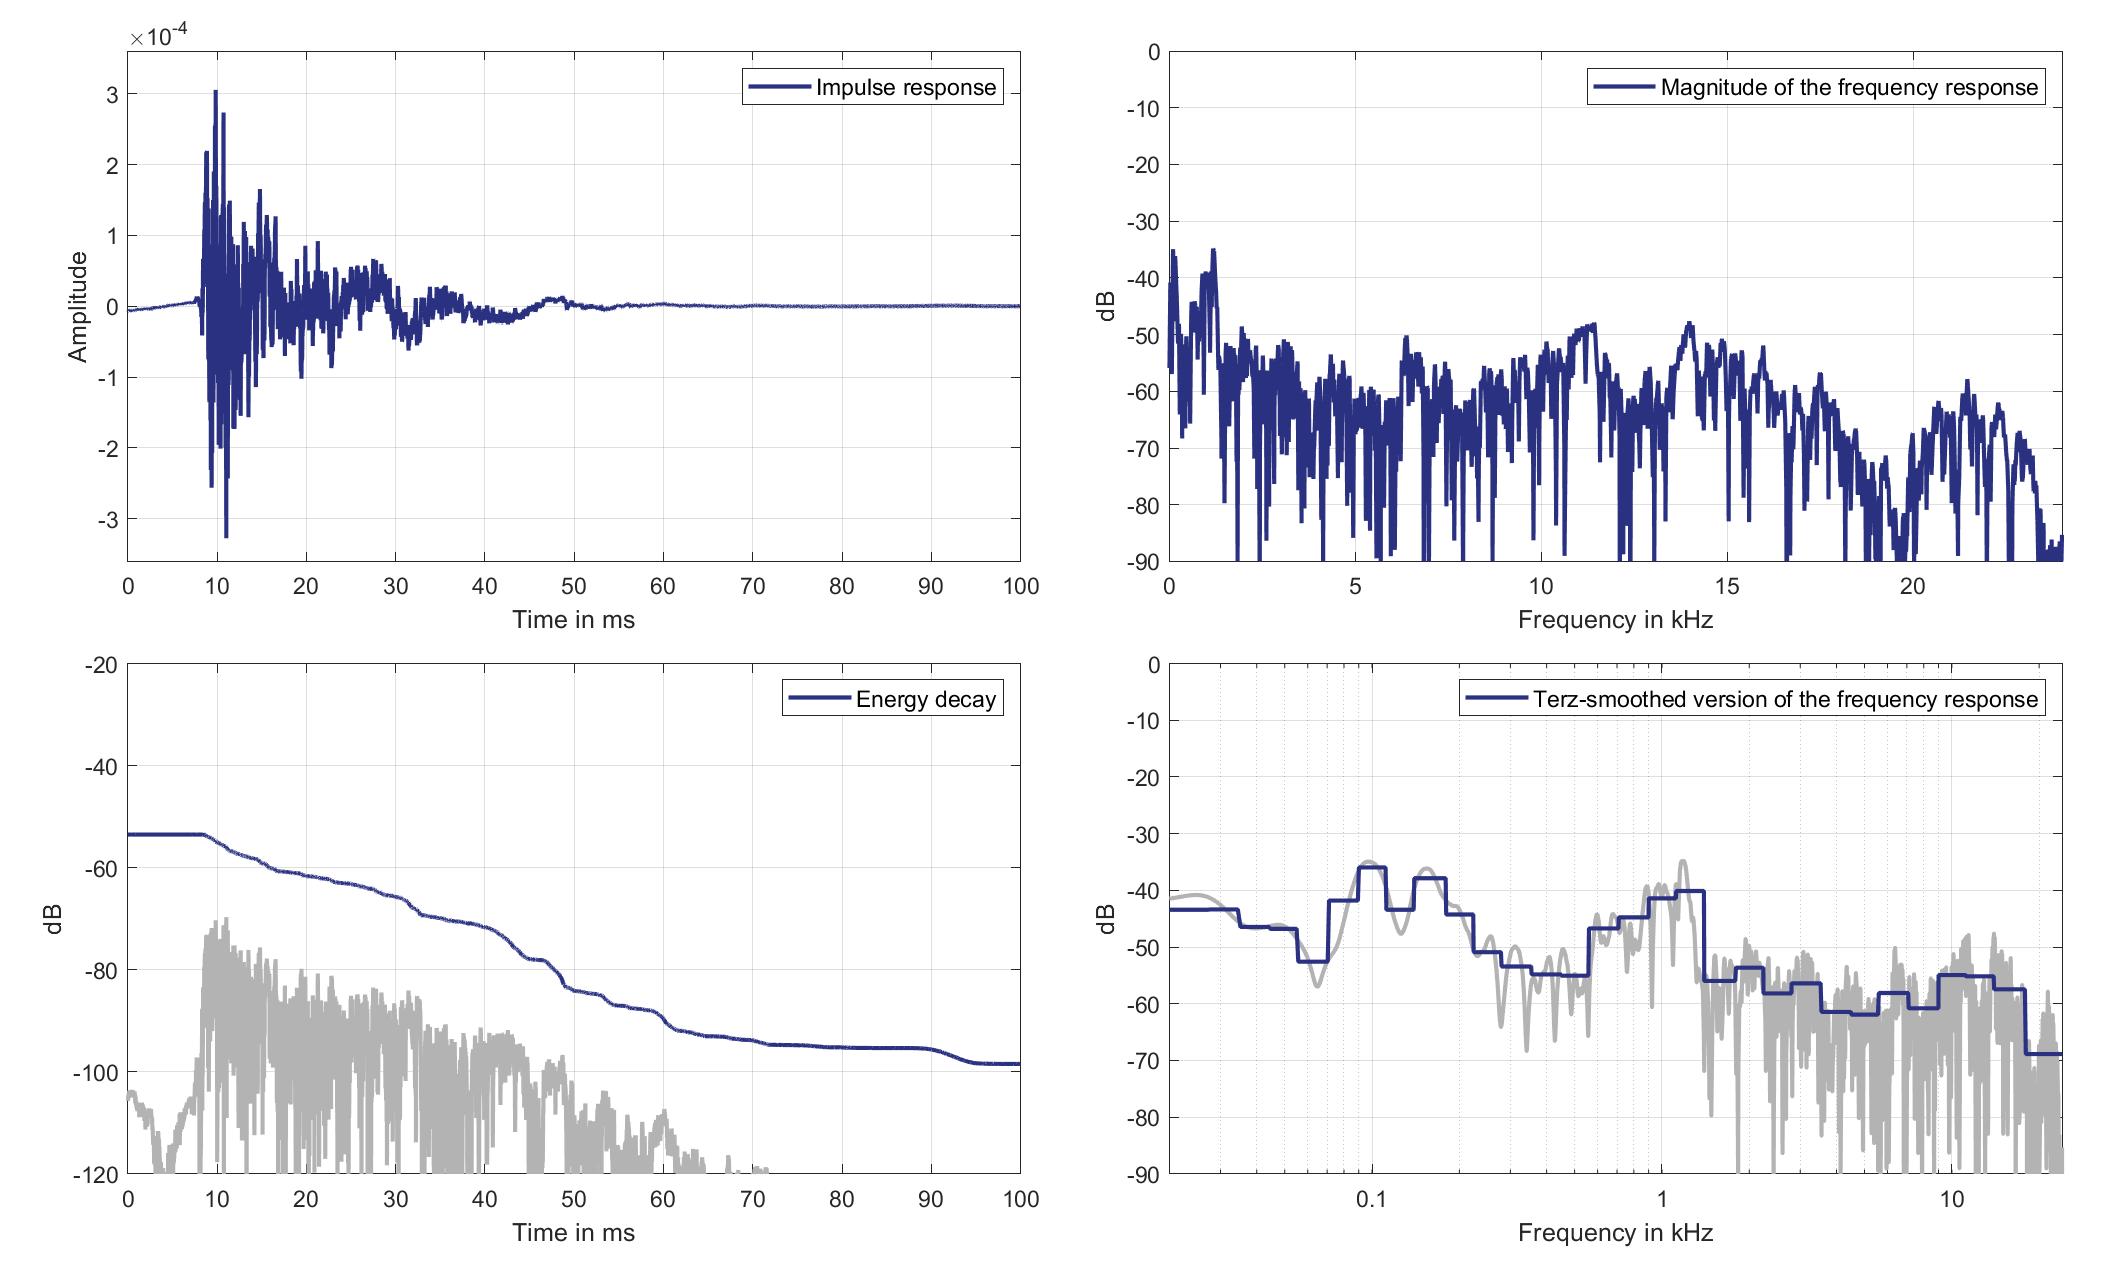
Download impulse response (in ".fir" format).
In the download section you can download all impulse response files as well as format explanation and Matlab as well as Python code examples for loading fir files.
Mics. 23/24
Left Ear Microphone
Standard Car Loudspeaker 3 (Lsp. 21) to Left Ear Microphone of Zone 3 (Mic. 23)
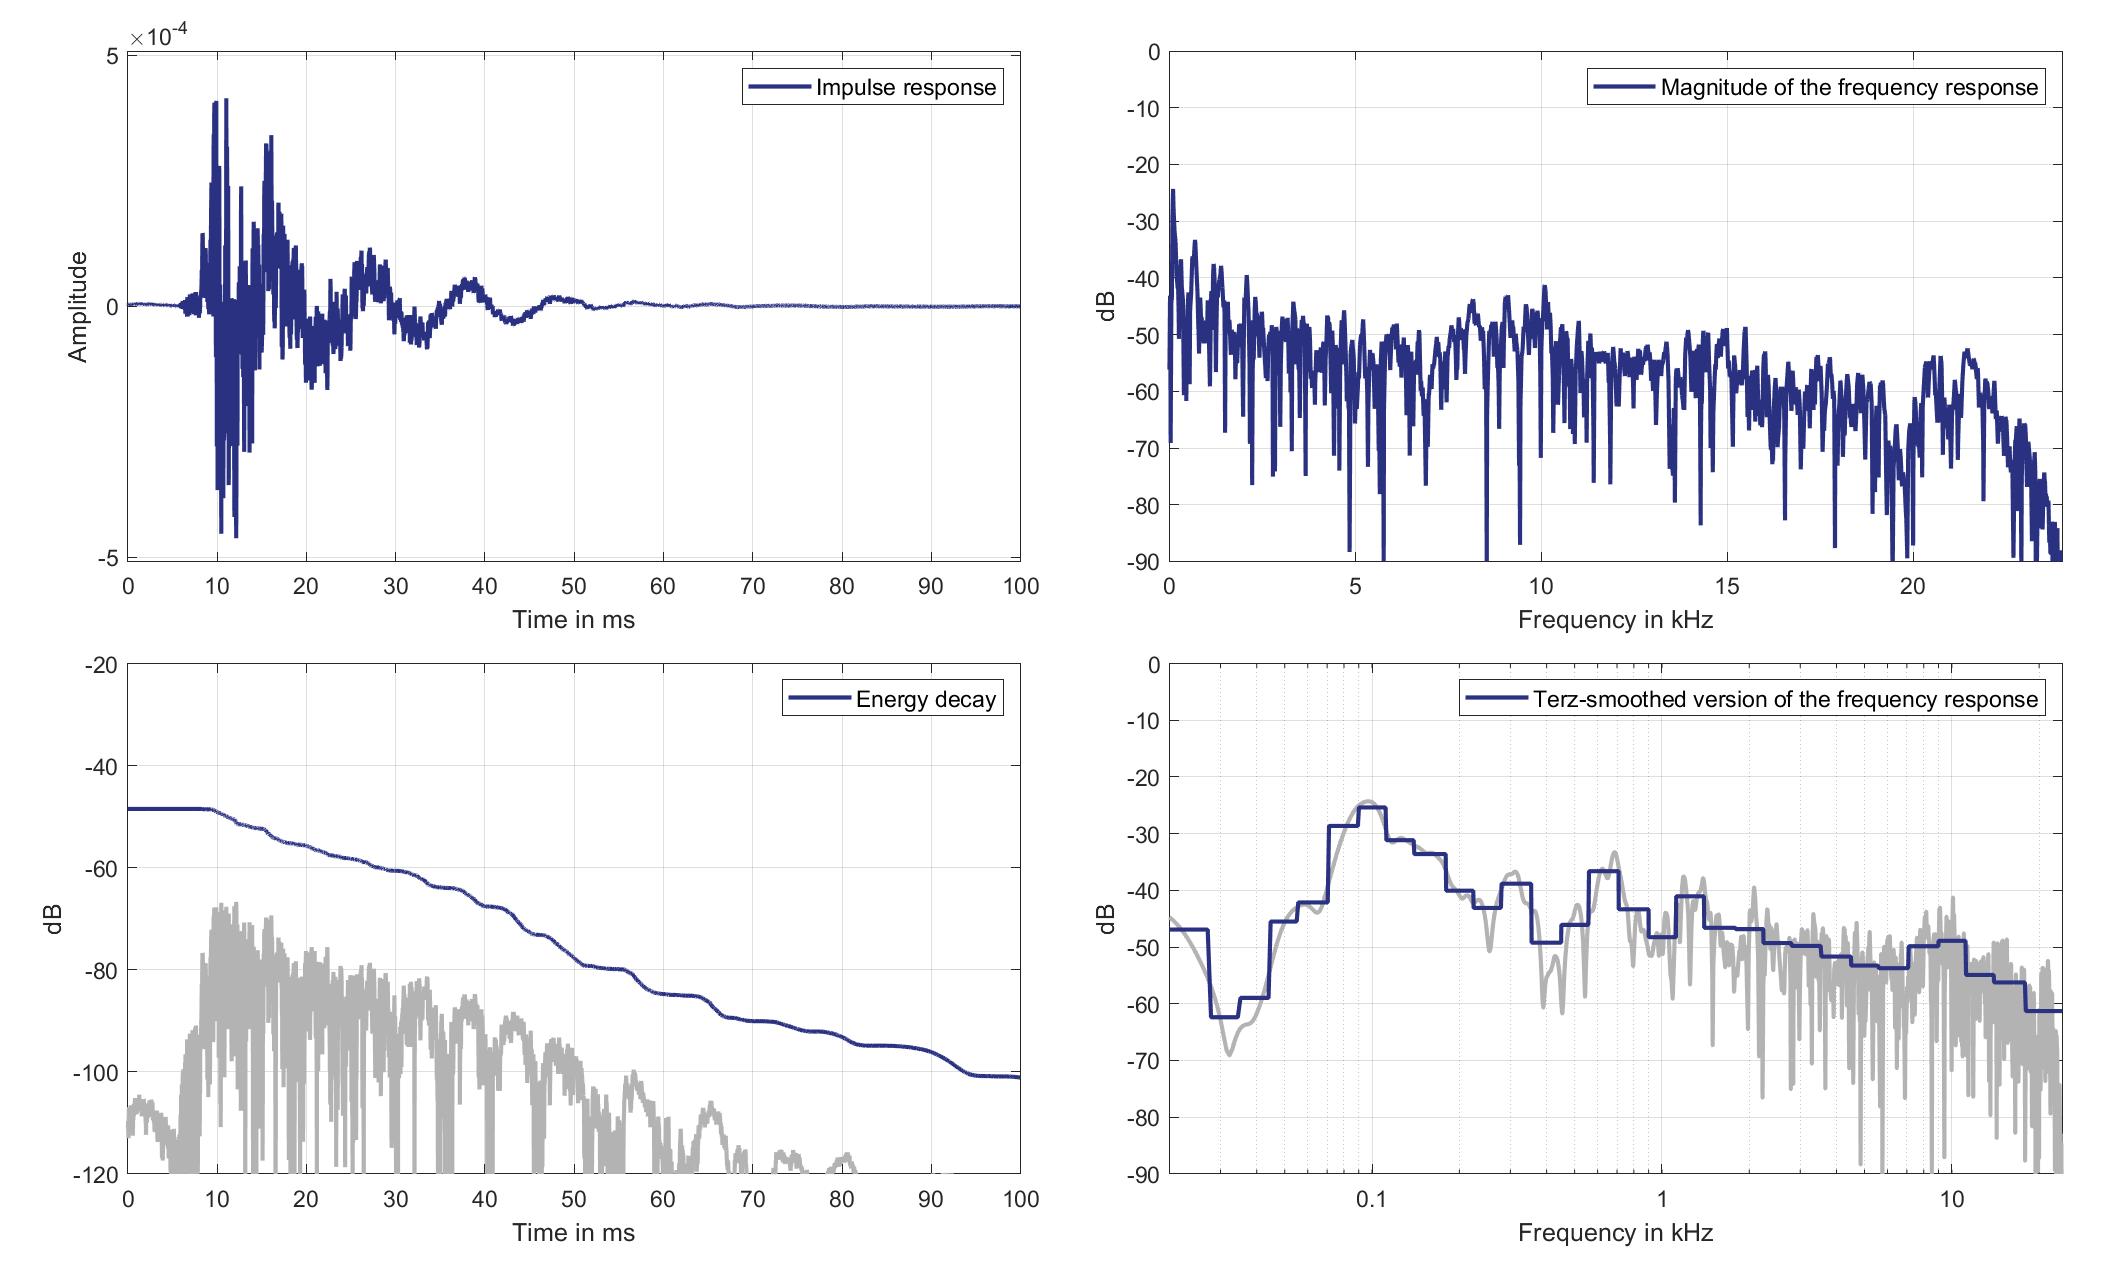
Download impulse response (in ".fir" format).
In the download section you can download all impulse response files as well as format explanation and Matlab as well as Python code examples for loading fir files.
Right Ear Microphone
Standard Car Loudspeaker 3 (Lsp. 21) to Right Ear Microphone of Zone 3 (Mic. 24)
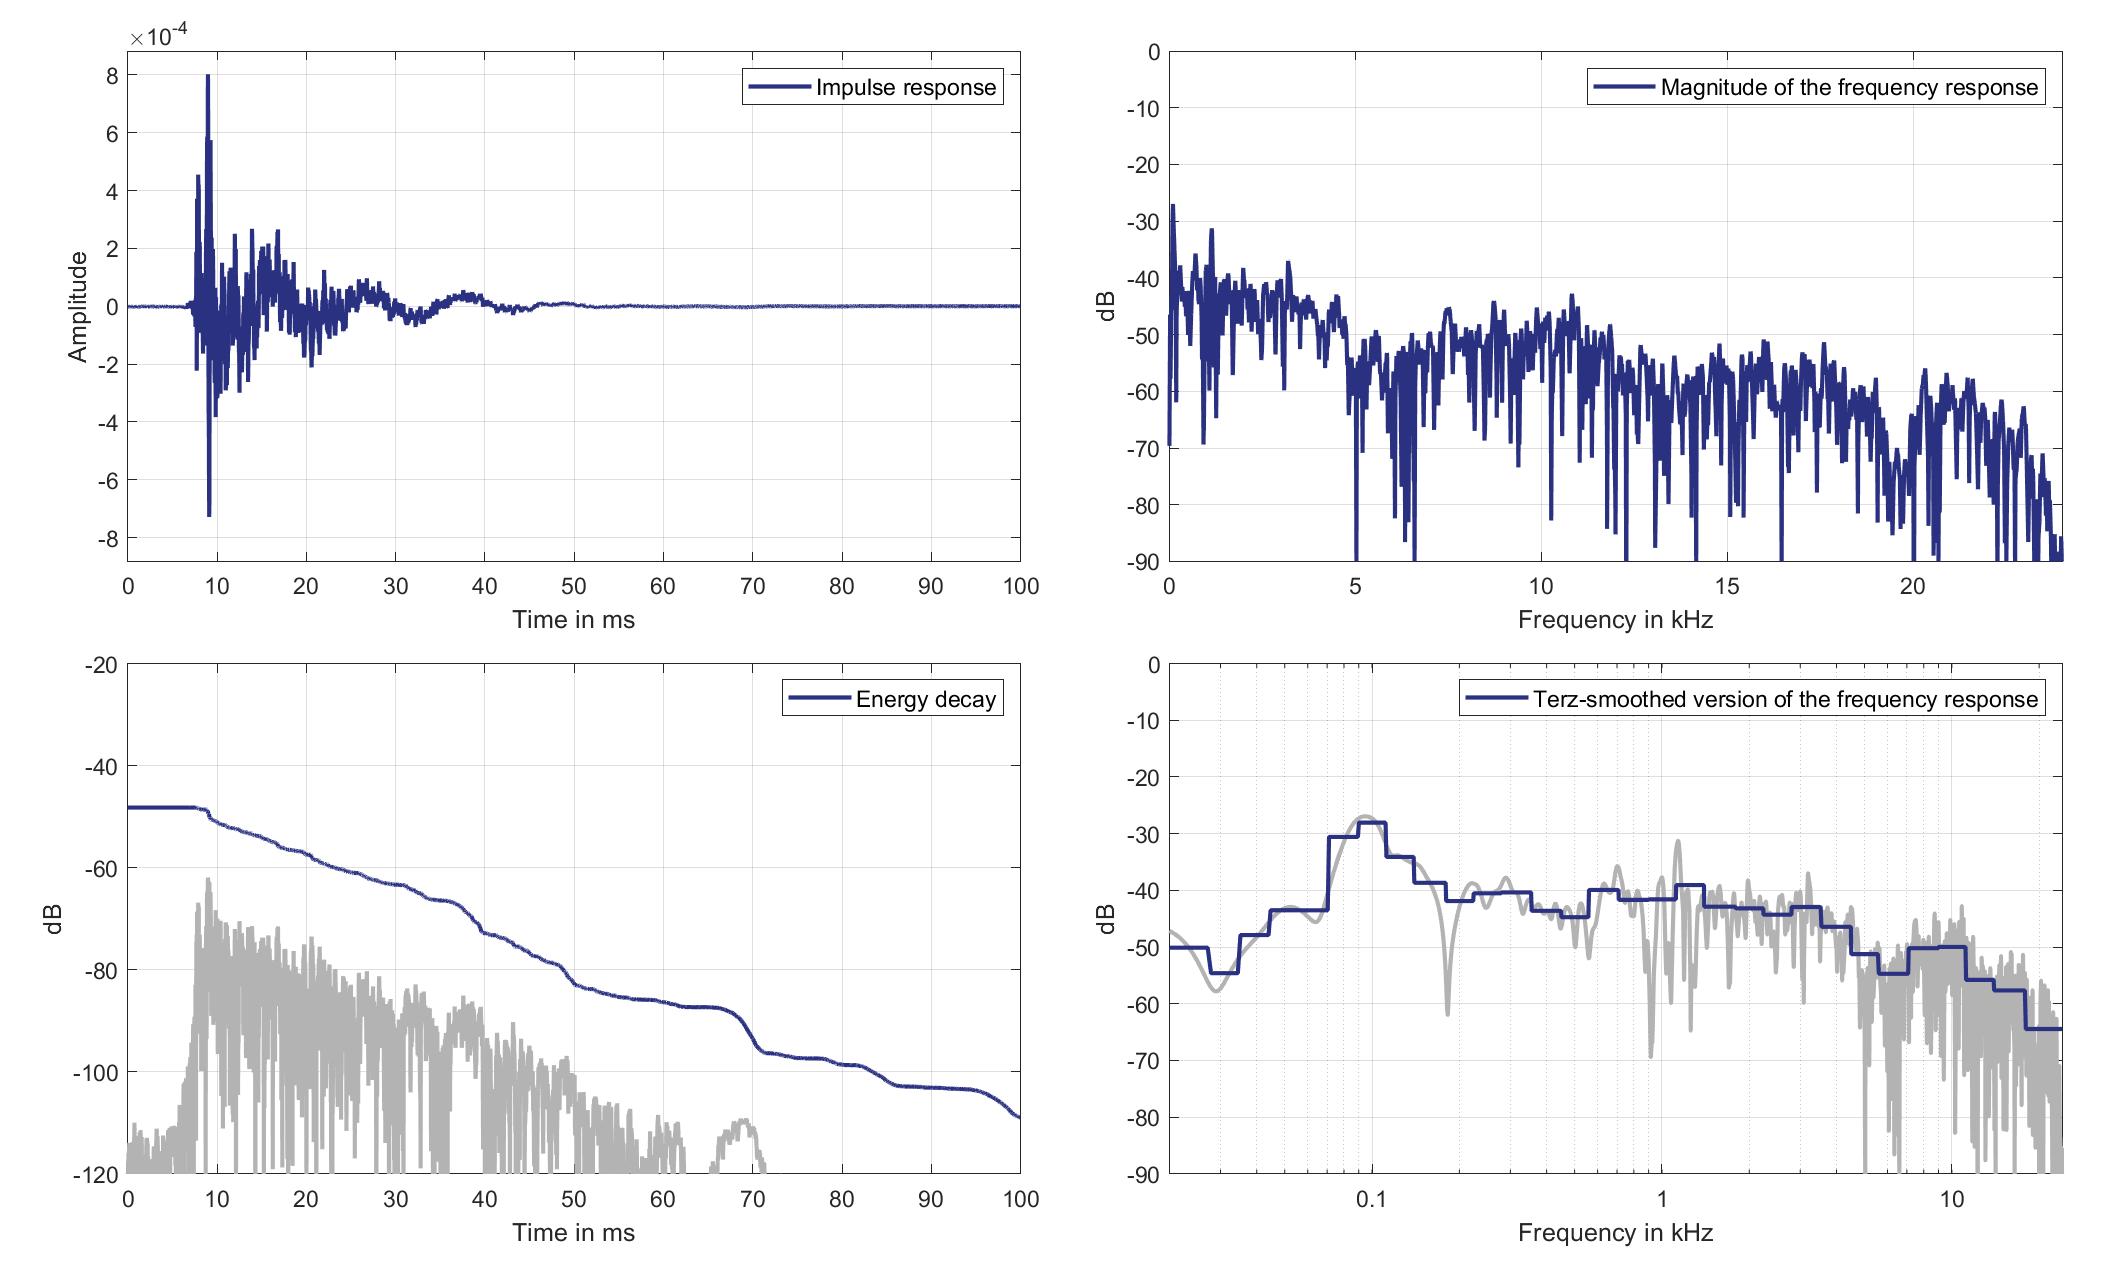
Download impulse response (in ".fir" format).
In the download section you can download all impulse response files as well as format explanation and Matlab as well as Python code examples for loading fir files.
Mics. 25/26
Left Ear Microphone
Standard Car Loudspeaker 3 (Lsp. 21) to Left Ear Microphone of Zone 5 (Mic. 25)
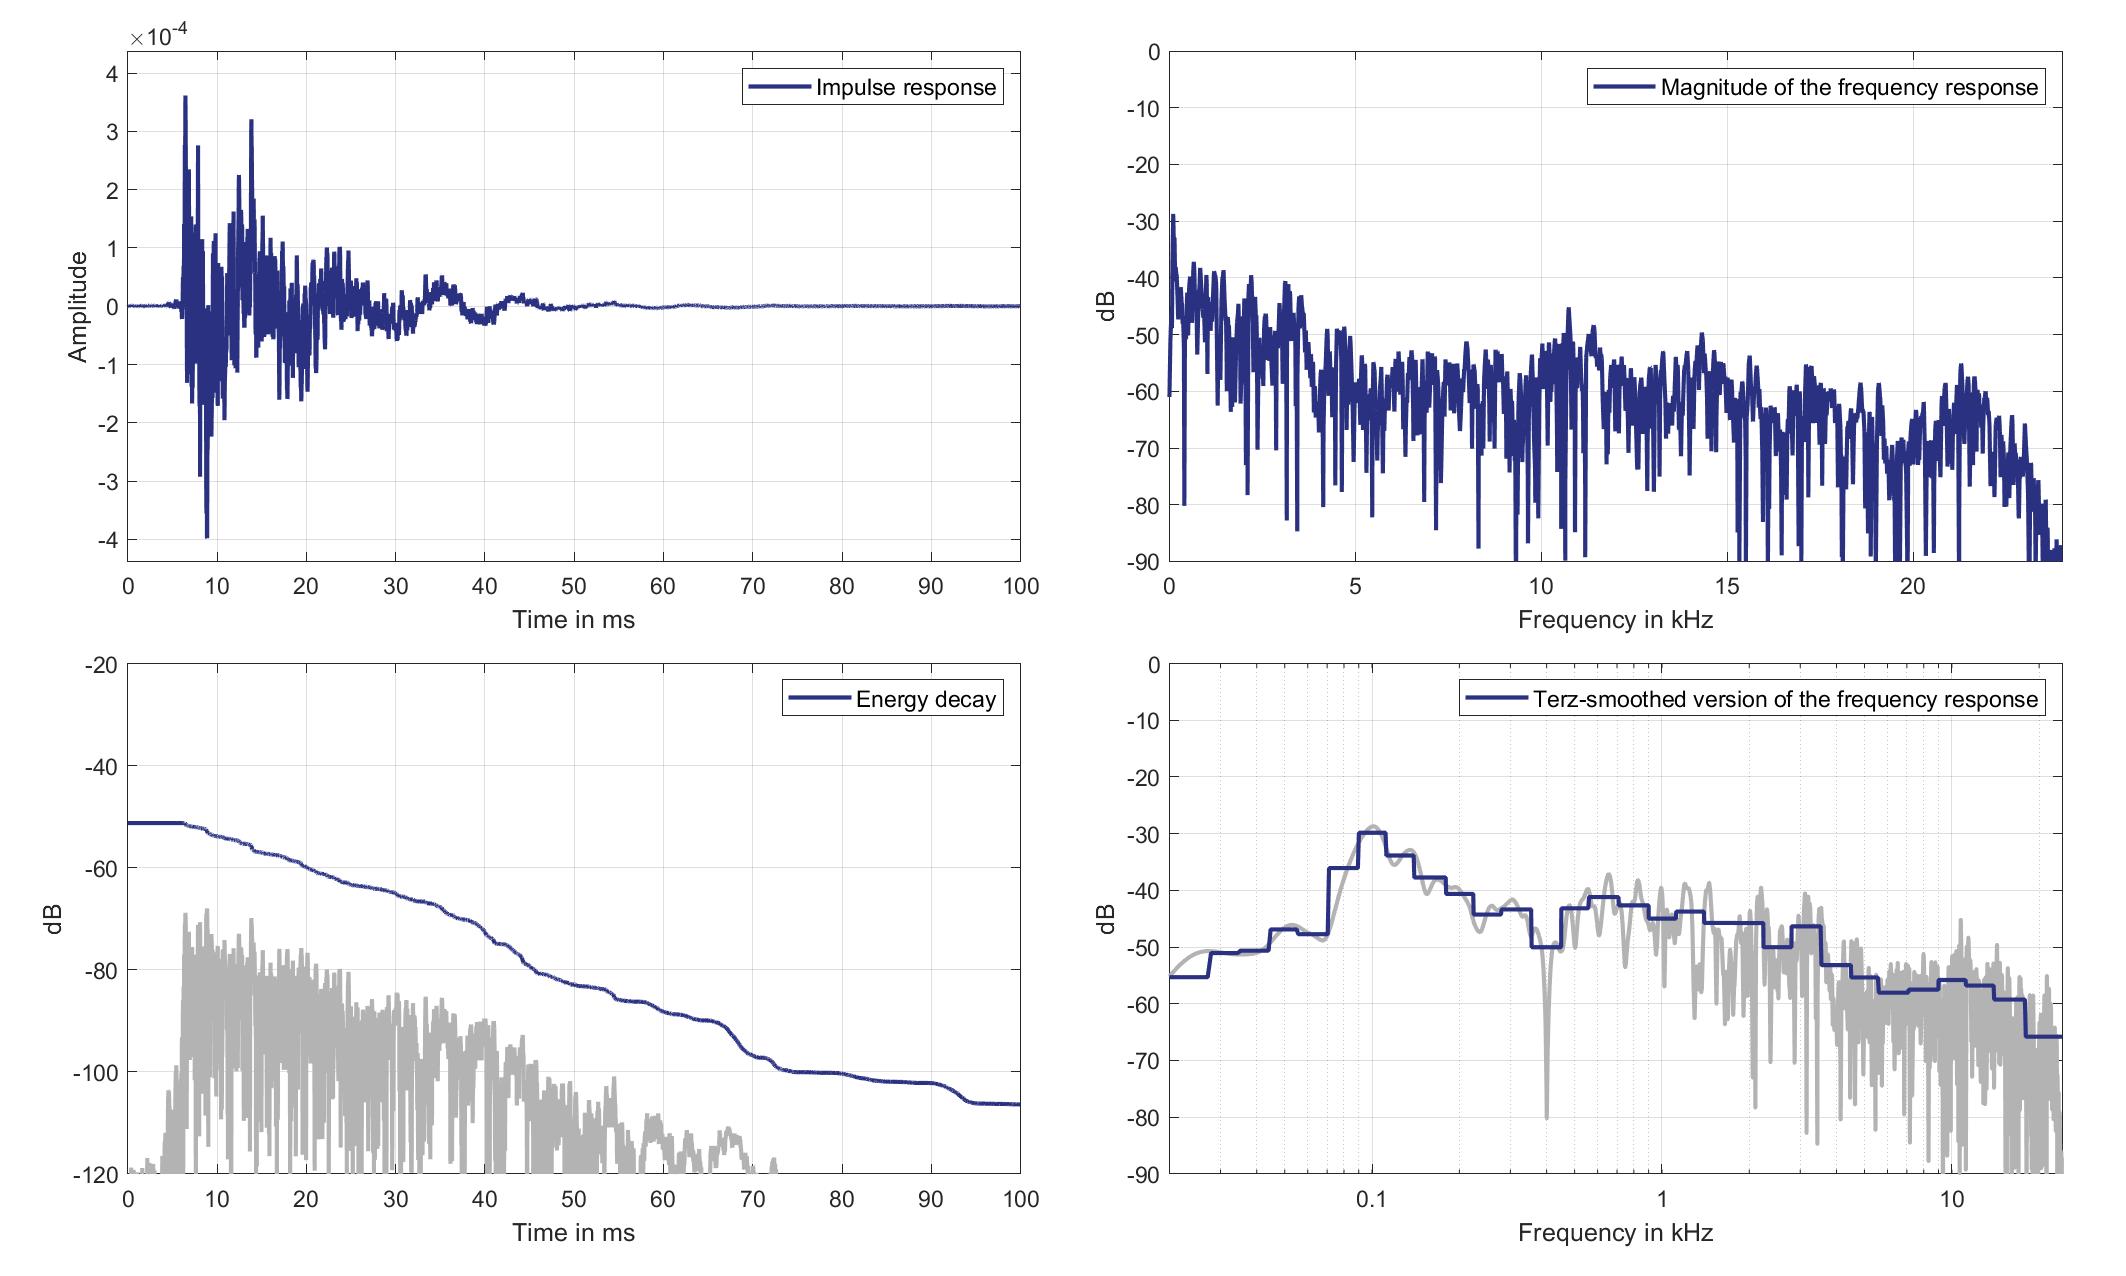
Download impulse response (in ".fir" format).
In the download section you can download all impulse response files as well as format explanation and Matlab as well as Python code examples for loading fir files.
Right Ear Microphone
Standard Car Loudspeaker 3 (Lsp. 21) to Right Ear Microphone of Zone 5 (Mic. 26)
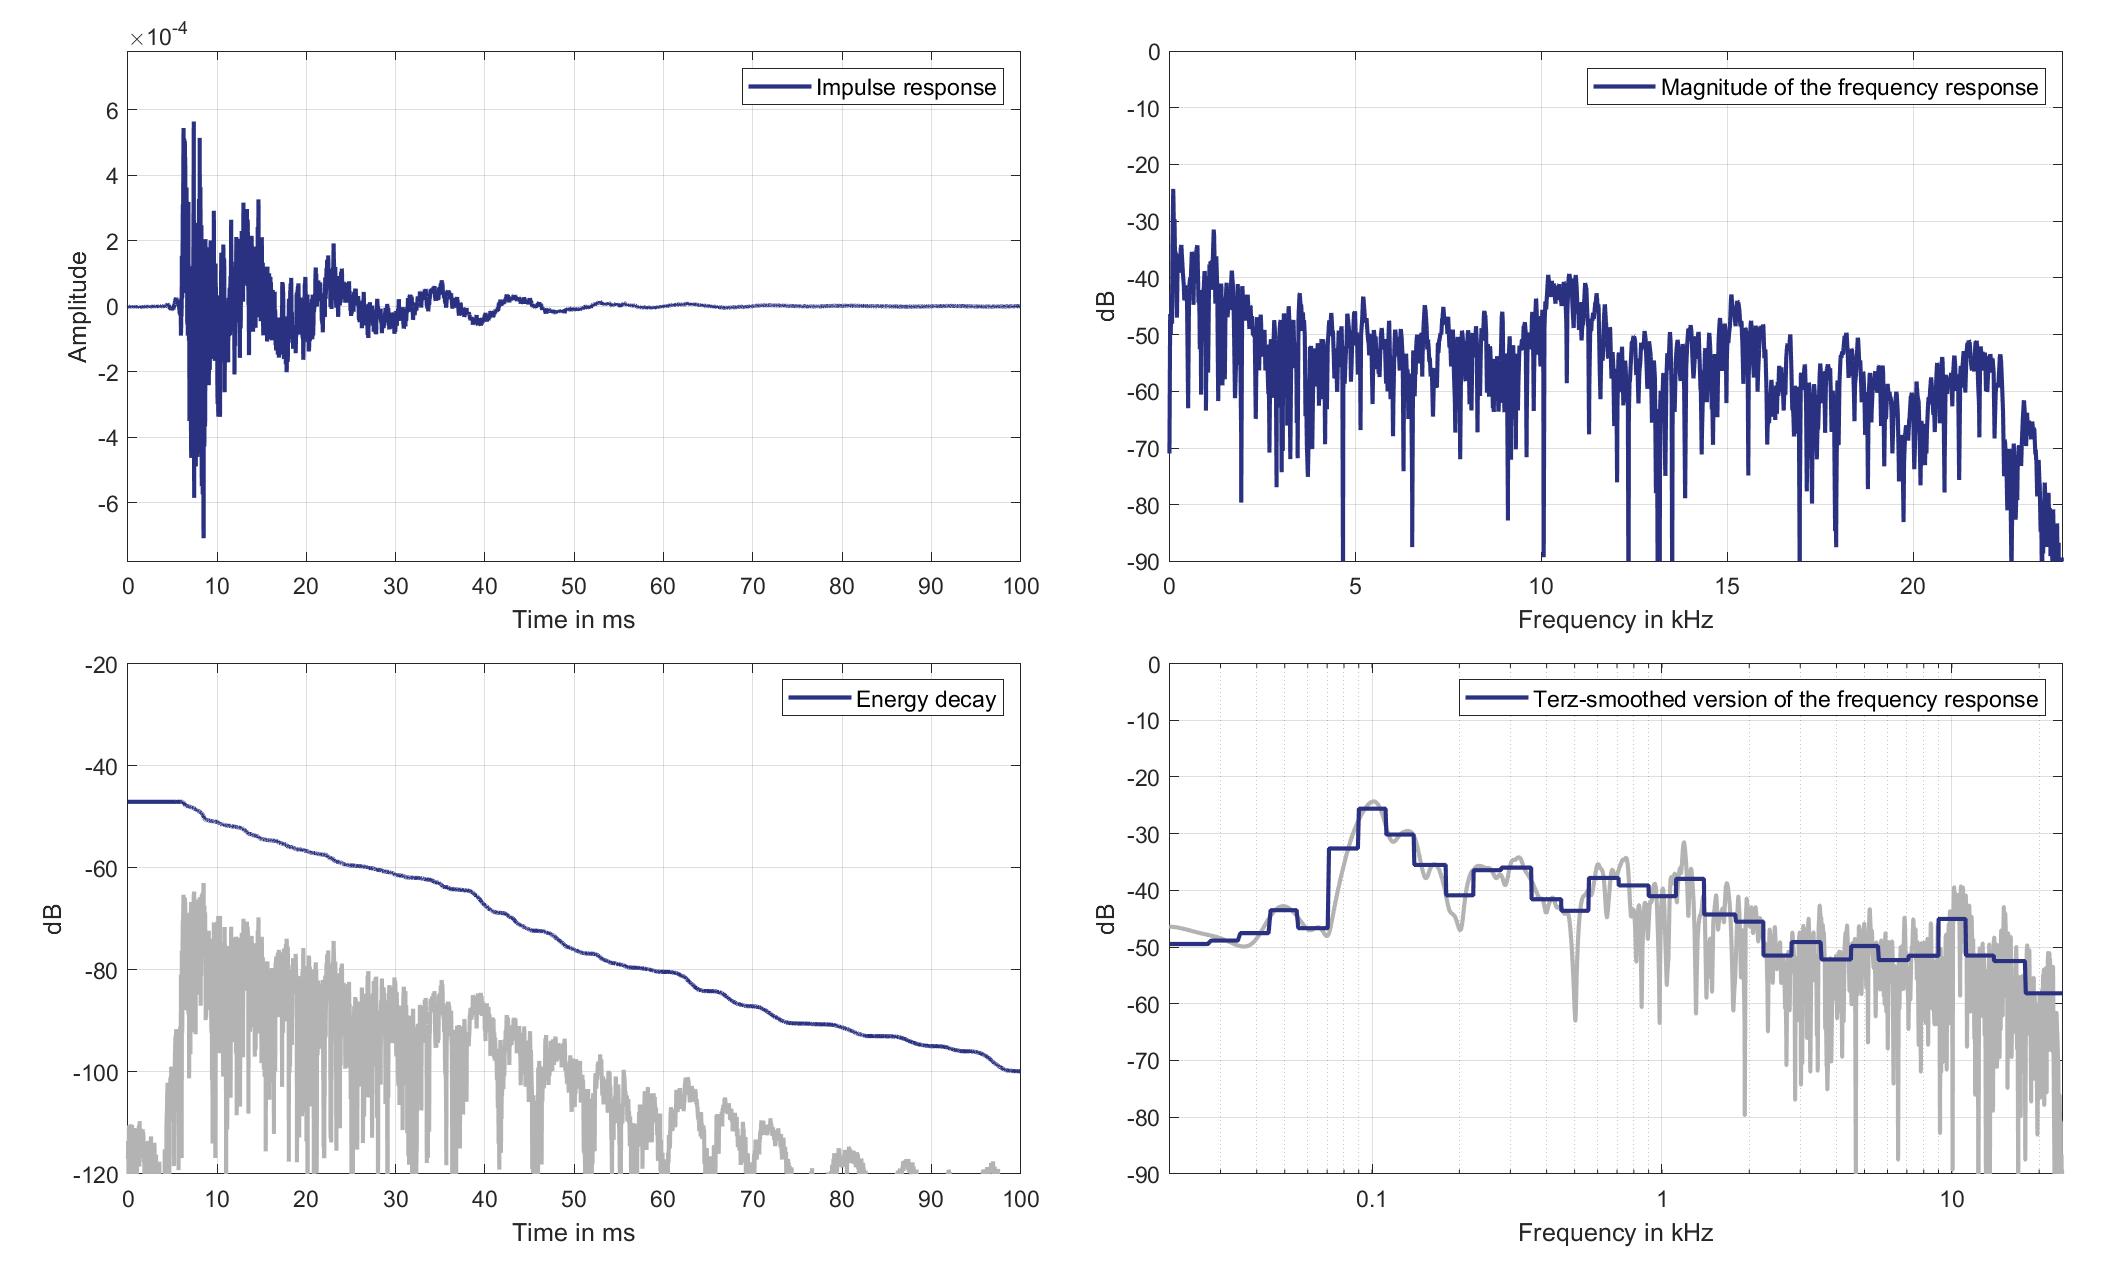
Download impulse response (in ".fir" format).
In the download section you can download all impulse response files as well as format explanation and Matlab as well as Python code examples for loading fir files.
Mics. 27/28
Left Ear Microphone
Standard Car Loudspeaker 3 (Lsp. 21) to Left Ear Microphone of Zone 6 (Mic. 27)
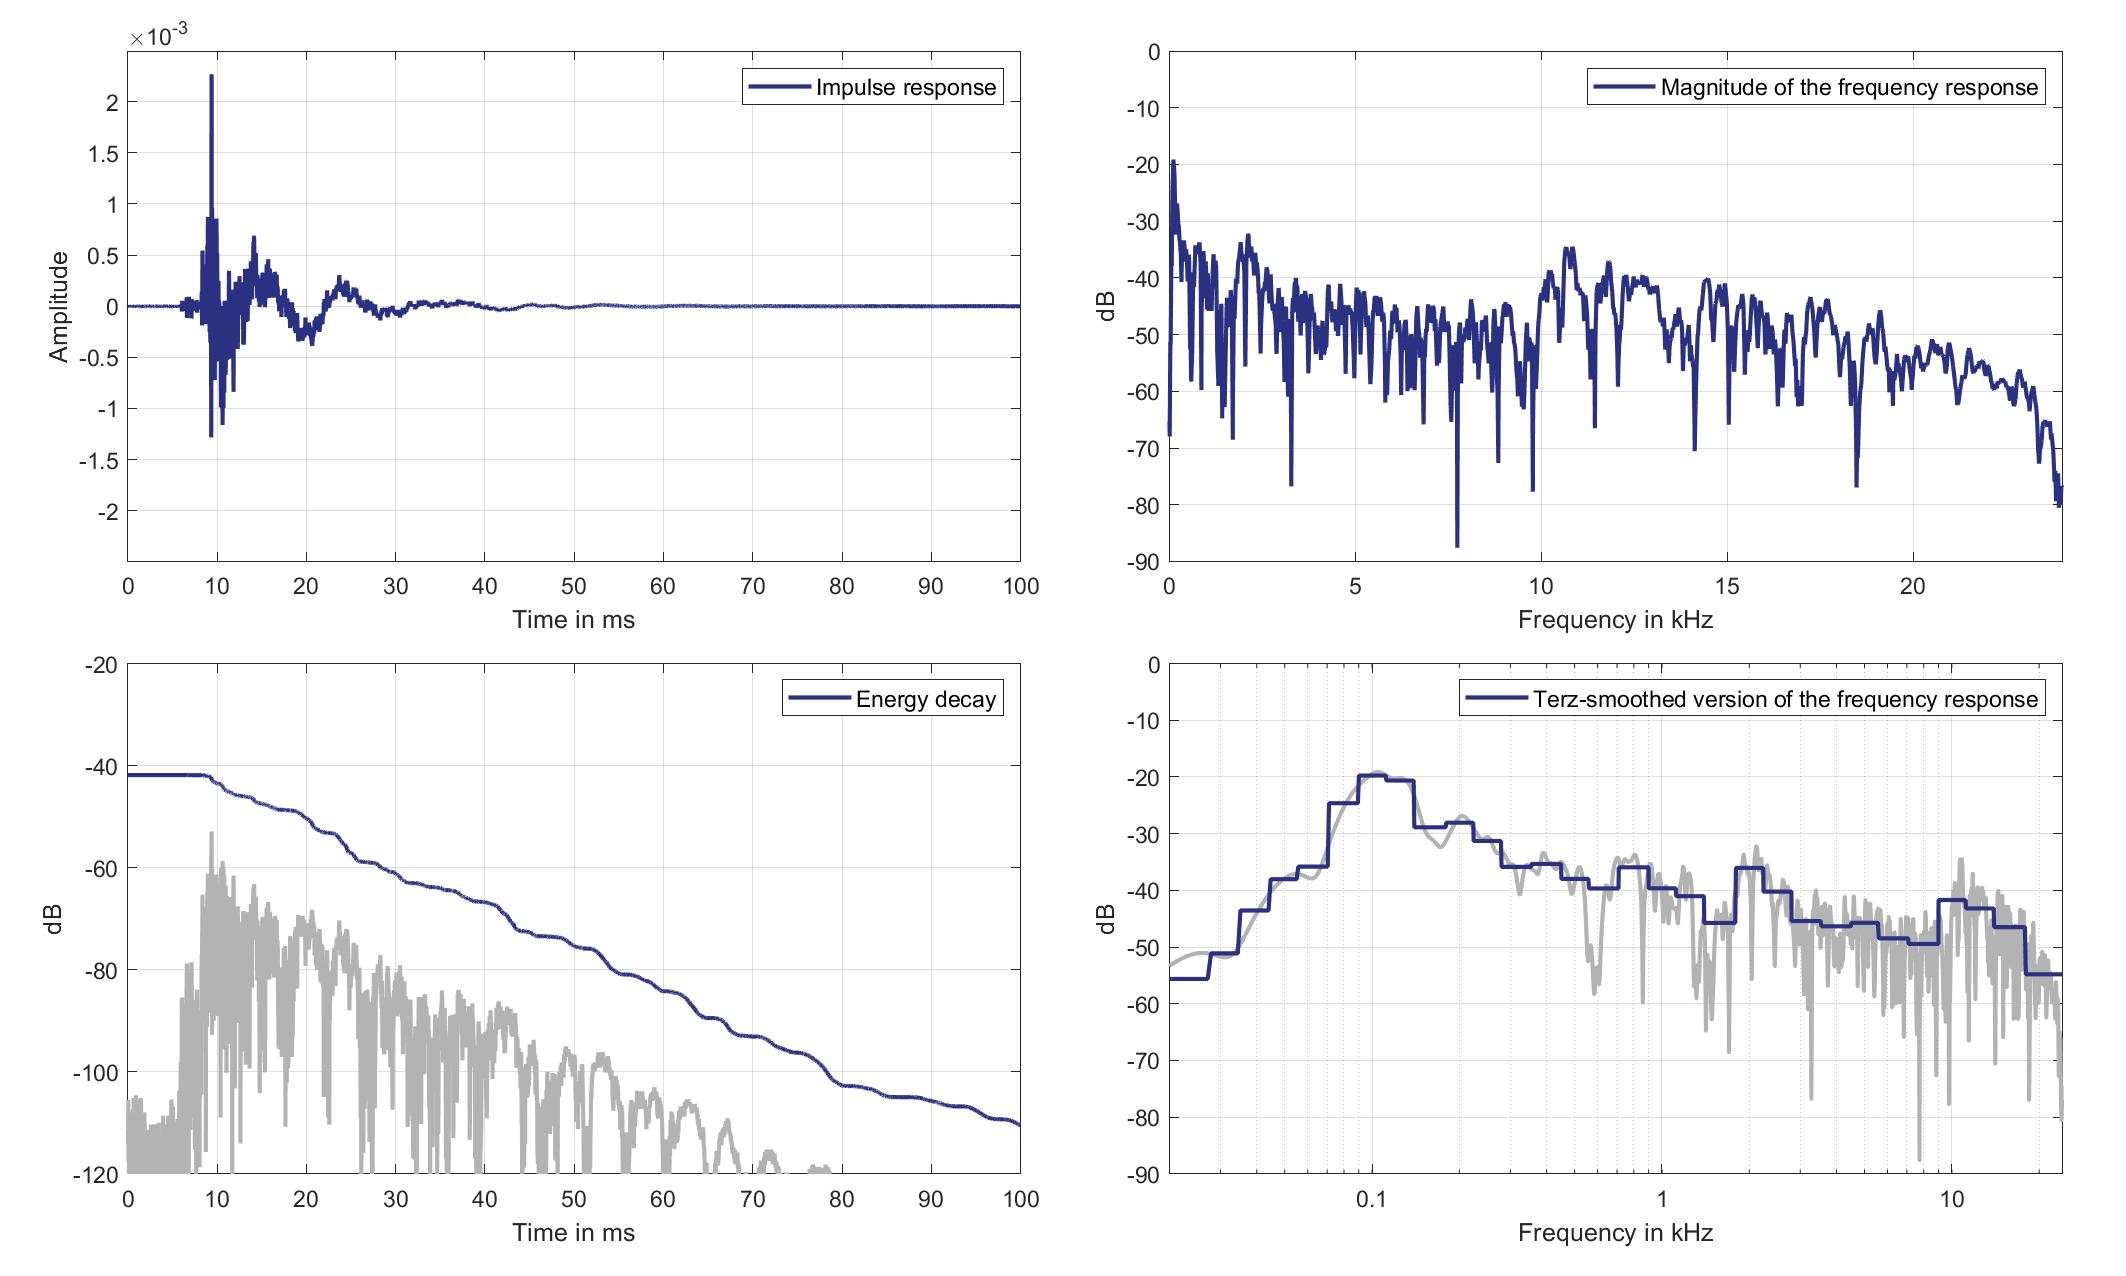
Download impulse response (in ".fir" format).
In the download section you can download all impulse response files as well as format explanation and Matlab as well as Python code examples for loading fir files.
Right Ear Microphone
Standard Car Loudspeaker 3 (Lsp. 21) to Right Ear Microphone of Zone 6 (Mic. 28)
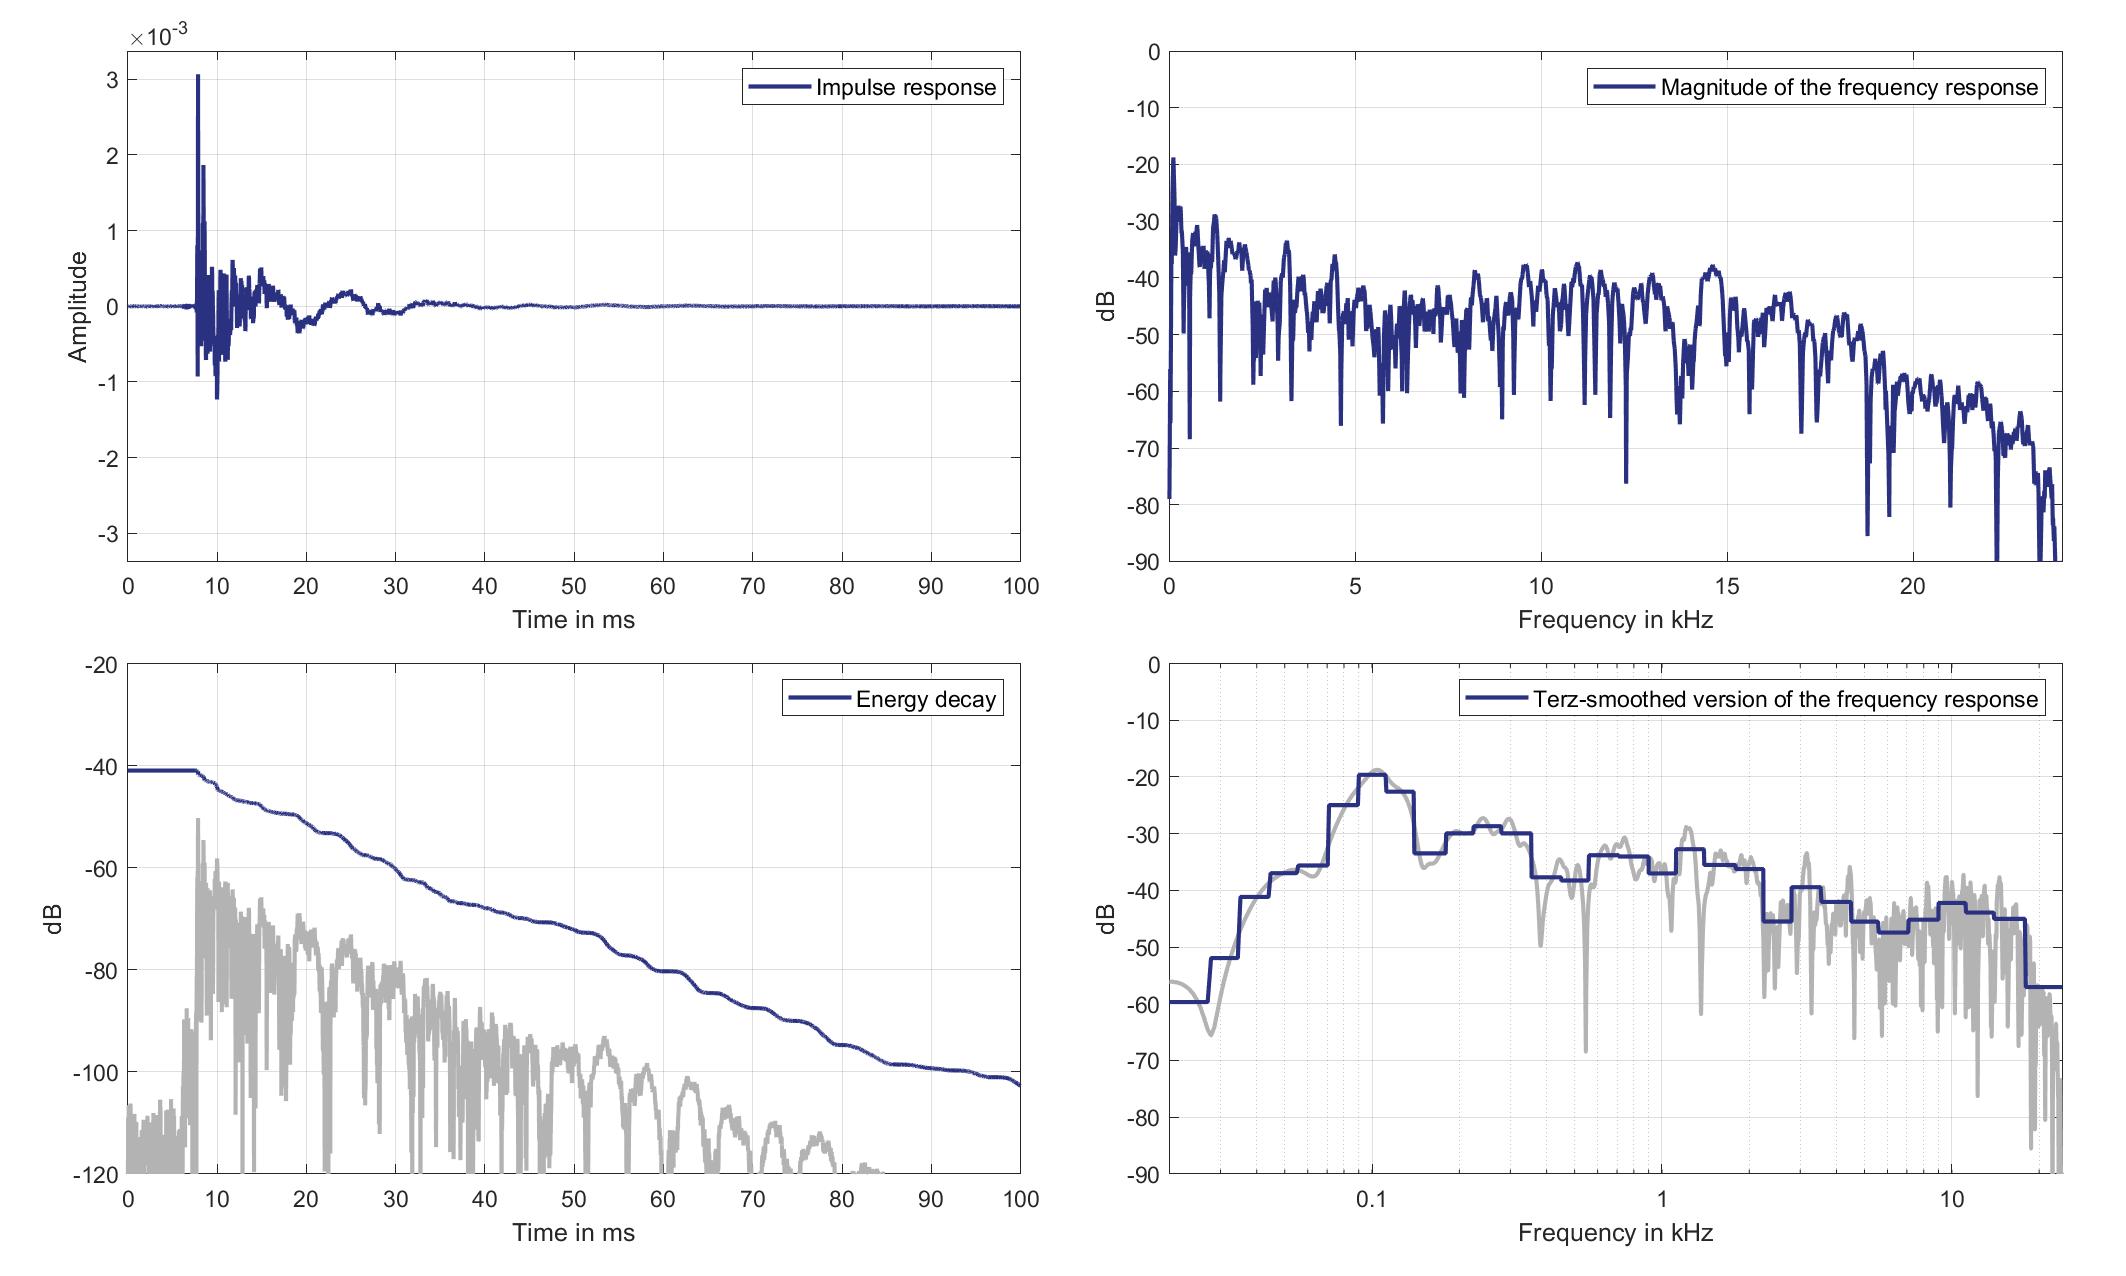
Download impulse response (in ".fir" format).
In the download section you can download all impulse response files as well as format explanation and Matlab as well as Python code examples for loading fir files.
Mics. 29/30
Left Ear Microphone
Standard Car Loudspeaker 3 (Lsp. 21) to Left Ear Microphone of Zone 8 (Mic. 29)
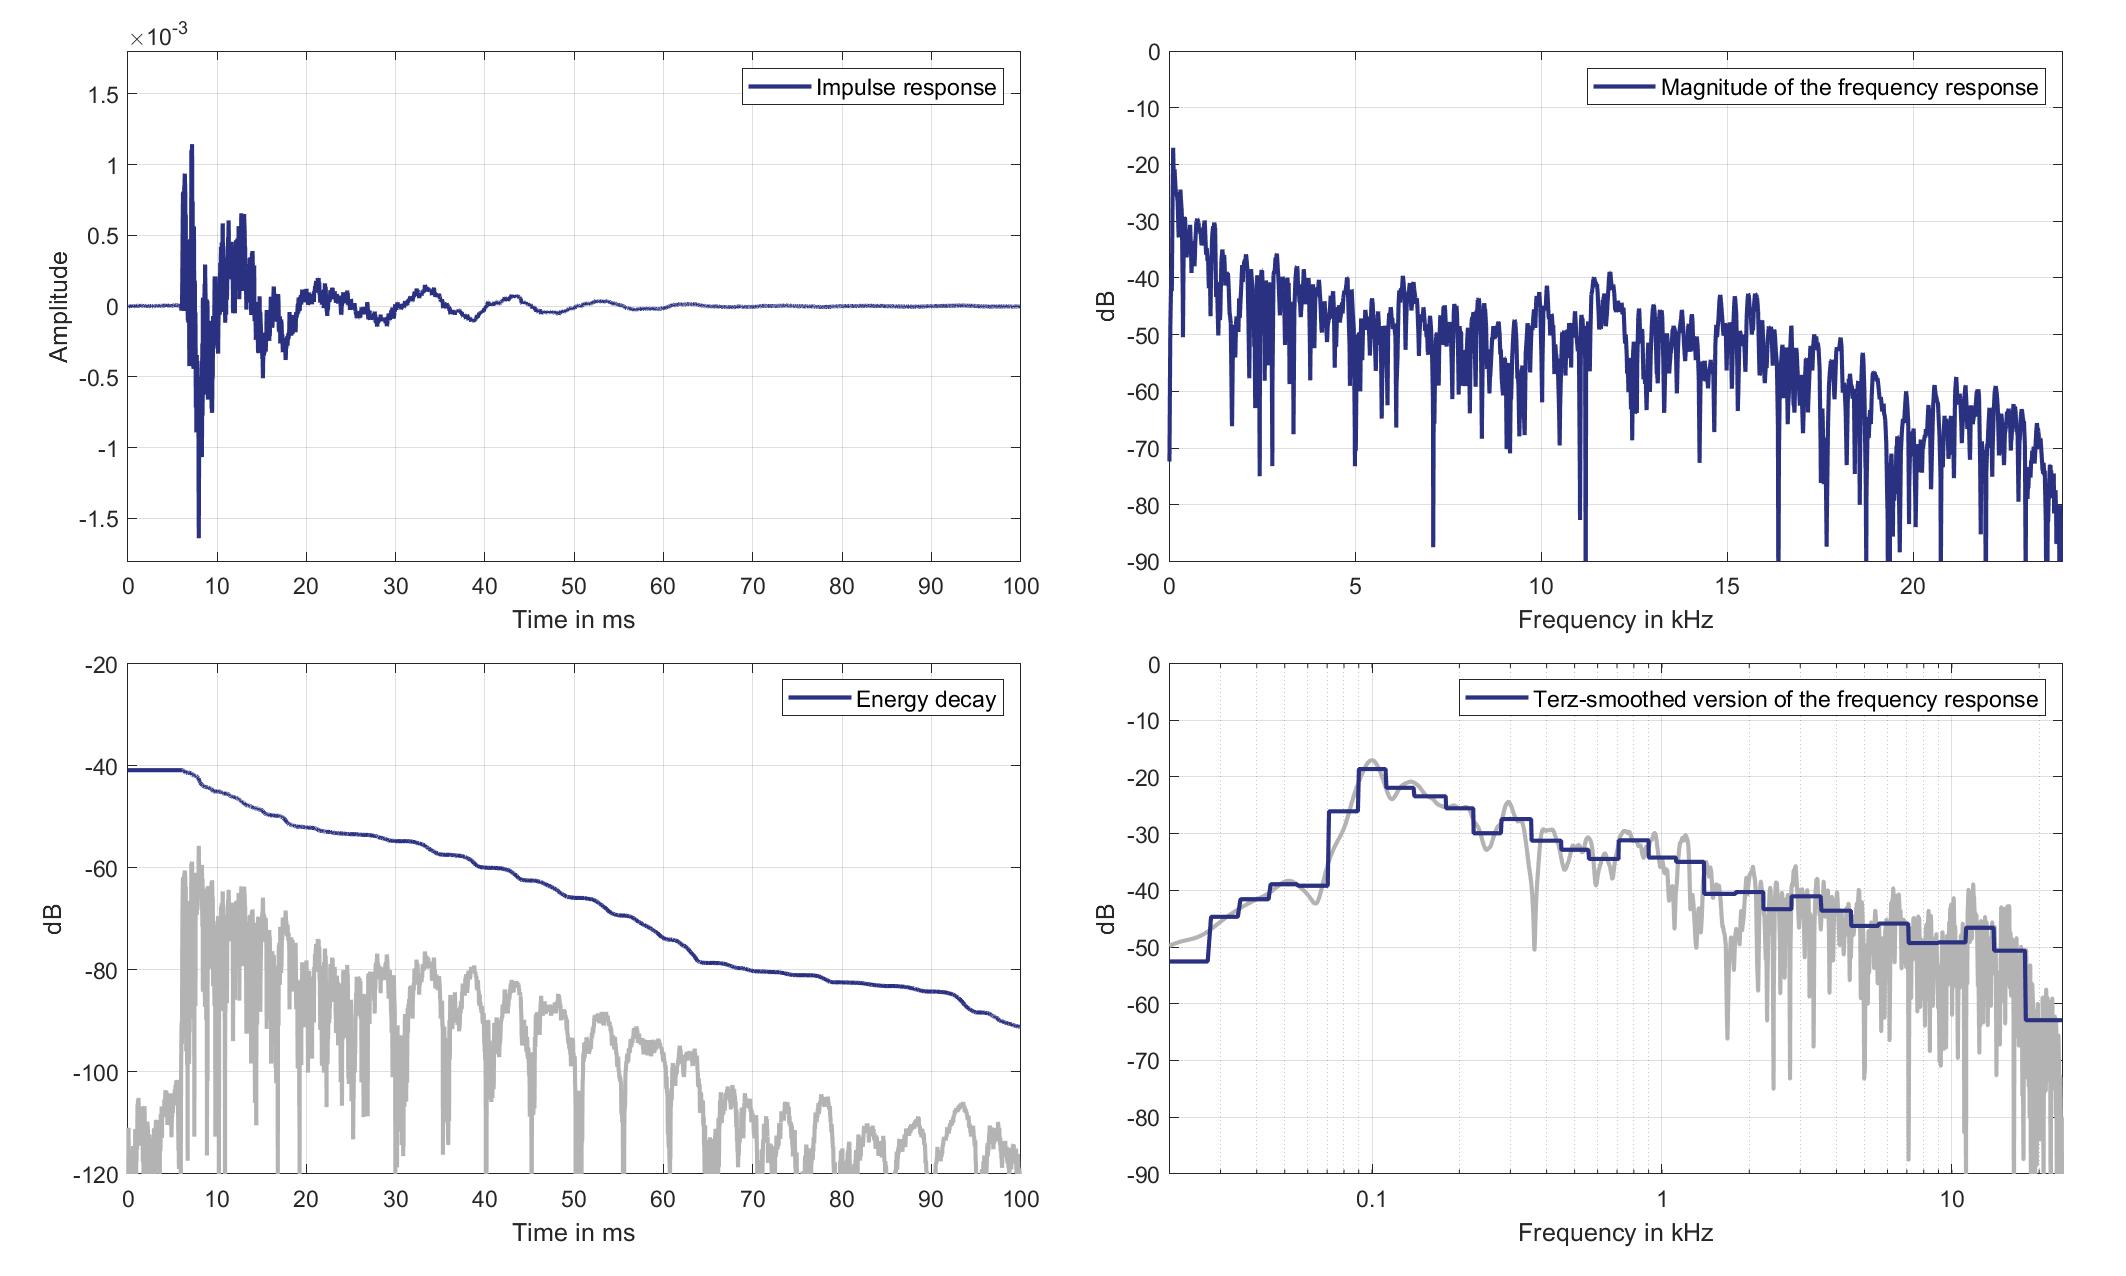
Download impulse response (in ".fir" format).
In the download section you can download all impulse response files as well as format explanation and Matlab as well as Python code examples for loading fir files.
Right Ear Microphone
Standard Car Loudspeaker 3 (Lsp. 21) to Right Ear Microphone of Zone 8 (Mic. 30)
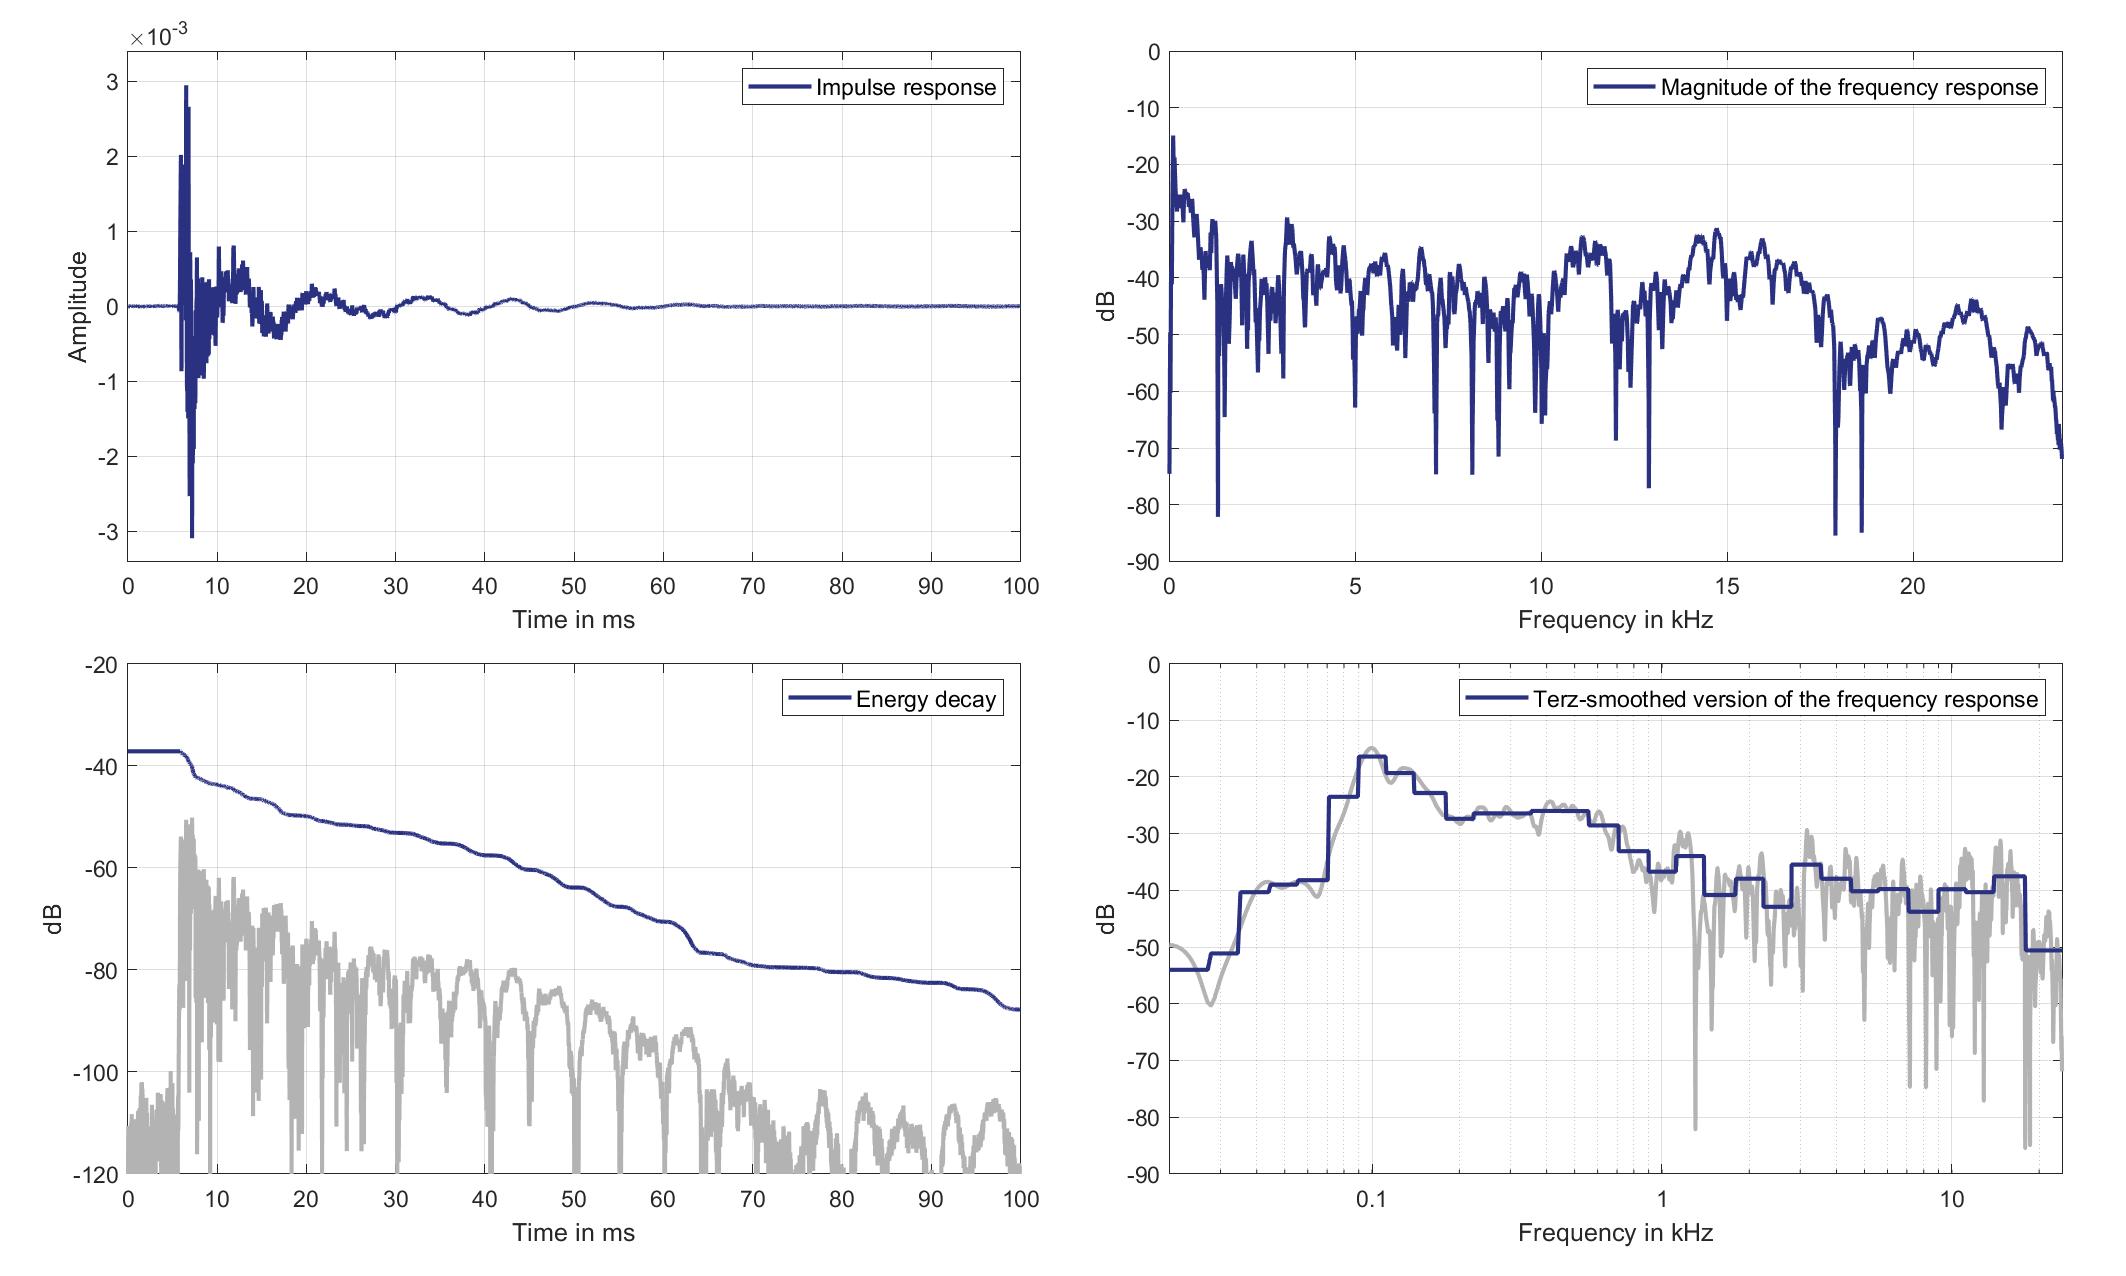
Download impulse response (in ".fir" format).
In the download section you can download all impulse response files as well as format explanation and Matlab as well as Python code examples for loading fir files.
 In March 2026, the DSS Chair attended the annual DAGA conference in Dresden. Thanks to the support of the GaS-Club, the student Aylin Kösker was given the opportunity to accompany the chair and participate in the conference from March 23rd to March 26th. As part of the daily poster sessions, she presented the results of her bachelor’s thesis “Machine Learning for the Analysis of Hydrographic Data to Assess the Waterside Accessibility of Port Waters” in the field of Underwater Acoustics. The thesis forms an important basis for an ongoing university research project on the acoustic analysis of sediment properties in harbor areas. The poster session enabled valuable discussions with researchers and conference participants from related research fields.